
 Submit a Paper
 Propose a Special lssue
 Open Access
ARTICLE

Robust Machine Learning Technique to Classify COVID-19 Using Fusion of Texture and Vesselness of X-Ray Images
1 Department of Electronics and Communication Engineering, N.B.K.R. Institute of Science & Technology, Vidyanagar, Andhra Pradesh, 524413, India
2 Department of Teleinformatics Engineering, Federal University of Ceará, Fortaleza, 60455-970, Brazil
3 Information Technology Department, College of Computer and Information Sciences, Princess Nourah bint Abdulrahman University, Riyadh, 84428, Saudi Arabia
4 Department of Mathematics, Faculty of Science, Zagazig University, Zagazig, 44519, Egypt
5 Faculty of Computer Science and Engineering, Galala University, Suez, 435611, Egypt
6 Artificial Intelligence Research Center (AIRC), College of Engineering and Information Technology, Ajman University, Ajman, United Arab Emirates
7 Department of Electrical and Computer Engineering, Lebanese American University, Byblos, 13-5053, Lebanon
8 Department of Avionics, Indian Institute of Space Science and Technology, Thiruvananthapuram, Kerala, 695547, India
9 Department of Veterinary Clinical Sciences, University of Minnesota, St. Paul, Minnesota, 55108, USA
* Corresponding Authors: Shaik Mahaboob Basha. Email: ; Samia Allaoua Chelloug. Email:
(This article belongs to the Special Issue: Intelligent Biomedical Image Processing and Computer Vision)
Computer Modeling in Engineering & Sciences 2024, 138(2), 1981-2004. https://doi.org/10.32604/cmes.2023.031425
Received 16 June 2023; Accepted 21 July 2023; Issue published 17 November 2023
 View Full Text
 Download PDF
Abstract
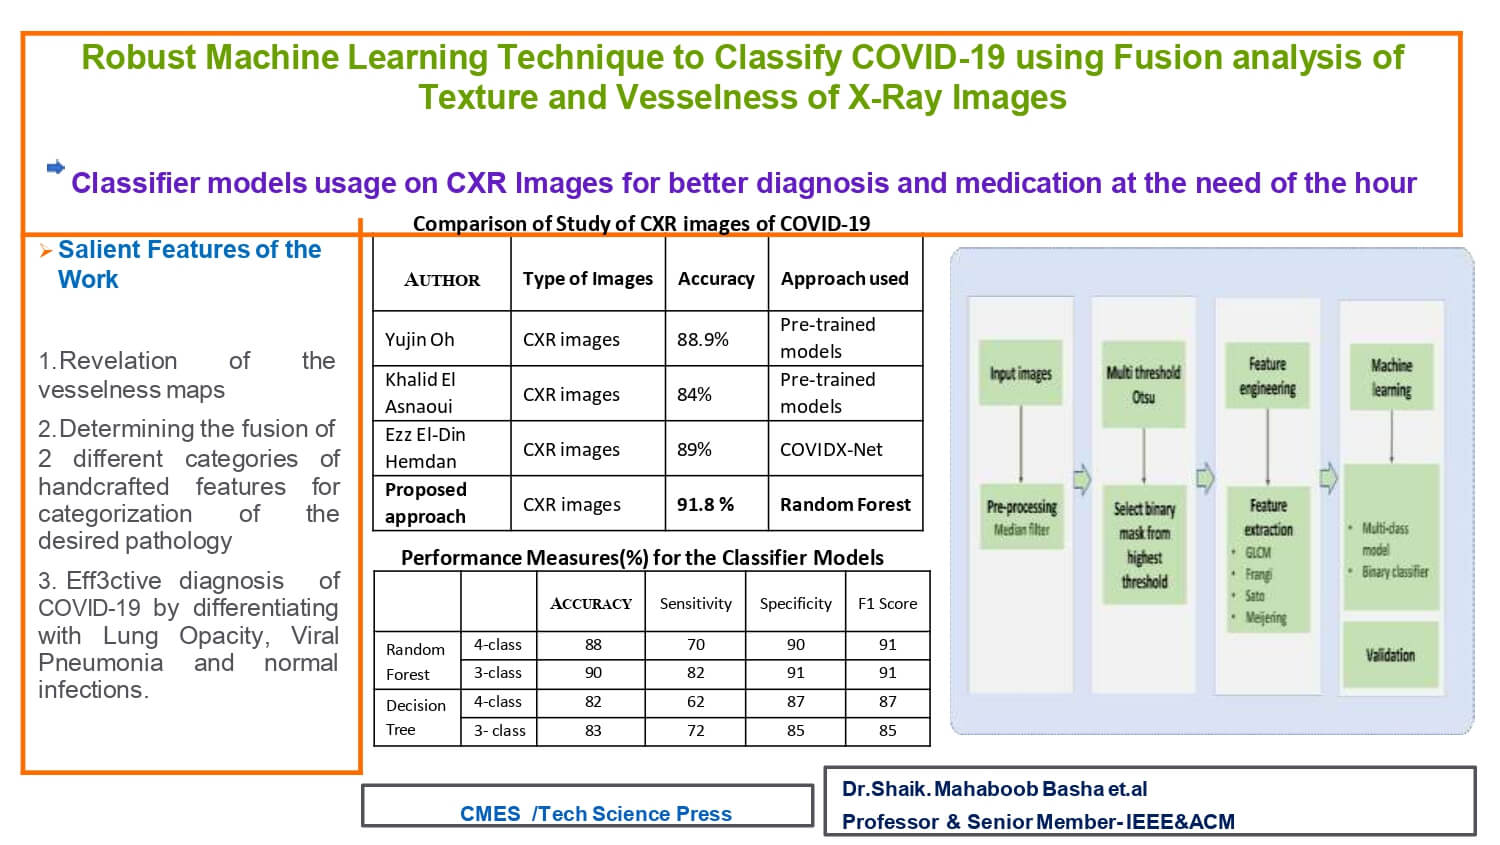
Manual investigation of chest radiography (CXR) images by physicians is crucial for effective decision-making in COVID-19 diagnosis. However, the high demand during the pandemic necessitates auxiliary help through image analysis and machine learning techniques. This study presents a multi-threshold-based segmentation technique to probe high pixel intensity regions in CXR images of various pathologies, including normal cases. Texture information is extracted using gray co-occurrence matrix (GLCM)-based features, while vessel-like features are obtained using Frangi, Sato, and Meijering filters. Machine learning models employing Decision Tree (DT) and Random Forest (RF) approaches are designed to categorize CXR images into common lung infections, lung opacity (LO), COVID-19, and viral pneumonia (VP). The results demonstrate that the fusion of texture and vessel-based features provides an effective ML model for aiding diagnosis. The ML model validation using performance measures, including an accuracy of approximately 91.8% with an RF-based classifier, supports the usefulness of the feature set and classifier model in categorizing the four different pathologies. Furthermore, the study investigates the importance of the devised features in identifying the underlying pathology and incorporates histogram-based analysis. This analysis reveals varying natural pixel distributions in CXR images belonging to the normal, COVID-19, LO, and VP groups, motivating the incorporation of additional features such as mean, standard deviation, skewness, and percentile based on the filtered images. Notably, the study achieves a considerable improvement in categorizing COVID-19 from LO, with a true positive rate of 97%, further substantiating the effectiveness of the methodology implemented.Graphic Abstract
Keywords
One of the deadliest pandemics in the form of Coronavirus infectivity (COVID-19) has stretched across the globe and created the largest havoc for people and the healthcare system globally [1–3]. The very nature of COVID-19 infection penetrates the respiratory system and simultaneously leads to certain cases like organ dysfunction caused by fatality. The use of CXR as a screening method, thereby assisting in diagnosis, is relatively cost-effective [4–8]. In particular, CXR have been proven to be helpful for monitoring prognosis [6,7]. CXR-based image intensity and morphology-based characteristic features are helpful for physicians and radiologists in the diagnosis of various lung-related abnormalities, lung opacity (LO), COVID-19, and viral pneumonia (VP) along with normal categories [4,9].
The lower zones with bilateral involvement, spread across peripheral, consolidation and ground glass opacity are various CXR image-based features related to pneumonia-related COVID-19 [7,8]. CXR-based investigations are also helpful in scheduling the treatment precedence of patients and the use of various Artificial Intelligence (AI) techniques [10–12]. Hence, several studies have been conducted on intensity-based feature extraction to capture image-based characteristics. Morphology, texture, transformation, and histogram-based features have been used for feature extraction [13–16]. Texture-based feature extraction and radiomics-based feature maps in conjunction with machine learning (ML) techniques have been explored to aid in the identification of subtle variations in images originating from various modalities, including computed tomography (CT), radiography, magnetic resonance imaging (MRI), and ultrasound [17–25]. Image processing stages such as the pre-processing and segmentation of lesions are required for well-organized strategies to define the organ or tissue of interest [24].
To extract image-based features, several image-processing stages need to be explored, such as pre-processing to improve the visibility of intended regions, segmentation of the region of interest (ROI), and obtaining features in different domains [26–33]. ML-based image analysis pipelines have been rigorously investigated to enhance the diagnosis of breast cancer and brain tumor detection [34–38]. The expansion of deep learning (DL)-based tools and studies have further increased the utility of artificial intelligence in biomedical informatics, along with CXR analysis [39–43]. In particular, Alex Net-based DL-based categorization of normal CXR from other abnormalities, including COVID-19, has been carried out [43,44]. Traditional approaches to feature extraction with transforms and texture-based computations using ML-based models have recently been explored and implemented in CXR image-based screening for COVID-19 [16,20]. Several approaches have been developed and explored extensively, such as the feature extraction of images based on transform, texture, and key point-based methods. Furthermore, several texture-based feature extraction techniques have been used, such as Gabor filter-based texture extraction, fractal based techniques, Laws texture computation, and grey co-occurrence matrix-based computations [28,30]. In brief, texture reveals information on how regularly intensity patterns are repeated in an image observed experimentally. Texture may present features similar to the intrinsic pixel arrangement of the image, which may be helpful in the analysis [34]. Texture-based implementations have been found to be useful in content-based image retrieval, object recognition, segmentation, various image processing applications, multimedia images, remote sensing, and medical imaging [35,45].
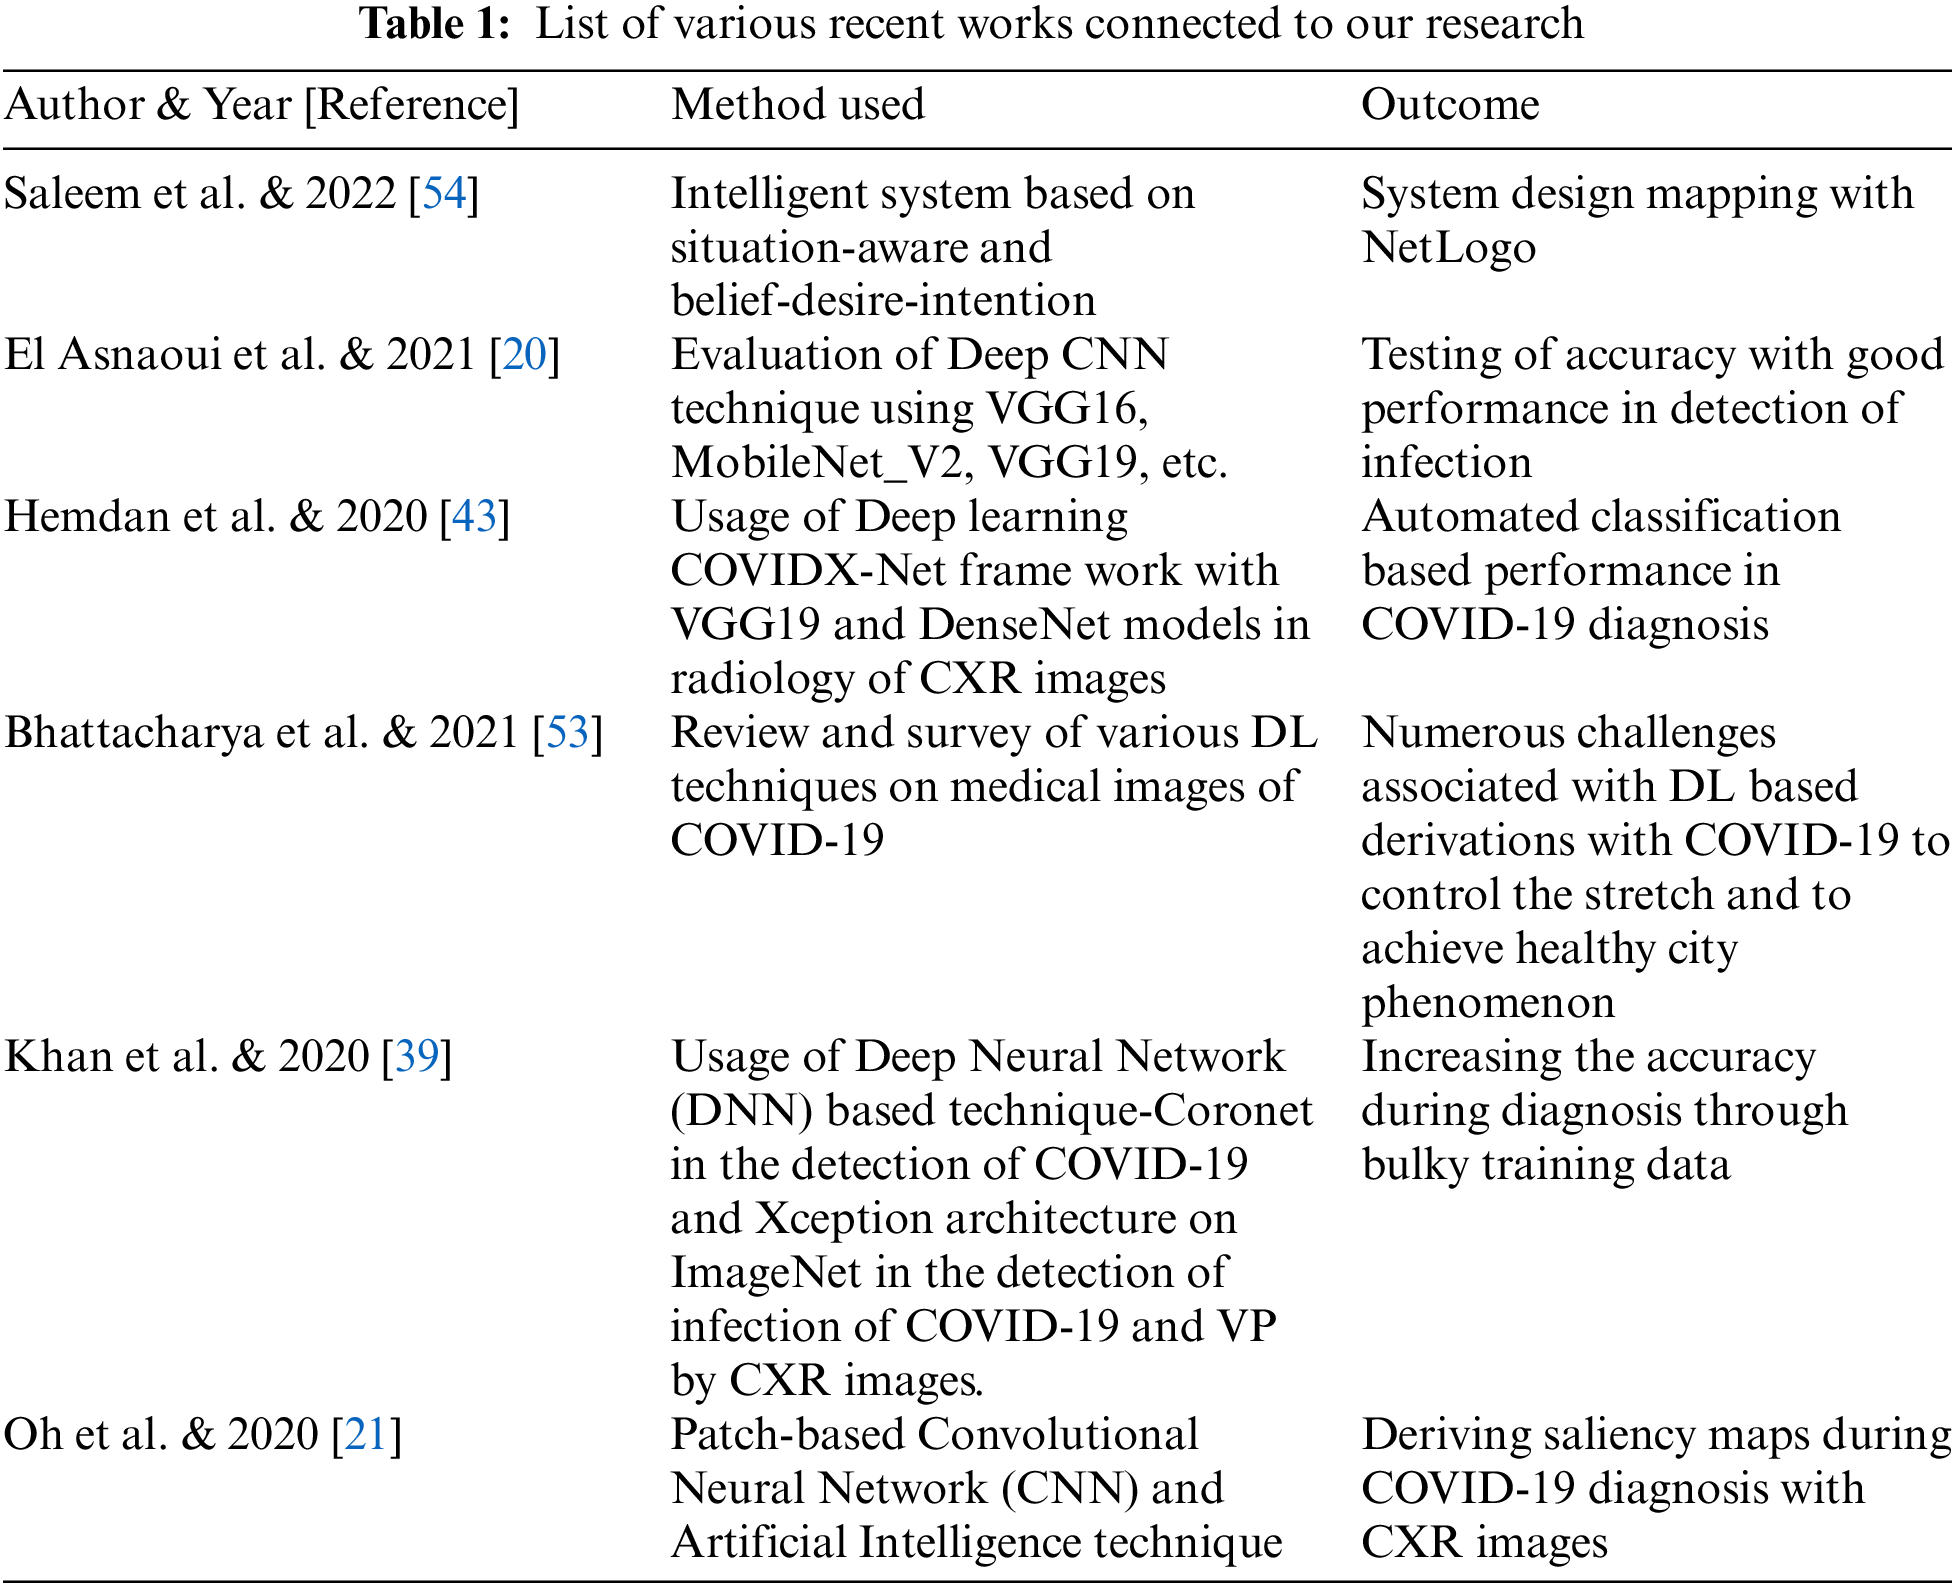
Texture information associated with pixel intensity plays a vital role in the visual recognition of patterns in a particular image, and the shear capacity of the human visual recognition organism to sense this stimulus is a significant expertise to work together with the adjacent situation [34]. The extensive literature review conducted in this study is presented in Table 1.
Vesselness maps created using vesselness-extracting filters are popular for images of tubular and vessel-like structures [46–48]. Popular and existing approaches in this paradigm depend on computing the second derivatives of images, thereby approximating the local curvature information [49–52]. The earliest and most widely known studies were by Frangi et al. [46] and Sato et al. [47]. The large amount popular techniques in vessel filtering anticipate on degree of difference in sequence, and in meticulous the second derivatives of the angiographic images. Indeed, due to the contrast and geometric property of the vessels, it is generally assumed that the observation of the local curvatures via the Hessian matrix analysis can allow for the determination of the position and orientation of the putative vascular structures [46,47].
Their definition of vesselness was based on eigenvalue information in the scale-space domain. Meijering et al. [48] developed a neuriteness function that could detect long and thin tubular structures in fluorescence microscopy images. In this work, we attempt to fuse the three maps obtained using vesselness detection techniques from the above-mentioned studies with GLCM features to extract any plausible diagnostically relevant information from the CXR images that could differentiate lung related abnormalities. Some studies on ML and image analysis are as follows:
Dourado et al. studied three medical databases that classified stroke types using melanocytic and malignant lesions and image datasets of lung nodules, skin, and cerebral vascular accidents [37]. Liver diagnosis was performed using ultrasound images as proposed by Krishnamurthy et al. [38]. COVID-19 was detected using CXR images by the transfer learning approach as proposed by Ohata et al. [44]. Hasoon et al. used pre-processing, image thresholding, and morphological operations to categorize COVID-19 using ML techniques [40]. Deep learning-based categorization of COVID-19. Bhattacharya et al. implemented [53]. Saleem et al. derived an approach using Situation-aware BDI Reasoning for the early finding of the symptoms of COVID-19 using a smart watch [54].
Influence of pre-processing and utility of threshold and level set-based segmentation along with texture and key point analysis using fluorescence-based microscopic images and infrared-based thermograms in two separate studies [55–58]. Laplace Beltrami (LB) eigenvalue features are used to execute shape detection with MRI of the images discussed [59]. Basha et al. used a structure-preserving denoising technique using WNNM for ultrasound images [60,61]. Compression models are essential for efficiently retrieving data and for transmission to satisfy the requirements of multimedia applications [62,63]. Early discovery of retinopathy due to diabetes by Thippa et al. employed a Deep Learning model based on the PCA-Firefly process [64,65]. Recent studies have utilized radiomics analysis and ML techniques to generate probability maps and radiomics-based feature maps to extract diagnostic information from MRI-based brain tumor images [66]. Statistical analysis of the features of an image was performed using machine learning (ML) models [67]. A fragile logo is implanted into the cover images to facilitate early tamper detection [68].
Subsequent to a near-exhaustive literature survey, we devised an approach to fuse the texture and vesselness features along with the aid of the ML approach to devise an ample strategy to differentiate normal, LO, COVD-19, and VP using CXR images. The salient feature of this study is the fusion of the features contained in the threshold region.
The major outcomes of our research are as follows:
• Revelation of the vesselness maps.
• Determining the fusion of two different categories of handcrafted features for categorization of the desired pathology.
The paper is organized as follows. Section 1 describes the introductory information of the proposed work. A comprehensive literature survey is presented in Section 2, which includes a review of existing techniques in categorizing COVID-19 with several types of medical images. The methodology of the proposed work is explained in detail in Section 3. The results obtained are incorporated in Section 4. Extensive discussions and analysis are framed as Section 5 with comparison through performance measures. Conclusions and future scope are incorporated in Section 6.
3.1 Segmentation Based Approach
The pipeline used in this study is shown in Fig. 1. CXR images consisting of normal, lung opacity, viral pneumonia and COVID-19 images were obtained from the Kaggle repository [2,3]. The dataset consists of 10,192 normal CXR images, 3617 images of COVID-19, 1345 images of VP, and 6011 images of LO. The purpose of this study was to extract and test the veracity of combining GLCM-based texture features with vessel-detecting feature techniques to decipher normal CXR from different lung-related pathologies, namely COVID-29, LO, and VP, using the ML model. Simultaneously, the same features were used to design 3-class classifier model for categorizing the three pathological conditions. Further, the binary classifiers were designed to categorize COVID-19 based on the LO and VP. The input images were first subjected to pre-processing by converting the images to a gray scale, followed by a median filter with a mask of 3 × 3. The median filter was chosen such that the edge-related details were preserved. The images were subjected to multi-threshold segmentation using the Otsu method to obtain three binary masks from the motivation derived from the work carried out [69] primarily due to fewer approaches available in the literature to precisely delineate the diseased region. Hence, this segmentation based approach is utilized here in order to investigate the veracity of the vesselness feature to categorize COVID-19 from other conditions.
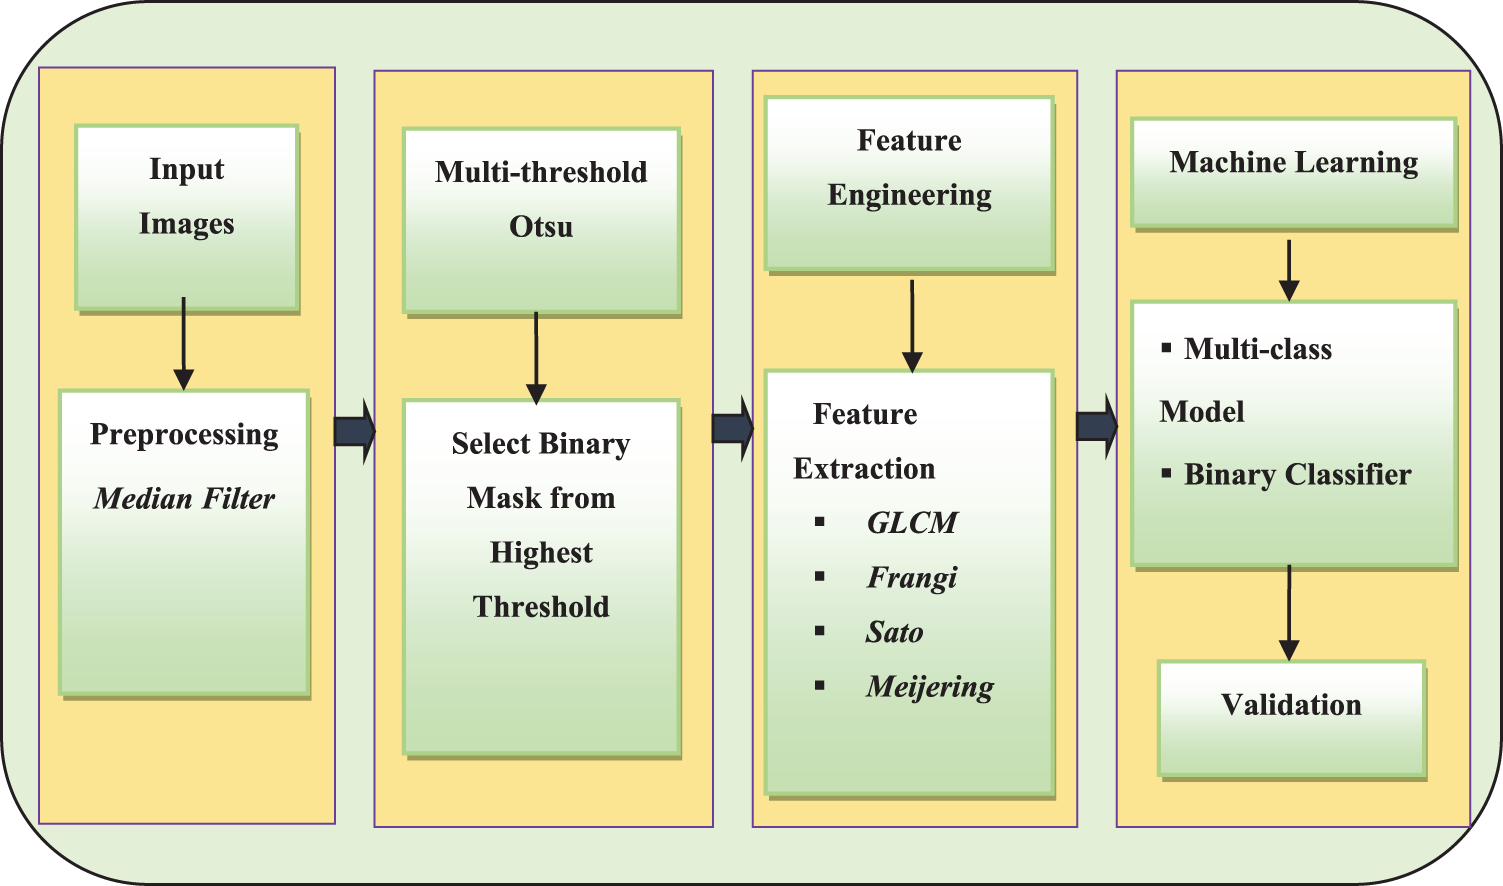
Figure 1: The block diagram representation of the pipeline implemented to extract and fuse texture and vesselness features from CXR images and thereby building the machine learning model
3.2 Extraction of Textures and Vessel-Like Features
The second stage is [26]. Among the three segmented masks, one mask that depicted the highest mean intensity from the input image was chosen. The selected mask was considered the region of interest (ROI) to extract the texture and vessel-like features. In particular, GLCM-based features, namely homogeneity, energy, correlation, dissimilarity, and entropy, were extracted. The GLCM features were extracted with a pixel distance of 1 and an orientation of 0, which is the default method of extraction. The GLCM feature extraction mechanism employs the first computation of a two-dimensional probability matrix from the neighbourhood of image pixels, called the gray-level co-occurrence matrix. Using this matrix, the above-mentioned five features were computed, which depict peculiar pixel intensity relations. In the case of vessel-like features, Frangi, Sato, and Meijering-based vessel features were extracted, from which the mean, standard deviation, median, skewness, kurtosis, 95th, 90th, 5th and 10th percentiles were computed. Altogether, 30 features were considered as feature vectors. These three techniques employ a special filter design process, which is sensitive to the detection of vessel-like features. These features were normalized before use in the ML model design process.
3.3 Discussion of Decision Tree and Random Forest Classifiers with Mathematical Analysis
Among the datasets, 60% were the training set and over 40% were the test set. Using the training set, tree-based classifier techniques, namely decision tree (DT) and random forest (RF), were used to construct the classifier model for the different approaches devised in this study, namely multi-class and binary classes. The performance of each classifier model was further validated using standard approaches.
In the above expression, ζ ≥ 0 influences the cross-sectional asymmetry, τ ≥ 0 tends to control the sensitivity to blob-like structures, and 0 < ρ ≤ 1 influences the sensitivity of the tubular object curvature [47]. A classifier in machine learning is an algorithm that routinely orders or categorizes data into one or more of an arrangement of classes. Classification algorithms are predominantly familiar in machine learning since they map input statistics into predefined categories, making the process easier for the user. They investigate data repeatedly, simplify operations, and attain functional information [46].
The Frangi based vesselness detection can be expressed using the expression represented in Eq. (2) below [46]:
where
Based on the Hessian matrix computed and the above expressions, the Frangi based filter is instrumental in making the vessel like structures more obviously visible with respect to the background information. The Frangi filter is classically used to perceive vessel-like or tube-like structures and fibers in volumetric image data. Frangi vessel enhancement filter is one of the many methods for vessel segmentation of lung infections. It is quick as well as competent.
Random forests [RF] condense the threat of overfitting and accuracy is a large amount higher than a single decision tree [DT]. In addition, decision trees in a random forest run in equivalent so that the time does not become a problem or threat. The success of a random forest highly depends on using uncorrelated decision trees. The random forest has complex visualization and accurate predictions, but the decision tree has easy visualization and less accurate predictions. The importance of RF is that it prevents over-fitting and is additionally accurate in predictions [67]. The RF and DT classifier models were used to train separately with the above-derived feature vectors to investigate the influence of features derived from the higher-pixel-intensity-based mask region, along with the ML model performance. From the entire dataset, 60% of the data were used for training purposes and 40% of the data were used to examine the performance of the approach. The performance measures used to validate the ML models were presented in [67].
In the above expression, ζ ≥ 0 influences the cross-sectional asymmetry, τ ≥ 0 tends to control the sensitivity to blob-like structures, and 0 < ρ ≤ 1 influences the sensitivity of the tubular object curvature [47]. The RF and DT classifier models were used to train separately with the above-derived feature vectors to investigate the influence of features derived from the higher-pixel-intensity-based mask region, along with the ML model performance. From the entire dataset, 60% of the data were used for training purposes and 40% of the data were used to examine the performance of the approach. The performance measures used to validate the ML models were presented in [67].
where FP = False Positive, FN = False Negative, TP = True Positive and TN = True Negative. Python Compiler 3.7 used for the execution of the work with packages, together with Scikit-learn.
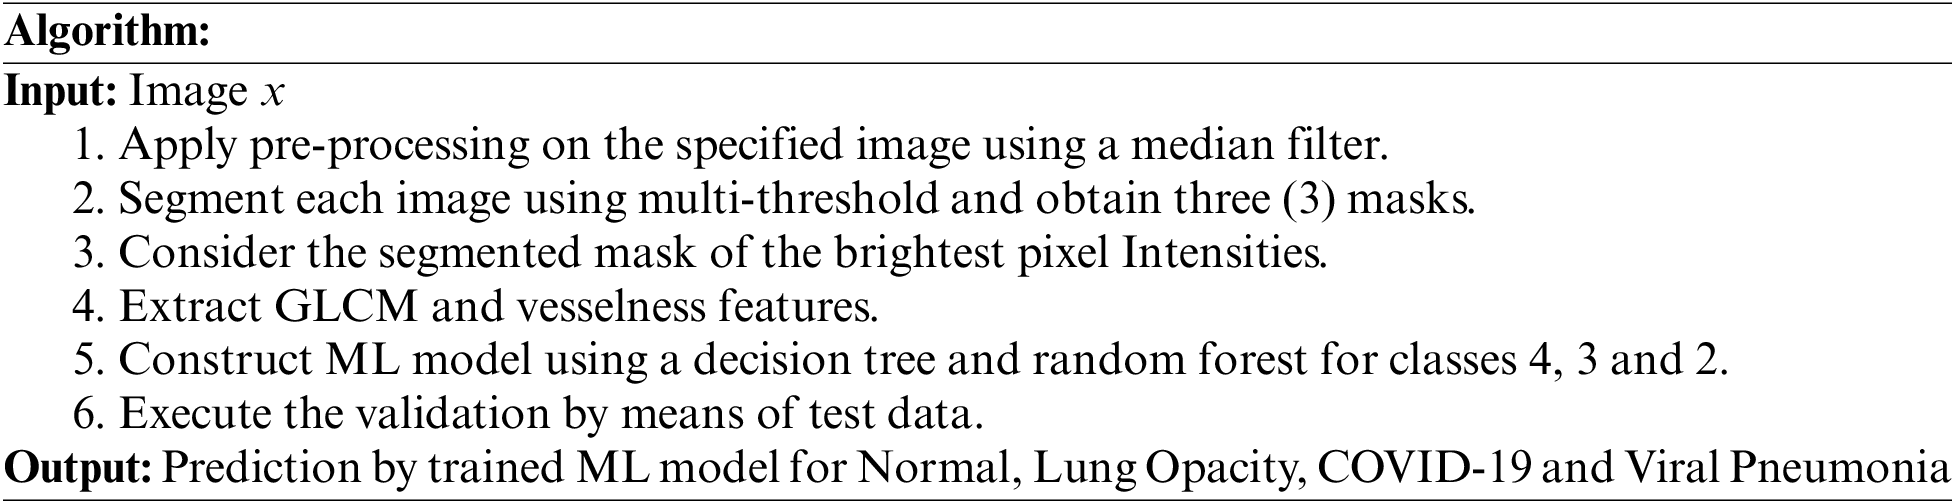
The methodology executed with reference to the proposed algorithm is described as follows:
Representative images belonging to the normal, COVID-19, LO, and VP groups are shown in Figs. 2–5, along with their corresponding histograms. The images clearly depict variability in pixel intensities, particularly in and around the lung regions. The visibility of the rib cages is very obvious in the case of the normal and COVID-19 images as shown in Figs. 2a, 2b, 3a and 3b respectively compared to the LO and VP images in Fig. 4a, 4b, 5a and 5b. The visibility of lungs in COVID-19 patients is unclear. The histograms represent different perspectives, with varying distribution of intensities across the four categories, particularly COVID-19, indicating a large presence of high pixel intensities.
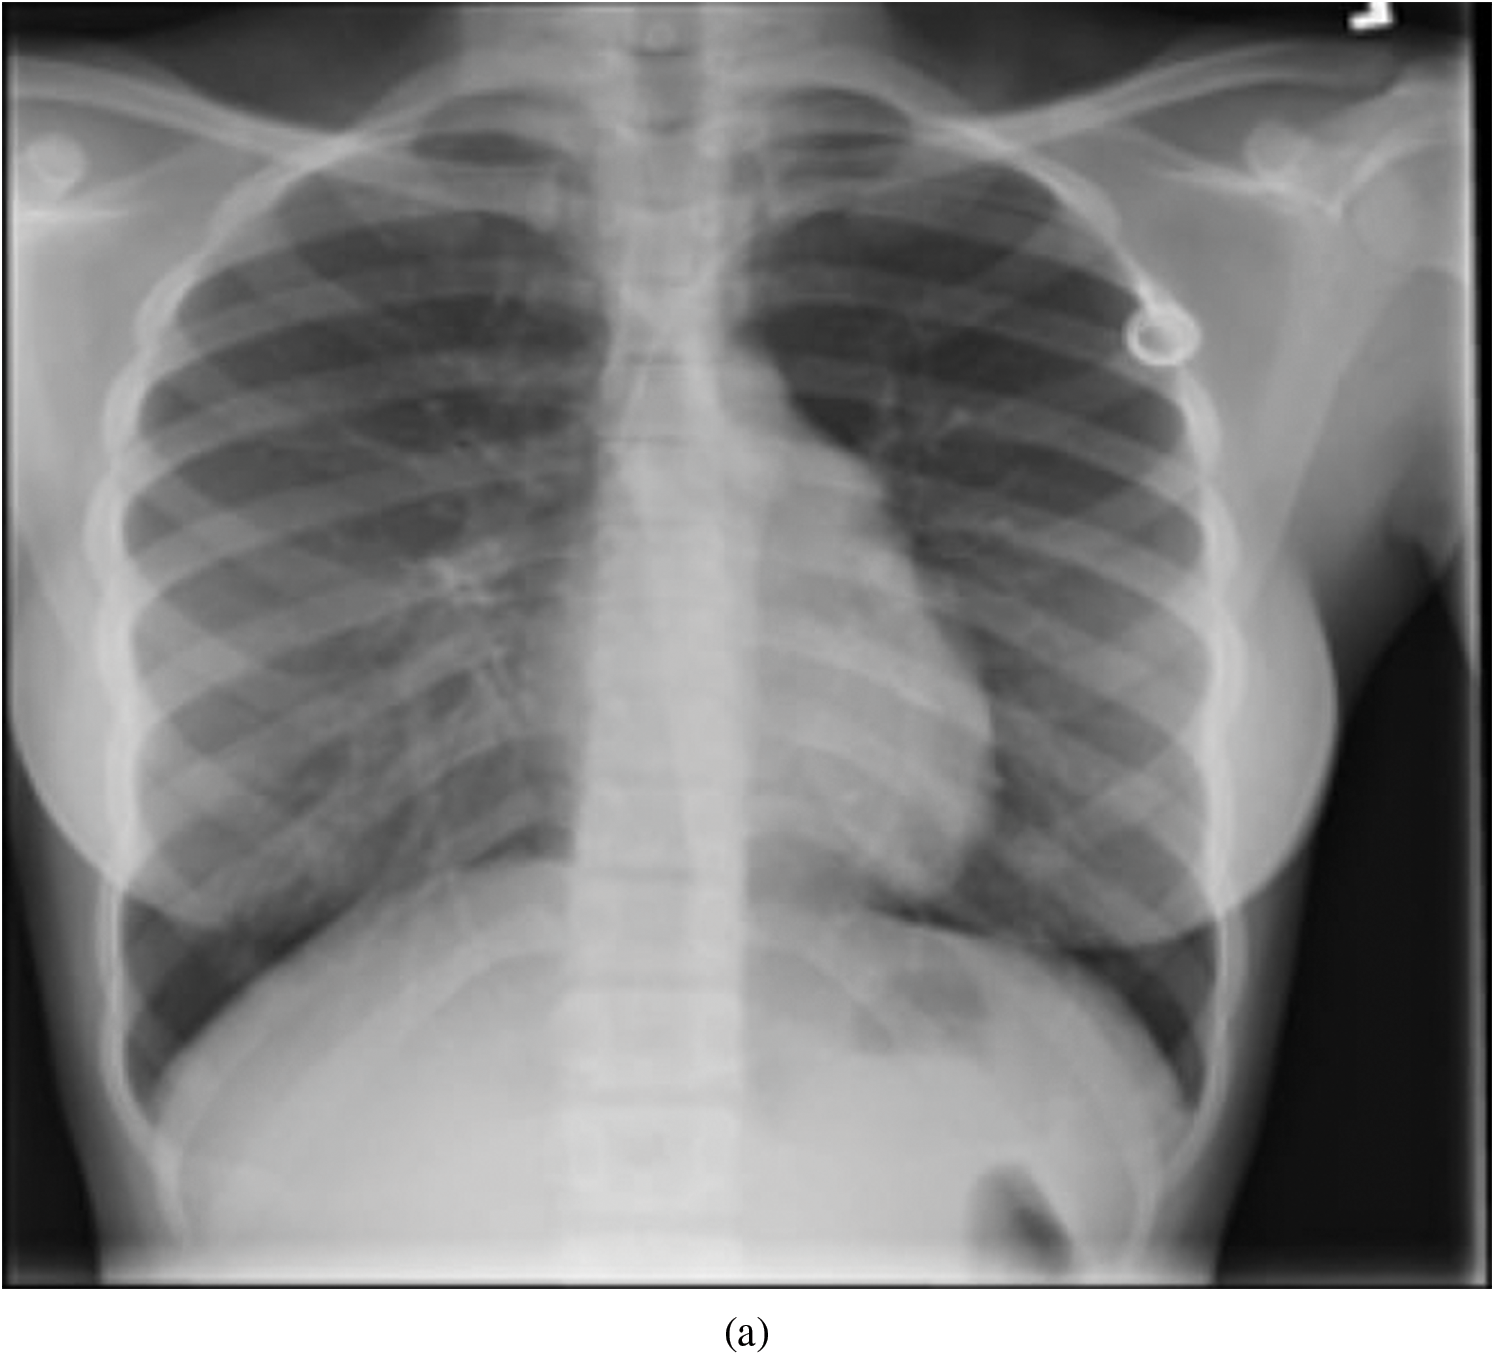
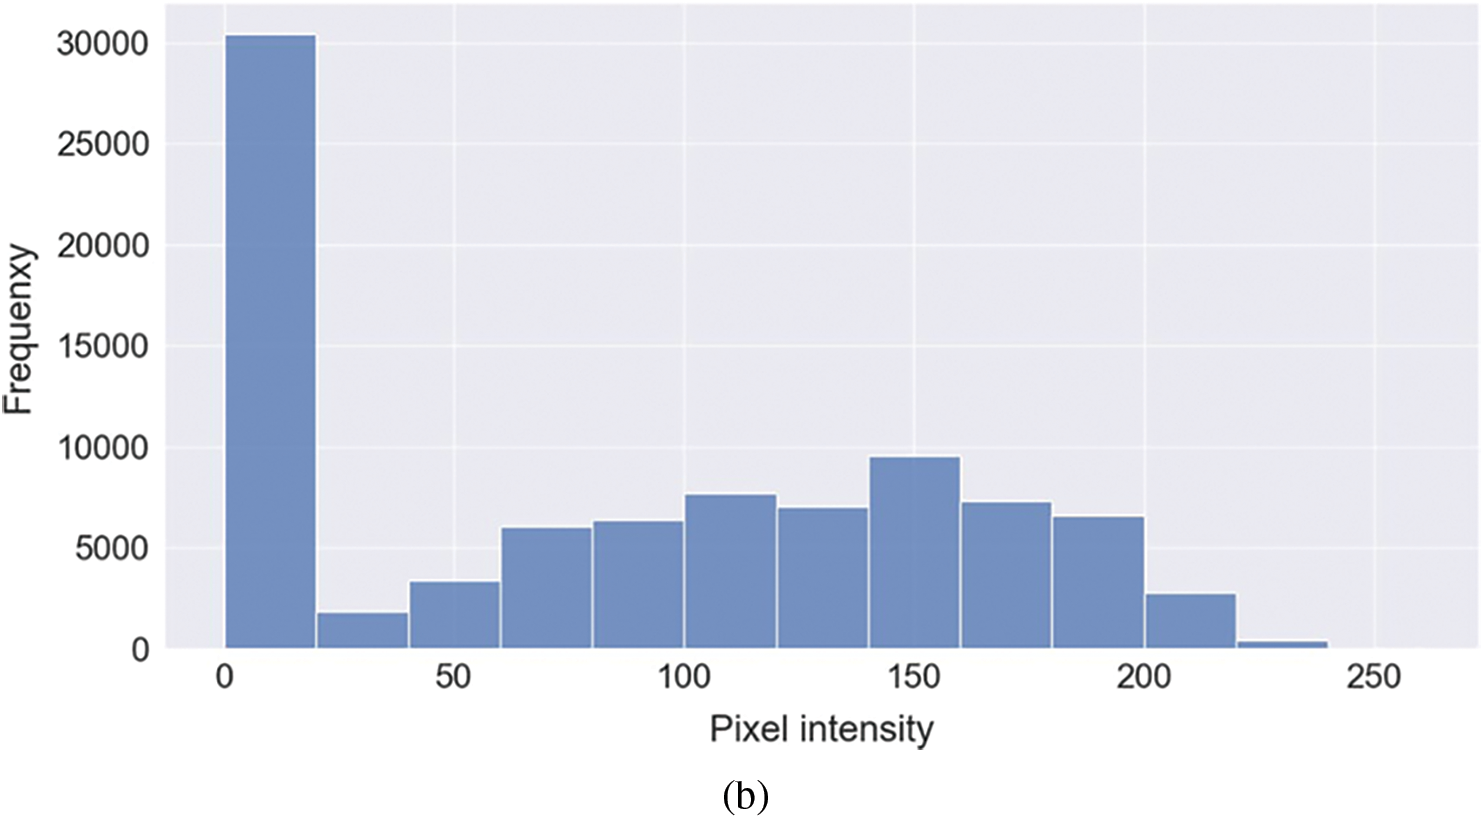
Figure 2: Representative image and its corresponding histogram depicting the distribution of pixel intensities of a normal image
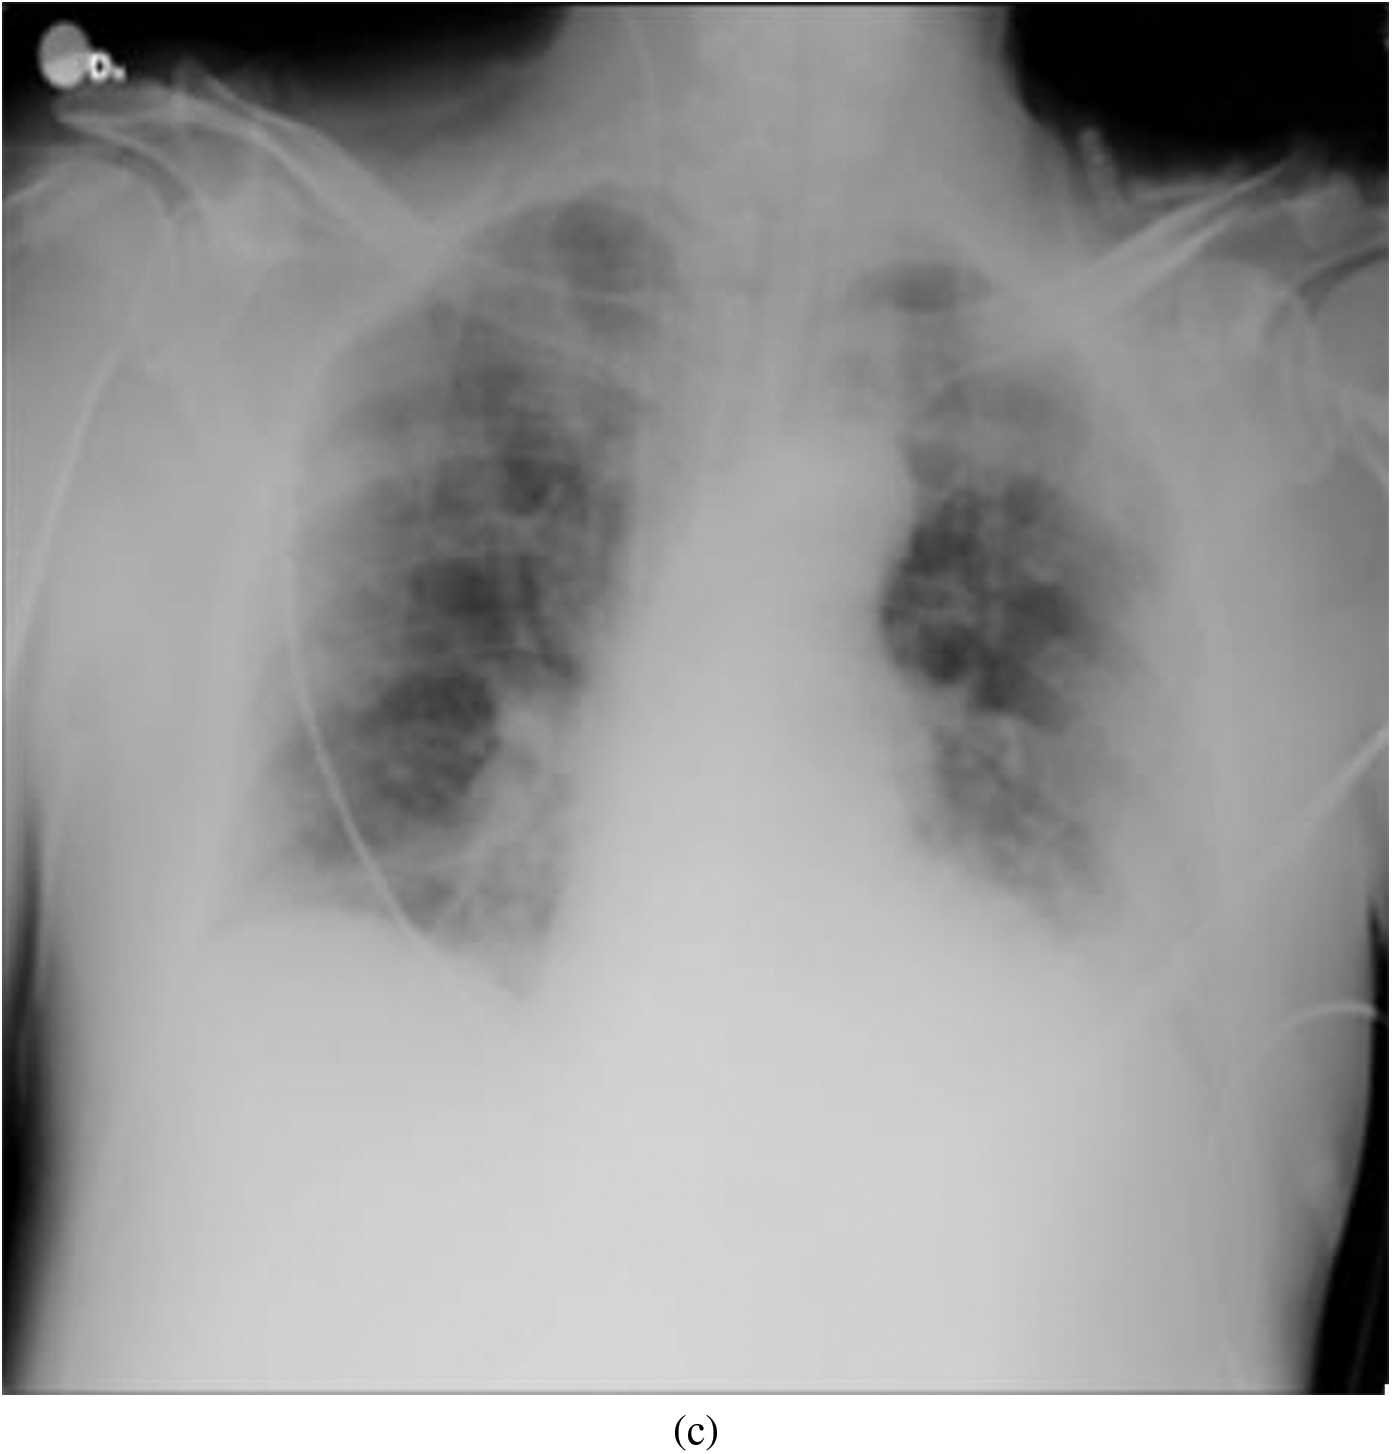
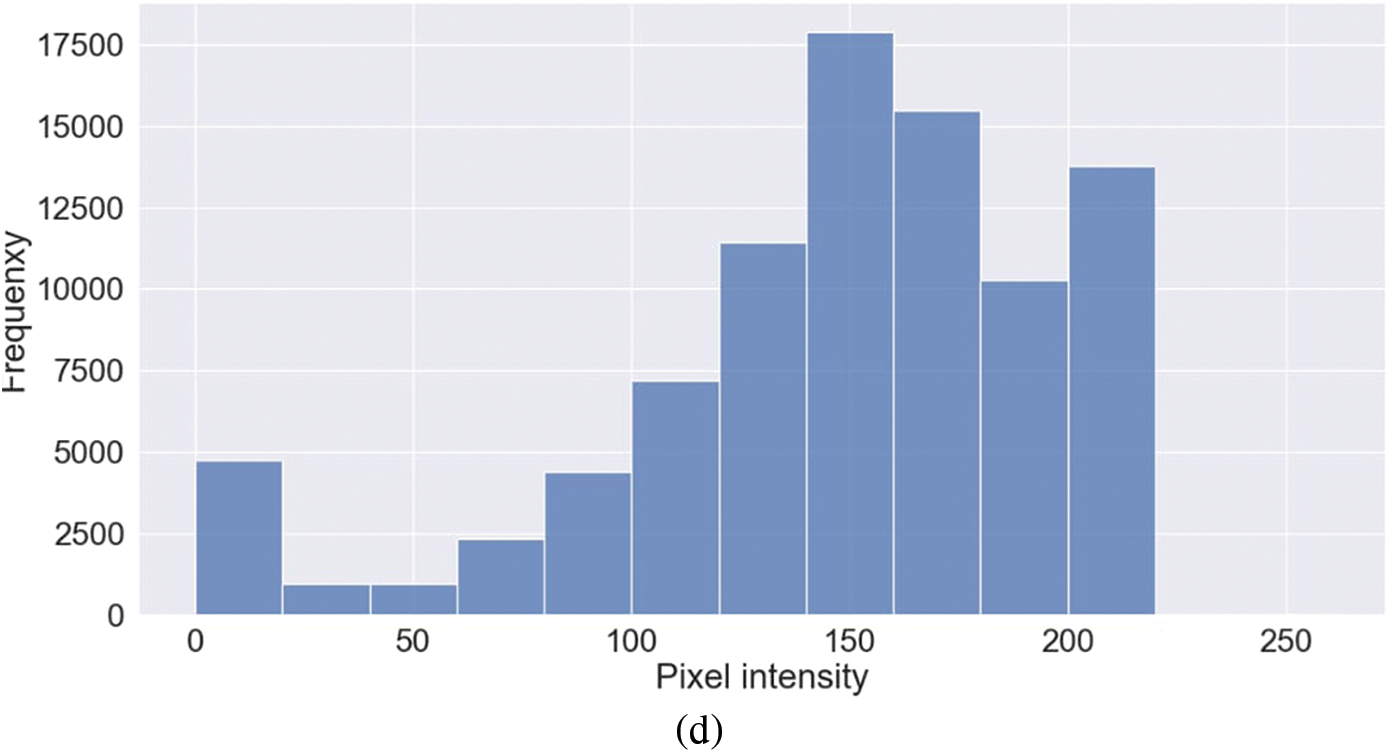
Figure 3: Representative image and its corresponding histogram depicting the distribution of pixel intensities of a COVID-19 image
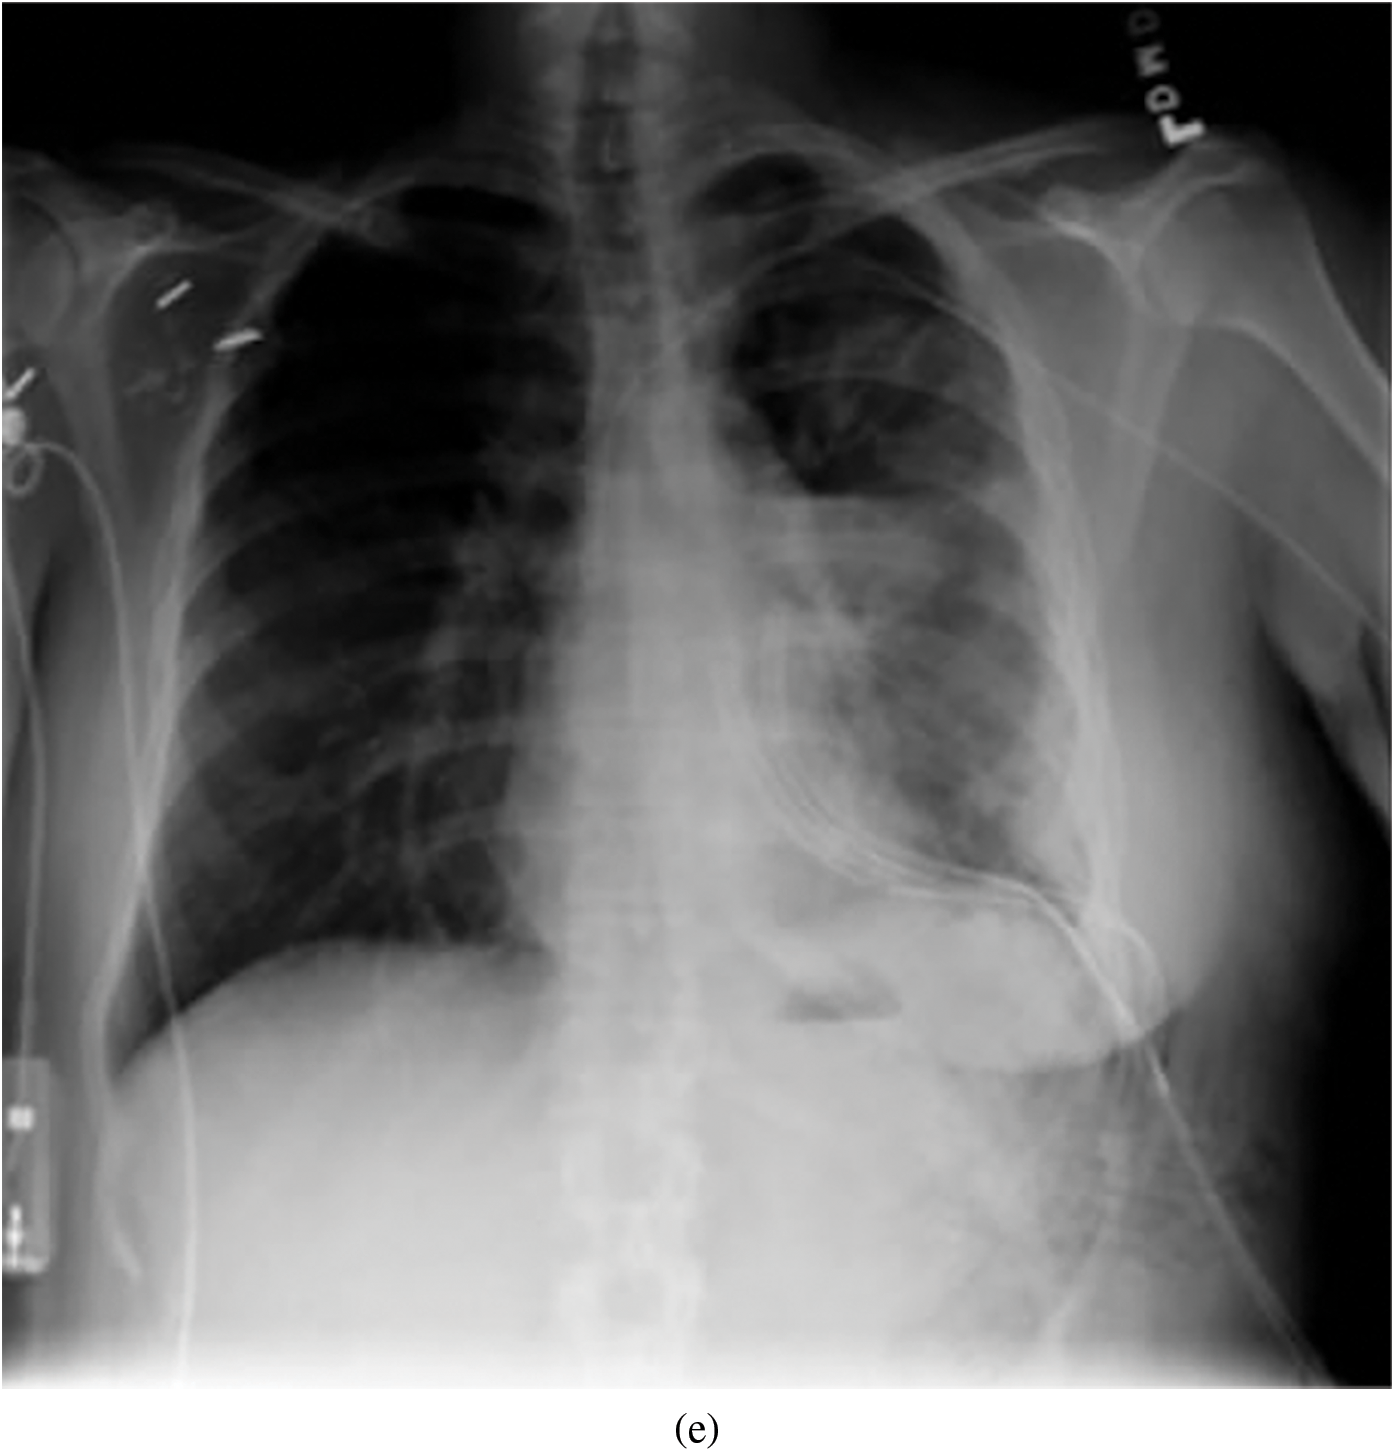
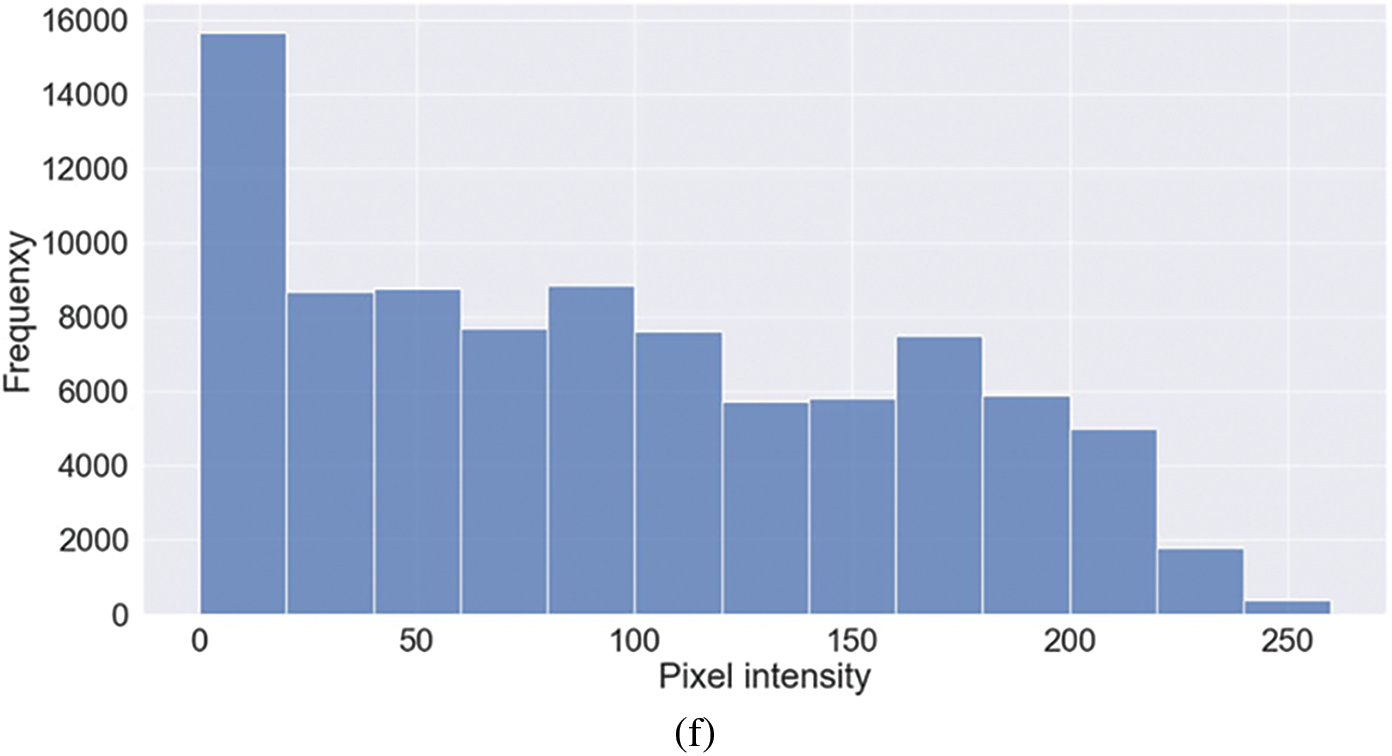
Figure 4: Representative image and its corresponding histogram depicting the distribution of pixel intensities of a Lung Opacity (LO) image
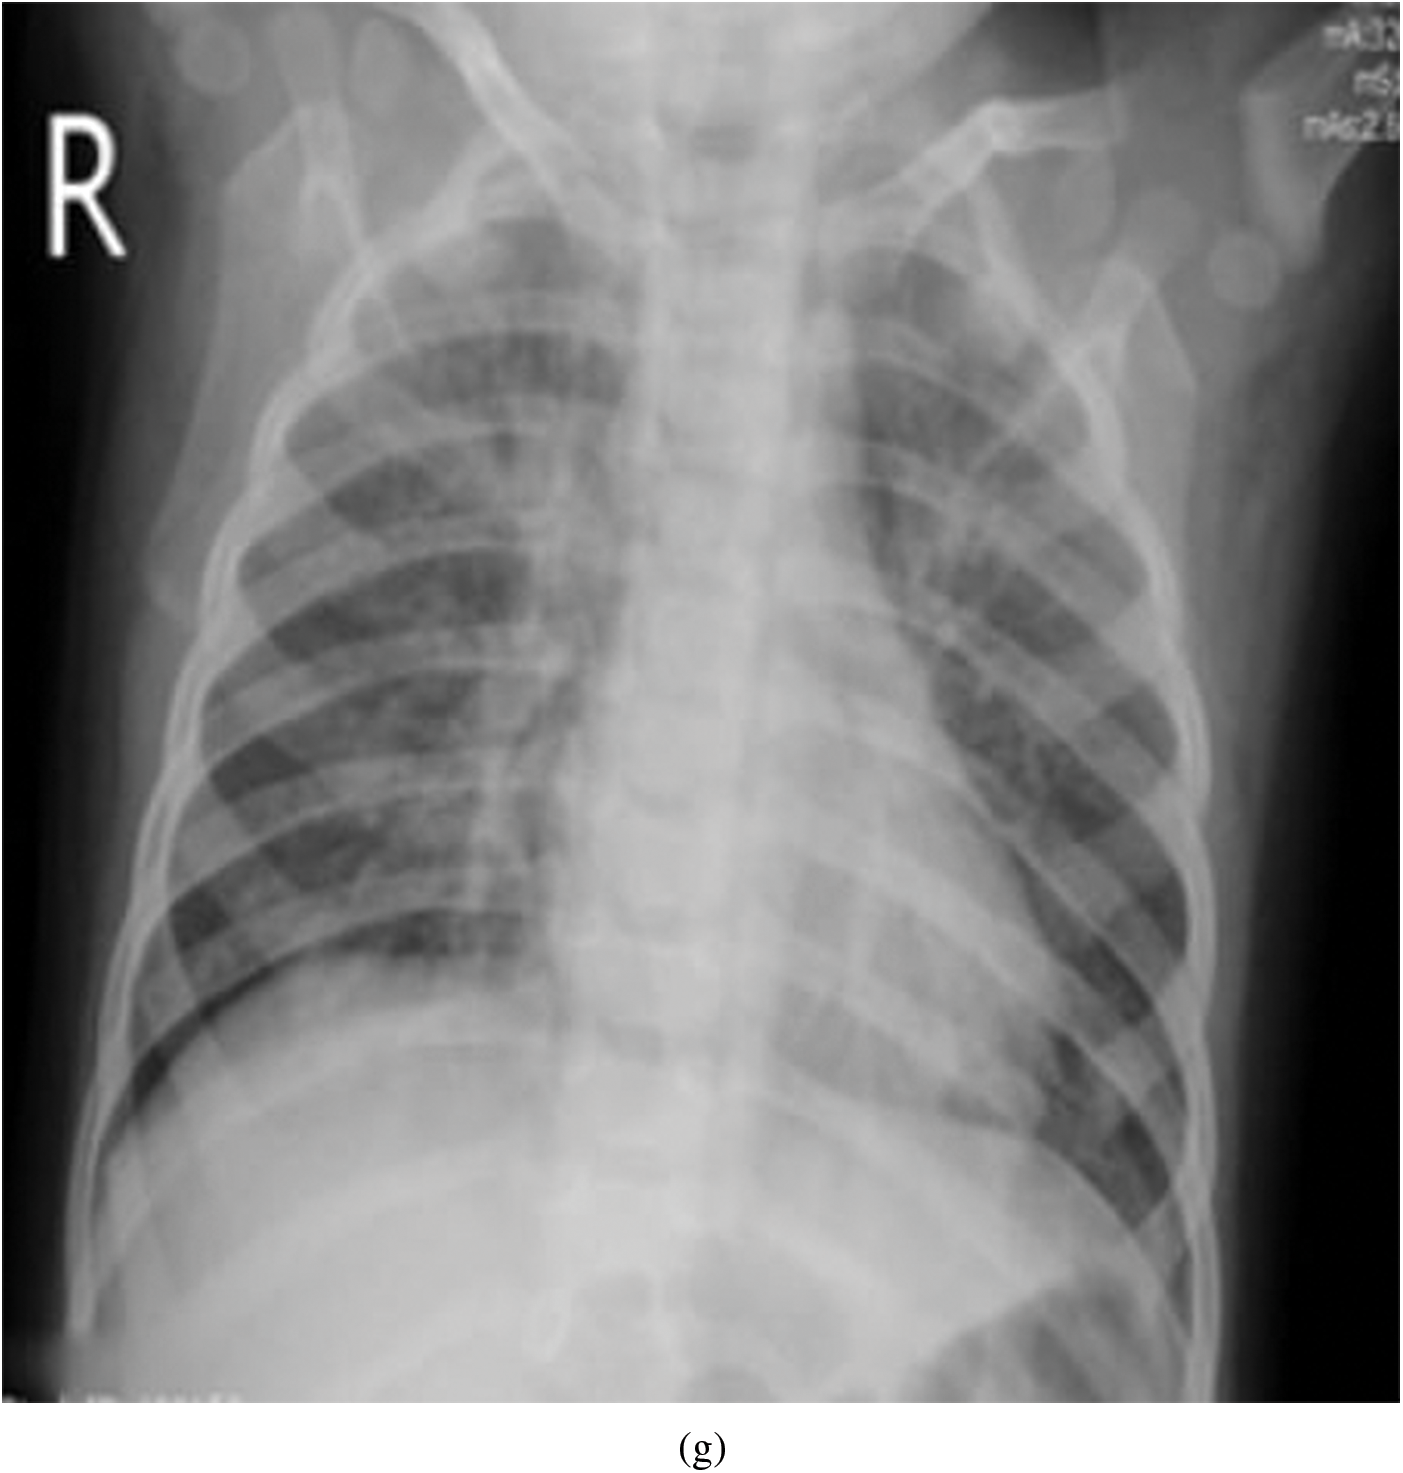
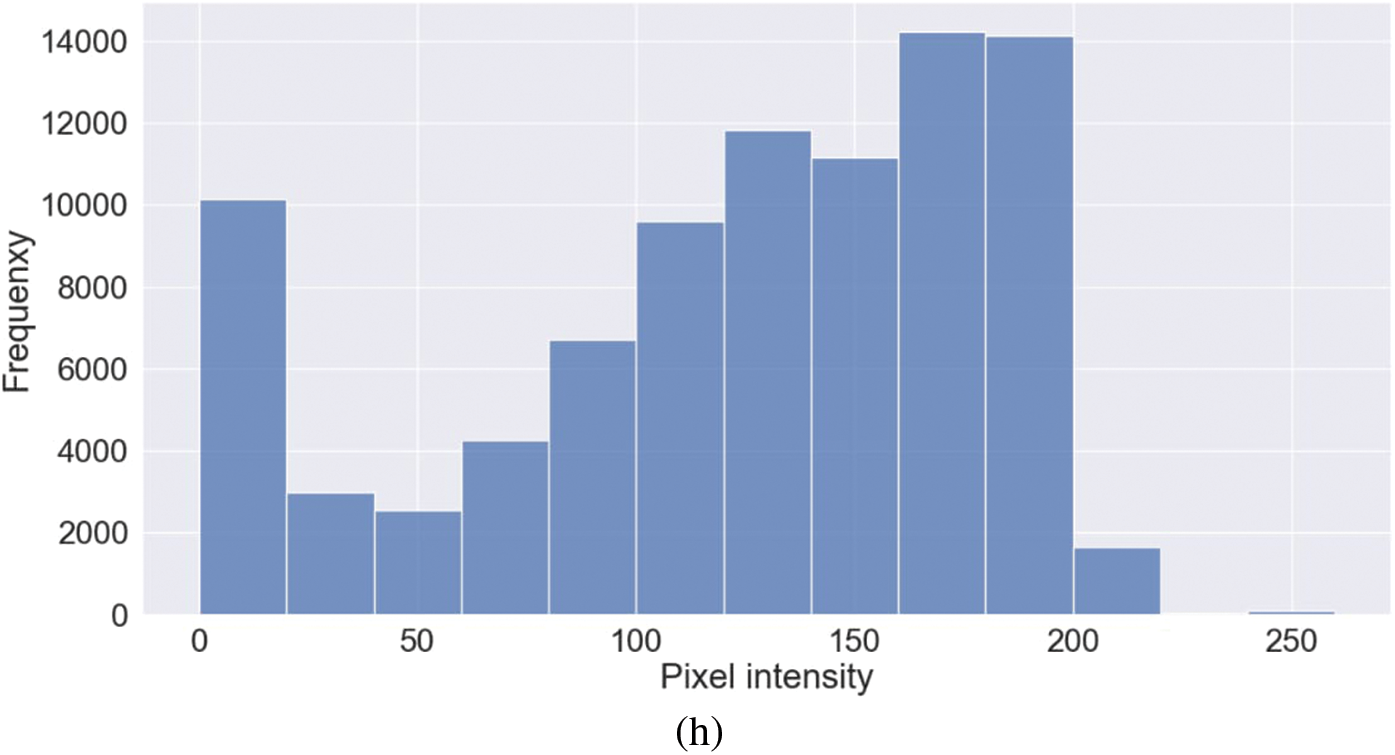
Figure 5: Representative image and its corresponding histogram depicting the distribution of pixel intensities of a Viral Pneumonia (VP) image
These observations further motivated the implementation of this study with due emphasis on including the features representing the texture-like features and vessel-like features and further evaluating the fusion of features to categorize the normal and different pathologies using ML approaches.
The segmented masks considered in this study as ROIs for normal and different pathologies are shown in Fig. 6. Four images revealed varying distributions of white pixels, and the objective of selecting the highest pixel intensities representing the mask was to explore the textural and vessel-like features in those regions and extract any useful diagnostic information from the region.
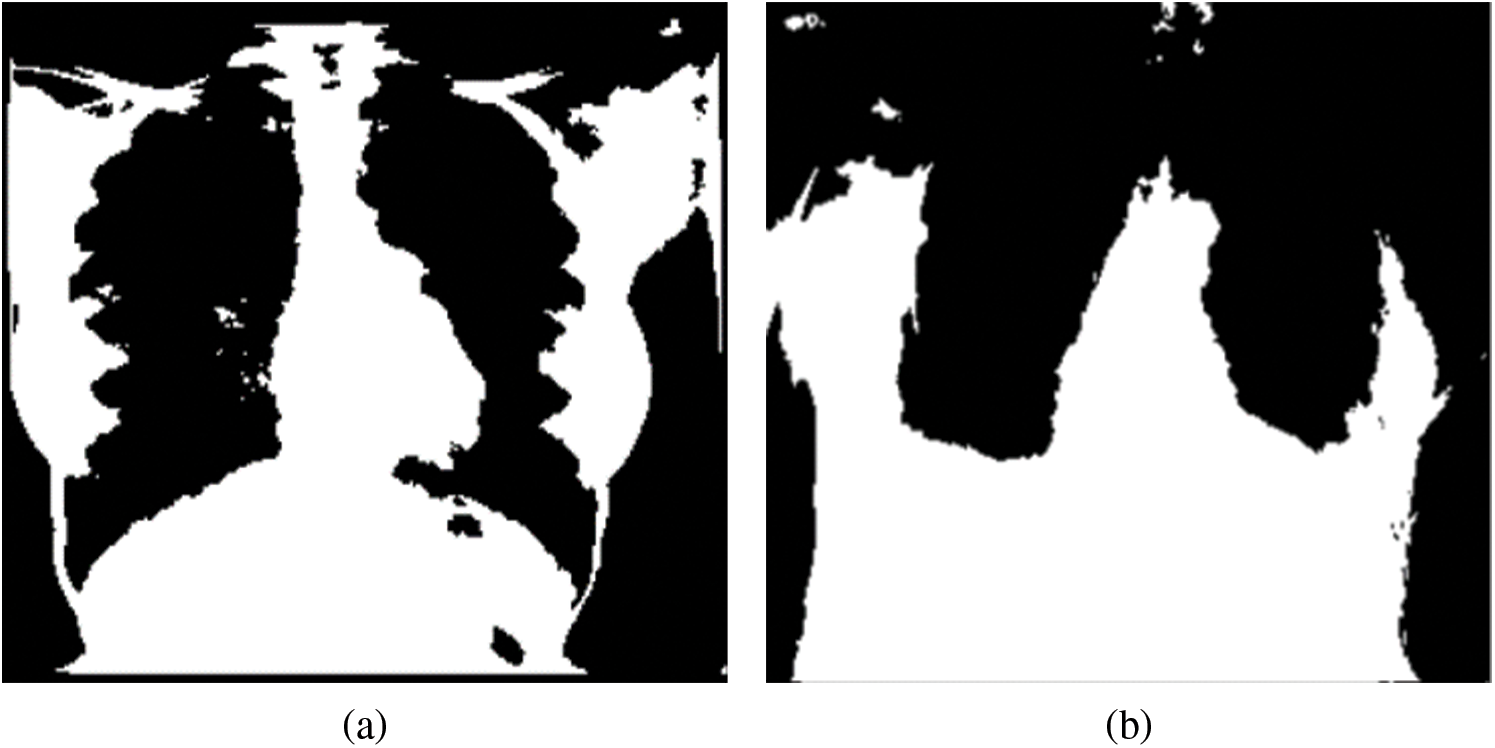
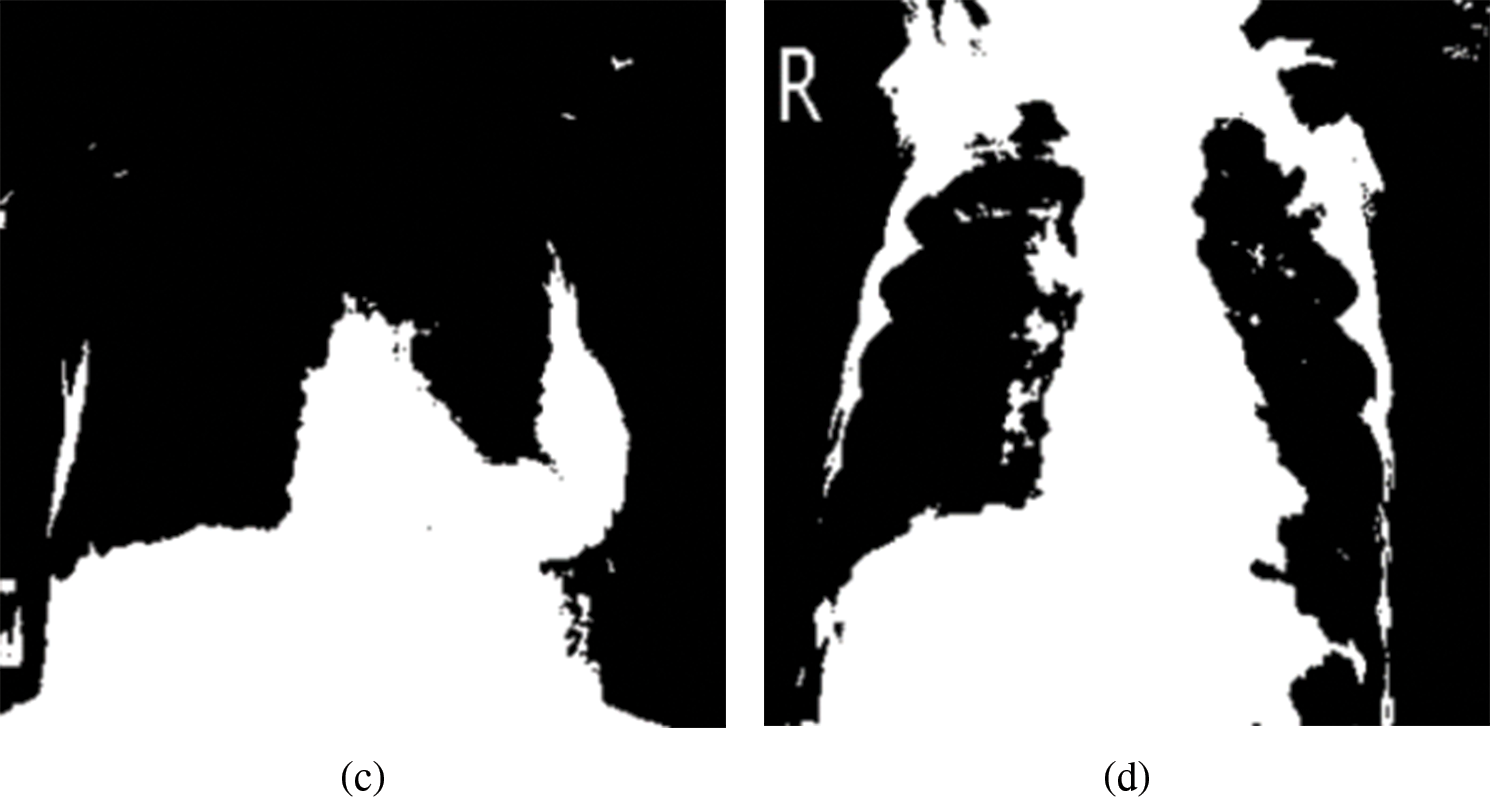
Figure 6: Mask representing the highest pixel intensities from the multi-threshold CXR images. (a) Normal, (b) COVID-19, (c) LO and (d) VP
The input images subjected to filtering using the Sato filter are shown in Fig. 7. Among the four images depicted, it can be observed that the normal, LO, and VP images shown in Figs. 7a, 7c and 7d show the bony structures.
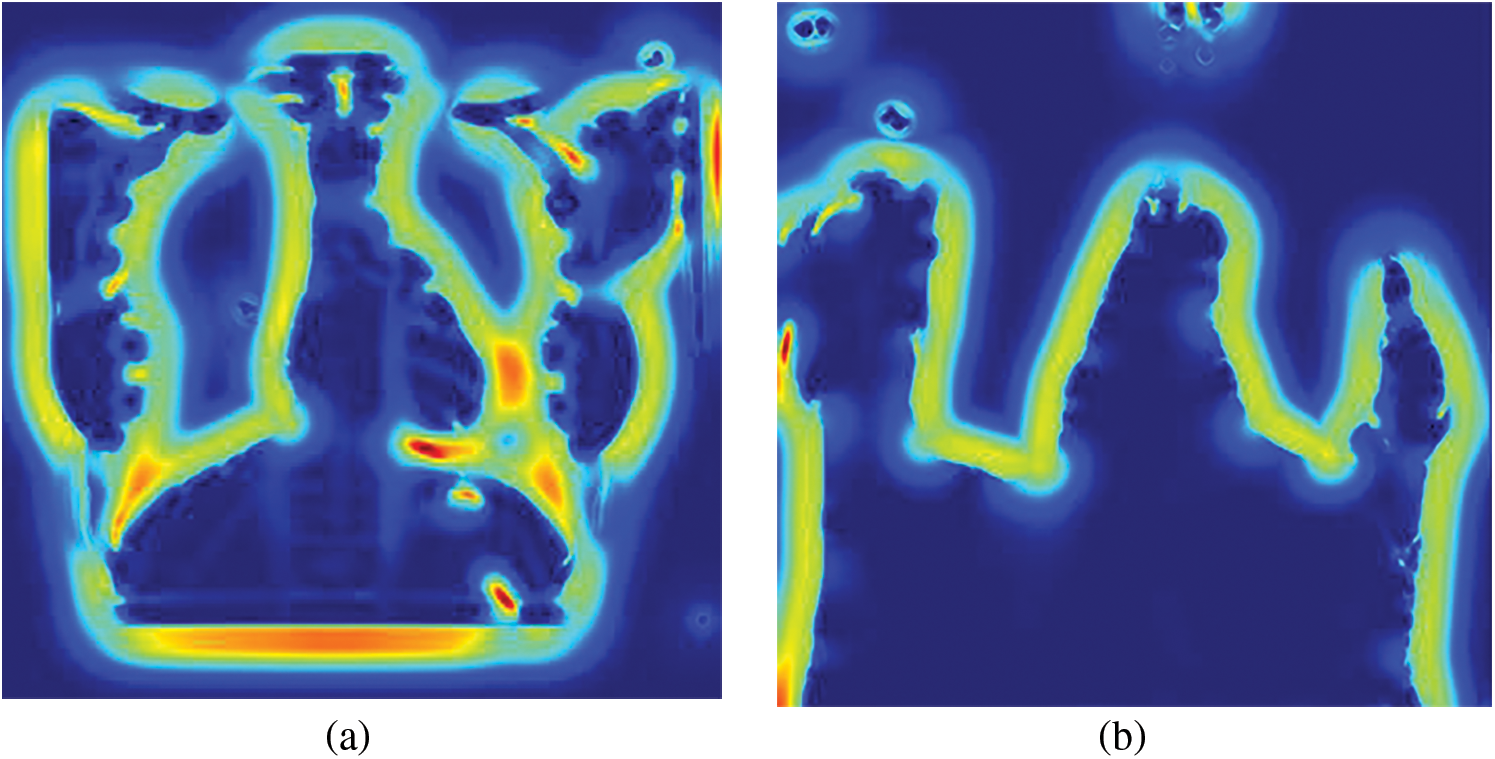
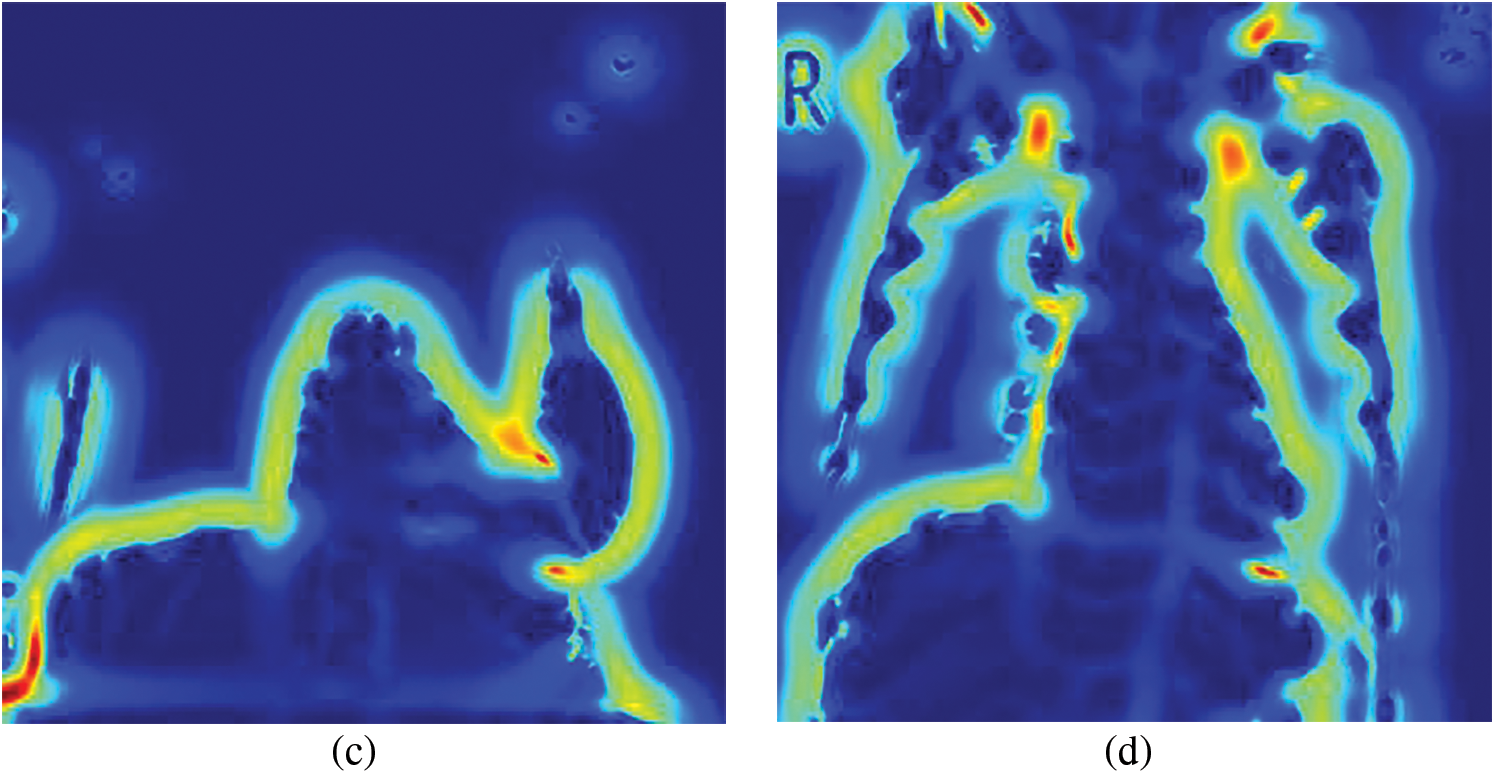
Figure 7: Sato filtered representative CXR images (a) Normal, (b) COVID-19, (c) LO and (d) VP
In contrast, the same structures were not prominent in the case of COVID-19 (Fig. 8b). This analysis further helped the objective of this study to explore the texture and vessel-like structures in CXR images. The confusion matrices computed for 4-class, 3-class and 2-class classifier models using RF and DT are shown in Figs. 8–10, respectively. In all the cases, the best accuracy measure was associated with normal images for all three pathologies. The graphical comparison of the performance Measures of 3-class and 4-class models is observed in Figs. 11 and 12, respectively.
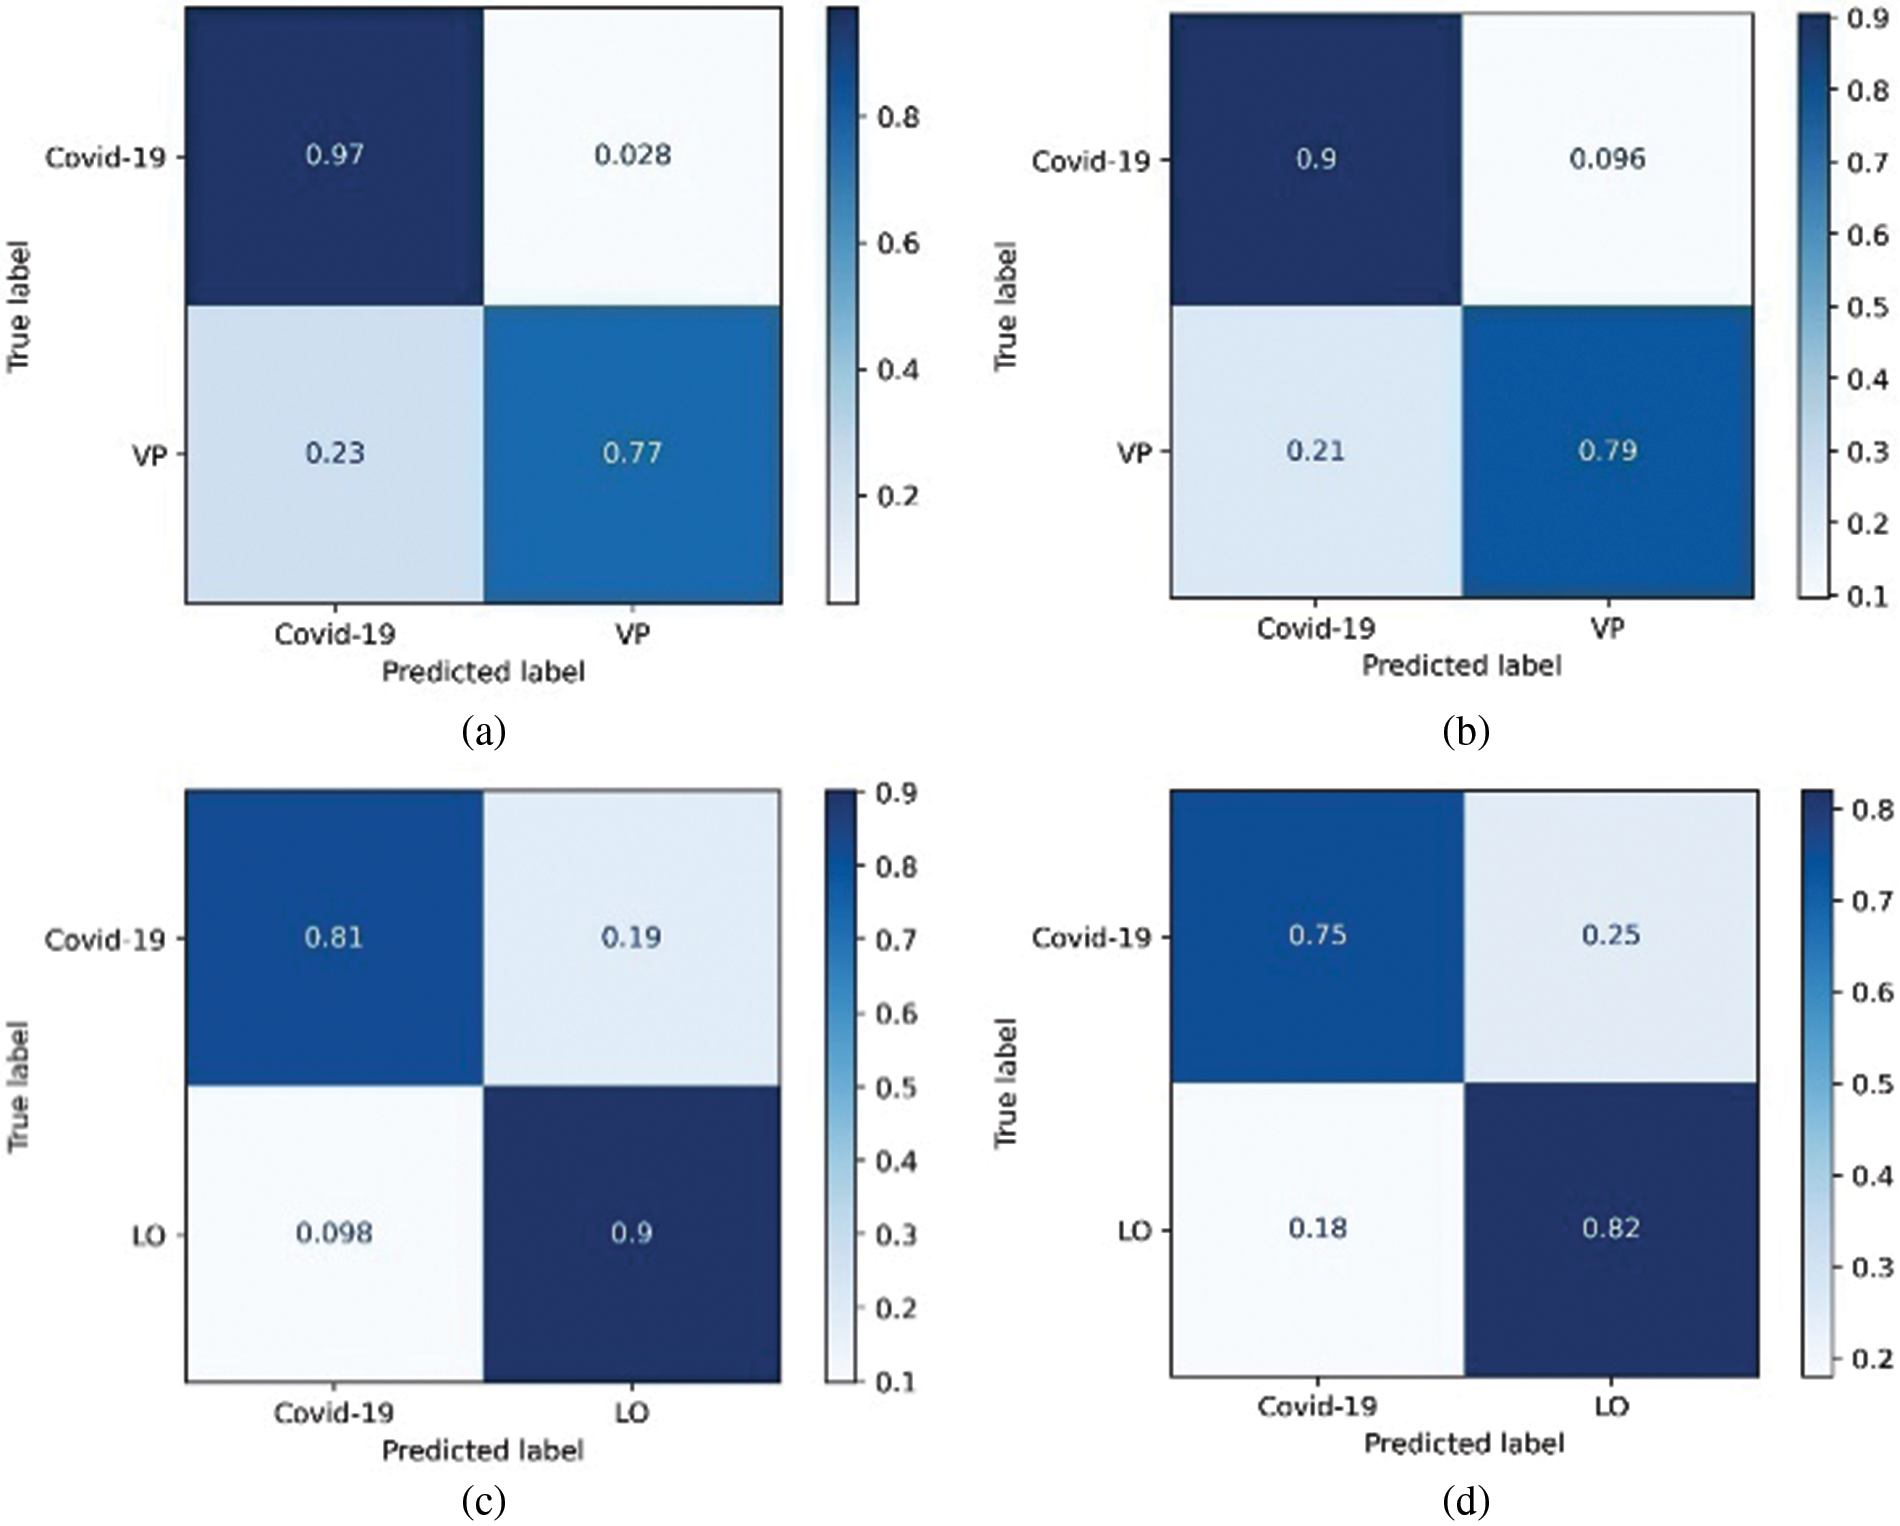
Figure 8: Confusion matrix derived for 2-class classifier model using two approaches, (a) RF – COVID-19 vs. VP and (b) DT-COVID-19 vs. VP, (c) RF-COVID-19 vs. LO and (d) DT-COVID-19 vs. LO
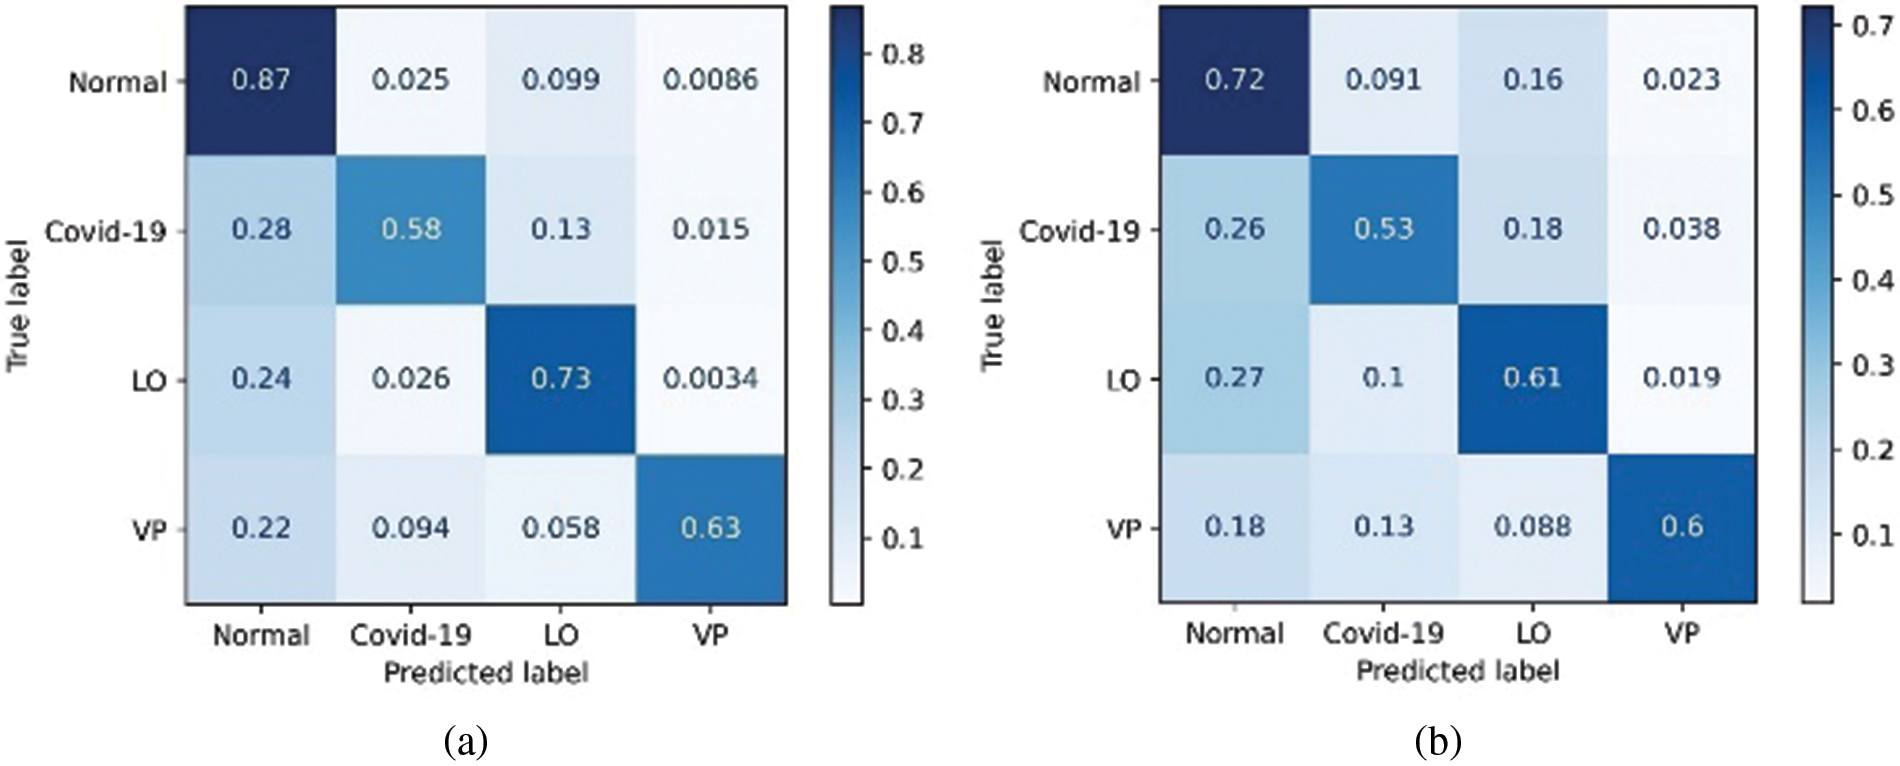
Figure 9: Confusion matrix derived for 4-class classifier model using two approaches, (a) Random forest and (b) Decision tree
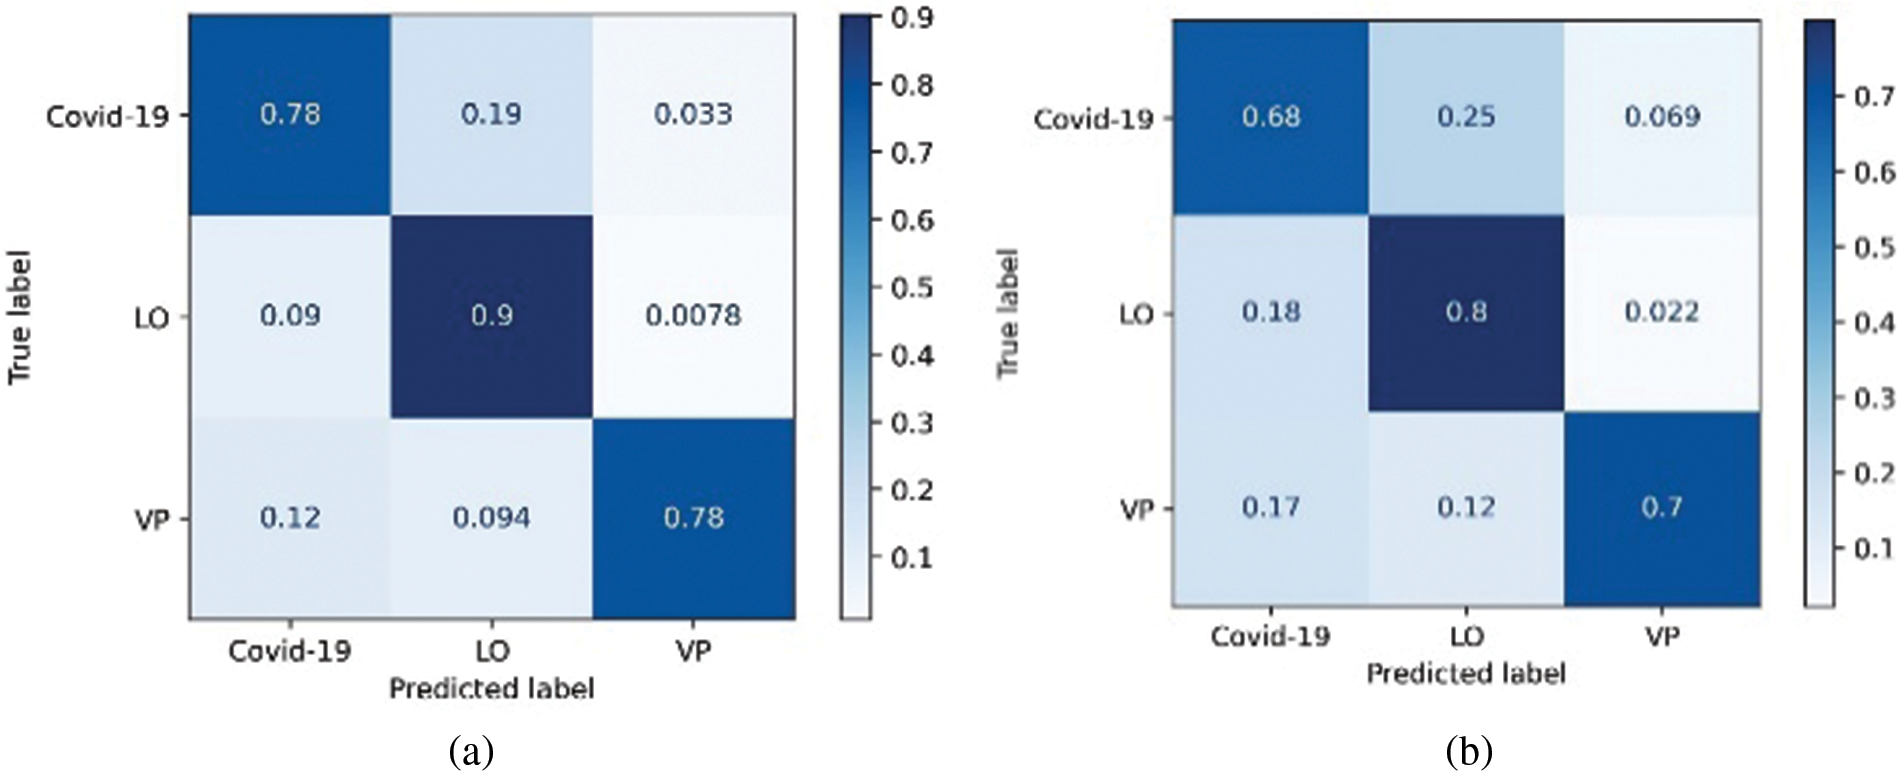
Figure 10: Confusion matrix derived for 3-class classifier model using two approaches, (a) Random forest and (b) Decision tree
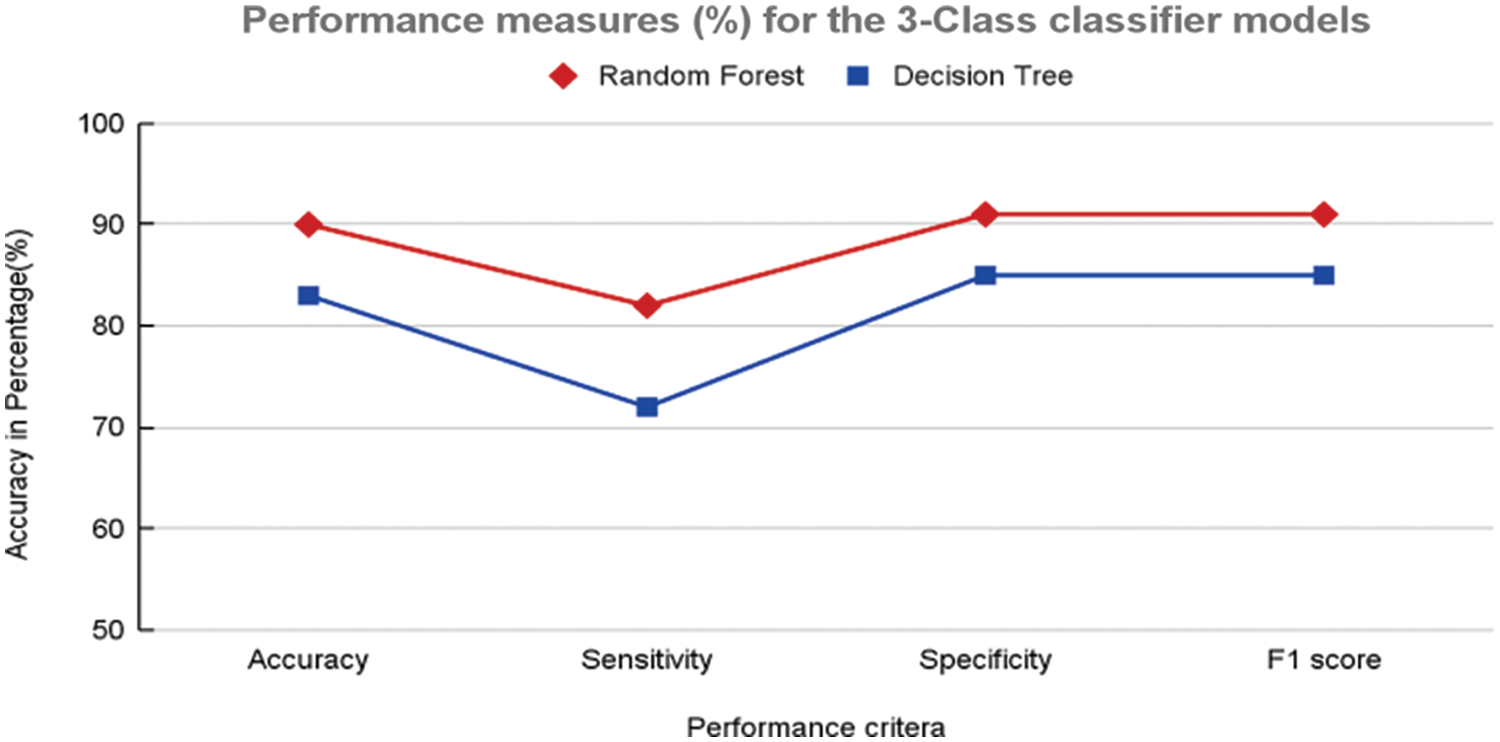
Figure 11: Performance measures (%) 3-class classifier model using random forest and decision tree
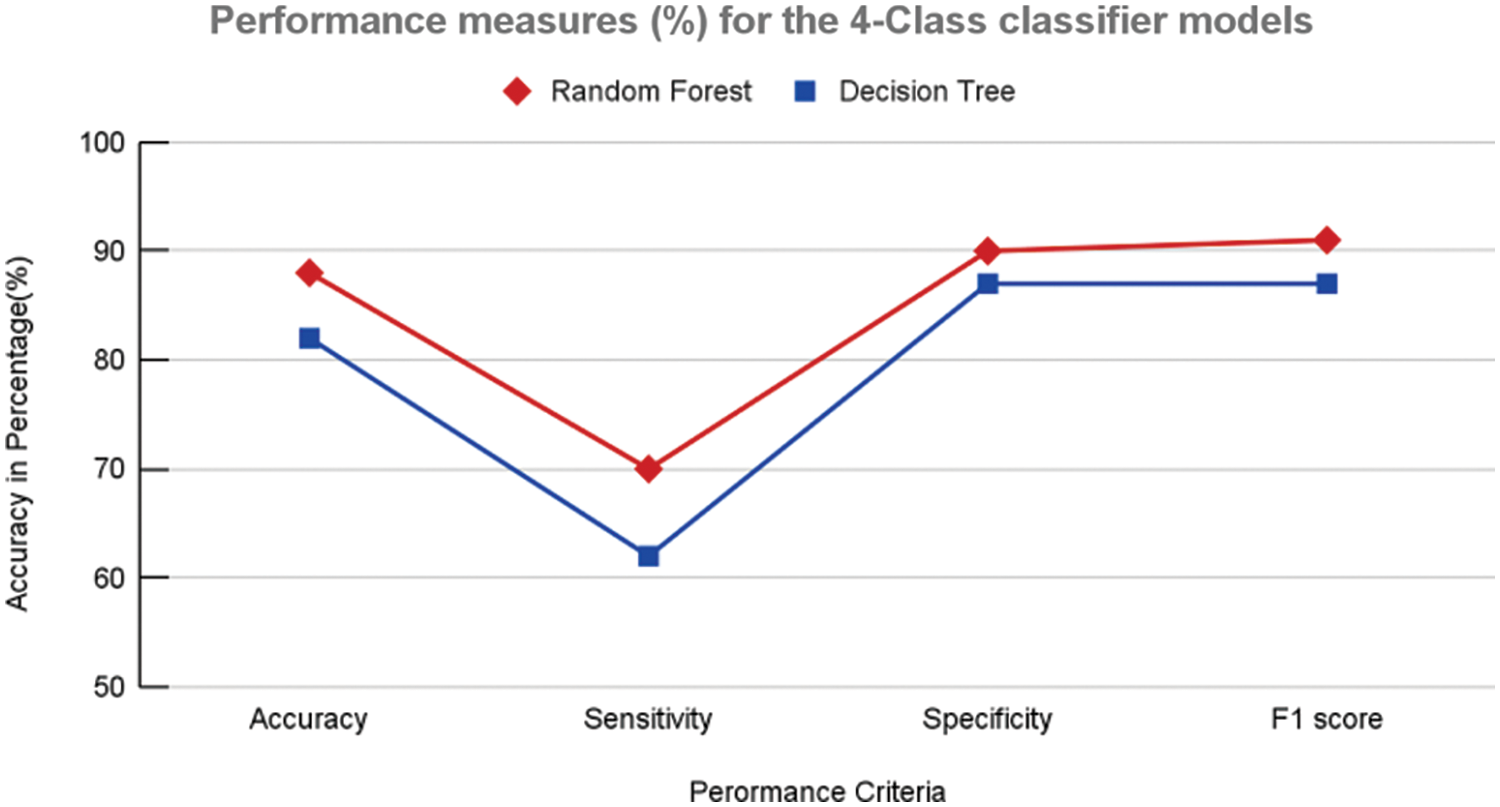
Figure 12: Performance measures (%) 4-class classifier model using random forest and decision tree
Major confusion appears to be categorized with respect to normal images and is observed using the two techniques. The relative confusion in categorizing COVID-19 seems to be associated with LO, as observed in both cases. The proposed approach outperformed the existing approaches are graphically represented in Fig. 13.
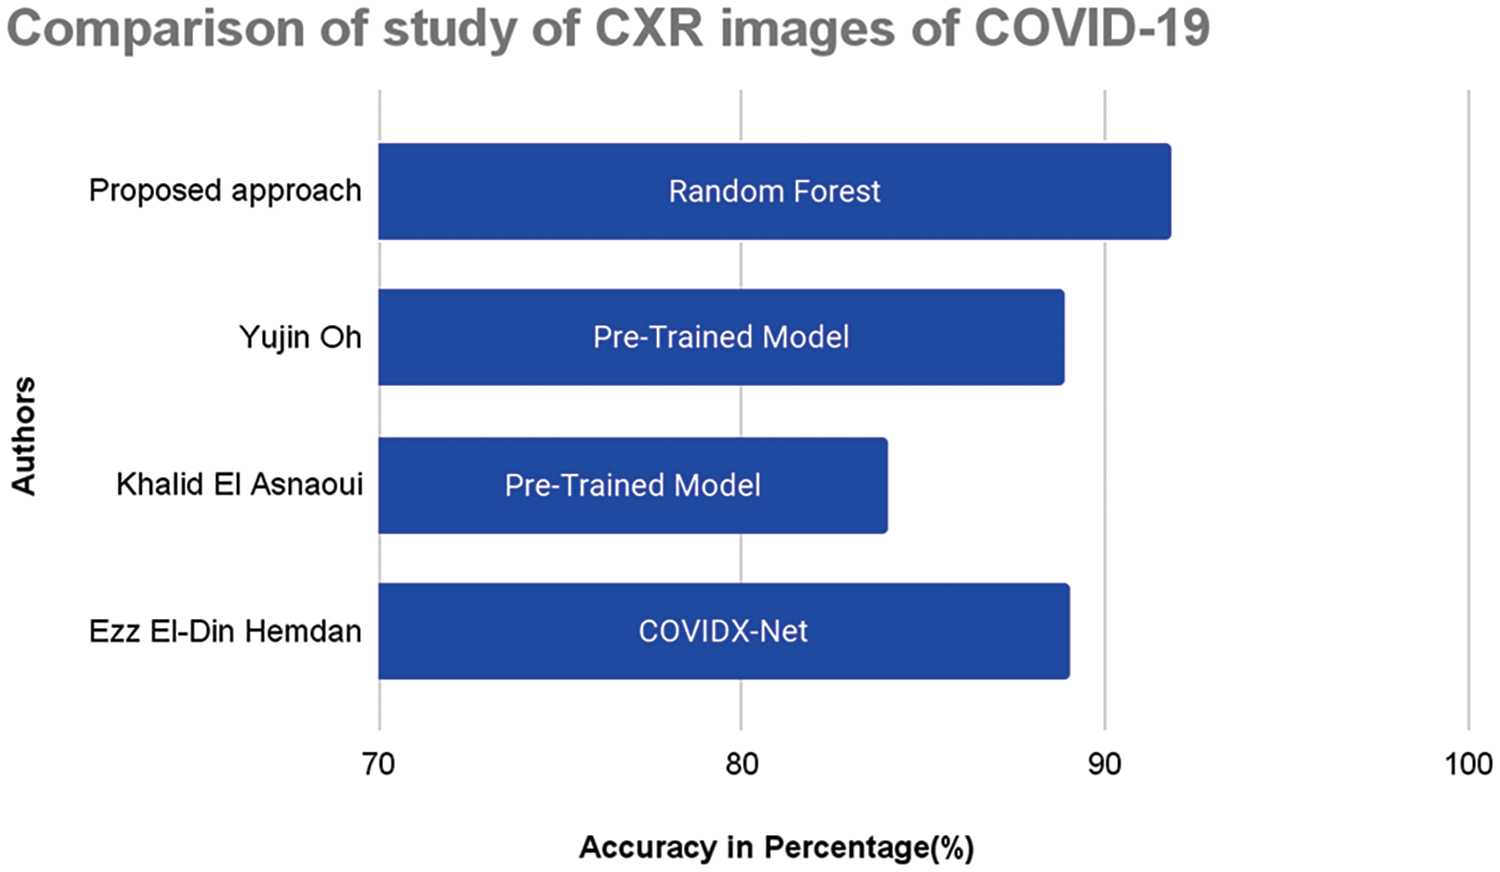
Figure 13: Performance comparison graph with proposed approach
The confusion matrices for 3-class ML models designed to categorize the three pathologies are shown in Fig. 6. In this case, LO seems to be better categorized than the other two pathologies; however, from Fig. 8a, RF can efficiently classify LO images. In addition, the categorization of COVID-19 and VP was superior to that of RF Fig. 8b. Interestingly, the RF-COVID-19 images were misclassified as LO, whereas the VP images were misclassified as COVID-19. In the case of DT, the images of COVID-19 were still confused with those of LO, whereas VP seemed to be confused with both COVID-19 and LO. The confusion matrices derived from 2-class ML models designed to categorize COVID-19 from LO and VP are shown in Fig. 8. As shown in Figs. 8a and 8b, COVID-19 feature sets were better differentiated from VP using both RF and DT, with the former outperforming by improving accuracy. From Figs. 8c and 8d, LO was observed to be categorized with higher accuracy than COVID-19, again with RF outperforming DT.
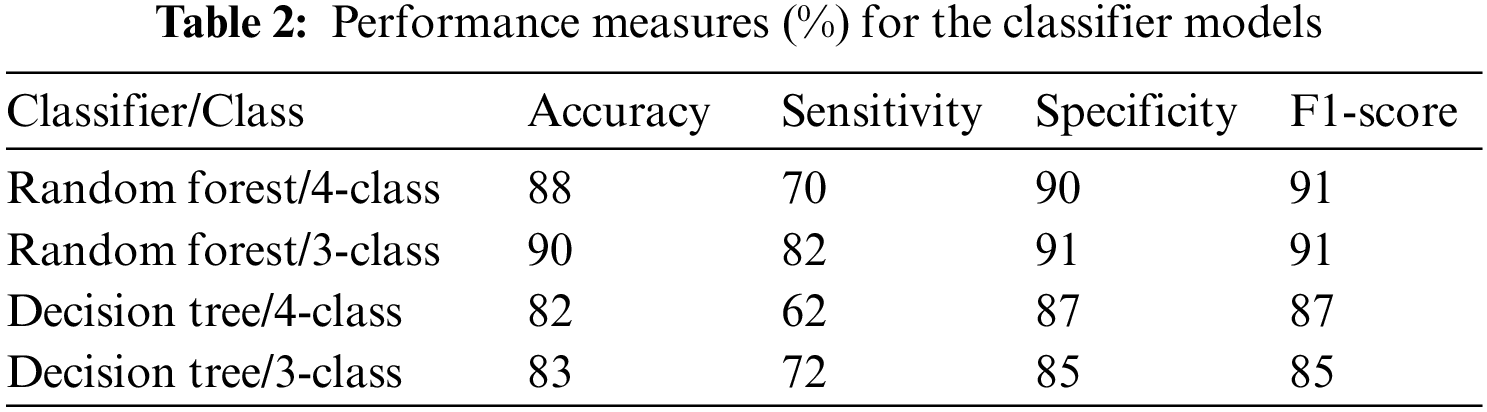
Further validation and comparison of the ML models were performed using performance measures, as shown in Table 1. It is clear that the RF-based model for both the 4-class and 3-class categorization outperforms the DT models in almost all measures. A marginal improvement was noticed in the case of the 3-class ML model performance in comparison with the 4-class classification with the RF-based models. The time elapsed feature extraction is 19.46 min and to build ML model is 45 s.
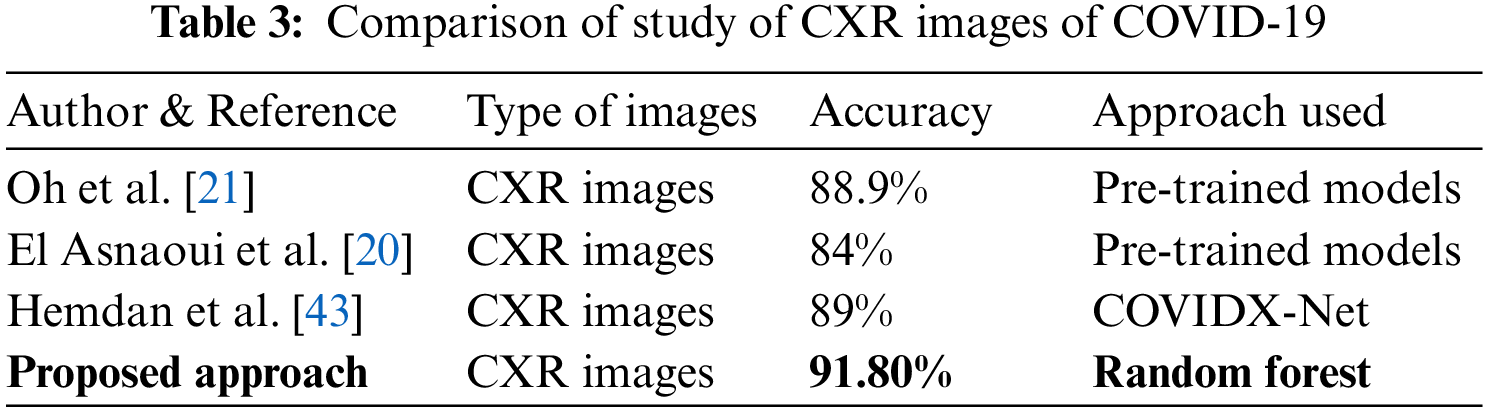
The current study was further compared with previously reported studies, as shown in Table 2. Several studies have been carried out using DL-based implementation strategies, and it can be seen that with appropriate handcrafted feature extraction methods, ML models can be efficiently designed to differentiate COVID-19 from normal and other pathologies.
The devastation and havoc caused by the COVID-19 pandemic clearly emphasize the need for effective screening and diagnostic approaches. More specifically, AI-driven approaches require continuous improvement. AI, in conjunction with image analysis methods, seems to be one of the many possible mechanisms to provide assistance to the medical fraternity for effective diagnosis and treatment. Physicians use CXR images to infer the possible presence of COVID-19 or any other lung-associated pathologies; sometimes, the extent of the infection spread is also imminent. This study was conducted with an emphasis on investigating the high pixel intensity regions in CXR images for possible textural and vessel-like information. The primary hypothesis was that the COVID-19 region, based on severity and extent, diminishes the visibility of the host of bone-related information in CXR images. In this study, we aimed to extract features using techniques that are sensitive to texture and the identification of vessel information. GLCM for texture-based feature extraction and the Frangi, Sato, and Meijering filtering techniques were used to capture vessel-like information. The images were filtered using a median filter and further segmented to obtain the region that best captured the high pixel intensities prior to the feature extraction. In this process, a moderate to high degree of over-segmentation might occur in certain subjects because multi-threshold-based techniques work based on the intensity of the pixel rather than any anatomical structure of interest. Therefore, robust segmentation approaches can enhance the feature-extraction process. Validation of the segmentation was not performed in this study; rather, the importance of the effect of the devised features in identifying the underlying pathology was investigated, and histogram-based analysis of the CXR images belonging to the normal, COVID-19, LO, and VP groups clearly suggested varying natural pixel distributions. This motivated us to incorporate features, including mean, standard deviation, skewness, and percentile, based on the filtered images.
The Sato filter-based images clearly indicated that the COVID-19 images had high filter coefficients only at prominent boundaries such as the lungs, whereas other bone structures were only visible. In contrast, the LO and VP versions of the Sato filtered images clearly revealed the spine and rib cages but at different degrees of visibility. Qualitative observations were further substantiated using filtered images during feature extraction and ML model training, as noted in this study. Feature selection approaches were used in this study; however, the results did not improve with the finest features. Hence, we restricted the study to ML training using complete 35 feature vectors for each subject. The comparison and validation of binary and multi-classifications provided insightful inferences regarding the textural and vessel-like features. In the case of 4-class classification normal images were more efficiently classified than others, and all other pathologies were confused with the normal images. This might be because of several reasons, one of which is the presence of a high number of normal images supporting the training process and the rich texture and vessel information available in the normal images. The RF ML model outperformed the LO classification with higher accuracy during the 3-class classification of LO, VP, and COVID-19, which might reflect the inference that the LO might represent contrasting texture or vessel information or both combined than the other two pathologies. Sato filtered images of COVID-19 were revealed all structures, while the VP revealed prominent structures only. In the case of 2-class classification, it was noticed that COVID-19 was differentiated from VP with high TPs with both ML models and even higher with the RF model. This might be due to the clear variation in the Sato-filtered images of COVID-19, which had a relatively low presence of coefficient values and very rich information structures in the VP images of the filtered version. The COVID-19 comparison with LO seems to be affected by fewer TP’s as Sato-filtered images do not reveal significantly rich structures as those seen in VP images, leading to a greater number of FP’s with COVID-19. In the 2-class classification the RF model seems to be categorized more efficiently than the DT model.
Recently, segregation of COVID-19 from other pathologies, including normal, using CXR images has been performed using DL methods in a wide range of studies [13]. An Unscented Kalman Filter was used for epidemiological parameters belonging to the COVID-19 data to differentiate COVID-19 by addressing non-Gaussian nature and nonlinearity effects [25]. The transfer learning-based DL approach was attempted with the aid of pre-trained networks, such as Inception, VGG19, and ResNet. A DL technique that requires a large amount of labeled information for training purposes has also been proposed [24]. The results of this study and related comparison studies are cited in references [27–30]. These studies were primarily implemented using DL techniques, and all images were considered.
The primary focus of this work is the investigation of handcrafted features from high-pixel-intensity regions using the fusion of GLCM and three categories of vessel identification techniques. The results, especially from the ML-based categorization of different classes, clearly demonstrate that CXR images of normal and other pathologies manifest peculiar identities or require fusion with other inherently sensitive information. Although the two categories of ML models considered in this study were based on the same basic principles, the search initiated by the RF technique provided superior results in almost all comparisons. The RF model employed with the extracted feature set outperformed DL-based approaches, as shown in Table 3. The computing of the different stages of the proposed pipeline was done using a Desktop with Intel Core I5, Python 3.7, and SK-Learn ML packages.
6 Conclusions and Future Scope
The efficient design of feature extraction and ML models with image analysis techniques could assist physicians and radiologists in accurately screening for COVID-19. Information revealing high pixel intensity regions in CXR images with the aid of texture and edge-like structures revealed by vessel identification feature extraction techniques is insightful. However, exploring the nature of handcrafted features is time-consuming and can be treated as a limitation of this study. In the future, researchers can explore hosts with other texture features to categorize pathologies. Hence, the fusion of texture and vessel information may be viable for the design of efficient and effective diagnostic tools.
Transfer learning techniques can be applied to leverage pre-trained models on large-scale medical image datasets. By fine-tuning these models using the proposed CXR dataset, the classification performance can be further improved. Transfer learning can also help address the challenge of limited annotated COVID-19 data by leveraging knowledge learned from other medical imaging tasks. The future scope of the paper includes expanding the dataset, exploring deep learning techniques, integrating multiple imaging modalities, ensuring interpretability, conducting clinical validation and developing user-friendly tools. Collaboration between researchers, radiologists, and medical professionals is essential to ensure the successful implementation and adoption of the proposed technique. Collaboration can help in refining the methodology, addressing practical challenges, and validating the results in clinical practice.
Acknowledgement: The authors express their gratitude towards the Princess Nourah bint Abdulrahman University for providing funding support to this work. All the authors are equally responsible in successful completion of the work.
Funding Statement: This work was supported by Princess Nourah bint Abdulrahman University Researchers Supporting Project Number (PNURSP2023R239), Princess Nourah bint Abdulrahman University, Riyadh, Saudi Arabia.
Author Contributions: Conceptualization, S. M. B., and S. A. C.; methodology, S. M. B., S. A. C. and V. H. C.; software, S. M. B., M. A. E., and S. P. P.; validation, S. M. B., S. H. M., and S. P. P.; formal analysis, S. M. B., M. A. E., and S. H. M.; investigation, S. M. B.,V. H. C., and S. H. M., and S. A. C.; writing, original draft preparation, S. M. B., M. A. E., S. H. M., S. P. P., V. H. C., and S. A. C.; supervision, S. M. B., V. H. C. and S. A. C.
Availability of Data and Materials: The data is available with the author and can be revealed on request from the readers as this work is planned to get patented in the future.
Conflicts of Interest: The authors declare that they have no conflicts of interest to report regarding the present work.
References
1. Chowdhury, M. E. H., Rahman, T., Khandakar, A., Mazhar, R., Kadir, M. A. et al. (2020). Can AI help in screening viral and COVID-19 pneumonia? IEEE Access, 8, 132665–132676. [Google Scholar]
2. Cucinotta, D., Vanelli, M. (2020). WHO declares COVID-19 a pandemic. Acta Bio-Medica: Atenei Parmensis, 91(1), 157–160. [Google Scholar] [PubMed]
3. Rahman, T., Khandakar, A., Qiblawey, Y., Tahir, A., Kiranyaz, S. et al. (2021). Exploring the effect of image enhancement techniques on COVID-19 detection using chest X-ray images. Computers in Biology and Medicine, 132, 104319. [Google Scholar] [PubMed]
4. Qin, C., Yao, D., Shi, Y., Song, Z. (2018). Computer-aided detection in chest radiography based on artificial intelligence: A survey. BioMedical Engineering OnLine, 17(1), 1–23. [Google Scholar]
5. Pham, H. H., Le, T. T., Tran, D. Q., Ngo, D. T., Nguyen, H. Q. (2021). Interpreting chest X-rays via CNNs that exploit hierarchical disease dependencies and uncertainty labels. Neurocomputing, 437, 186–194. [Google Scholar]
6. Nishio, M., Noguchi, S., Matsuo, H., Murakami, T. (2020). Automatic classification between COVID-19 pneumonia, non-COVID-19 pneumonia, and the healthy on chest X-ray image: Combination of data augmentation methods. Scientific Reports, 10(1), 1–6. [Google Scholar]
7. Degerli, A., Ahishali, M., Yamac, M., Kiranyaz, S., Chowdhury, M. E. H. et al. (2021). COVID-19 infection map generation and detection from chest X-ray images. Health Information Science and Systems, 9(1), 1–16. [Google Scholar]
8. Wang, G., Liu, X., Shen, J., Wang, C., Li, Z. et al. (2021). A deep-learning pipeline for the diagnosis and discrimination of viral, non-viral and COVID-19 pneumonia from chest X-ray images. Nature Biomedical Engineering, 5(6), 509–521. https://doi.org/10.1038/s41551-021-00704-1 [Google Scholar] [PubMed] [CrossRef]
9. Jaiswal, K., Tiwari, P., Kumar, S., Gupta, D., Khanna, A. et al. (2019). Identifying pneumonia in chest X-rays: A deep learning approach. Measurement, 145(3), 511–518. [Google Scholar]
10. Kallianos, K., Mongan, J., Antani, S., Henry, T., Taylor, A. et al. (2019). How far have we come? Artificial intelligence for chest radiograph interpretation. Clinical Radiology, 74(5), 338–345. [Google Scholar] [PubMed]
11. Ibrahim, U., Ozsoz, M., Serte, S., Al-Turjman, F., Yakoi, P. S. (2021). Pneumonia classification using deep learning from chest X-ray images during COVID-19. Cognitive Computation, 2021, 1–13. [Google Scholar]
12. Soda, P., D’Amico, N. C., Tessadori, J., Valbusa, G., Guarrasi, V. et al. (2021). AIforCOVID: Predicting the clinical outcomes in patients with COVID-19 applying AI to chest-X-rays. An Italian multicentre study. Medical Image Analysis, 74(2), 102216. [Google Scholar] [PubMed]
13. Alam, N. A. A., Ahsan, M., Based, M. A., Haider, J., Kowalski, M. (2021). COVID-19 detection from chest X-ray images using feature fusion and deep learning. Sensors, 21(4), 1480. [Google Scholar] [PubMed]
14. Waheed, A., Goyal, M., Gupta, D., Khanna, A., Al-Turjman, F. et al. (2020). CovidGAN: Data augmentation using auxiliary classifier GAN for improved COVID-19 detection. IEEE Access, 8(14), 91916–91923. [Google Scholar] [PubMed]
15. Otsu, N. (1979). A threshold selection method from gray-level histograms. IEEE Transactions on Systems, Man, and Cybernetics, 9(1), 62–66. [Google Scholar]
16. Hussain, L., Nguyen, T., Li, H., Abbasi, A. A., Lone, K. J. et al. (2020). Machine-learning classification of texture features of portable chest X-ray accurately classifies COVID-19 lung infection. BioMedical Engineering OnLine, 19(1), 1–18. [Google Scholar]
17. Wu, Y., Schmidt, A., Hernández-Sánchez, E., Molina, R., Katsaggelos, A. K. (2021). Combining attention-based multiple instance learning and gaussian processes for CT hemorrhage detection. In: Medical image computing and computer assisted intervention–MICCAI 2021, pp. 582–591. Cham: Springer. [Google Scholar]
18. Kuruoglu, E. E., Li, Y. (2021). Modelling time-varying epidemiological parameters for COVID-19. Ercim News, 124, 5–26. [Google Scholar]
19. Rodrigues, M. B., da Nóbrega, R. V. M., Alves, S. S. A., Filho, P. P. R., Duarte, J. B. F. et al. (2018). Health of things algorithms for malignancy level classification of lung nodules. IEEE Access, 6, 18592–18601. [Google Scholar]
20. El Asnaoui, K., Chawki, Y., Idri, A. (2021). Automated methods for detection and classification pneumonia based on X-ray images using deep learning. Artificial Intelligence and Blockchain for Future Cybersecurity Applications, 90, 257–284. [Google Scholar]
21. Oh, Y., Park, S., Ye, J. C. (2020). Deep learning COVID-19 features on CXR using limited training data sets. IEEE Transactions on Medical Imaging, 39(8), 2688–2700. [Google Scholar] [PubMed]
22. Le, D. N., Parvathy, V. S., Gupta, D., Khanna, A., Rodrigues, J. J. P. C. et al. (2021). IoT enabled depthwise separable convolution neural network with deep support vector machine for COVID-19 diagnosis and classification. International Journal of Machine Learning and Cybernetics, 12, 3235–3248. [Google Scholar] [PubMed]
23. Sekeroglu, B., Ozsahin, I. (2020). Detection of COVID-19 from chest X-ray images using convolutional neural networks. SLAS Technology, 25(6), 553–565. [Google Scholar] [PubMed]
24. Wu, Y., Schmidt, A., Hernández-Sánchez, E., Molina, R., Katsaggelos, A. K. et al. (2021). Combining attention-based multiple instance learning and gaussian processes for CT hemorrhage detection. International Conference on Medical Image Computing and Computer-Assisted Intervention, Cham, Strasbourg, France, Springer. [Google Scholar]
25. Wu, C. M., Chen, Y. C., Hsieh, K. S. (1992). Texture features for classification of ultrasonic liver images. IEEE Transactions on Medical Imaging, 11(2), 141–152. [Google Scholar] [PubMed]
26. Bianconi F., Fernández A., Smeraldi F., Pascoletti G. (2021). Colour and texture descriptors for visual recognition: A historical overview. Journal of Imaging, 7(11), 245. [Google Scholar] [PubMed]
27. Chouhan, V., Singh, S. K., Khamparia, A., Gupta, D., Tiwari, P. et al. (2020). A novel transfer learning based approach for pneumonia detection in chest X-ray images. Applied Sciences, 10(2), 559. [Google Scholar]
28. Dash S., Jena U. R. (2017). Multi-resolution Laws’ Masks based texture classification. Journal of Applied Research and Technology, 15(6), 571–582. [Google Scholar]
29. Parah, S. A., Javaid, A. K., Bellavista, P., Loan, N. A., Bhat, G. M. et al. (2021). Efficient security and authentication for edge-based Internet of Medical Things. IEEE Internet of Things Journal, 8(21), 15652–15662. [Google Scholar] [PubMed]
30. Sharma, M., Singh, S. (2001). Evaluation of texture methods for image analysis. The Seventh Australian and New Zealand Intelligent Information Systems Conference, Perth, Western Australia. [Google Scholar]
31. Thippa Reddy, G., Praveen Kumar Reddy, M., Lakshmanna, K., Rajput, D. S., Kaluri, R. et al. (2020). Hybrid genetic algorithm and a fuzzy logic classifier for heart disease diagnosis. Evolutionary Intelligence, 13, 185–196. [Google Scholar]
32. Karakuş, O., Kuruoğlu, E. E., Altınkaya, M. A. (2019). Generalized bayesian model selection for speckle on remote sensing images. IEEE Transactions on Image Processing, 28(4), 1748–1758. [Google Scholar] [PubMed]
33. Chang, C. Y., Bhattacharya, S., Raj Vincent, P. M. D., Lakshmanna, K., Srinivasan, K. et al. (2021). An efficient classification of neonates cry using extreme gradient boosting-assisted grouped-support-vector network. Journal of Healthcare Engineering, 2021, 7517313. [Google Scholar] [PubMed]
34. Latha, M., Kavitha, G. (2018). Segmentation and texture analysis of structural biomarkers using neighbourhood-clustering-based level set in MRI of the schizophrenic brain. Magnetic Resonance Materials in Physics, Biology and Medicine, 31(4), 483–499. [Google Scholar]
35. Kumar, R., Srivastava, R., Srivastava, S. (2015). Detection and classification of cancer from microscopic biopsy images using clinically significant and biologically interpretable features. Journal of Medical Engineering, 2015, 457906. [Google Scholar] [PubMed]
36. Lakshmanna, K., Khare, N. (2016). Constraint-based measures for DNA sequence mining using group search optimization algorithm. International Journal of Intelligent Engineering and Systems, 9(3), 91–100. [Google Scholar]
37. Dourado, C. M. J. M., da Silva, S. P. P., da Nobrega, R. V. M., Rebouças Filho, P. P., Muhammad, K. et al. (2021). An open IoHT-based deep learning framework for online medical image recognition. IEEE Journal on Selected Areas in Communications, 39(2), 541–548. [Google Scholar]
38. Krishnamurthy, R. K., Radhakrishnan, S., Abdul Kadh, K. M. (2021). Particle swarm optimization-based liver disorder ultrasound image classification using multi-level and multi-domain features. International Journal of Imaging Systems and Technology, 31(3), 1366–1385. [Google Scholar]
39. Khan, A. I., Shah, J. L., Bhat, M. M. (2020). CoroNet: A deep neural network for detection and diagnosis of COVID-19 from chest X-ray images. Computer Methods and Programs in Biomedicine, 196, 105581. [Google Scholar]
40. Hasoon, J. N., Fadel, A. H., Hameed, R. S., Mostafa, S. A., Khalaf, B. A. et al. (2021). COVID-19 anomaly detection and classification method based on supervised machine learning of chest X-ray images. Results in Physics, 31, 105045. [Google Scholar] [PubMed]
41. Kaluri, R., Rajput, D. S., Xin, Q., Lakshmanna, K., Bhattacharya, S. et al. (2020). Roughsets-based approach for predicting battery life in IoT. Intelligent Automation & Soft Computing, 27(2), 453–469. [Google Scholar]
42. Hu, Q., Gois, F. N. B., Costa, R., Zhang, L., Yin, L. et al. (2022). Explainable artificial intelligence-based edge fuzzy images for COVID-19 detection and identification. Applied Soft Computing, 123, 108966. [Google Scholar] [PubMed]
43. Hemdan, E. E. D., Shouman, M. A., Karar, M. E. (2021). COVIDX-Net: A framework of deep learning classifiers to diagnose COVID-19 in X-ray images. Intelligent Automation & Soft Computing, 27(2), 453–469. [Google Scholar]
44. Ohata, E. F., Bezerra, G. M., das Chagas, J. V. S., Neto, A. V. L., Albuquerque, A. B. et al. (2021). Automatic detection of COVID-19 infection using chest X-ray images through transfer learning. IEEE/CAA Journal of Automatica Sinica, 8(1), 239–248. [Google Scholar]
45. Pal, M. (2007). Random forest classifier for remote sensing classification. International Journal of Remote Sensing, 26(1), 217–222. [Google Scholar]
46. Frangi, A. F., Niessen, W. J., Vincken, K. L., Viergever, M. A. (2006). Multiscale vessel enhancement filtering. In: Lecture notes in computer science, vol. 1496. Berlin, Heidelberg: Springer. [Google Scholar]
47. Sato, Y., Nakajima, S., Shiraga, N., Atsumi, H., Yoshida, S. et al. (1998). Three-dimensional multi-scale line filter for segmentation and visualization of curvilinear structures in medical images. Medical Image Analysis, 2(2), 143–168. [Google Scholar] [PubMed]
48. Meijering, E., Niessen, W., Weickert, J., Viergever, M. (2001). Evaluation of diffusion techniques for improved vessel visualization and quantification in three-dimensional rotational angiography. International Conference on Medical Image Computing and Computer-Assisted Intervention (MICCAI 2001), vol. 2208, pp. 177–185. Netherlands. [Google Scholar]
49. Lamy, J., Merveille, O., Kerautret, B., Passat, N., Vacavant, A. (2021). Vesselness filters: A survey with benchmarks applied to liver imaging. 25th International Conference on Pattern Recognition (ICPR), pp. 3528–3535. Milan, Italy. [Google Scholar]
50. Rodrigues, E. O., Rodrigues, L. O., Machado, J. H. P., Casanova, D., Teixeira, M. et al. (2022). Local-sensitive connectivity filter (LS-CFA post-processing unsupervised improvement of the frangi, hessian and vesselness filters for multimodal vessel segmentation. Journal of Imaging, 8(10), 291. [Google Scholar] [PubMed]
51. Bhattacharjee, R., Gupta, R. K., Das, B., Dixit, V. K., Gupta, P. et al. (2021). Penumbra quantification from MR SWI-DWI mismatch and its comparison with MR ASL PWI-DWI mismatch in patients with acute ischemic stroke. NMR in Biomedicine, 34(7), e4526. [Google Scholar] [PubMed]
52. Khawaja, A., Khan, T. M., Naveed, K., Naqvi, S. S., Rehman, N. U. et al. (2019). An improved retinal vessel segmentation framework using frangi filter coupled with the probabilistic patch based denoiser. IEEE Access, 7, 164344–164361. [Google Scholar]
53. Bhattacharya, S., Reddy Maddikunta, P. K., Pham, Q. V., Gadekallu, T. R., Krishnan, S. S. R. et al. (2021). Deep learning and medical image processing for coronavirus (COVID-19) pandemic: A survey. Sustainable Cities and Society, 65, 102589. [Google Scholar] [PubMed]
54. Saleem, K., Saleem, M., Ahmad, R. Z., Javed, A. R., Alazab, M. et al. (2023). Situation-aware BDI reasoning to detect early symptoms of COVID-19 using smart watch. IEEE Sensors Journal, 23(2), 898–905. [Google Scholar] [PubMed]
55. Singh Susaiyah, A. P., Pathan, S. P., Swaminathan, R. (2016). Classification of indirect immunofluorescence images using thresholded local binary count features. Current Directions in Biomedical Engineering, 2(1), 479–482. [Google Scholar]
56. Parvaze P. S., Ramakrishnan S. (2017). Extraction of multiple cellular objects in HEp-2 images using LS segmentation. IEIE Transactions on Smart Processing & Computing, 6(6), 401–408. [Google Scholar]
57. Suganthi, S. S., Ramakrishnan, S. (2014). Anisotropic diffusion filter based edge enhancement for segmentation of breast thermogram using level sets. Biomedical Signal Processing and Control, 10, 128–136. [Google Scholar]
58. Ramaniharan, A. K., Manoharan, S. C., Swaminathan, R. (2016). Laplace Beltrami eigen value based classification of normal and Alzheimer MR Images using parametric and non-parametric classifiers. Expert Systems with Applications, 59, 208–216. [Google Scholar]
59. Basha, S. M., Neto, A. V. L., Menezes, J. W. M., Chelloug, S. A., Elaziz, M. A. et al. (2022). Evaluation of weighted nuclear norm minimization algorithm for ultrasound image denoising. Wireless Communications and Mobile Computing, 2022, 3167717. [Google Scholar]
60. Shaik, M. B., Jinaga, B. C. (2020). Robust denoising technique for ultrasound images based on weighted nuclear norm minimization. International Conference on Innovative Computing and Communication, Advances in Intelligent Systems and Computing, 1087, 741–749. [Google Scholar]
61. Basha, S. M., Jinaga, B. C. (2012). A robust approach for qualitative compression in JPEG, 2000 standard. Asia Pacific Conference on Postgraduate Research in Microelectronics and Electronics, pp. 224–228. Hyderabad, India. [Google Scholar]
62. Basha, S. M., Jinaga, B. C. (2010). A novel response dependent image compression algorithm to reduce the nonlinear effects in color images using JPEG. IEEE Region 8 International Conference on Computational Technologies in Electrical and Electronics Engineering (SIBIRCON), pp. 122–125. Irkutsk, Russia. [Google Scholar]
63. Gadekallu, T. R., Khare, N., Bhattacharya, S., Singh, S., Maddikunta, P. K. R. et al. (2020). Early detection of diabetic retinopathy using PCA-firefly based deep learning model. Electronics, 9(2), 274. [Google Scholar]
64. Gadekallu, T. R., Khare, N., Bhattacharya, S., Singh, S., Maddikunta, P. K. R. (2020). Deep neural networks to predict diabetic retinopathy. Journal of Ambient Intelligence and Humanized Computing, 14, 5407–5420. [Google Scholar]
65. Parvaze, P. S., Bhattacharjee, R., Verma, Y. K., Singh, R. K., Yadav, V. et al. (2022). Quantification of radiomics features of peritumoral vasogenic edema extracted from fluid-attenuated inversion recovery images in glioblastoma and isolated brain metastasis, using T1-dynamic contrast-enhanced Perfusion analysis. NMR in Biomedicine, 36(5), e4884. [Google Scholar] [PubMed]
66. Parvaze, S., Bhattacharjee, R., Singh, A., Ahlawat, S., Patir, R. et al. (2023). Radiomics-based evaluation and possible characterization of dynamic contrast enhanced (DCE) perfusion derived different sub-regions of Glioblastoma. European Journal of Radiology, 159, 110655. [Google Scholar]
67. Sokolova M., Lapalme G. (2009). A systematic analysis of performance measures for classification tasks. Information Processing & Management, 45(4), 427–437. [Google Scholar]
68. Parah, S. A., Kaw, J. A., Bellavista, P., Loan, N. A., Bhat, GM. et al. (2020). Efficient security and authentication for edge-based Internet of Medical Things. IEEE Internet of Things Journal, 8(21), 15652–15662. [Google Scholar] [PubMed]
69. Basha, S. M., Neto, A. V. L., Alshathri, S., Elaziz, M. A., Mohisin, S. H. et al. (2022). Multithreshold segmentation and machine learning based approach to differentiate COVID-19 from viral pneumonia. Computational Intelligence and Neuroscience, 2022, 2728866.
Cite This Article
 Copyright © 2024 The Author(s). Published by Tech Science Press.
This work is licensed under a Creative Commons Attribution 4.0 International License , which permits unrestricted use, distribution, and reproduction in any medium, provided the original work is properly cited.
 Downloads
 Citation Tools