
 Submit a Paper
 Propose a Special lssue
 Open Access
ARTICLE

An Improved CREAM Model Based on DS Evidence Theory and DEMATEL
1 State Key Laboratory of Nuclear Power Safety Monitoring Technology and Equipment, Shenzhen, 518172, China
2 School of Automation Engineering, Shanghai University of Electric Power, Shanghai, 200090, China
3 School of Safety and Management Engineering, Hunan Institute of Technology, Hengyang, 421002, China
* Corresponding Author: Xiaoyan Su. Email:
(This article belongs to the Special Issue: Computer-Aided Uncertainty Modeling and Reliability Evaluation for Complex Engineering Structures)
Computer Modeling in Engineering & Sciences 2024, 138(3), 2597-2617. https://doi.org/10.32604/cmes.2023.031247
Received 25 May 2023; Accepted 17 July 2023; Issue published 15 December 2023
 View Full Text
 Download PDF
Abstract
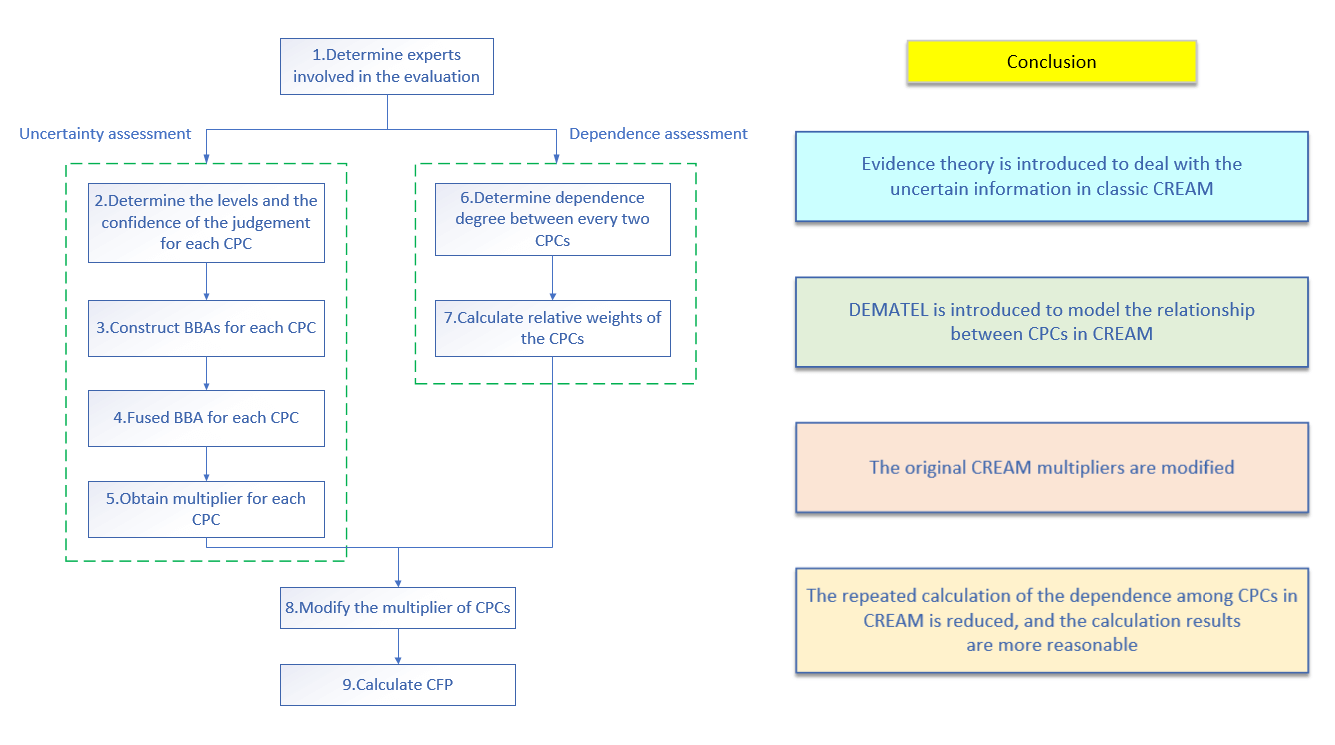
Cognitive Reliability and Error Analysis Method (CREAM) is widely used in human reliability analysis (HRA). It defines nine common performance conditions (CPCs), which represent the factors that may affect human reliability and are used to modify the cognitive failure probability (CFP). However, the levels of CPCs are usually determined by domain experts, which may be subjective and uncertain. What’s more, the classic CREAM assumes that the CPCs are independent, which is unrealistic. Ignoring the dependence among CPCs will result in repeated calculations of the influence of the CPCs on CFP and lead to unreasonable reliability evaluation. To address the issue of uncertain information modeling and processing, this paper introduces evidence theory to evaluate the CPC levels in specific scenarios. To address the issue of dependence modeling, the Decision-Making Trial and Evaluation Laboratory (DEMATEL) method is used to process the dependence among CPCs and calculate the relative weights of each CPC, thus modifying the multiplier of the CPCs. The detailed process of the proposed method is illustrated in this paper and the CFP estimated by the proposed method is more reasonable.Graphic Abstract
Keywords
Reliability evaluation for large complex systems is of great importance. Reliability assessment involves examining various factors that could lead to a certain system’s failure or malfunction and estimating the probability of those occurrences. The outcome of the assessment can assist people in determining whether they can depend on the system to function correctly, or need to make modifications to enhance its reliability. Reliability assessment has received wide attention and should be conducted in many fields, such as the power industry [1–3], social science [4–6], information systems [7,8], engineering design [9–11], and civil engineering [12,13].
Human reliability analysis (HRA) plays an important role in reliability evaluation for large complex systems. It qualitatively analyzes the impact of human error on system failures and quantitatively calculates human error probability (HEP), to reduce the occurrence of human failure events (HFE). HRA has become an indispensable part of the reliability evaluation for complex systems, such as nuclear power plants [14–16], the healthcare industry [17], maritime safety [18,19], computer science [20,21], and other engineering [22–24].
Cognitive Reliability and Error Analysis Method (CREAM), introduced by Hollnagel [25], is an important method of HRA, which focuses on the cognitive model that explains human behavior and emphasizes the influence of situational environment on human errors. It is widely used in analyzing maritime accidents [26–28], evaluating traffic safety [29–31], assessing the risk of nuclear power plants [32,33], and other fields.
However, in the process of calculating cognitive failure probability (CFP) based on CREAM, the determination of common performance condition (CPC) levels mainly depends on the opinions of experts, which may contain uncertain information. How to effectively express and deal with the uncertainty of expert opinions is a problem that urgently needs to be solved. In addition, the classical CREAM does not take into account the dependence among CPCs. Therefore, the dependence of CPCs may be repeatedly calculated, resulting in overestimation or underestimation of the results.
Yang et al. [34] improved the IF-THEN rules and gave a new suggestion on the relationship between CPCs and the control modes. Although Bayesian networks and IF-THEN rules have significant effects in dealing with uncertainty problems, the conditional probability table of the former requires a large amount of prior data, and the number of association rules required by the latter increases exponentially as the number of impact factors (and their association states) increases. Sun et al. [35] used the context impact index (CII) to indicate the comprehensive level of CPC and calculate HEP. However, the process of obtaining CII needs further investigation. Yao et al. [33] applied fuzzy theory to model the uncertain information in the CREAM method and used AHP to calculate the relative importance of CPCs. However, the mutual influence of CPCs is not taken into account in this method, which may lead to the deviation of the results. Lin et al. [32] used a hesitant fuzzy matrix (HFM) to represent the experts’ evaluation opinions, making the evaluation process of CPCs more reasonable and effective. However, the quantification of human reliability is complicated, and the construction of HFM needs further investigation due to the lack of relevant data.
Many researches were conducted to model uncertain information [36–38]. DS evidence theory is one of the attractive theories in the uncertainty modeling field [39–43]. DS evidence theory was proposed by Dempster [44] and further developed by Shafer [45]. It cannot only represent the uncertainty in evaluations from experts, but also represent the confidence of the experts. Also, it provides a fusion rule called Dempster’s rule which could put emphasis on the agreement of the evidence and reduce the uncertainty. Due to its ability to handle uncertainty, DS evidence theory is widely used in many fields, such as pattern classification [46–48], information fusion [49], decision-making [50,51], etc.
DEMATEL is an approach that uses a matrix to describe the relationships among elements of a system. Through in-depth analysis of the logical relationship between every two elements of the system, it can calculate the total influence of a certain element on other elements and the total degree to which a certain element is influenced by other elements in the system, thus determining the causal relationship and the importance of each element in the system, which is widely used to extract key elements [52]. DEMATEL is widely used in supply chain management [53–56], waste management [57–59], disaster risk management [60,61] and other fields.
In this paper, we propose an improved CREAM method based on DS evidence theory and DEMATEL. DS evidence theory is used to express and process the uncertain information in the assessment of CPC levels. DEMATEL is used to model the dependence among CPCs and calculate CFP.
This paper is organized as follows. Section 2 introduces the basic theories of CREAM, D-S evidence theory, and DEMATEL. Section 3 describes the procedure of the method. Section 4 illustrates the use of the method through the case study. Section 5 is the summary.
2.1 CREAM [25]
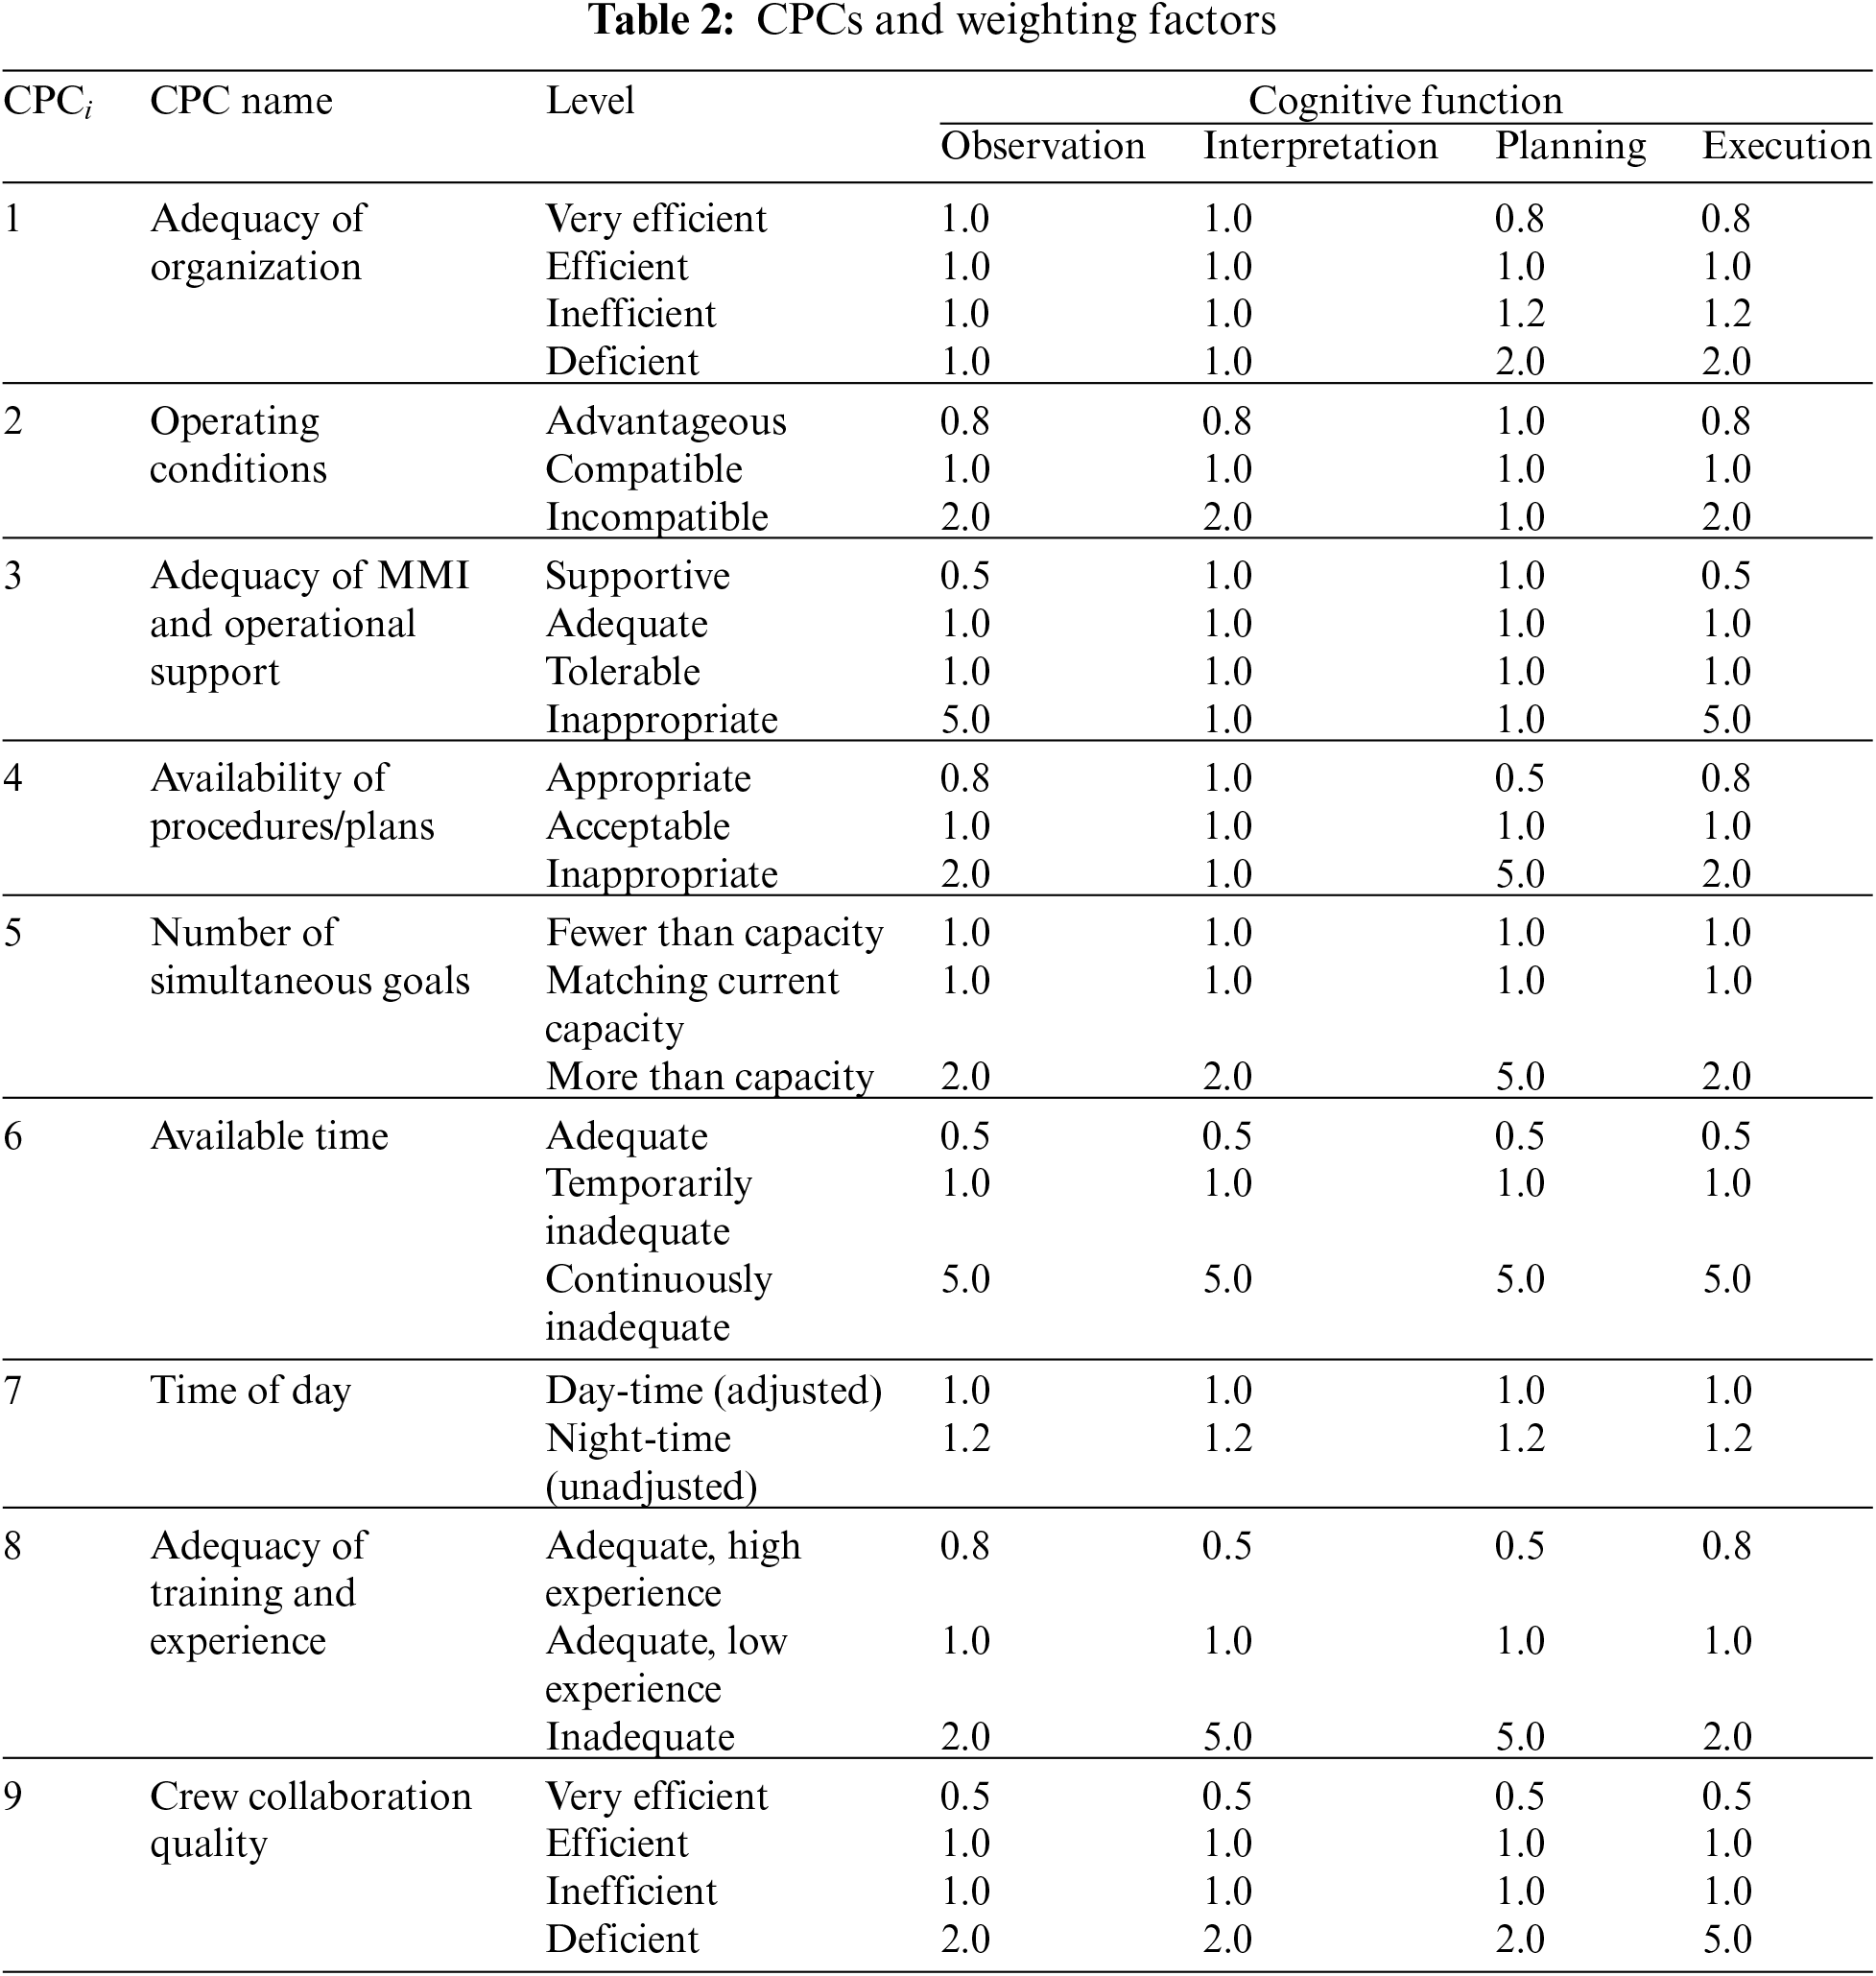
CREAM’s quantitative HEP prediction methods include primary methods and extended methods. The basic method involves determining the expected effect of common performance conditions (CPCs) on the performance reliability to get a rough probability interval, while the extended method can obtain specific probability values. This paper mainly describes the extended method. The extended method divides human cognitive functions into four categories: observation, interpretation, planning, and execution. Each type of cognitive function has several failure types. Hollnagel explains 13 general failure types and the fundamental values and upper and lower bounds of the failure probability, as shown in Table 1 (source from Table 9 in chapter 9, section 3.3 of Ref. [25]). Table 2 (source from Table 12 in chapter 9, section 3.4 of Ref. [25]) provides nine CPCs, which are respectively 1-“Adequacy of an organization”, 2-“Working conditions”, 3-“Adequacy of MMI and operational support”, 4-“Availability of procedures/plans”, 5-“Number of simultaneous goals”, 6-“Available time”, 7-“Time of day”, 8-“Adequacy of training and experience”, and 9-“Crew collaboration quality”. The extended method of CREAM’s HEP prediction involves the following four steps:
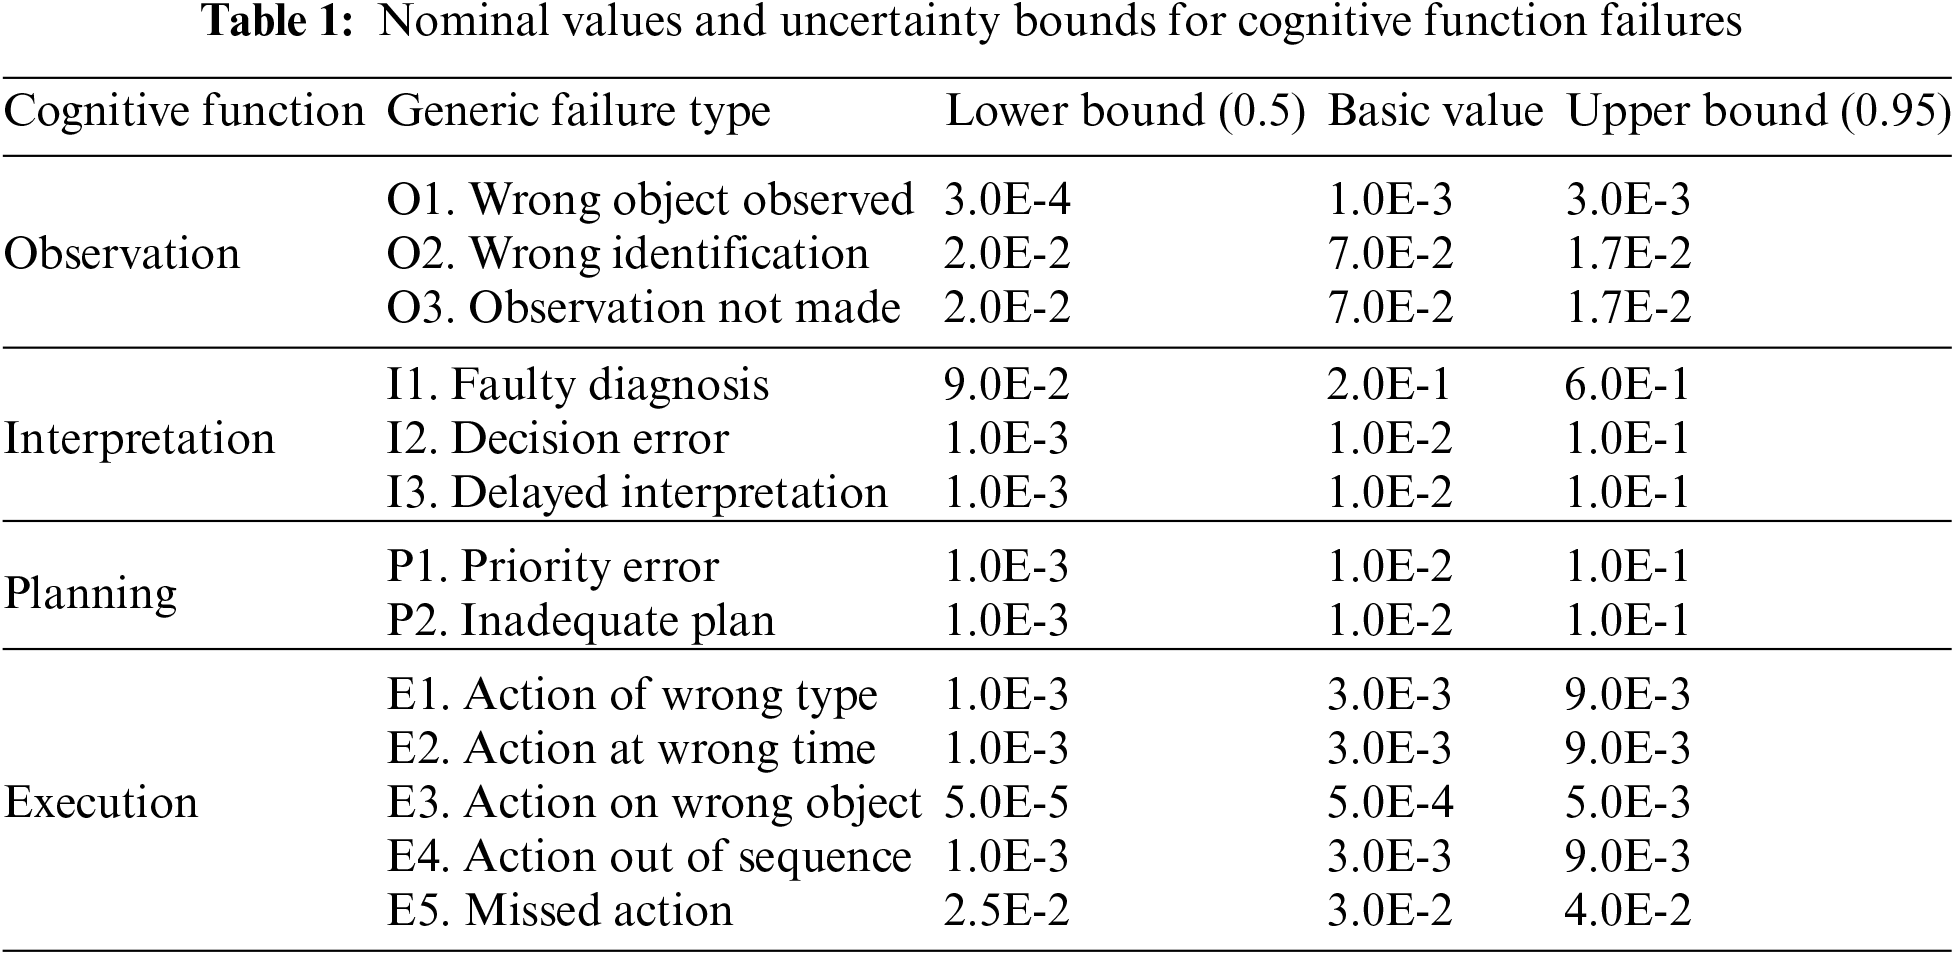
Step 1. Analyze human error events and determine which cognitive activities are involved. Then, each cognitive activity is analyzed to determine the most probable types of cognitive function failure in each cognitive activity, and their corresponding basic CFP from Table 1, denoted as CFP
Step 2. Evaluate the situational environment of each cognitive activity to determine the levels of CPCs. Table 2 provides the level factors of CPCs for the four cognitive functions. The product of all nine level factors is defined as the combined CPC level factor, denoted as
Step 3. Calculate the cognitive failure probability (CFP) of each cognitive activity. Assuming that there are
where CFP
Step 4. Determine the total human error probability (HEP) [25]. The equation is as follows:
where CFP
2.2 Dempster-Shafer Evidence Theory [44,45]
Dempster-Shafer evidence theory is effective to handel uncertainty, and has been extended to complex domain [62,63], which are applied in various fields [64–66].
Definition 2.1. Let
The mass
Definition 2.2. Suppose that a BBA is denoted by
where
Definition 2.3. Proposition X and Y are combined into a new proposition C, and the belief level of the new proposition C can be calculated. The measure of conflict between X and Y, also known as the conflict coefficient, is denoted as K and is given by the following equation:
and the mass function of proposition C is
Dempster’s rule use the conjunction operation as its numerator and a normalization factor of
When making decisions, a belief function needs to be transformed into a probability function [68].
Definition 2.4. Let
where
2.3 Decision-Making Trial and Evaluation Laboratory (DEMATEL)
The basic theory of DEMATEL is introduced in the following steps [69,70]:
Step 1. A group of experts evaluated the relationship between every two alternatives, resulting in a direct relation matrix
Step 2. The matrix M is normalized using Eqs. (8) and (9) to obtain the normalized direct relation matrix N.
where
Step 3. The total relation matrix T is transformed from the matrix N according to Eq. (10), which represents the comprehensive influence relationship among alternatives.
The sum of the elements in each row of matrix T is called influence degree R, which indicates the comprehensive impact of the corresponding alternative on all other alternatives. The sum of the elements in each column of matrix T is called the affected degree C, which indicates the corresponding alternative is affected comprehensively by other alternatives.
Step 4. The value of R − C indicates the degree to which one alternative has an impact on all other alternatives. The higher the value, the greater the impact on the other alternatives. The value of R + C represents the degree of dependence between one alternative and all other alternatives. The higher the value, the stronger the dependence between the alternative and other alternatives.
3 An Improved CREAM Model Based on DS Evidence Theory and DEMATEL
To make the proposed method more intuitive and easy to understand, the steps of which are constituted in Fig. 1. And the procedures are elaborated in more detail below:

Figure 1: Flow chart of the proposed method
Step 1. Determine experts involved in the evaluation
Select several experts with expertise and experience in nuclear power plants to form a team to participate in the assessment. There are three experts involved.
Step 2. Determine the levels and the confidence of the judgement for each CPC
Experts may not be completely certain about the level of CPC in a specific scenario, so their judgments are often accompanied by ambiguity and uncertainty. Evidence theory allows experts to assign different levels for a CPC and suggest ratios to represent the relative probabilities of different levels.
To express confidence in their judgments, experts use a scale ranging from 0 to 1, corresponding to seven confidence levels, where 1 represents “absolutely confident”, 0.8 indicates “mostly confident”, 0.6 indicates “fairly confident”, 0.4 indicates “only some confident”, 0.2 indicates “mostly not confident”, 0 indicates “no confidence at all” and other values (i.e., 0.1, 0.3, 0.5, 0.7 and 0.9) represent confidence levels between these seven levels. It allows experts to make flexible judgments in the face of uncertain situations.
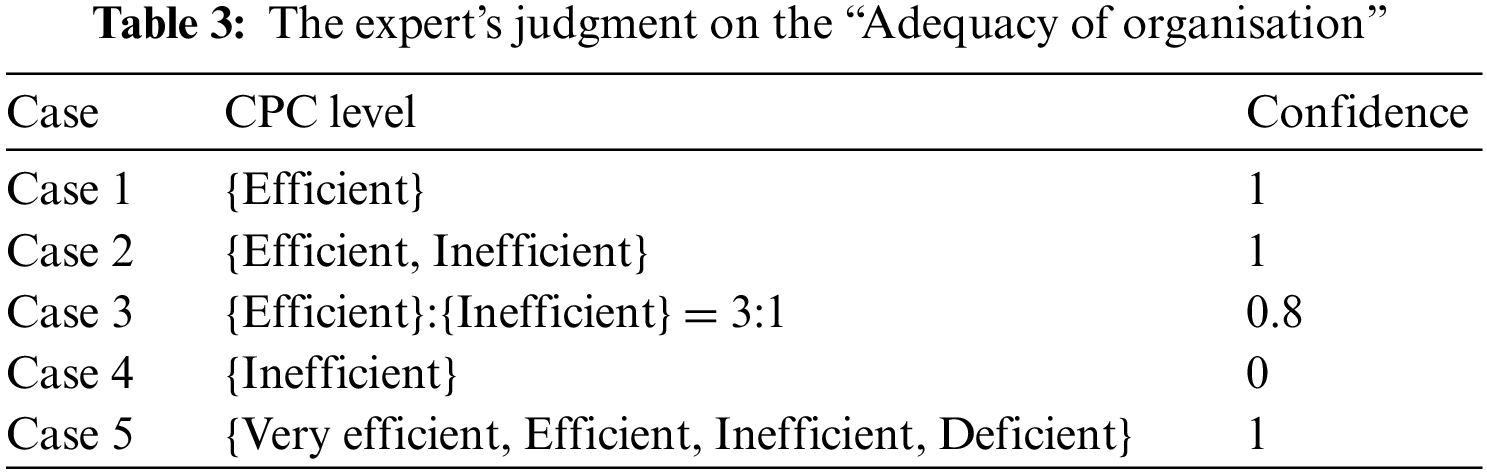
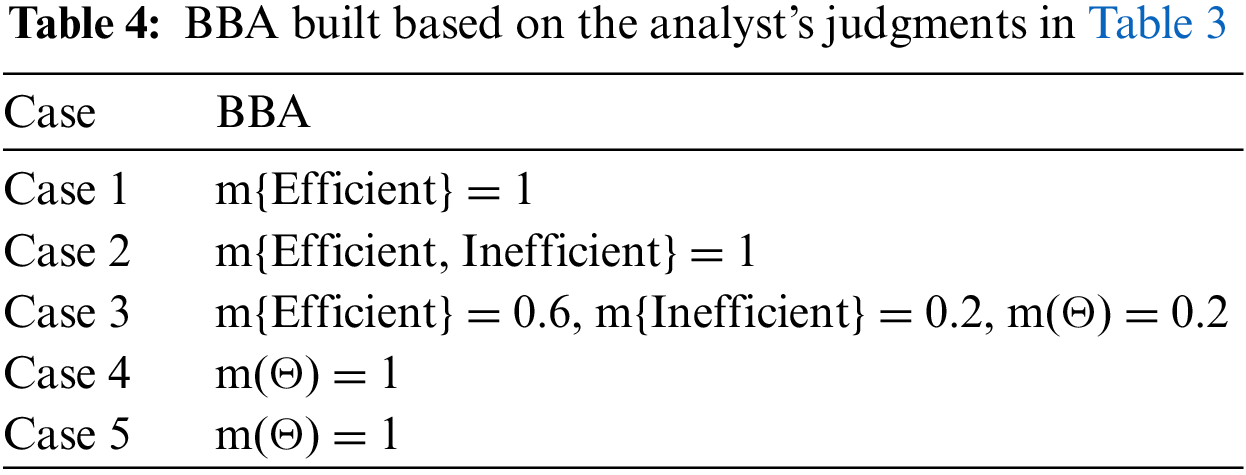
Table 3 gives examples of experts’ judgments on “Adequacy of organization”. Case 1 indicates that experts have absolute confidence that the CPC level is “Efficient”. In case 2, the expert is confident enough that the CPC level is either “Efficient” or “Inefficient,” but is unsure which is more likely. Case 3 represents that the expert is three times more likely to consider “Efficient” than “Inefficient”, with a confidence level of 0.8. Cases 4 and 5 both indicate that the expert is ignorant of the current situation.
Step 3. Construct BBAs for each CPC
The levels of each CPC constitutes a discernment frame. For instance, consider the discernment frame
where
For example, the BBA of Case 3 in Table 3 can be calculated as:
Based on the judgments in Table 3, the BBA for each case can be constructed, as shown in Table 4. It is evident from Table 4 that Case 4 and Case 5 are the same, both representing the most uncertain situation.
Step 4. Fused BBA for each CPC
For each CPC, the judgments given by the experts are fused, and the fusion rules are based on Eqs. (5) and (6).
Step 5. Obtain multiplier for each CPC
After the fusion of BBA, the confidence of the final result can be obtained, as calculated in Eq. (12):
In the proposed method,
The fused BBA can be used to calculate the probability of each level of CPCs using the above equation. The multipliers
Step 6. Determine dependence degree between every two CPCs
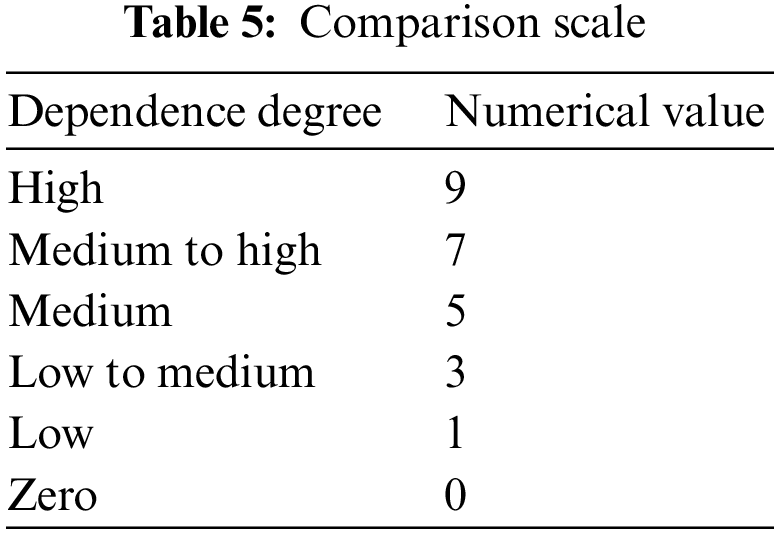
Experts with rich prior knowledge converted the language tag variable into fuzzy numbers to evaluate the relationship between every two CPCs. These values describe the relationship between sets of paired CPCs, the bigger the value the stronger the dependence. If the value equals 0, it means that no dependence exists between these two CPCs. In this paper, numerical value (comparison scale) varying from 0 to 9 is adopted [71] since it is better fit to represent the dependence degree among the nine CPCs in CREAM, and it is divided into 6 levels, where 9 means “high”, 7 means “medium to high”, 5 means “medium”, 3 means “low to medium”, 1 means “low” and 0 means “zero”, as shown in Table 5.
Step 7. Calculate the relative weights of the CPCs
Convert experts’ judgments into an initial input matrix in DEMATEL, known as the direct relation matrix. The relative weight
The value of R − C is used to indicate the degree of influence of one alternative on all other alternatives. Alternatives having higher values of R − C have higher influence on others and are assumed to have higher priority and those having lower values of R − C receive more influence from others and are assumed to have lower priority. In contrast, the value of R + C is used to indicate the degree of dependence between one alternative and all other alternatives. Alternatives having higher values of R + C are more correlated with others and those having less values of R + C are less correlated with others. Therefore, R − C is a better criterion for alternative prioritization [72].
We adopt the processing method of the R − C in [71], which can handle the case when there are negative values of R − C. It satisfies the conditions: the higher the values of R − C, the larger the weights assigned to the corresponding factors. The calculation equation is as follows, The R − C is offset according to Eq. (14), and the weights of factors are calculated according to Eq. (15) and see [71] for more details.
where
Step 8. Modify the multiplier of CPCs
The CPC multipliers
The basic principle of Eq. (16) is that if a CPC contains more independent information, its modified multiplier will be larger, that is, it will be closer to the initial multiplier of classic CREAM. The less independent information a CPC contains, the closer the modified multiplier is to 1, that is, the smaller the effect on modification of HEP. When all the CPCs are independent, Eq. (16) will be compatible with the classic CREAM. See [71] for more details.
Step 9. Calculate CFP
Calculate CFP according to Eq. (1) in Section 2.1.
CREAM defines cognitive functions as the basis for thinking and decision-making into four categories: observation, interpretation, planning, and execution. Each typical cognitive activity can then be described in terms of which combination of the four cognitive functions it requires. As shown in Table 1, the cognitive function failures are defined relative to the four cognitive functions. Among them, the possible causes of the failure type “Wrong identification” are a mistaken cue or partial identification.
In this study, “observation” in four cognitive functions and “Wrong identification” in failure types are taken as the assessment object. Table 1 shows that CFP
4.1 Steps of the Proposed Method
Step 1. Determine experts involved in the evaluation
Three experts participate in the evaluation, all of whom are selected in the HRA field and have professional experience and expertise in nuclear power plants.
Step 2. Determine the levels and the confidence of the judgment for each CPC
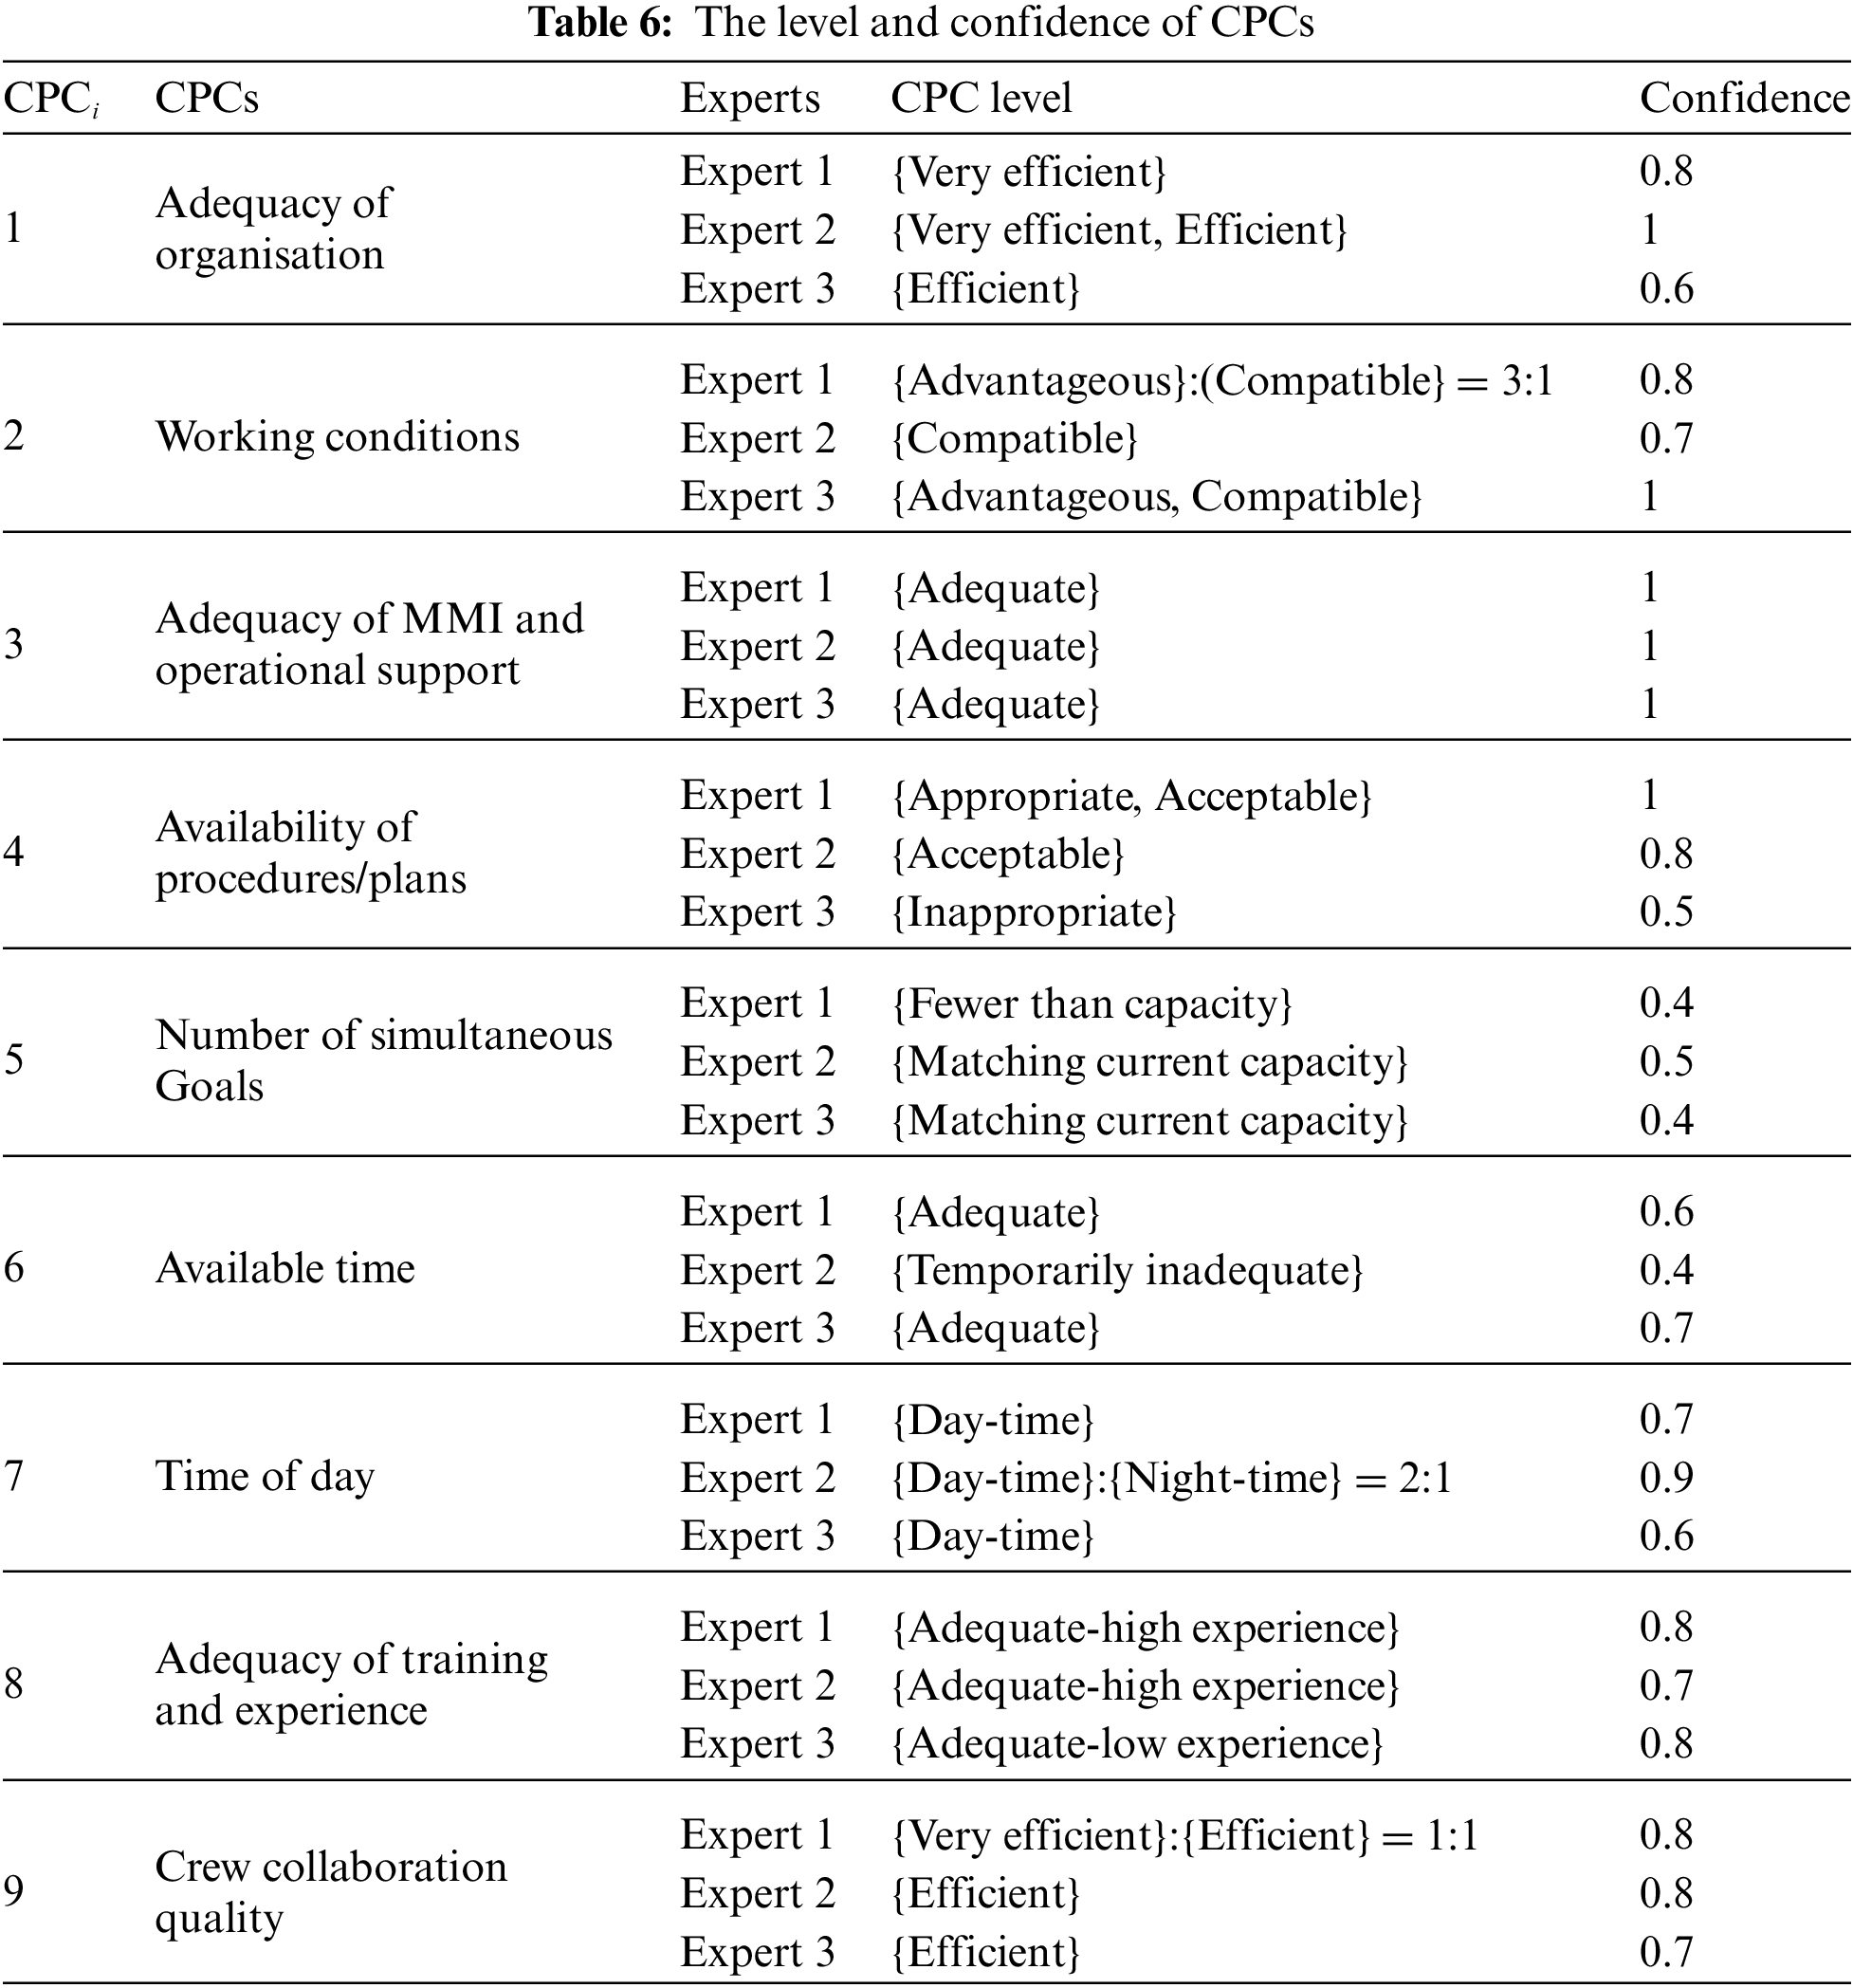
According to Table 2, the experts assess the event reports and suggest the level and confidence of CPCs, as shown in Table 6.
Step 3. Construct BBAs for each CPC
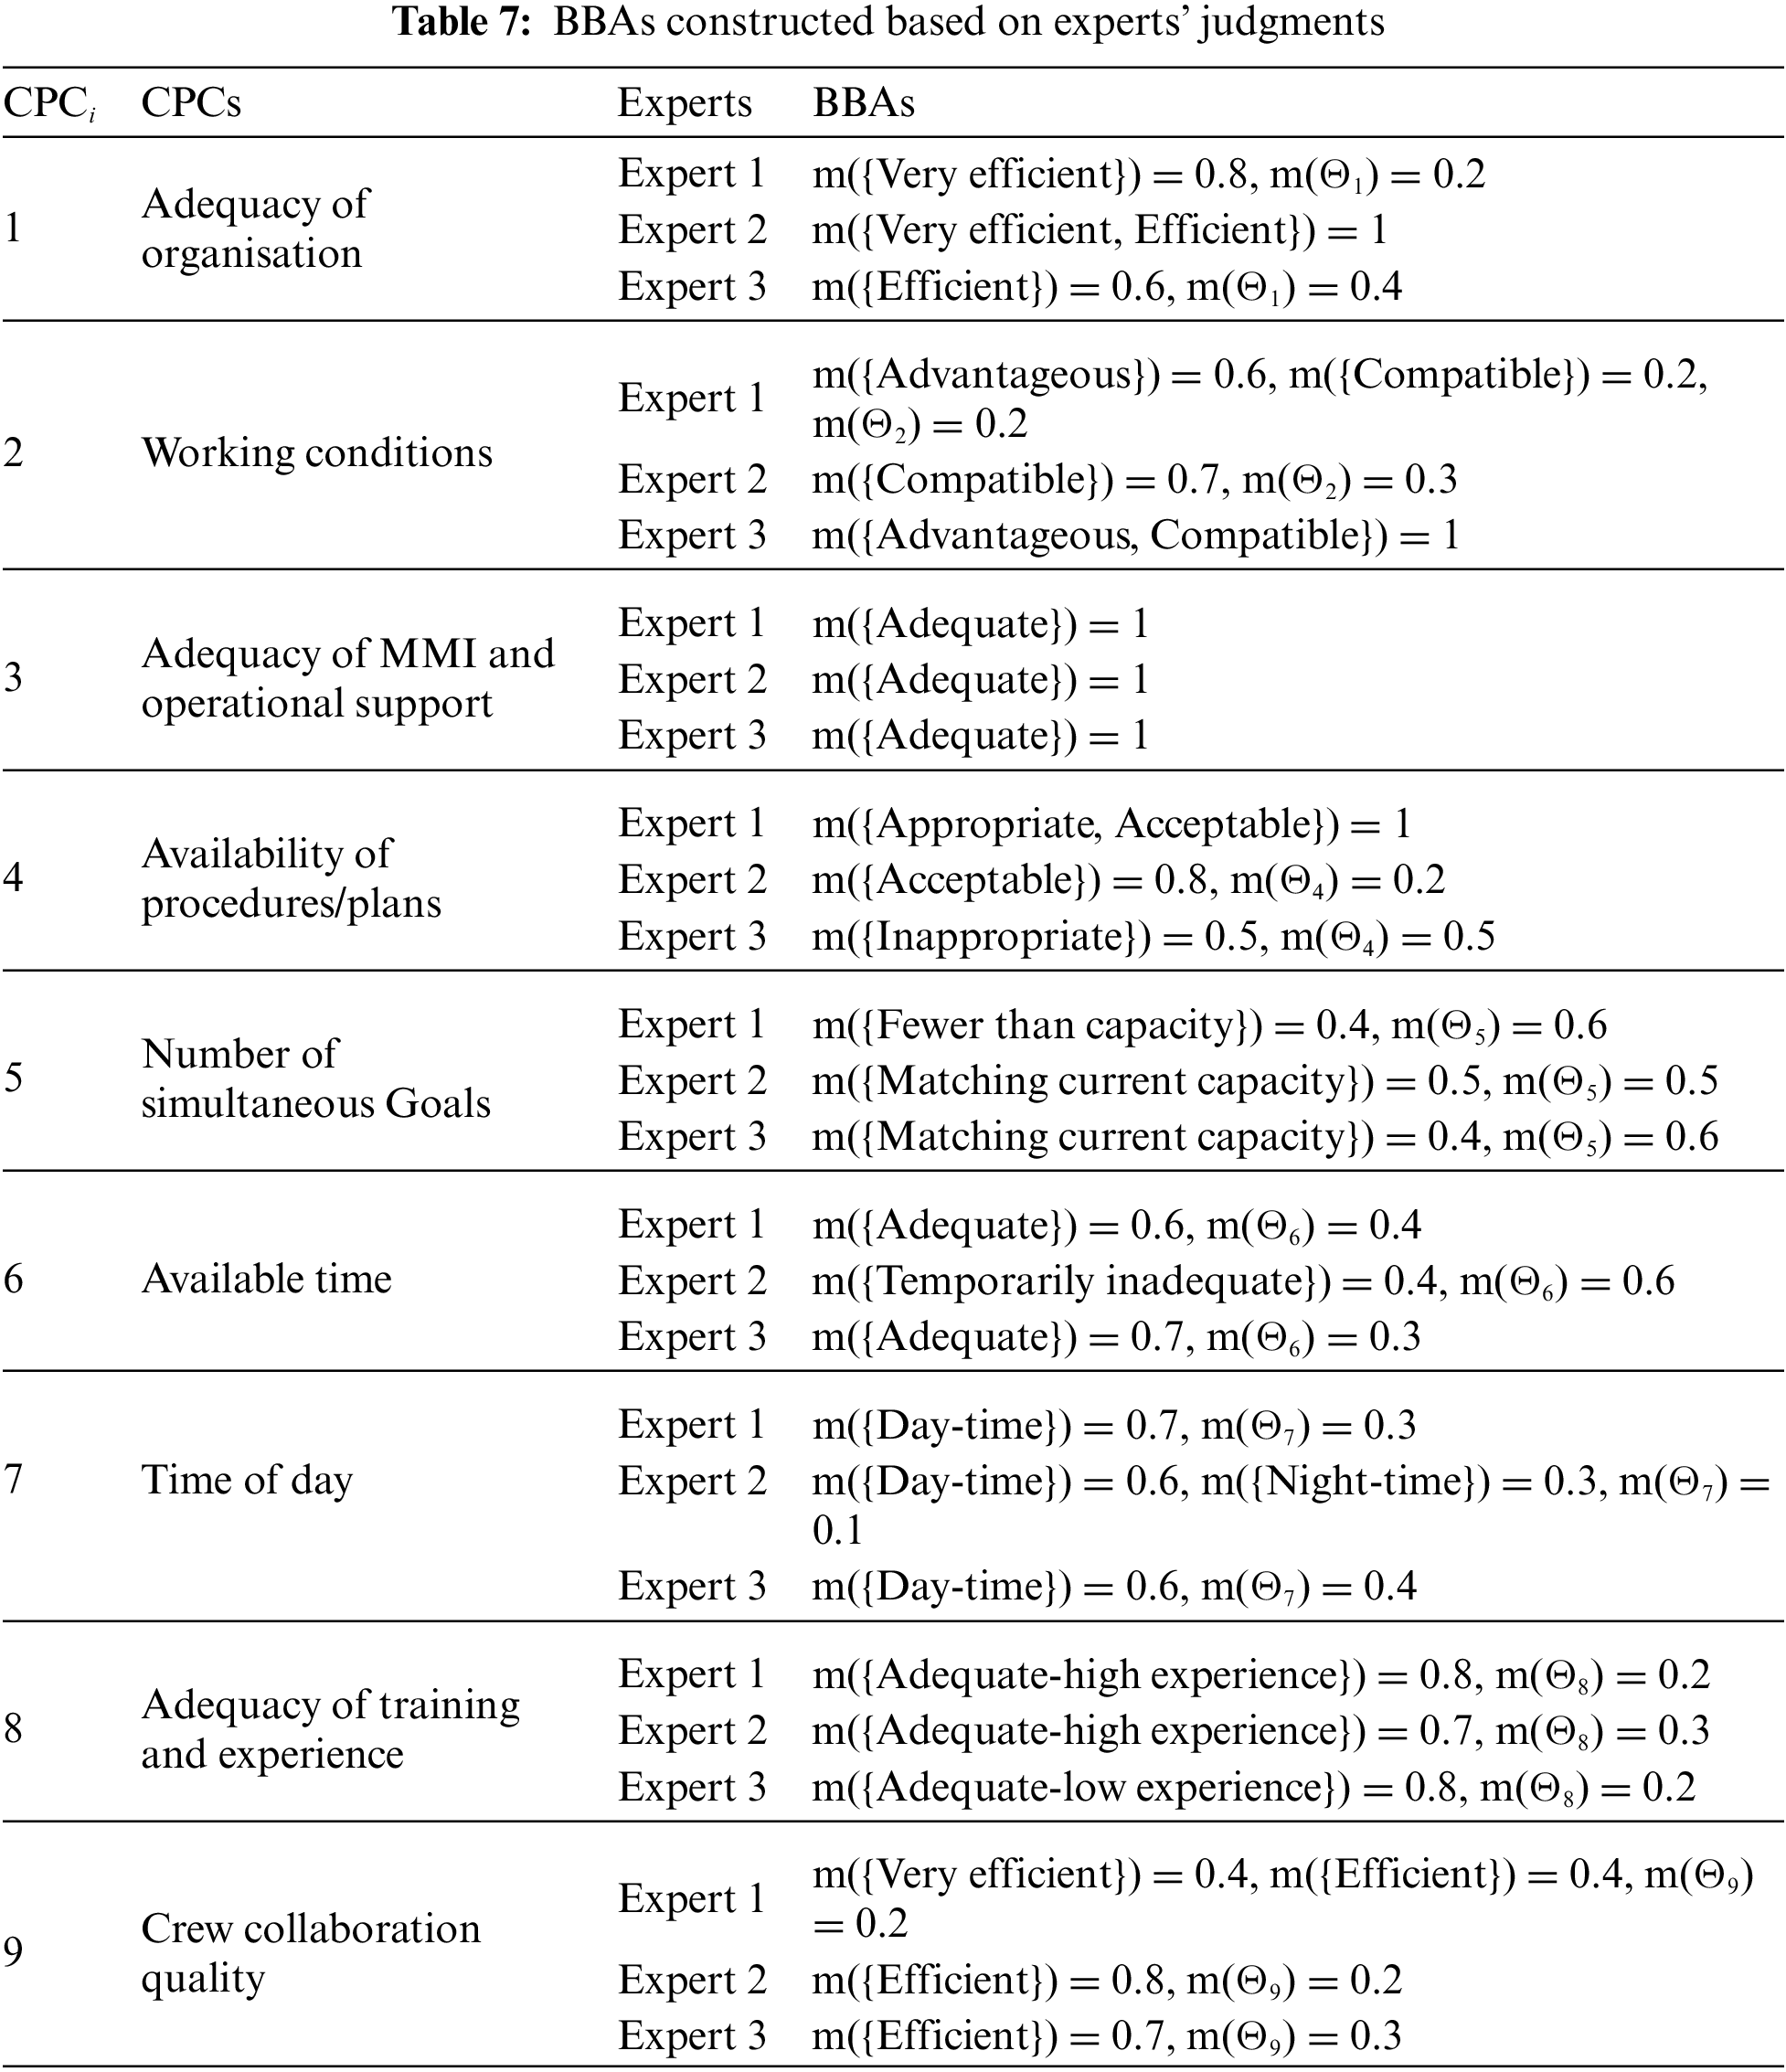
According to Eq. (11), the judgments given by experts is converted into BBA, as shown in Table 7.
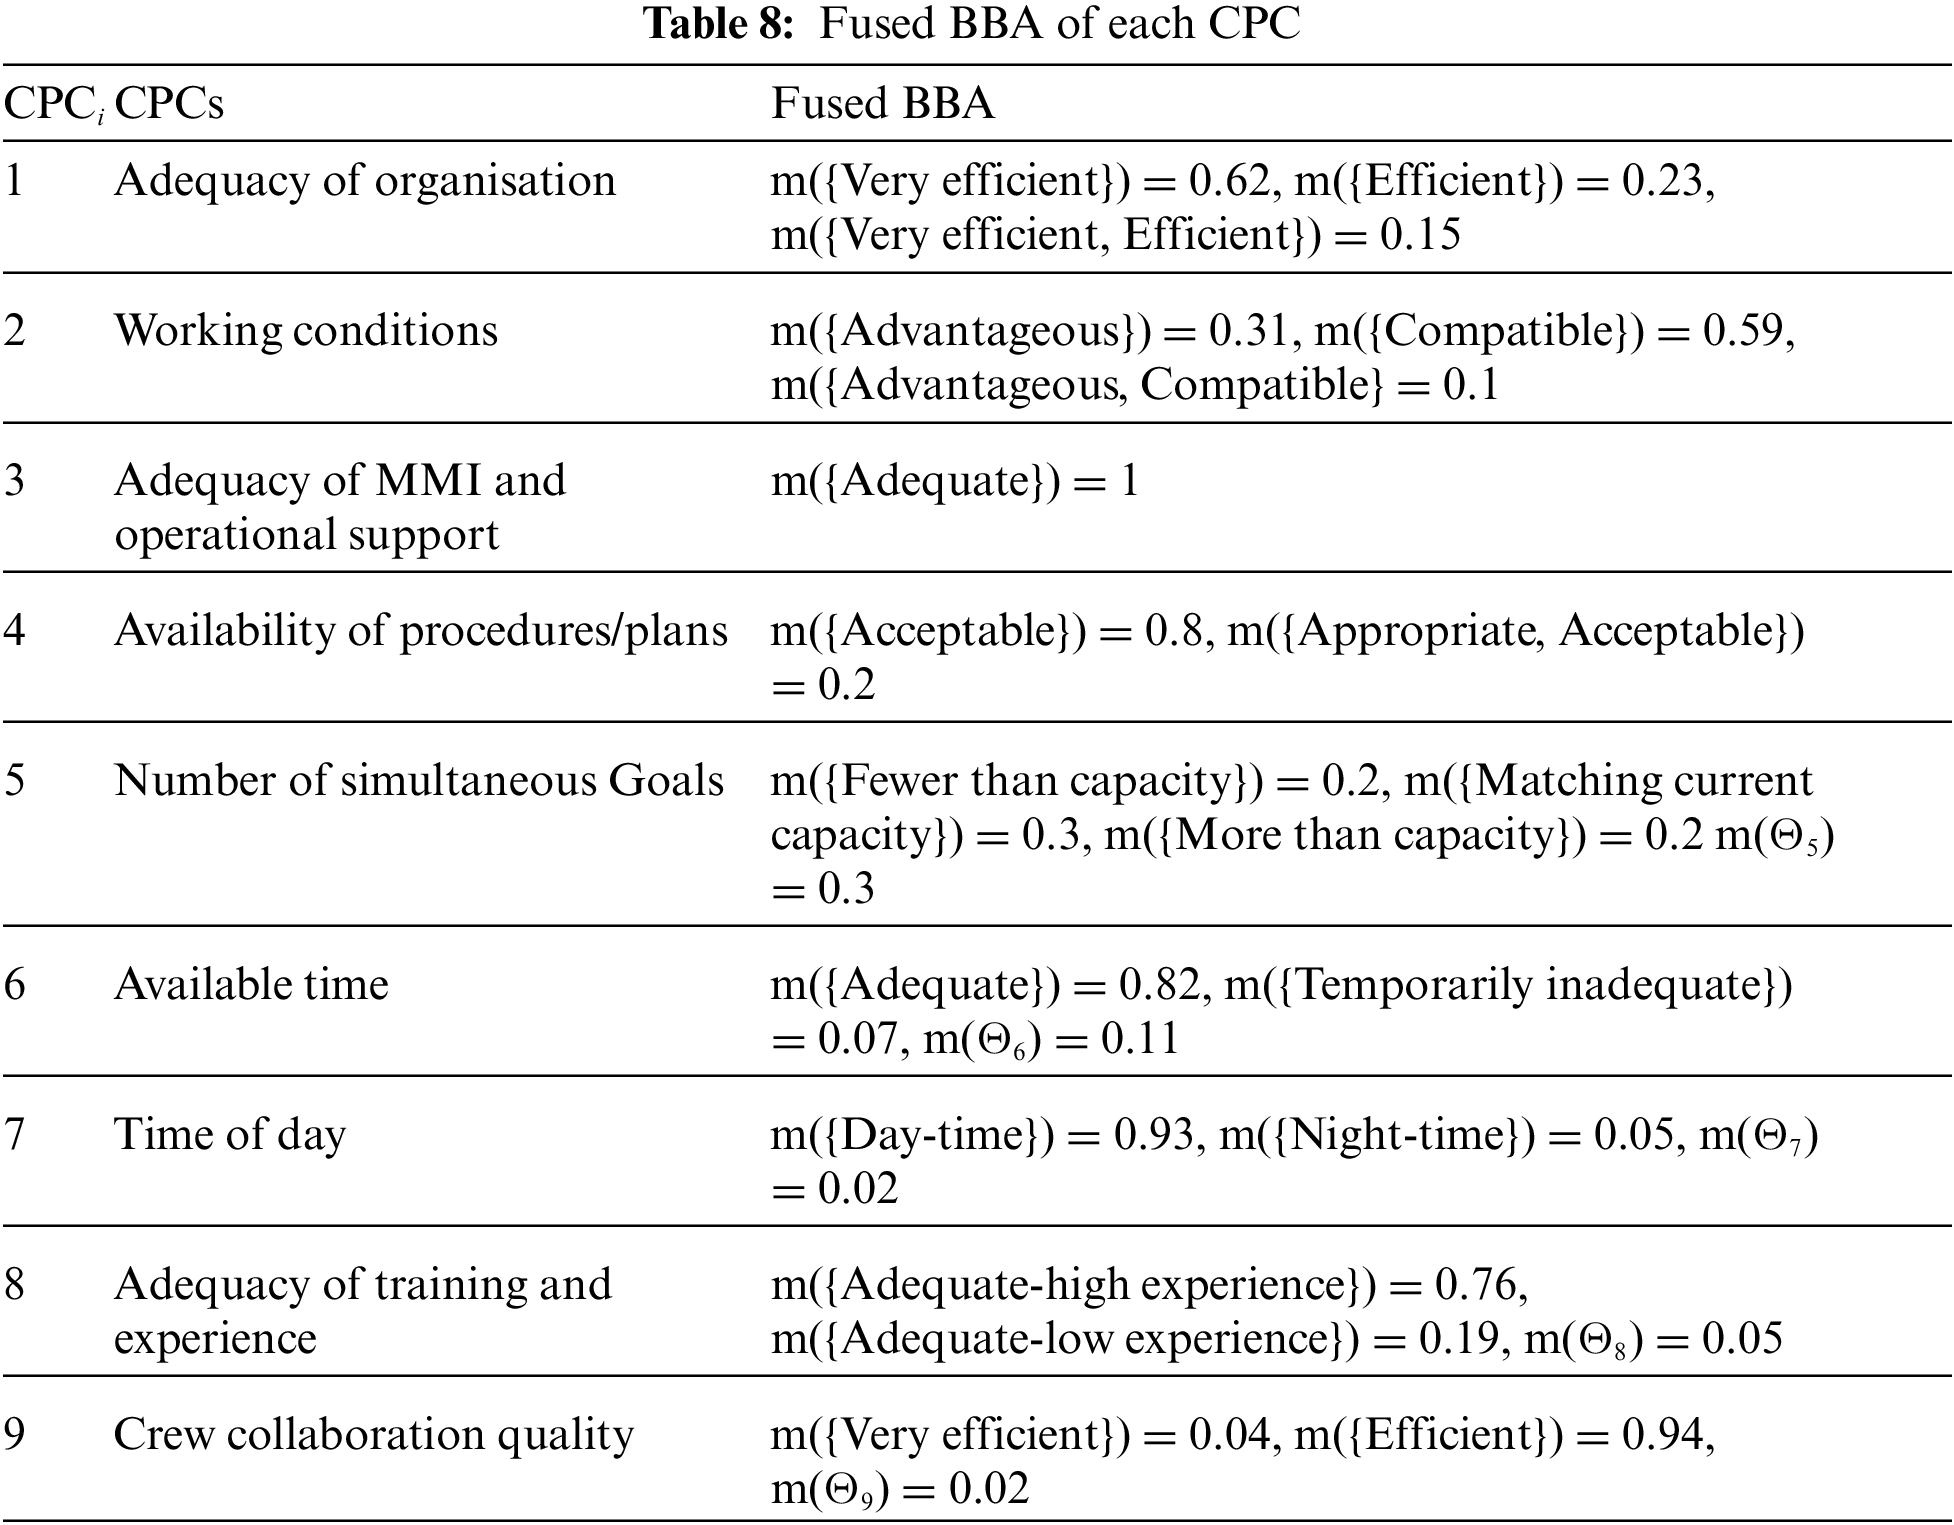
Step 4. Fused BBA for each CPC
For each CPC, fuse the BBAs of the three experts by using Eqs. (5) and (6) in Definition 4. The fusion results are shown in Table 8.
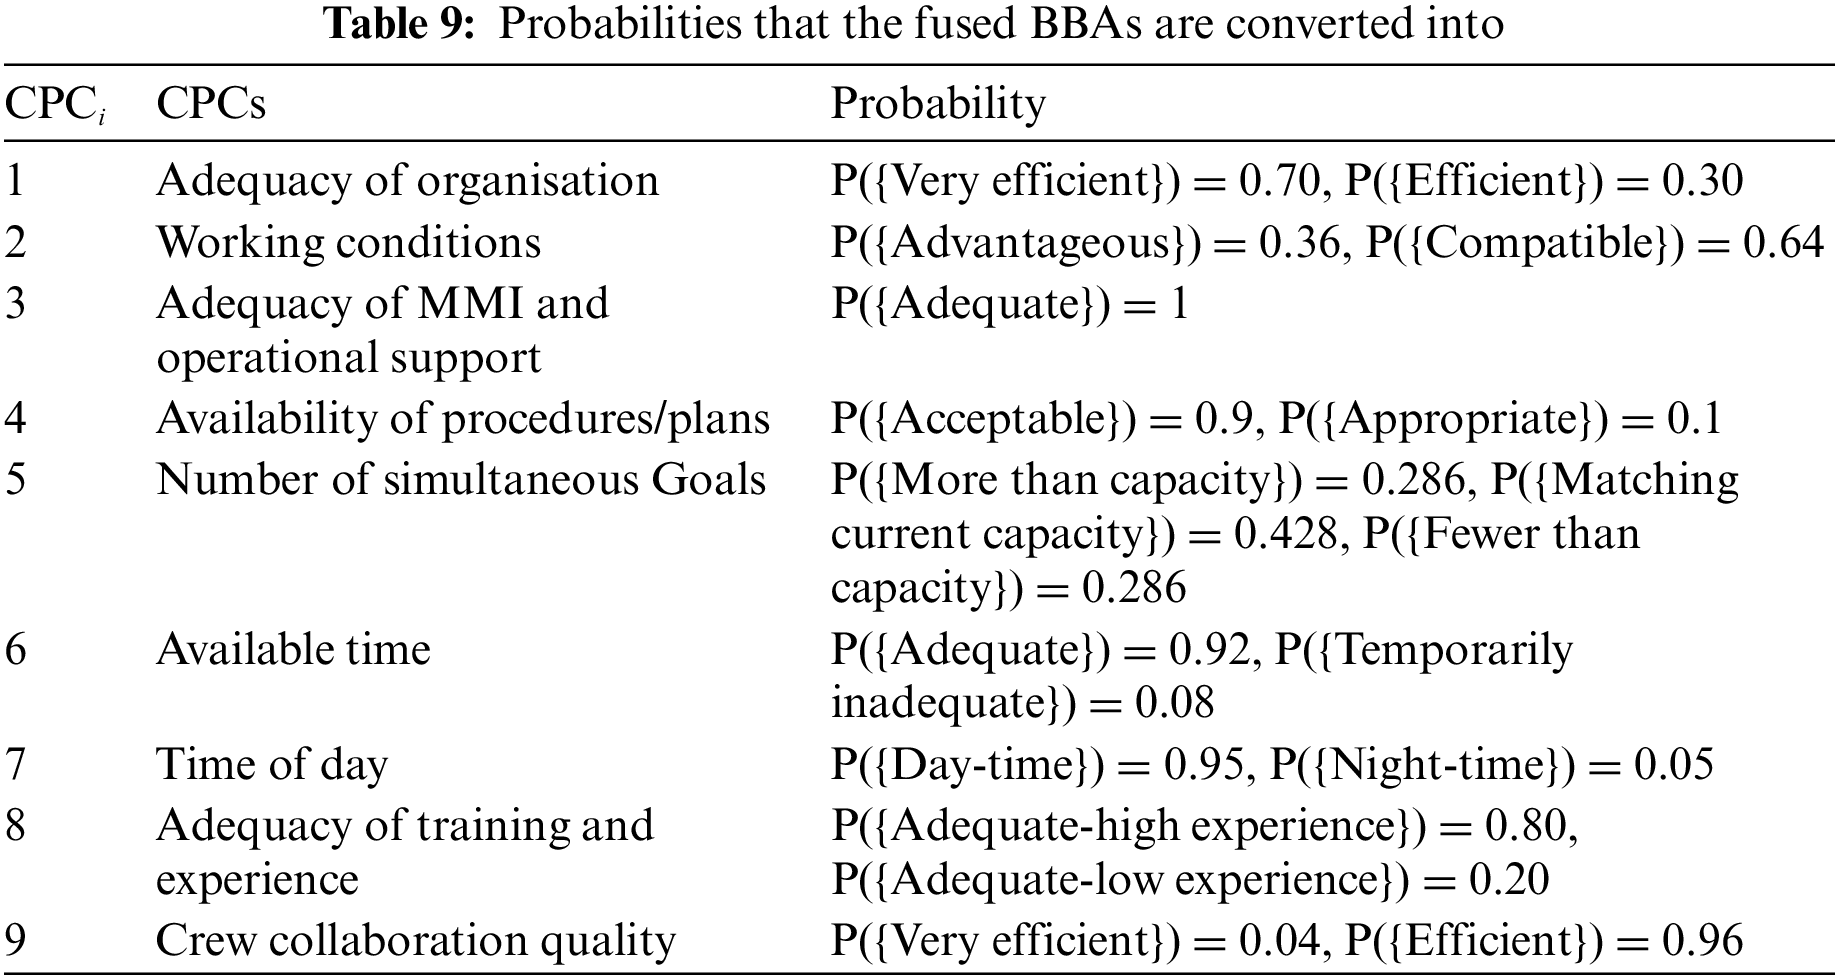
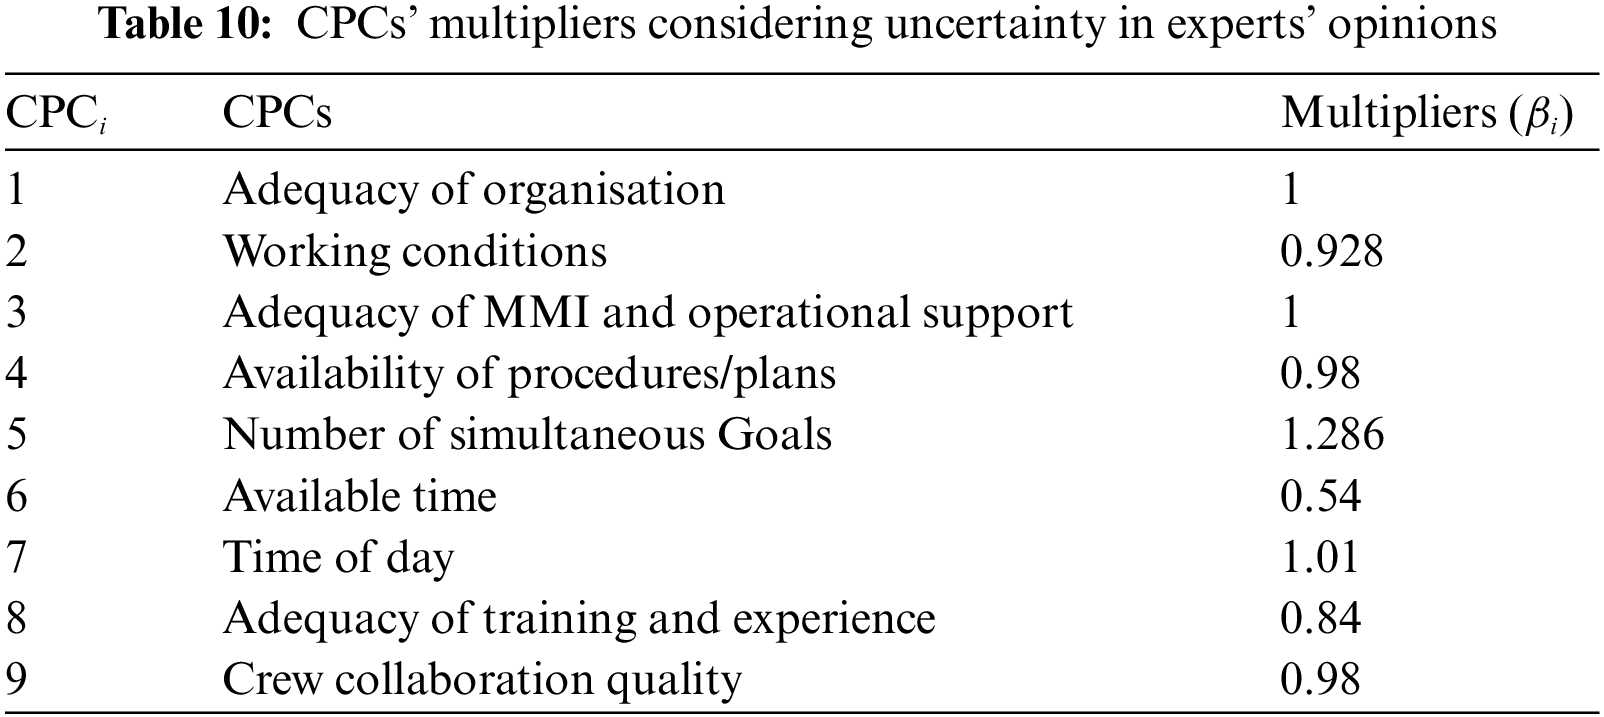
Step 5. Obtain multiplier for each CPC
In order to integrate the experts’ judgments, the fused BBA of each CPC is converted into a probability value according to Eq. (7), as shown in Table 9. These probability values are then linearly combined with the CPC’s original level factors (as shown in Table 2) to obtain the new factors. Taking “observation” of four cognitive functions as an example, Table 10 shows the factors, which is the multiplier (
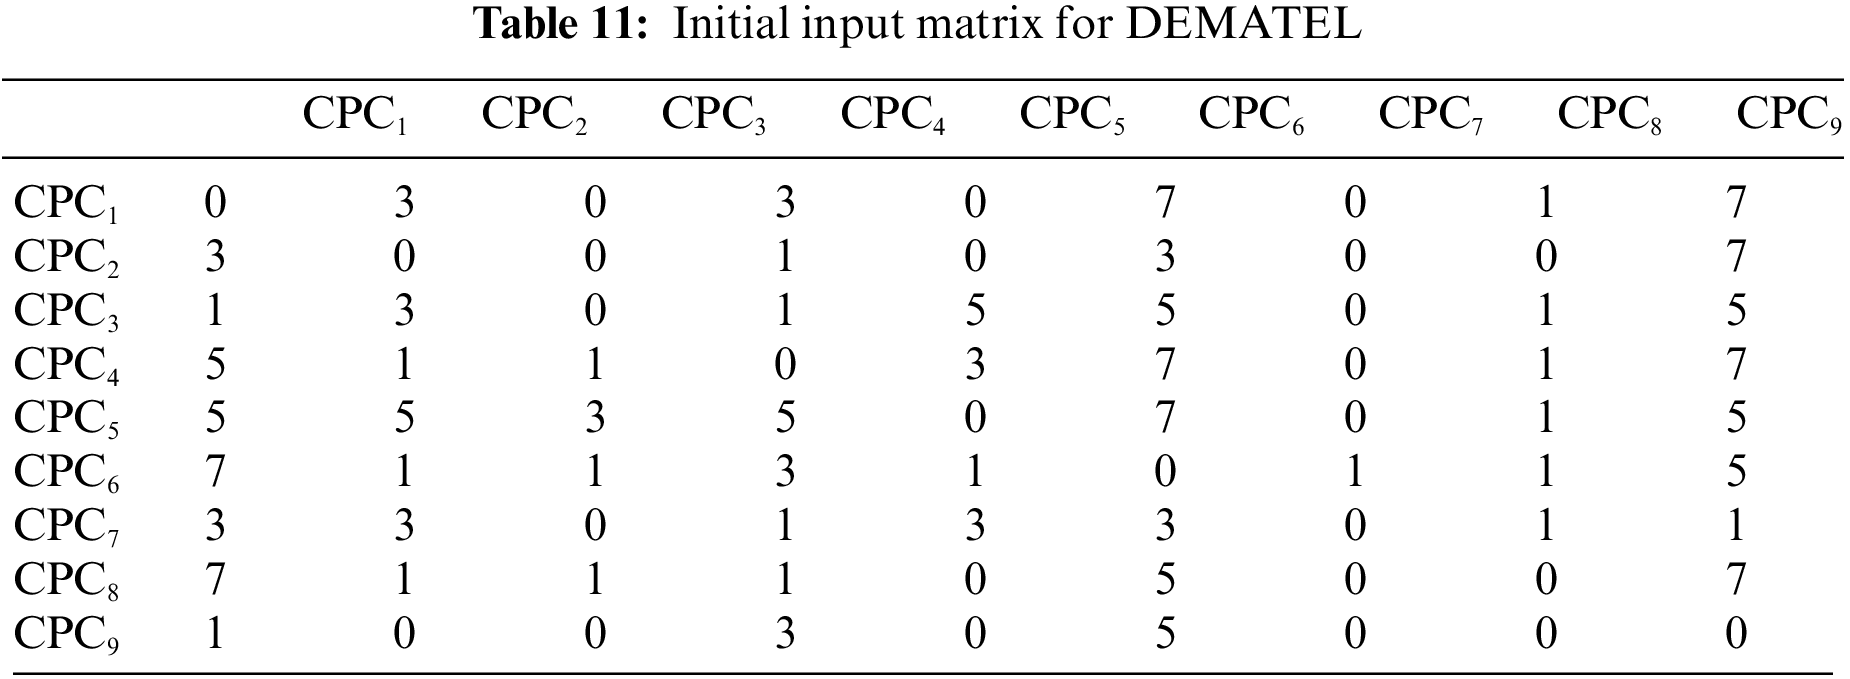
Step 6. Determine the dependence degree between every two CPCs
Experts evaluate the dependence degree between every two CPCs and suggest fuzzy semantic labels. By converting them into numbers according to Table 5, DEMATEL’s initial input matrix M can be obtained. Table 11 shows the initial input matrix of DEMATEL composed of the numbers.
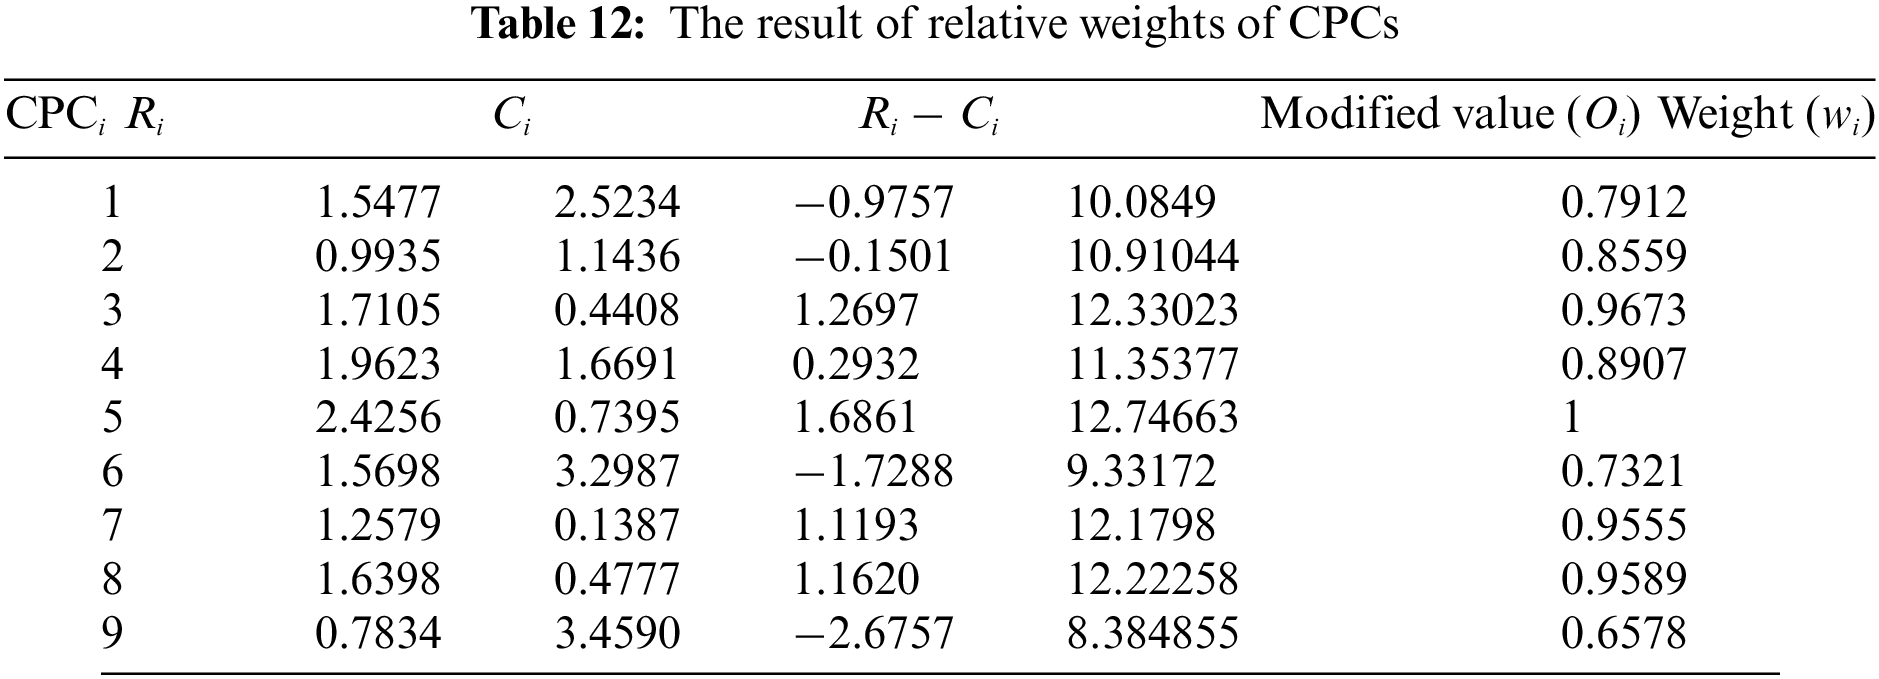
Step 7. Calculate relative weights of the CPCs
According to DEMATEL’s process (see Definition 2.3), the initial input matrix (i.e., direct relation matrix) is transformed into matrix N according to Eqs. (8) and (9), and then the total relation matrix T is obtained according to Eq. (10). The value of R − C can be obtained according to matrix T. Table 12 presents the weights of each CPC.
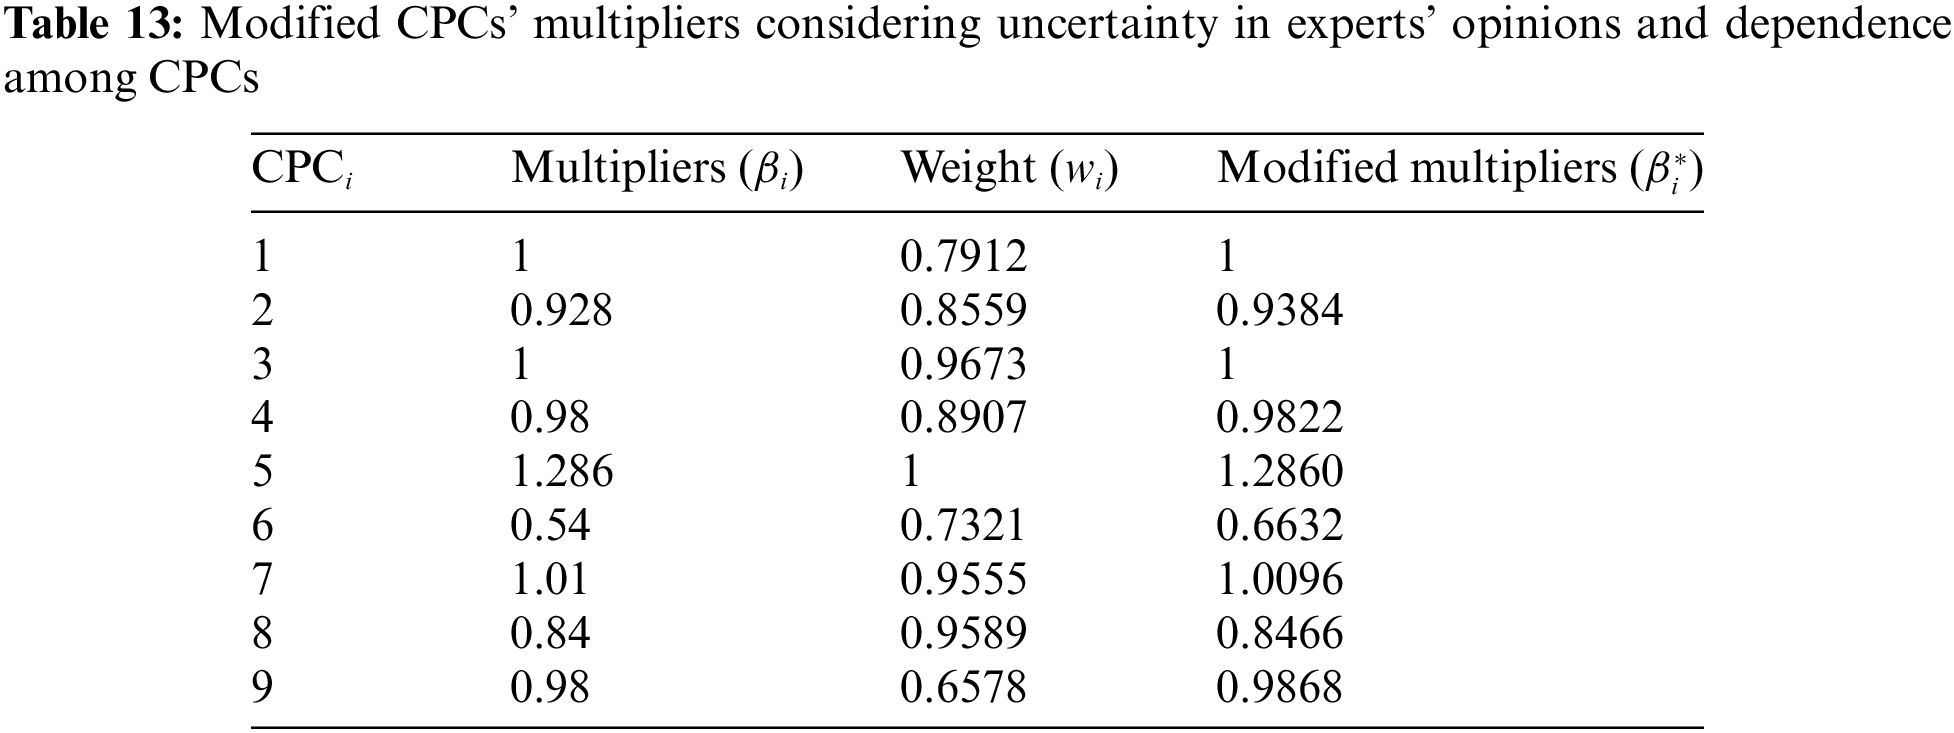
Step 8. Modify the multiplier of CPCs
In this paper, Eq. (16) is used to modify the multipliers of CPCs. The modified CPCs’ multipliers are shown in Table 13.
Step 9. Calculate CFP
On the “Observation” stage, when the failure mode is “error identification”, the basic value of the error probability is 0.007. The CFP of the observation stage is calculated as 0.0046 according to Eq. (3) (see Definition 2.1) as follows:
To visualize the effect of the proposed method, we calculate CFP without considering the dependence among CPCs, denoted as CFP*. The multiplier in Table 10 refers to the CPC multipliers obtained based on the evidence theory and comprehensively considering the evaluation opinions of experts on CPCs, without considering the dependence among CPCs. Then CFP* is calculated as follows. The difference between CFP and CFP* reflects the influence of the dependence among CPCs on the prediction of CFP in the CREAM method. Specifically, in this scenario, the influence level of the dependence among CPCs on CFP is 0.09%.
The advantage of the proposed method is that it can deal with the uncertainty information generated by experts in assessing CPC levels, and take into account the influence of the dependence among CPCs on CFP to avoid the overestimation or underestimation of CFPs. The CFP obtained by the proposed method is more reasonable.
In this paper, we improve a method of calculating CFP in CREAM, by taking into account the specific levels of CPCs and dependence among CPCs. Although the CREAM method provides the level and level factor of each CPC, each level only corresponds to a crisp value, which limits the flexibility of experts in evaluating CPC levels. In this paper, D-S evidence theory is introduced to allow experts to make ambiguous judgments and suggest confidence in their judgments, which blurs the boundary between levels. Moreover, the participation of several experts reduces the uncertainty and subjectivity of judgment. Based on expert opinions, we construct the BBA of each CPC and convert it into a probability value to modify the CPC level factor and obtain a multiplier of each CPC.
The classic CREAM assumes that CPCs are independent of each other, which is unreasonable. Failing to consider the dependence among CPCs leads to the repeated calculation of the influence of the related part on CFP, resulting in the overestimation or underestimation of CFPs. To address this issue, we discount the multipliers with the relative weights to obtain the final modified multipliers. For relative weights, we convert expert opinions into an initial input matrix, process the dependence among CPCs using the DEMATEL method, and obtain the relative weights of CPCs. After discounting the multiplier, the modified multipliers are obtained. The CFP calculated is more reasonable and in line with the real situation.
Acknowledgement: The author greatly appreciates the editor’s encouragement and the anonymous reviewers’ suggestions to improve our paper.
Funding Statement: The work is partially supported by Shanghai Rising-Star Program (Grant No. 21QA1403400), Shanghai Sailing Program (Grant No. 20YF1414800), Shanghai Key Laboratory of Power Station Automation Technology (Grant No. 13DZ2273800).
Author Contributions: The authors confirm contribution to the paper as follows: study conception and design: Xiaoyan Su; data collection: Yuntong Pu, Xiaolei Pan; analysis and interpretation of results: Xiaoyan Su, Hong Qian; draft manuscript preparation: Shuwen Shang, Zhihui Xu. All authors reviewed the results and approved the final version of the manuscript.
Availability of Data and Materials: The authors declare that they have no conflicts of interest to report regarding the present study.
Conflicts of Interest: The authors declare that they have no conflicts of interest to report regarding the present study.
References
1. Wang, H., Fang, Y. P., Zio, E. (2022). Resilience-oriented optimal post-disruption reconfiguration for coupled traffic-power systems. Reliability Engineering & System Safety, 222(2), 108408. [Google Scholar]
2. Meng, D., Yang, S., de Jesus, A. M., Zhu, S. P. (2023). A novel kriging-model-assisted reliability-based multidisciplinary design optimization strategy and its application in the offshore wind turbine tower. Renewable Energy, 203(12), 407–420. [Google Scholar]
3. Meng, D., Yang, S., de Jesus, A. M., Fazeres-Ferradosa, T., Zhu, S. P. (2023). A novel hybrid adaptive kriging and water cycle algorithm for reliability-based design and optimization strategy: Application in offshore wind turbine monopile. Computer Methods in Applied Mechanics and Engineering, 412(6), 116083. [Google Scholar]
4. Che, Y., Deng, Y., Yuan, Y. H. (2022). Maximum-entropy-based decision-making trial and evaluation laboratory and its application in emergency management. Journal of Organizational and End User Computing (JOEUC), 34(7), 1–16. [Google Scholar]
5. Deng, X., Yang, Y., Jiang, W. (2023). Discrete choice models with atanassov-type intuitionistic fuzzy membership degrees. Information Sciences, 622(2021), 46–67. [Google Scholar]
6. Qi, G., Li, J., Kang, B., Yang, B. (2023). The aggregation of z-numbers based on overlap functions and grouping functions and its application on group decision-making. Information Sciences, 623(5), 857–899. [Google Scholar]
7. Chen, X., Deng, Y. (2022). An evidential software risk evaluation model. Mathematics, 10(13), 2325. https://doi.org/10.3390/math10132325 [Google Scholar] [CrossRef]
8. Chen, X., Deng, Y. (2023). A new belief entropy and its application in software risk analysis. International Journal of Computers Communications & Control, 18(2), 5299. [Google Scholar]
9. Meng, D., Yang, S., Lin, T., Wang, J., Yang, H. et al. (2022). RBMDO using gaussian mixture model-based second-order mean-value saddlepoint approximation. Computer Modeling in Engineering & Sciences, 132(2), 553–568. https://doi.org/10.32604/cmes.2022.020756 [Google Scholar] [CrossRef]
10. Meng, D., Yang, S., He, C., Wang, H., Lv, Z. et al. (2022). Multidisciplinary design optimization of engineering systems under uncertainty: A review. International Journal of Structural Integrity, 13(4), 565–593. [Google Scholar]
11. Meng, D., Li, Y., He, C., Guo, J., Lv, Z. et al. (2021). Multidisciplinary design for structural integrity using a collaborative optimization method based on adaptive surrogate modelling. Materials & Design, 206(2), 109789. [Google Scholar]
12. Ai, Q., Yuan, Y., Jiang, X., Wang, H., Han, C. et al. (2022). Pathological diagnosis of the seepage of a mountain tunnel. Tunnelling and Underground Space Technology, 128, 104657. [Google Scholar]
13. Ai, Q., Gu, Y., Yuan, Y., Jiang, X., Wang, H. et al. (2023). Integrated waterproofing evaluation method for longitudinal joints of shield tunnel subjected to extreme surcharge: Numerical analysis and experimental validation. Tunnelling and Underground Space Technology, 131(9), 104834. [Google Scholar]
14. Bye, A. (2023). Future needs of human reliability analysis: The interaction between new technology, crew roles and performance. Safety Science, 158, 105962. [Google Scholar]
15. Garg, V., Vinod, G., Prasad, M., Chattopadhyay, J., Smith, C. et al. (2023). Human reliability analysis studies from simulator experiments using Bayesian inference. Reliability Engineering & System Safety, 229(2), 108846. [Google Scholar]
16. Greco, S. F., Podofillini, L., Dang, V. N. (2023). A Bayesian two-stage approach to integrate simulator data and expert judgment in human error probability estimation. Safety Science, 159(2–3), 106009. [Google Scholar]
17. Zheng, Q., Liu, X., Wang, W., Wu, Q., Deveci, M. et al. (2023). The integrated prospect theory with consensus model for risk analysis of human error factors in the clinical use of medical devices. Expert Systems with Applications, 217, 119507. [Google Scholar]
18. Ma, X., Shi, G., Li, W., Shi, J. (2022). Identifying the most probable human errors influencing maritime safety. Journal of Marine Science and Engineering, 11(1), 14. [Google Scholar]
19. Wang, C., Liu, Y., Lian, X., Luo, J., Liang, C. et al. (2023). Dynamic risk assessment of plugging and abandonment operation process of offshore wells based on dynamic Bayesian network. Ocean Engineering, 270, 113625. [Google Scholar]
20. Hasnain, M., Ghani, I., Jeong, S. R., Pasha, M. F., Usman, S. et al. (2023). Empirical analysis of software success rate forecasting during requirement engineering processes. Computers, Materials & Continua, 74(1), 783–799. [Google Scholar]
21. Zarei, E., Khan, F., Abbassi, R. (2023). How to account artificial intelligence in human factor analysis of complex systems? Process Safety and Environmental Protection, 171, 736–750. [Google Scholar]
22. Birch, D. S., Narsinghani, J., Herber, D., Bradley, T. H. (2023). Human factors hazard modeling in the systems modeling language. Systems Engineering, 26(3), 328–343. [Google Scholar]
23. Niu, L., Zhao, J., Yang, J. (2023). Risk assessment of unsafe acts in coal mine gas explosion accidents based on HFACS-GE and Bayesian networks. Processes, 11(2), 554. [Google Scholar]
24. La Fata, C., Adelfio, L., Micale, R., La Scalia, G. (2023). Human error contribution to accidents in the manufacturing sector: A structured approach to evaluate the interdependence among performance shaping factors. Safety Science, 161(3), 106067. [Google Scholar]
25. Hollnagel, E. (1998). Cognitive reliability and error analysis method (CREAM). New York, USA: Elsevier Science Inc. [Google Scholar]
26. Wu, B., Yan, X., Wang, Y., Soares, C. G. (2017). An evidential reasoning-based CREAM to human reliability analysis in maritime accident process. Risk Analysis, 37(10), 1936–1957. [Google Scholar] [PubMed]
27. Zhou, Q., Wong, Y. D., Xu, H., van Thai, V., Loh, H. S. et al. (2017). An enhanced CREAM with stakeholder-graded protocols for tanker shipping safety application. Safety Science, 95(1), 140–147. [Google Scholar]
28. Yoshimura, K., Nishizaki, C., Kimura, A., Murata, S., Mitomo, N. et al. (2013). Questionnaire survey for adapting common performance conditions to marine accidents. 2013 IEEE International Conference on Systems, Man, and Cybernetics, pp. 3339–3343. Manchester, England, IEEE. [Google Scholar]
29. He, C., Tanshi, F., Söffker, D. (2020). Human online reliability estimation applied to real driving maneuvers. 2020 IEEE Conference on Cognitive and Computational Aspects of Situation Management (CogSIMA), pp. 149–154. Victoria, BC, Canada, IEEE. [Google Scholar]
30. Sun, Y., Zhang, Q., Yuan, Z., Gao, Y., Ding, S. (2020). Quantitative analysis of human error probability in high-speed railway dispatching tasks. IEEE Access, 8, 56253–56266. [Google Scholar]
31. Chen, X., Liu, X., Qin, Y. (2021). An extended CREAM model based on analytic network process under the type-2 fuzzy environment for human reliability analysis in the high-speed train operation. Quality and Reliability Engineering International, 37(1), 284–308. [Google Scholar]
32. Lin, C., Xu, Q. F., Huang, Y. F. (2022). An HFM-CREAM model for the assessment of human reliability and quantification. Quality and Reliability Engineering International, 38(5), 2372–2387. [Google Scholar]
33. Yao, K., Yan, S., Tran, C. C. (2022). A fuzzy CREAM method for human reliability analysis in digital main control room of nuclear power plants. Nuclear Technology, 208(4), 761–774. [Google Scholar]
34. Yang, Z., Bonsall, S., Wall, A., Wang, J., Usman, M. (2013). A modified CREAM to human reliability quantification in marine engineering. Ocean Engineering, 58(3), 293–303. [Google Scholar]
35. Sun, Z., Li, Z., Gong, E., Xie, H. (2012). Estimating human error probability using a modified CREAM. Reliability Engineering & System Safety, 100(6), 28–32. [Google Scholar]
36. Deng, Y. (2020). Uncertainty measure in evidence theory. Science China Information Sciences, 63(11), 210201. [Google Scholar]
37. Deng, Y. (2022). Random permutation set. International Journal of Computers Communications & Control, 17(1), 4542. [Google Scholar]
38. Cui, H., Chang, Y., Zhang, H., Mi, X., Kang, B. (2023). Determine the number of unknown targets in the open world from the perspective of bidirectional analysis using gap statistic and isolation forest. Information Sciences, 623(2), 832–856. [Google Scholar]
39. Qiang, C., Deng, Y., Cheong, K. H. (2022). Information fractal dimension of mass function. Fractals-An Interdisciplinary Journal on The Complex Geometry of Nature, 30(6), 2250110. [Google Scholar]
40. Deng, Y. (2020). Information volume of mass function. International Journal of Computers Communications & Control, 15(6), 3983. [Google Scholar]
41. Deng, X. Y., Cui, Y. B., Jiang, W. (2022). An ECR-PCR rule for fusion of evidences defined on a non-exclusive framework of discernment. Chinese Journal of Aeronautics, 35(8), 179–192. [Google Scholar]
42. Cui, Y., Deng, X. (2023). Plausibility entropy: A new total uncertainty measure in evidence theory based on plausibility function. IEEE Transactions on Systems, Man, and Cybernetics: Systems, 53(6), 3833–3844. [Google Scholar]
43. Deng, X., Xue, S., Jiang, W. (2023). A novel quantum model of mass function for uncertain information fusion. Information Fusion, 89(3), 619–631. [Google Scholar]
44. Dempster, A. P. (1967). Upper and lower probabilities induced by a multivalued mapping. The Annals of Mathematical Statistics, 38(2), 325–339. [Google Scholar]
45. Shafer, G. (1976). A mathematical theory of evidence. Princeton: Princeton University Press. [Google Scholar]
46. Xiao, F., Wen, J., Pedrycz, W. (2022). Generalized divergence-based decision making method with an application to pattern classification. IEEE Transactions on Knowledge and Data Engineering, 35(7), 6941–6956. https://doi.org/10.1109/TKDE.2022.3177896 [Google Scholar] [CrossRef]
47. Song, M., Sun, C., Cai, D., Hong, S., Li, H. (2022). Classifying vaguely labeled data based on evidential fusion. Information Sciences, 583(4), 159–173. [Google Scholar]
48. Song, M., Li, H., Sun, C., Cai, D., Hong, S. (2022). DLSA: Semi-supervised partial label learning via dependence-maximized label set assignment. Information Sciences, 609(2), 1169–1180. [Google Scholar]
49. Xiao, F. (2022). GEJS: A generalized evidential divergence measure for multisource information fusion. IEEE Transactions on Systems, Man, and Cybernetics-Systems. https://doi.org/10.1109/TSMC.2022.3211498 [Google Scholar] [CrossRef]
50. Xiao, F., Cao, Z., Jolfaei, A. (2020). A novel conflict measurement in decision making and its application in fault diagnosis. IEEE Transactions on Fuzzy Systems, 29(1), 186–197. [Google Scholar]
51. Wang, Y., Wang, J., Huang, M., Wang, M. (2022). An evidence combination rule based on new weight assignment scheme. Soft Computing, 26(15), 7123–7137. [Google Scholar]
52. Zhang, W., Deng, Y. (2019). Combining conflicting evidence using the DEMATEL method. Soft Computing, 23(17), 8207–8216. [Google Scholar]
53. Yadav, S., Singh, S. P. (2020). Blockchain critical success factors for sustainable supply chain. Resources, Conservation and Recycling, 152(4), 104505. [Google Scholar]
54. Luthra, S., Kumar, A., Zavadskas, E. K., Mangla, S. K., Garza-Reyes, J. A. (2020). Industry 4.0 as an enabler of sustainability diffusion in supply chain: An analysis of influential strength of drivers in an emerging economy. International Journal of Production Research, 58(5), 1505–1521. [Google Scholar]
55. Kouhizadeh, M., Saberi, S., Sarkis, J. (2021). Blockchain technology and the sustainable supply chain: Theoretically exploring adoption barriers. International Journal of Production Economics, 231(9), 107831. [Google Scholar]
56. Liu, T., Deng, Y., Chan, F. (2018). Evidential supplier selection based on DEMATEL and game theory. International Journal of Fuzzy Systems, 20(4), 1321–1333. [Google Scholar]
57. Sharma, M., Joshi, S., Kumar, A. (2020). Assessing enablers of E-waste management in circular economy using DEMATEL method: An Indian perspective. Environmental Science and Pollution Research, 27(12), 13325–13338. [Google Scholar] [PubMed]
58. Zhang, A., Venkatesh, V. G., Liu, Y., Wan, M., Qu, T. et al. (2019). Barriers to smart waste management for a circular economy in China. Journal of Cleaner Production, 240(1), 118198. [Google Scholar]
59. Chauhan, A., Jakhar, S. K., Chauhan, C. (2021). The interplay of circular economy with industry 4.0 enabled smart city drivers of healthcare waste disposal. Journal of Cleaner Production, 279(2), 123854. [Google Scholar] [PubMed]
60. Ali, S. A., Parvin, F., Vojteková, J., Costache, R., Linh, N. T. T. et al. (2021). GIS-based landslide susceptibility modeling: A comparison between fuzzy multi-criteria and machine learning algorithms. Geoscience Frontiers, 12(2), 857–876. [Google Scholar]
61. Darabi, H., Choubin, B., Rahmati, O., Haghighi, A. T., Pradhan, B. et al. (2019). Urban flood risk mapping using the GARP and QUEST models: A comparative study of machine learning techniques. Journal of Hydrology, 569(4), 142–154. [Google Scholar]
62. Xiao, F. (2023). Generalized quantum evidence theory. Applied Intelligence, 53(11), 14329–14344. [Google Scholar]
63. Xiao, F. (2021). CED: A distance for complex mass functions. IEEE Transactions on Neural Networks and Learning Systems, 32(4), 1525–1535. [Google Scholar] [PubMed]
64. Xiao, F., Pedrycz, W. (2023). Negation of the quantum mass function for multisource quantum information fusion with its application to pattern classification. IEEE Transactions on Pattern Analysis and Machine Intelligence, 45(2), 2054–2070. [Google Scholar] [PubMed]
65. Xiao, F., Cao, Z., Lin, C. T. (2022). A complex weighted discounting multisource information fusion with its application in pattern classification. IEEE Transactions on Knowledge and Data Engineering, 6, 1–16.https://doi.org/10.1109/TKDE.2022.3206871 [Google Scholar] [CrossRef]
66. Xiao, F. (2022). CEQD: A complex mass function to predict interference effects. IEEE Transactions on Cybernetics, 52(8), 7402–7414. [Google Scholar] [PubMed]
67. Zadeh, L. A. (1986). A simple view of the Dempster-Shafer theory of evidence and its implication for the rule of combination. AI Magazine, 7(2), 85–90. [Google Scholar]
68. Smets, P., Kennes, R. (1994). The transferable belief model. Artificial Intelligence, 66(3), 191–243. [Google Scholar]
69. Fontela, E., Gabus, A. (1976). The DEMATEL observer. Battelle Geneva Research Center, Geneva, Switzerland. [Google Scholar]
70. Li, Y., Hu, Y., Zhang, X., Deng, Y., Mahadevan, S. (2014). An evidential DEMATEL method to identify critical success factors in emergency management. Applied Soft Computing, 22(2), 504–510. [Google Scholar]
71. Xu, Z., Shang, S., Su, X., Qian, H., Pan, X. (2023). Handling dependencies among performance shaping factors in SPAR-H through DEMATEL method. Nuclear Engineering and Technology, 55(8), 2897–2904. https://doi.org/10.1016/j.net.2023.04.017 [Google Scholar] [CrossRef]
72. Seyed-Hosseini, S. M., Safaei, N., Asgharpour, M. (2006). Reprioritization of failures in a system failure mode and effects analysis by decision making trial and evaluation laboratory technique. Reliability Engineering & System Safety, 91(8), 872–881. [Google Scholar]
Cite This Article
 Copyright © 2024 The Author(s). Published by Tech Science Press.
This work is licensed under a Creative Commons Attribution 4.0 International License , which permits unrestricted use, distribution, and reproduction in any medium, provided the original work is properly cited.
 Downloads
 Citation Tools