
 Submit a Paper
 Propose a Special lssue
 Open Access
ARTICLE

Models to Simulate Effective Coverage of Fire Station Based on Real-Time Travel Times
Department of Engineering Management, Changsha University of Science and Technology, Changsha, 410114, China
* Corresponding Author: Dingli Liu. Email:
Computer Modeling in Engineering & Sciences 2024, 139(1), 483-513. https://doi.org/10.32604/cmes.2023.044809
Received 09 August 2023; Accepted 24 October 2023; Issue published 30 December 2023
 View Full Text
 Download PDF
Abstract
In recent years, frequent fire disasters have led to enormous damage in China. Effective firefighting rescues can minimize the losses caused by fires. During the rescue processes, the travel time of fire trucks can be severely affected by traffic conditions, changing the effective coverage of fire stations. However, it is still challenging to determine the effective coverage of fire stations considering dynamic traffic conditions. This paper addresses this issue by combining the traveling time calculation model with the effective coverage simulation model. In addition, it proposes a new index of total effective coverage area (TECA) based on the time-weighted average of the effective coverage area (ECA) to evaluate the urban fire services. It also selects China as the case study to validate the feasibility of the models, a fire station (FS-JX) in Changsha. FS-JX station and its surrounding 9,117 fire risk points are selected as the fire service supply and demand points, respectively. A total of 196 simulation scenarios throughout a consecutive week are analyzed. Eventually, 1,933,815 sets of valid sample data are obtained. The results showed that the TECA of FS-JX is 3.27 km2, which is far below the standard requirement of 7.00 km2 due to the traffic conditions. The visualization results showed that three rivers around FS-JX interrupt the continuity of its effective coverage. The proposed method can provide data support to optimize the locations of fire stations by accurately and dynamically determining the effective coverage of fire stations.Keywords
Fire hazard is a destructive natural disaster that can lead to the loss of lives and properties, environmental damage, and social and economic stability [1–3]. The fire data released by the National Fire and Rescue Administration of China showed that there were 825,000 fire accidents reported nationwide in 2022, resulting in 2,053 deaths and 7.16 billion direct fire property loss [4]. Among these, forest fires are not included. The losses of fires can be significantly reduced by prompt fire rescue [5,6]. However, traffic congestion and poor transportation infrastructure have been the biggest obstacles to fire rescue [7–9]. Optimization of transportation infrastructure can release traffic congestion [10]. When traffic is congested, fire trucks spend more time reaching the fire scene, reducing the fire services’ effective coverage. As traffic conditions vary dynamically over time, the effective coverage also varies [11,12]. Due to the dynamic traffic conditions, it is difficult to determine the effective coverage in real time [13]. Grasping the effective coverage variation rules is important under the impacts of traffic conditions.
The government usually stipulates the effective coverage of fire services provided by each fire station in China based on the administrative jurisdiction [14]. In the code for the planning of urban fire control GB 51080-2015 in China, the jurisdiction area of each urban fire station was stipulated as less than 7.00 km2 [14]. However, the planning pattern of fire stations based on the standard of a 7.00 km2 area fails to meet the requirement for fire safety in real-world scenarios with increasingly complex transportation networks and rapidly changing traffic conditions [14]. When traffic gets more congested, the response time of fire rescue has become a more significant factor for the efficiency of fire rescue [8,15].
Considering the influence of traffic congestion on fire rescue, the real-time response time should be considered as a determining factor [8,14]. As a result, the response time is more suitable for judging the effective coverage of one fire station rather than the jurisdiction area. The Geographic Information System (GIS) techniques can also calculate the response time. With the increasing applications, GIS is increasingly being utilized in fire station planning [16–20]. Spatial data can be analyzed and processed using GIS to calculate and evaluate fire station locations, coverage ranges, response times, and other factors [21,22]. However, the data stored in the road network are updated slowly. Therefore, the real-time traffic conditions failed to be considered, resulting in an inaccurate assessment of the effective coverage of fire stations [23].
With the maturity of big data, online maps such as Google Map, Baidu Map, and Amap are increasingly being utilized in fire planning [24,25]. These online maps offer various functions, such as location services, navigation, and route planning [26]. Many points of interest (POIs) are stored in the online map databases [27,28]. Utilizing the application program interface (API) of the online map’s web service, the POI information, including names and addresses of buildings, latitude coordinates, and longitude coordinates, can be extracted to visualize the fire risk points distribution [29]. Furthermore, real-time traffic data can be accessed to calculate travel time and distance from any location to another on Earth [30–32].
In recent years, several models have been developed using online maps and taking real-time traffic conditions into account to simulate the response time for fire rescue [8,13,33]. These models rely on a combination of real-time traffic data and points of interest (POI) data to simulate the service areas of fire stations. A previous study developed one such system to estimate the service area of a fire station called CS-FS in Changsha, China. This estimation results showed that the service area of the fire station varied depending on traffic conditions. However, the variations in fire services coverage areas pose challenges when evaluating the effectiveness of urban fire services. Therefore, there is a need for a comprehensive model that can evaluate the effectiveness of urban fire services considering all these factors. Furthermore, previous studies did not consider the impacts of rivers on the travel of fire trucks; however, fire stations are generally located near rivers. Consequently, it is crucial to study the influence of rivers on fire services in the simulation of fire station coverage. This research provides valuable insights into the reasonable allocation of firefighting resources and urban planning, especially about fire station locations. This study improves previously developed simulation models for a more accurate simulation of fire services coverage [8]. Due to the constant variations of the effective coverage area (ECA), ECA’s time-weighted value (TECA) at a consecutive time is added to the model as a new evaluation index. Based on TECA, it is more convenient for the government to evaluate the effectiveness of fire services. The FS-JX, surrounded by rivers on three sides in Changsha City, China, is selected as the study area. By combining data with visualization analysis, the proposed method helps improve the rationality of firefighting resources allocation and the level of fire services.
Changsha City is situated in the north-eastern area of Hunan province in China. The land area here is 11,816.00 km2, of which the urban area is 2,150.90 km2, and the built-up area is 374.64 km2. The satellite map of Changsha city and the geographical location of FS-JX is shown in Fig. 1.
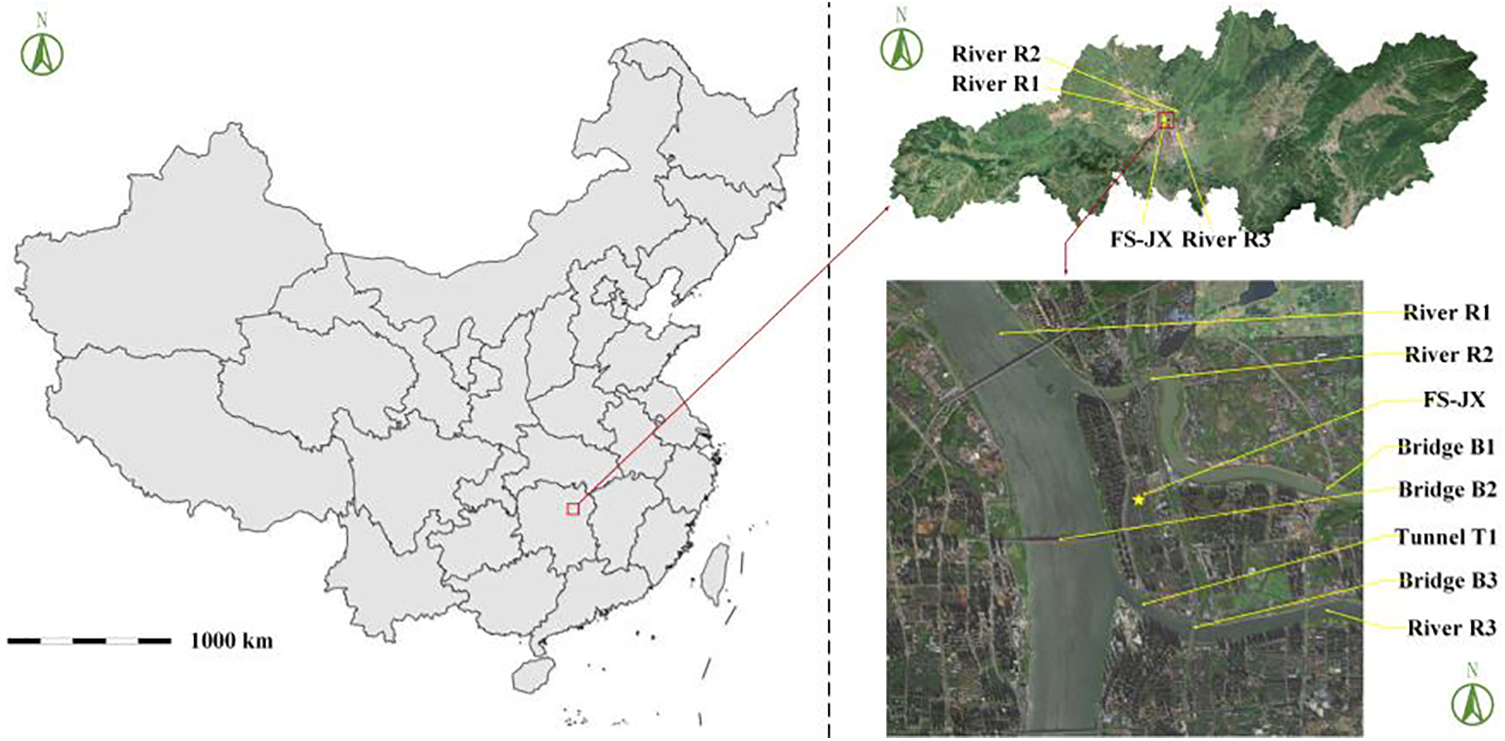
Figure 1: Satellite map of Changsha city and geographical location of FS-JX
Fig. 1 shows that the FS-JX is a fire station in Changsha city, surrounded by River R1, River R2, and River R3 on three sides. However, only three bridges, Bridge B1, Bridge B2, and Bridge B3, and one tunnel, Tunnel T1, connect FS-JX to the other side of the rivers. The urban area of Changsha is in the center of Changsha City, which is densely built, populated, and commercially prosperous. The FS-JX is surrounded by high-rise buildings with great fire risk, as shown in Fig. 2. According to the Chinese GB 51080-2015 standard. The FS-JX has the capability of a Class I fire station with a service area of no more than 7 square kilometers.
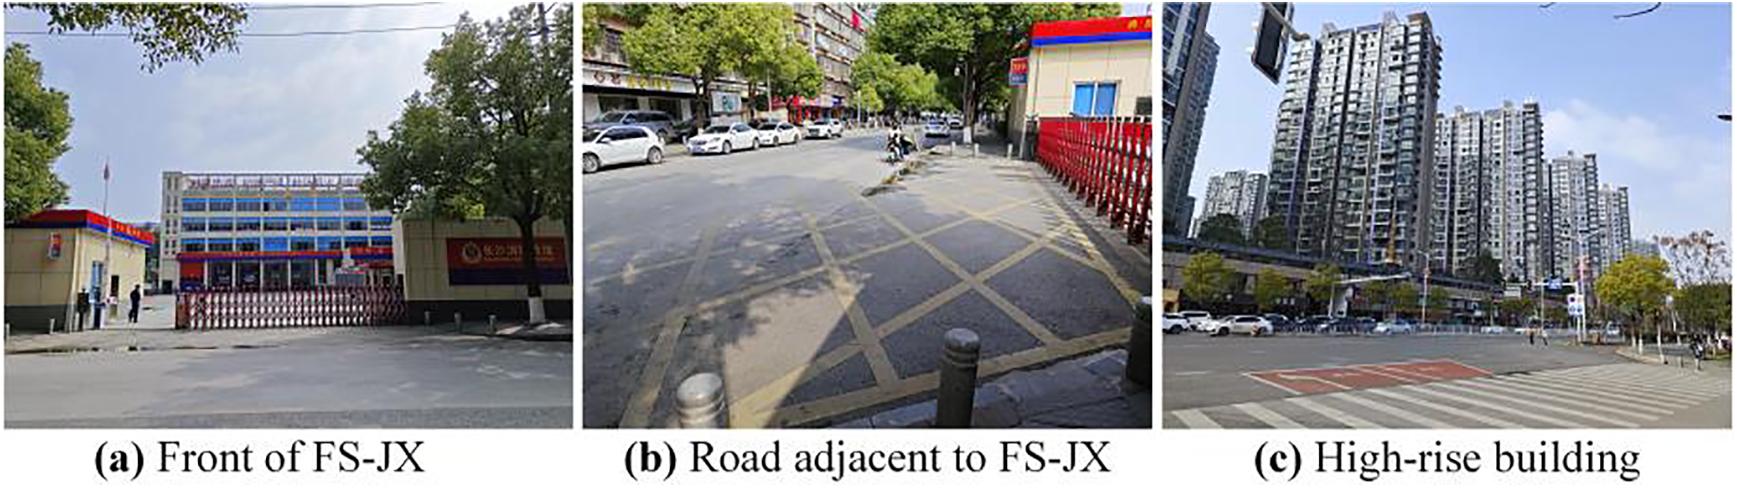
Figure 2: FS-JX and its surroundings
The building footprints in a community can be automatically extracted by traditional GIS technology. The travel time and distance between any two places on the Earth can be calculated by importing the fire station information and the traffic data stored in the road network to GIS. Compared to traditional accessibility analysis, the spatial accessibility of buildings can be calculated more accurately using GIS technology, thus providing a quick and fair delivery of fire services. However, the traffic data stored in GIS lacks real-time capability. Therefore, the travel time calculated using GIS differs from the actual travel time. Compared to GIS, real-time traffic conditions are considered in online maps. A large amount of traffic data and POI information is stored in online maps. Using online maps, the geographic information of most buildings, such as residential communities, hotels, shopping malls, factories, and schools, including fire stations, can be structured and then parsed as longitude and latitude.
In this paper, the travel times calculation model and the effective coverage simulation model were combined to simulate the effective coverage of FS-JX. Firstly, the travel times calculation model was used to calculate fire trucks’ travel times and travel distances. Secondly, the effective coverage simulation model was used to simulate the effective coverage of FS-JX.
3.1 The Travel Times Calculation Model
Based on the data crawl function of online maps, a numerical model was developed to calculate the travel times of fire trucks in real time [8,12,13,33]. The calculation process of the model can be divided into 6 steps.
The longitude and latitude of FS-JX can be obtained by parsing the geographic information of FS-JX.
The surrounding buildings’ POI can be extracted using the longitude and latitude information of FS-JX.
After examining the POIs and deleting the ineffective POIs, the remaining POIs that present the fire risk points are effective and can be used to calculate the travel times of fire trucks.
The longitude and latitude information of FS-JX and its surrounding POIs construct the calculation parameters.
3.1.5 Travel Times Calculation
The parameters obtained in Step 4 can be used to calculate the travel times and travel distances combined with traffic data stored in online maps by calling the Web API of online maps. However, the travel times calculated directly are those of ordinary vehicles because they produce traffic data under the restrictions of traffic lights, etc. According to GB 51080-2015 in China, special vehicles such as fire engines, ambulances, police cars, etc., are not limited to any driving velocity and traffic lights, making the travel times of fire trucks quite shorter than those of ordinary vehicles. However, the traffic data of fire trucks is unpublic due to data protection. Therefore, it is necessary to achieve the conversion from the travel times of ordinary vehicles to the travel times of fire trucks by multiplying the earlier with the reduction factor (RF). In previous studies, the RF was set up for 80% [12,33,34], meaning that fire trucks’ travel velocity was 25% quicker than ordinary vehicles. In this paper, based on the investigation of 86 firefighters in China, the RF was set to 70%, 80%, and 90% [33].
All data, including the travel times of fire trucks, are stored in the database SQLite.
3.2 The Effective Coverage Simulation Model
The travel times calculation model calculates fire trucks’ travel times and travel distances. To evaluate the fire services of FS-JX, the simulation model has been developed as follows [8,12,13,33].
3.2.1 Target Travel Time Determination
The effective coverage area of a fire station is decided on the response time. The response time of fire rescue consists of the preparation time after receiving a fire alarm and the fire trucks' travel time. However, the preparation time is usually constant and limited to 1 min due to the strict rules regarding the preparation time for firefighters. In contrast, the travel time of fire trucks can change from 1 min to more than 1 h due to the dynamic traffic conditions. Therefore, the travel time of fire trucks determines the response time of fire rescue and the effective coverage area of a fire station.
Different countries have various standards regarding the response time of fire rescue. For instance, the fire station locations in the Istanbul metropolitan municipality were optimized based on a response time of 5 min [35]. In the US, the objective is to have the first fire truck arriving within 4 min at 90% of fire incidents [36]. The UK Home Office recommends classifying fires into four risk categories (A, B, C, and D) with corresponding travel time limits of 4–5, 5–8, 8–10, and 10–20 min, respectively [37]. In China, according to GB 51080-2015, firefighters are expected to reach the edge of the service area within 5 min after receiving dispatch orders [14]. This 5 min timeframe includes 1 min for preparation and 4 min for travel. This study’s target value for travel time is 4 min, aligning with the Chinese standard.
3.2.2 Fire Risk Points Classification
By calling the Web API of online maps, the travel time of fire trucks arriving at fire risk points from FS-JX (t) can be calculated. Based on the target travel time, the fire risk points with t ≤ 240 s are named effective covered points, which can be effectively covered; the fire risk points with t > 240 s are named ineffective covered points, which cannot be effectively covered.
All fire risk points are discretely distributed, but the effective coverage of FS-JX is continuously distributed. The polygon area defined by the effective covered points represents the effective coverage of the fire station. Therefore, the boundaries of the effective covered points should be clearly determined to accurately simulate the fire station’s effective coverage.
3.2.3 The Effective Coverage Simulation
This study applied a new boundary search algorithm of planar discrete points developed previously to simulate the effective coverage of FS-JX [7]. Compared to the traditional boundary search algorithm, the new algorithm can be applied to both convex and concave polygons. Effective fire station coverage can be a polygon of any shape; thus, the simulated coverage by the new algorithm is closer to the actual situation. Based on the newly proposed algorithm, the effective covered points are taken as P (t ≤ 240 s), and the ineffective covered points are taken as P (t > 240 s). The implementation of the boundaries search algorithm in this study can be divided into four steps: (1) construct a planar centered by FS-JX; (2) divide the planar into k parts; (3) identify the furthest point in P (t ≤ 240 s) for every divided part; (4) connect all points found by Step 3 in sequence. The technical process of the simulation models in Sections 3.1 and 3.2 of this paper is shown in Fig. 3.
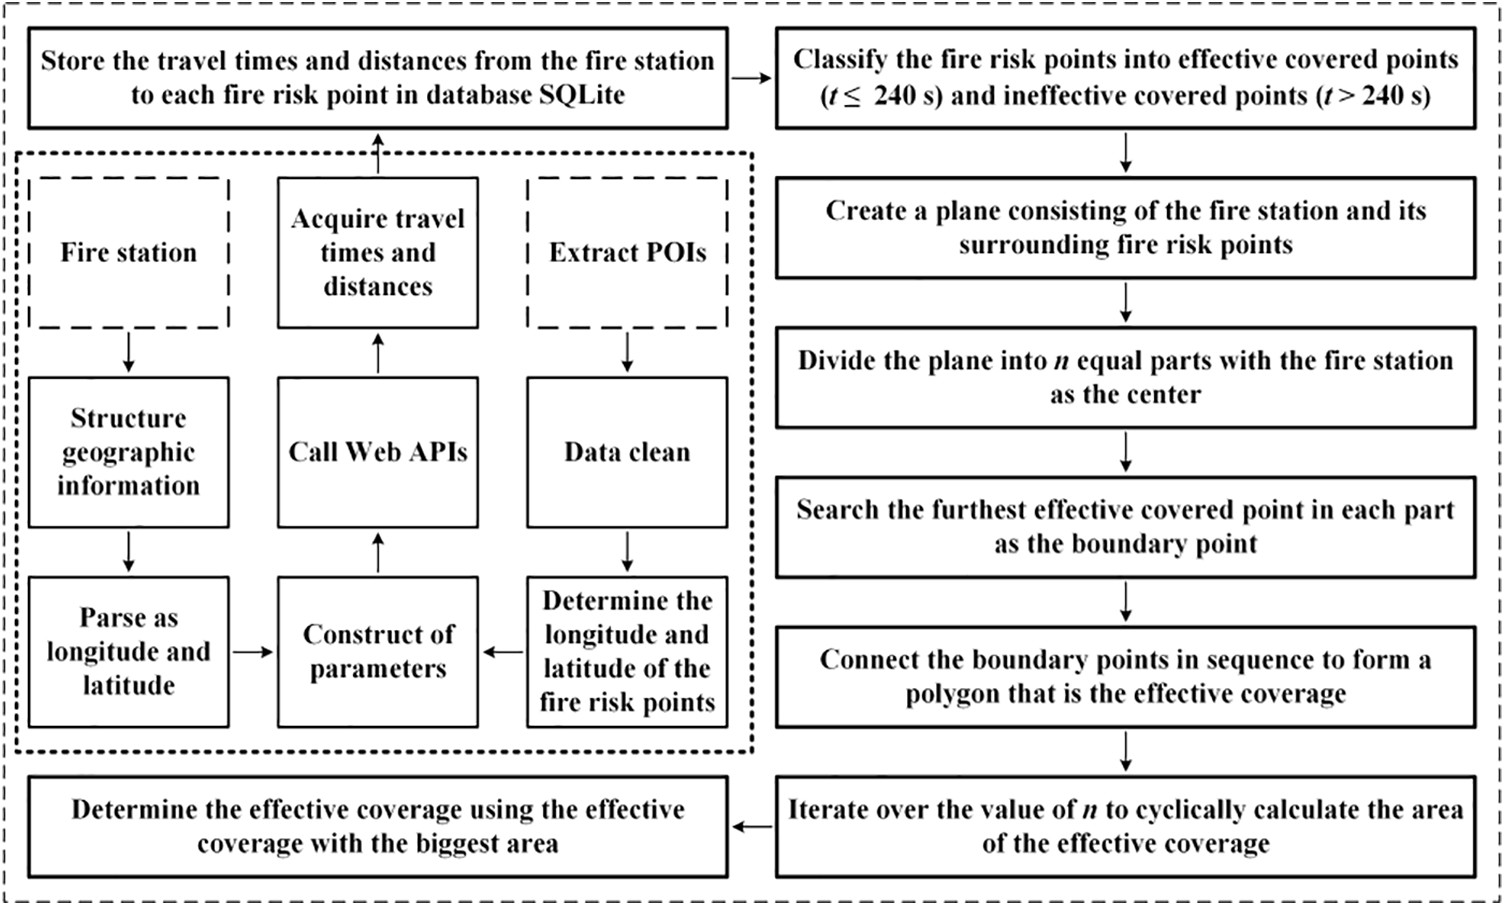
Figure 3: The technical process of the simulation models
The simulated effective coverage of FS-JX varied with traffic conditions. Therefore, the services area (ECA) of FS-JX should be calculated in real time to analyze the variation rules of effective coverage quantitatively. To calculate the ECA, the longitude and latitude coordinates should be converted to two-dimensional coordinates. This paper adopted Mercator coordinates to calculate the ECA [38]. The latitude and longitude coordinates of the i-th fire risk point were defined as (lngi, lati), and the Mercator coordinates of the i-th fire risk point were defined as (xi, yi).
Suppose that there are n fire risk points around FS-JX, then a total of k fire risk points are identified as the boundary points of the polygon standing for the effective coverage of FS-JX. Thereafter, randomly select a boundary point and represent its longitude and latitude coordinates as (lng1, lat1) and its Mercator coordinates as (x1, y1). The longitude and latitude coordinates of the boundary points were sequentially represented as (lng1, lat1), (lng2, lat2), (lng3, lat3), …, (lngk, latk), respectively. According to Eq. (1), the Mercator coordinates of all boundary points were represented as (x1, y1), (x2, y2), (x3, y3), …, (xk, yk), respectively. The ECA of FS-JX can be calculated based on the Shoelace Theorem, as shown in Eq. (1), among which xk+1 = x1, yk+1 = y1.
The firefighting resources (especially fire trucks) can be reallocated according to the variation of ECA. However, it is inconvenient for the government to effectively manage firefighting resources with the dynamic changes of ECAs. Therefore, it is imperative to calculate the time-weighted value of ECA at a continuous time (a day or a week) to help the local government make decisions on optimizing the spatial distribution of firefighting resources. The time-weighted value of ECAs can represent the average value of ECAs in a certain time, and the time-weighted value was defined as TECA. To analyze the variation rules of ECA, m simulation scenarios were set for m time points. The j-th simulation scenario was defined as tj, and the ECA in the j-th simulation scenario was taken as ECAj. The TECA is the integral value of ECAs over time. The calculation formula of TECA in the whole m simulation scenarios is shown in Eq. (2).
After calculating the value of TECA, specific actions should be implemented based on the comparison of TECA with the standard value of 7.00 km2 stipulated in GB 51080-2015. Through the visualization of fire risk distribution, the firefighting resources should be deployed from places with concentrated fire service demand points to places with sparse fire service demand points. In addition, more fire stations should be built to improve the regional effective coverage rate of fire services.
3.3 The Added Index: The Time-Weighted Average Value of Effective Covered Area
In addition to ECA, the average travel time (AT), the average travel distance (AD), and the average travel velocity (AV) of fire trucks could also be simulated. Suppose that the travel time from a fire station to the i-th fire risk point in the j-th simulation scenario is defined as T(i, tj); the travel distance from a fire station to the i-th fire risk point in the j-th simulation scenario is defined as D(i, tj). The calculation formulas of AT, AD, and AV in the j-th simulation scenario are shown in Eqs. (3)–(5).
Similar to the calculation of TECA, the time-weighted values of TAT, TAD, and TAV can be calculated, as shown in Eqs. (6)–(8).
FS-JX is in the center of Changsha, where traffic conditions change throughout the day. As a result, the travel time of fire trucks varies significantly over time. Around 06:00–08:00 and 17:00–19:00 are the peak traffic hours, and around 00:00–04:00 is the period of least traffic density. The simulation scenarios were set up to obtain the dynamic variation characteristics of the effective coverage of FS-JX. Considering that the traffic conditions may differ between weekdays and weekends, the simulation scenarios were set up every hour for a consecutive week from December 12, 2022 (Monday) to December 18, 2022 (Sunday). In addition, the scenarios for peak traffic hours were increased, and four additional simulation scenarios were set up at 7:30, 8:30, 17:30, and 18:30. Therefore, 196 simulation scenarios were set for 7 days.
In the data crawling phase, 9,917 risk points were obtained as samples by calling the Web API of Baidu Map. Theoretically, 1,943,732 sets of sample data could be obtained in the end. However, only 195 estimation scenarios were valid, and 1,933,815 sets of valid sample data were obtained. The values of ECA at different RF, AT, AD, and AV in all simulation scenarios are shown in Appendix A
The results of data analysis showed that the ECAs of FS-JX present a significant periodic pattern during the whole week. During the daytime, the traffic was more congested than at night, the distance traveled by fire vehicles was shorter within the same time, and the value of ECA was lower; at night, the traffic was smoother than during the daytime, the distance traveled by fire vehicles within the same time was longer and the value of ECA was higher. In addition, the AT and AV variations also present a periodic pattern. The variations of the AT are opposite to the variations of the ECA because the more travel time the fire trucks take, the fewer fire risk points will be effectively covered, and the value of the ECA will be lower. On the contrary, the variations of the AV are the same as the ECA’s because the quicker fire trucks travel, the more fire risk points can be reached simultaneously, and the value of the ECA will be higher.
4.2 Detailed Results and Typical Simulation Scenarios Visualization
In order to analyze the variation rules of ECA more brightly, the data of ECAs in all scenarios at different RF are shown in Fig. 4 in a line chart form. Combining the detailed data of ECA presented in Table S1 in Appendix A and Fig. 4, it is easy to see that when the RF was set to 70%, the value of ECA fluctuated between 2.16 and 6.20 km2, and the corresponding TECA was calculated as 4.40 km2; when the RF was set to 80%, the value of ECA fluctuated between 1.58 and 4.17 km2, and the corresponding TECA was calculated to be 3.26 km2; when the RF was set to 90%, the value of ECA fluctuated between 1.09 and 3.71 km2, and the corresponding TECA was calculated to be 2.64 km2. Whatever value the RF was set to, the variations of ECA over time indicated that the dynamic change of traffic conditions greatly influenced the effective coverage and fire services level of fire stations. Whatever value the RF was set to, the value of TECA is much lower than 7.00 km2, indicating that the fire services level of FS-JX is relatively low. Therefore, firefighting resources (especially fire trucks) must be reasonably allocated to improve the level of fire services. In addition, because fire trucks travel faster in smaller RF, the ECA and the TECA will be larger.
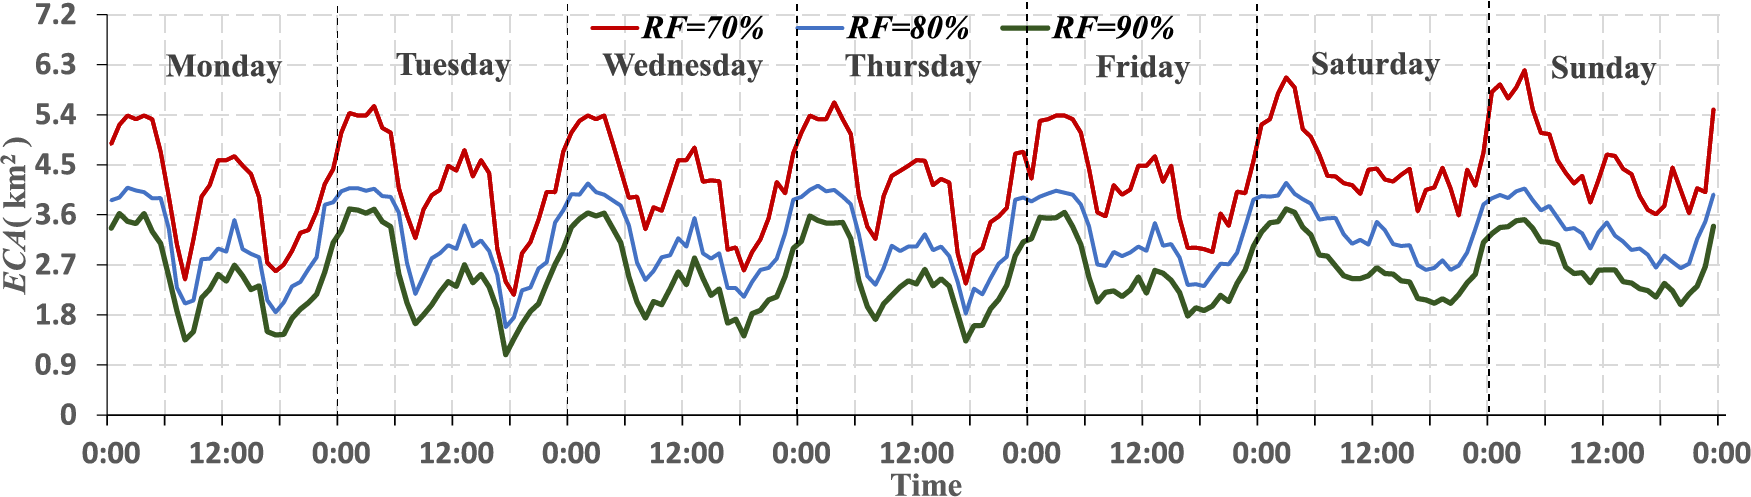
Figure 4: The variations of ECA in 195 simulation scenarios at different RF
From Fig. 4, it is easy to observe that the ECA is smaller during the day and larger at night. The ECA reached the minimum throughout the day at 7:30–8:00 and 17:30–18:30 when the traffic conditions were the most congested; on the contrary, the ECA reached the maximum throughout the day approximately at 0:00–5:00 when the traffic conditions were the smoothest. In addition, impacted by the COVID-19 pandemic, the number of vehicles going out in Changsha was greatly reduced in the last two days (Saturday and Sunday). Consequently, the ECA was generally higher during these two days, especially during the daytime compared to the previous days.
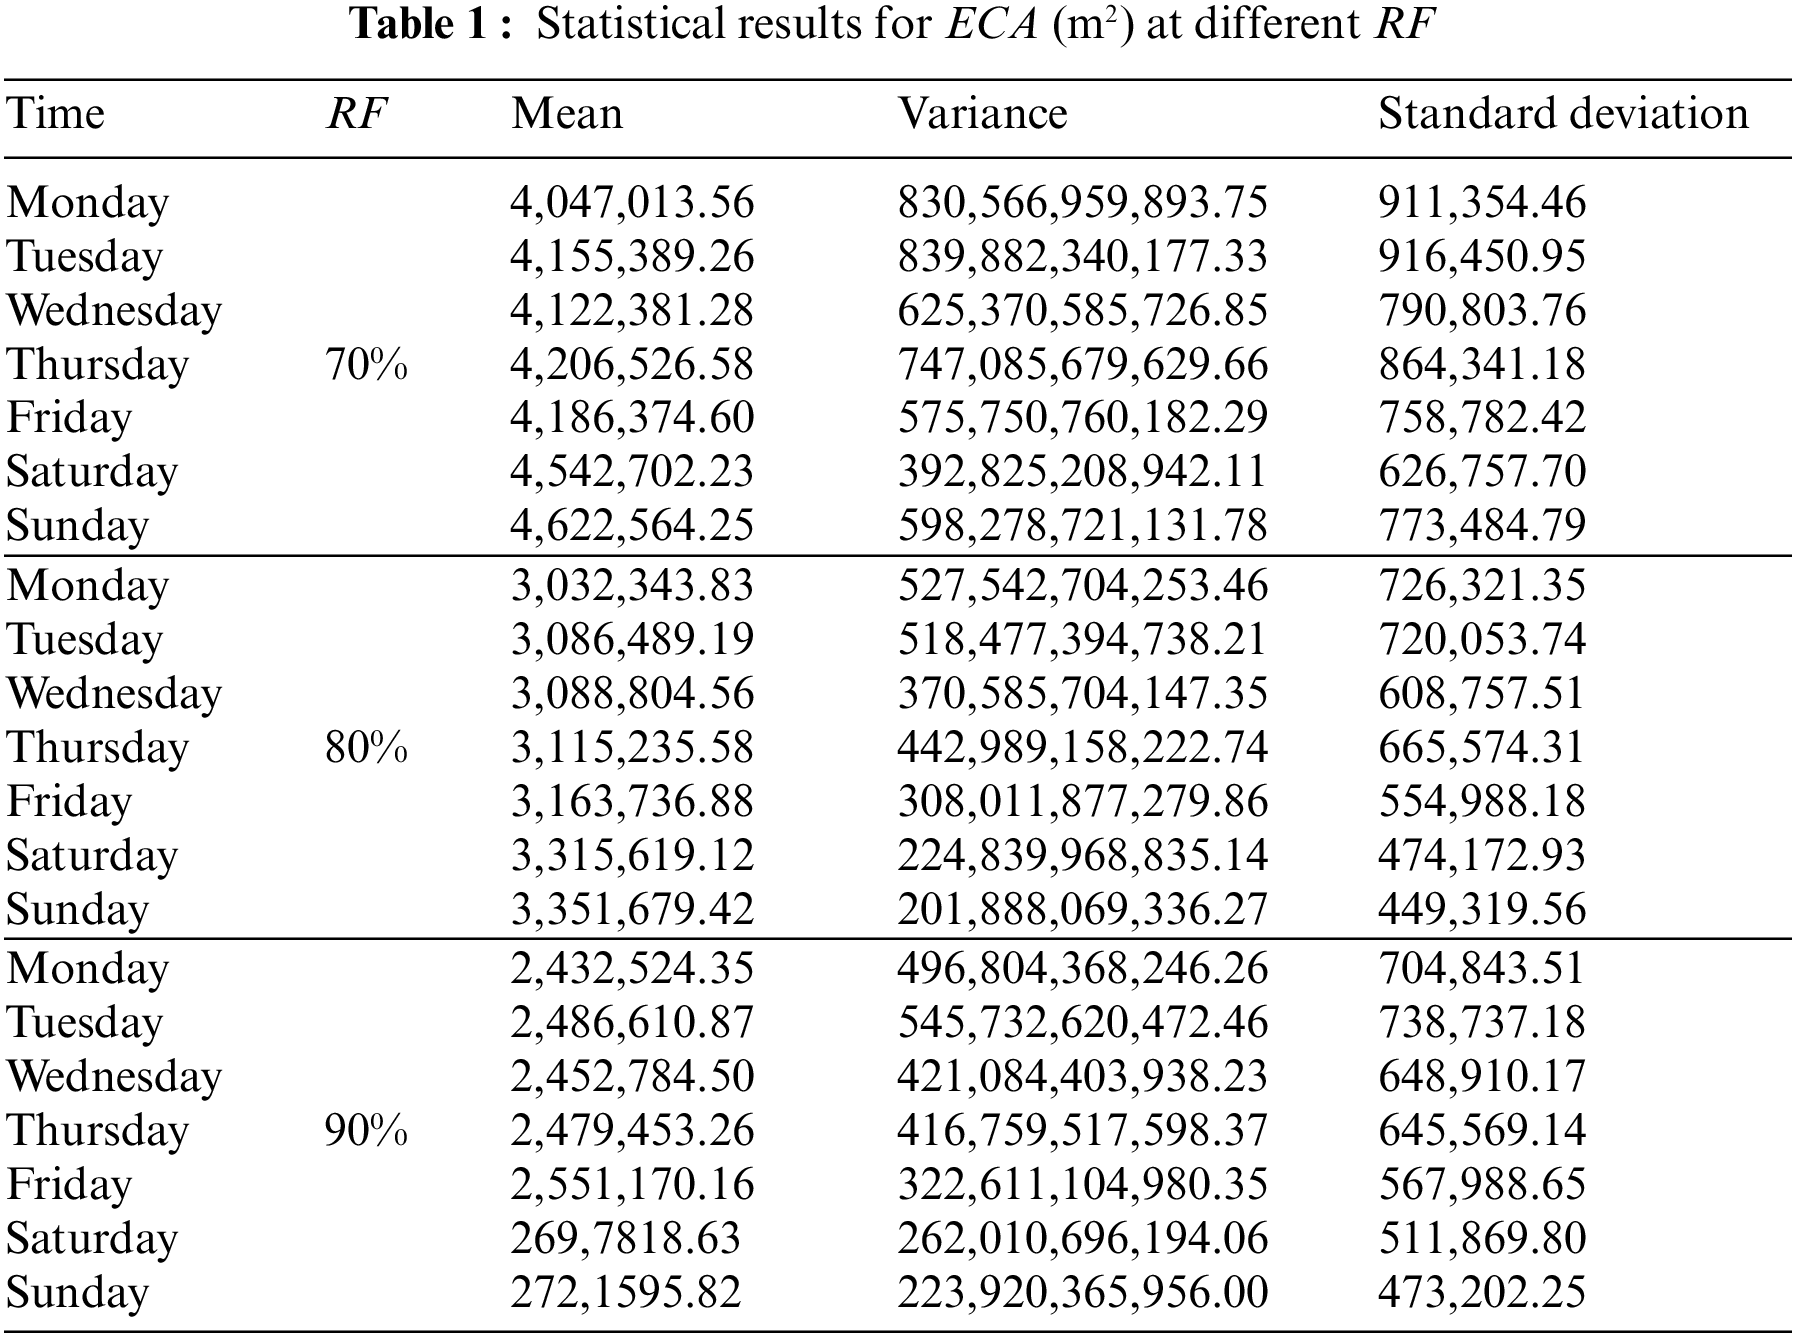
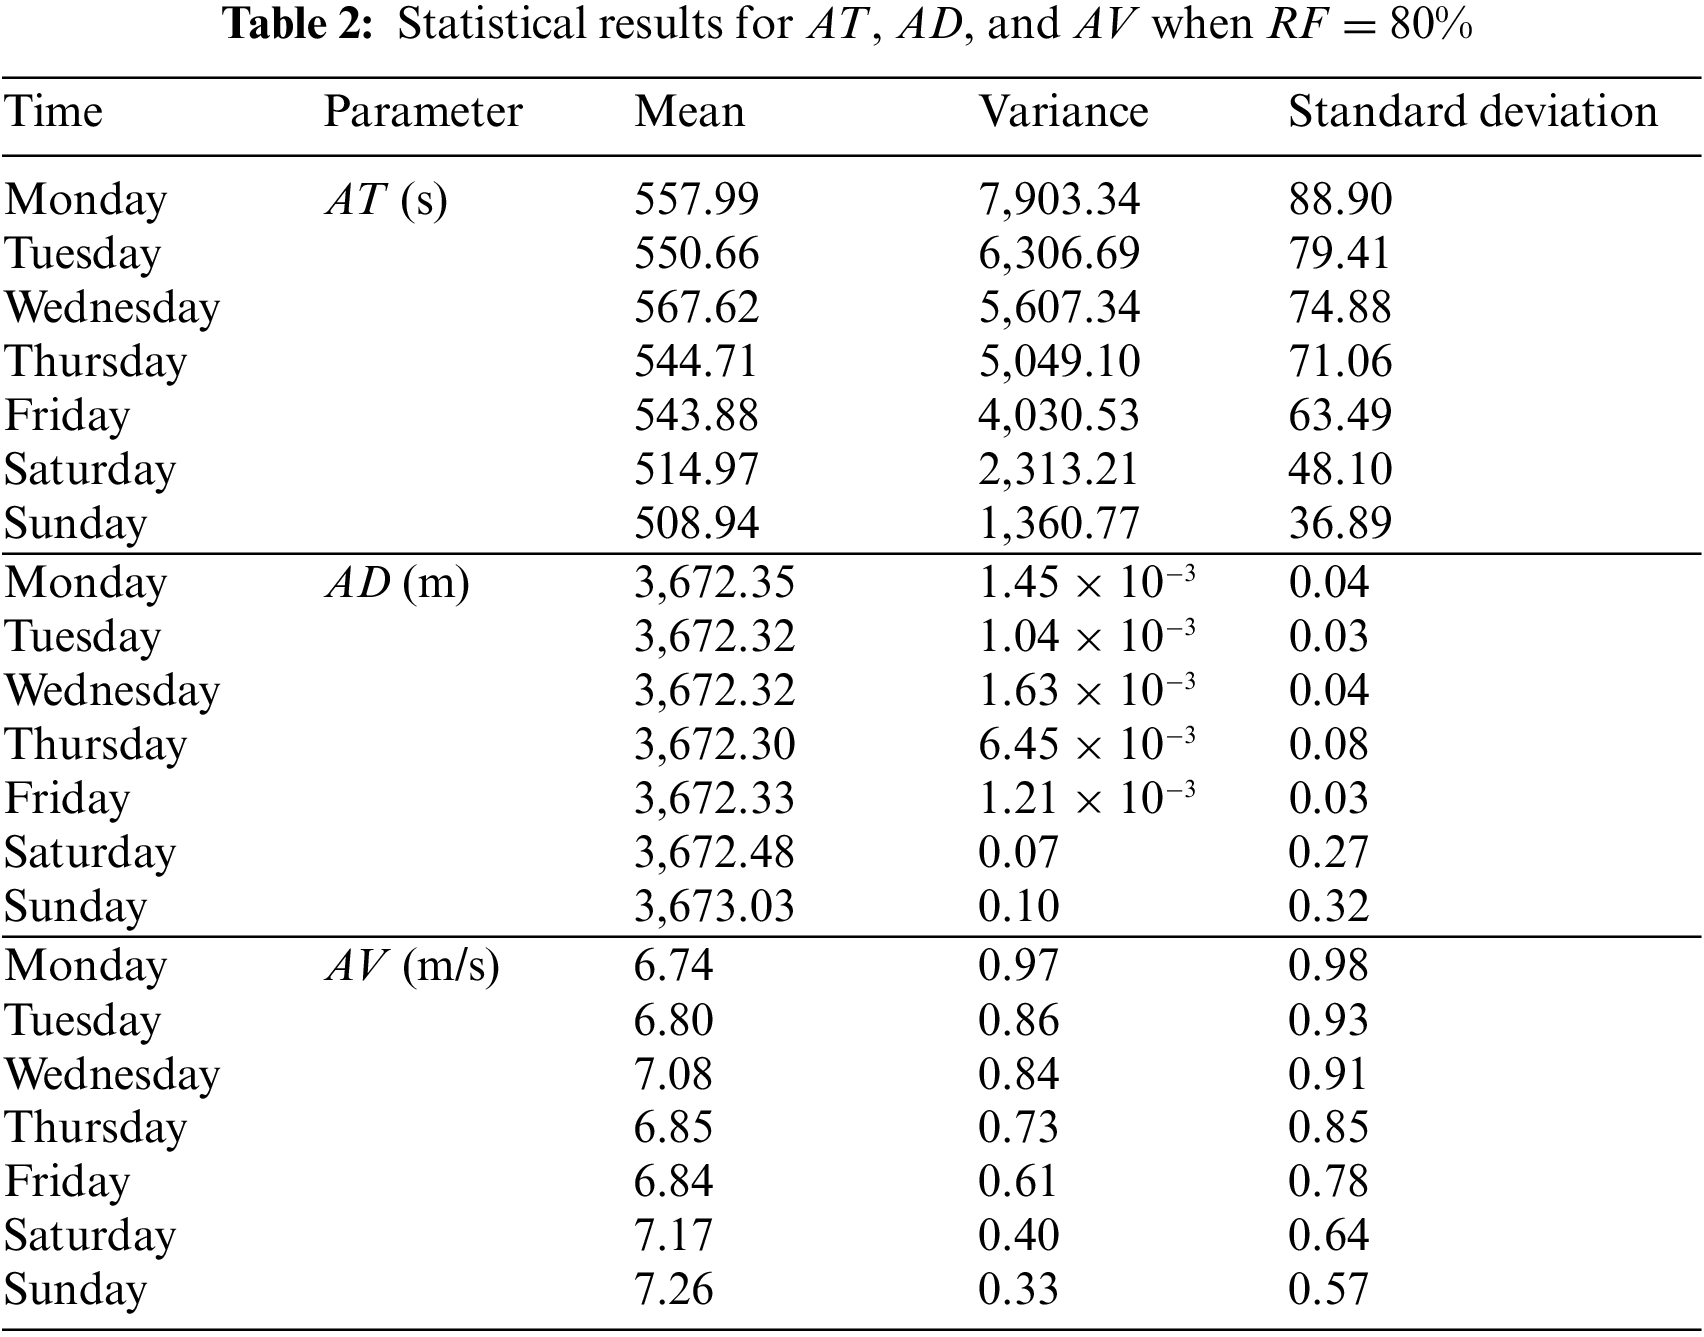
The detailed data of ECA in 195 simulation scenarios are shown in Table S1 in Appendix A. To quantitatively analyze the impact of the RF on travel times of fire trucks, the mean value, the variance, and the standard deviation of ECA in the whole week are calculated, as shown in Table 1. From Table 1, it can be seen that the mean value, the variance, and the standard deviation are all getting smaller, with RF getting larger. With smaller RF, the travel velocity of fire trucks is quicker, and the longer distance can they arrive during the same time. As a result, the fluctuation range of ECA is bigger when the RF is smaller. The variations of mean value show that the ECA is increasing throughout the entire week. The results show that the effective coverage is getting bigger because the traffic in Changsha City is getting smoother due to the fewer vehicles on the street daily under the impact of the COVID-19 pandemic.
Referring to previous studies, the RF value is 80% for detailed data and visual analysis [8,13,33]. Assuming that the RF was 80%, the ECA reached the minimum at 17:30 on Tuesday and the maximum at 3:00 on Saturday. In order to analyze the variation rules of AT, AV, and AD more comprehensively, the data of AT, AV, and AD in all scenarios are presented in Figs. 5–7 with the assumption that the RF was 80%. The variation rules of AT are opposite to the variation rules of ECA. The variation rules of AV are the same as the variation rules of ECA. However, the variation rules of AD are different from the variation rules of the AT and the AV, and the value of AD over time fluctuated slightly. In the last two days, the value of AD increased greatly due to the COVID-19 pandemic. Many roads were closed these two days, making fire trucks travel more distances to arrive at the same place. It is easy to see that the traffic operation also greatly influenced the fire services. Therefore, the local government must resume the traffic as soon as possible after a car accident or other emergencies requiring close roads. Like the calculation of the TECA, the time-weighted average values of AT, AD, and AV were all calculated. The TAT, TAD, and TAV were calculated to be 526.10 s, 3,672.45 m, 7.07 m/s, respectively. Among them, the TAT was much larger than the target travel time of 240 s, indicating that fire services cannot effectively cover most fire risk points near the FS-JX.
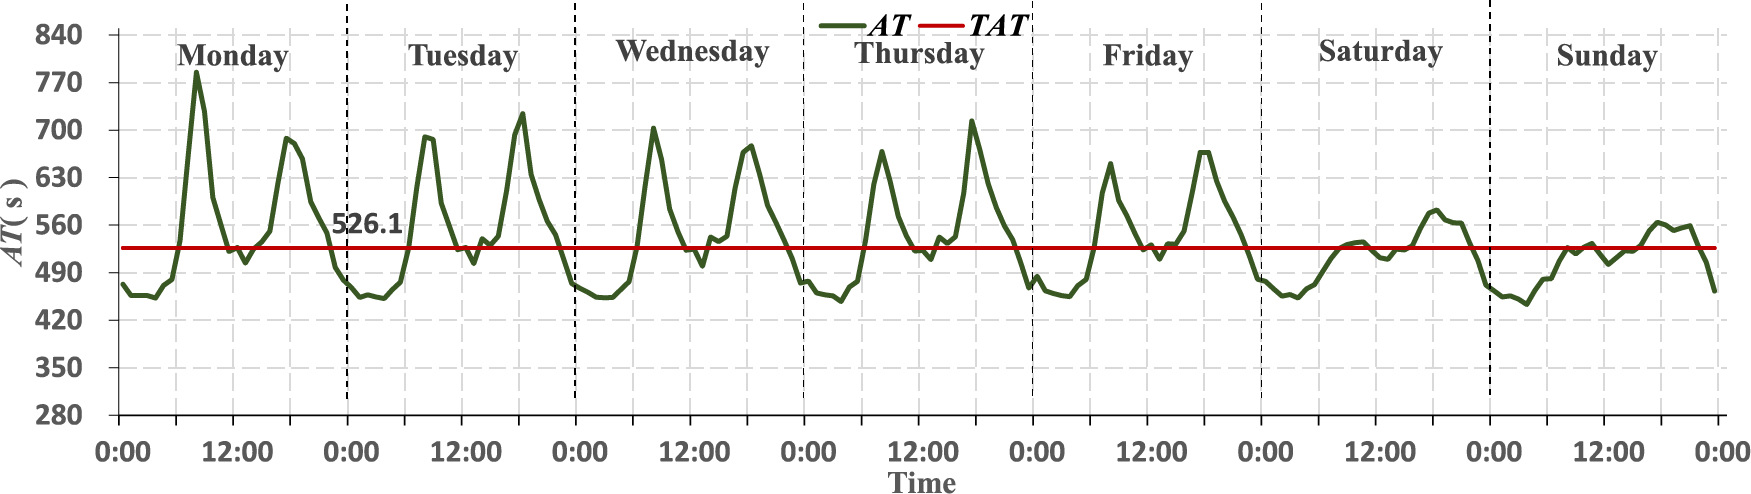
Figure 5: The variations of AT in 195 simulation scenarios
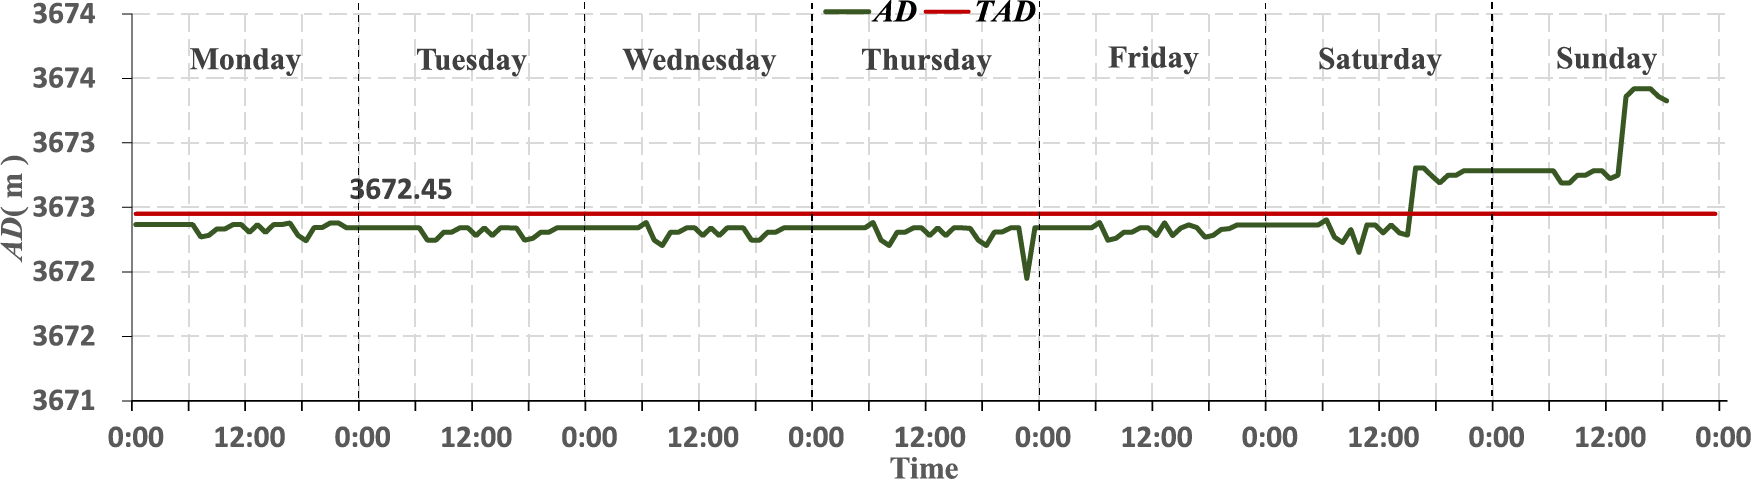
Figure 6: The variations of AD in 195 simulation scenarios
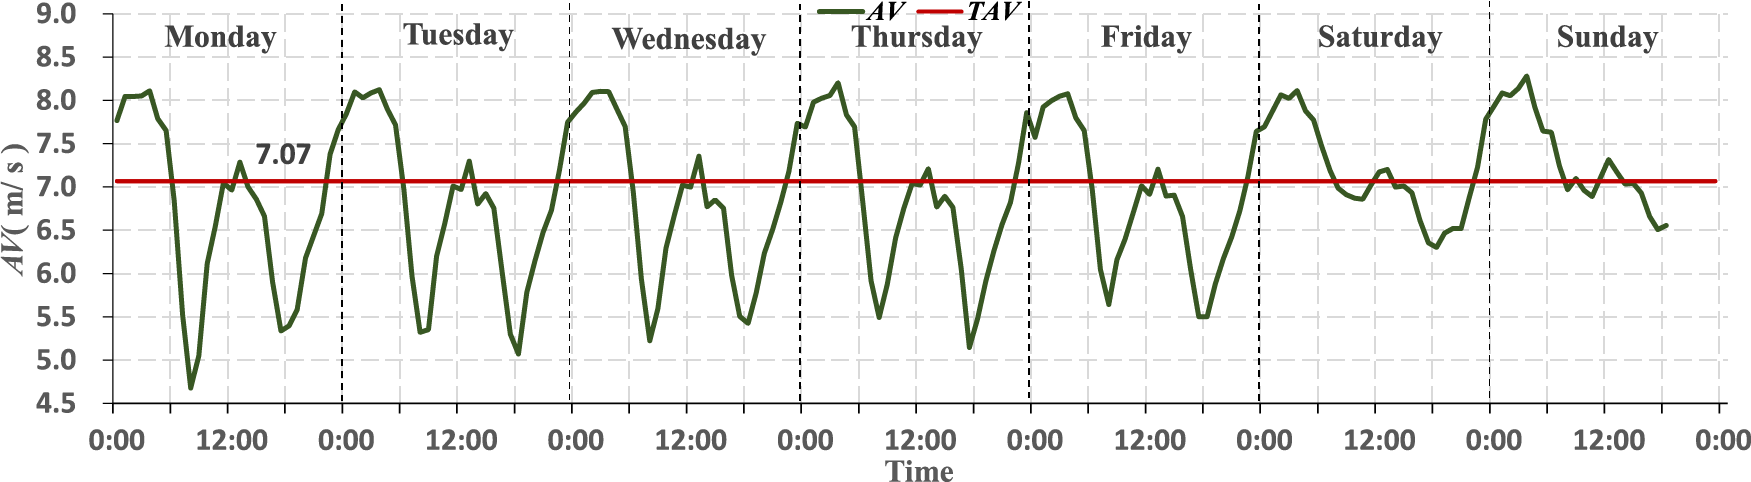
Figure 7: The variations of AV in 195 simulation scenarios
The detailed data of AT, AD, and AV in 195 simulation scenarios is shown in Table S2 in Appendix A. Based on the detailed data, the mean value, the variance, and the standard deviation are calculated and presented in Table 2. From Table 2, it can be observed that the variation rules of AV are consistent with the variation rules of ECA; the variation rules of AT are contrary to the variation rules of ECA. With traffic getting smoother due to the COVID-19 pandemic, the velocity of fire engines is faster during the same time. The variations of AD are few and can be ignored.
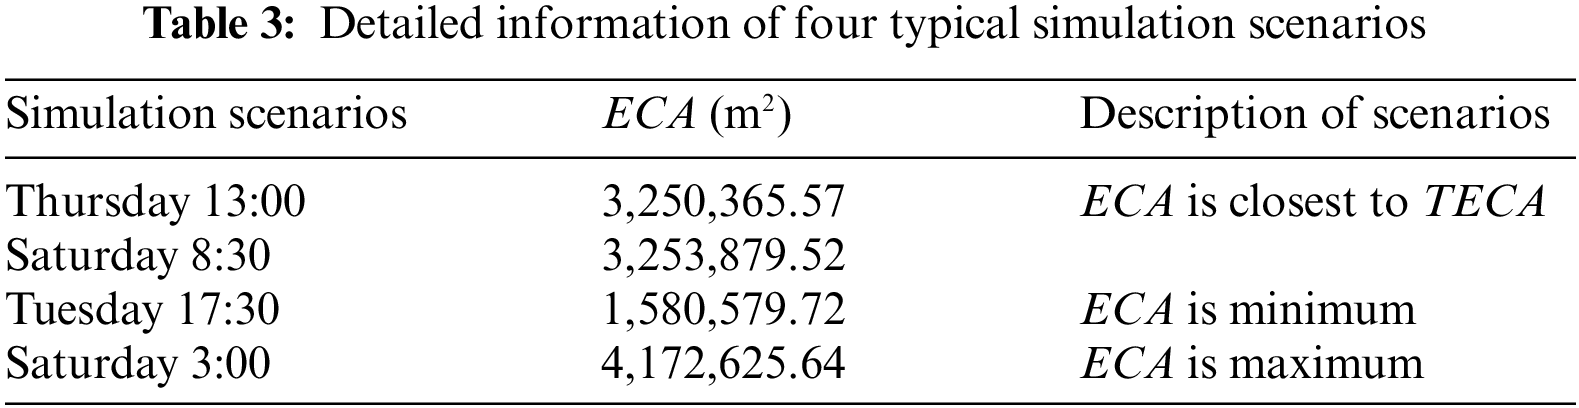
To take feasible measures to improve the fire services by expanding the effective coverage of FS-JX, four typical simulation scenarios were set up for visualization analysis. Detailed information on the scenarios is presented in Table 3. The four typical simulation scenarios included two scenarios with ECA closed to TECA and scenarios with mini and max ECA.
The visualization of the typical simulation scenarios is presented in Fig. 8, providing a horizontal angle for analyzing the fire risk points’ distribution characteristics and the effective coverage variation rules. It can be seen that the effective coverage points are concentrated near FS-JX. However, many risk points near FS-JX still cannot be covered effectively. This is because many buildings (including large residential communities, vegetable markets, old neighborhoods, etc.) are excluded from fire services coverage due to the difficulty of vehicles entering these buildings. Therefore, some specific measures are needed to improve the fire services of FS-JX, such as strengthening the reconstruction of old communities, regulating the vehicles parking in vegetable markets to clear the fire passages, and increasing the number of entrances in large residential communities.
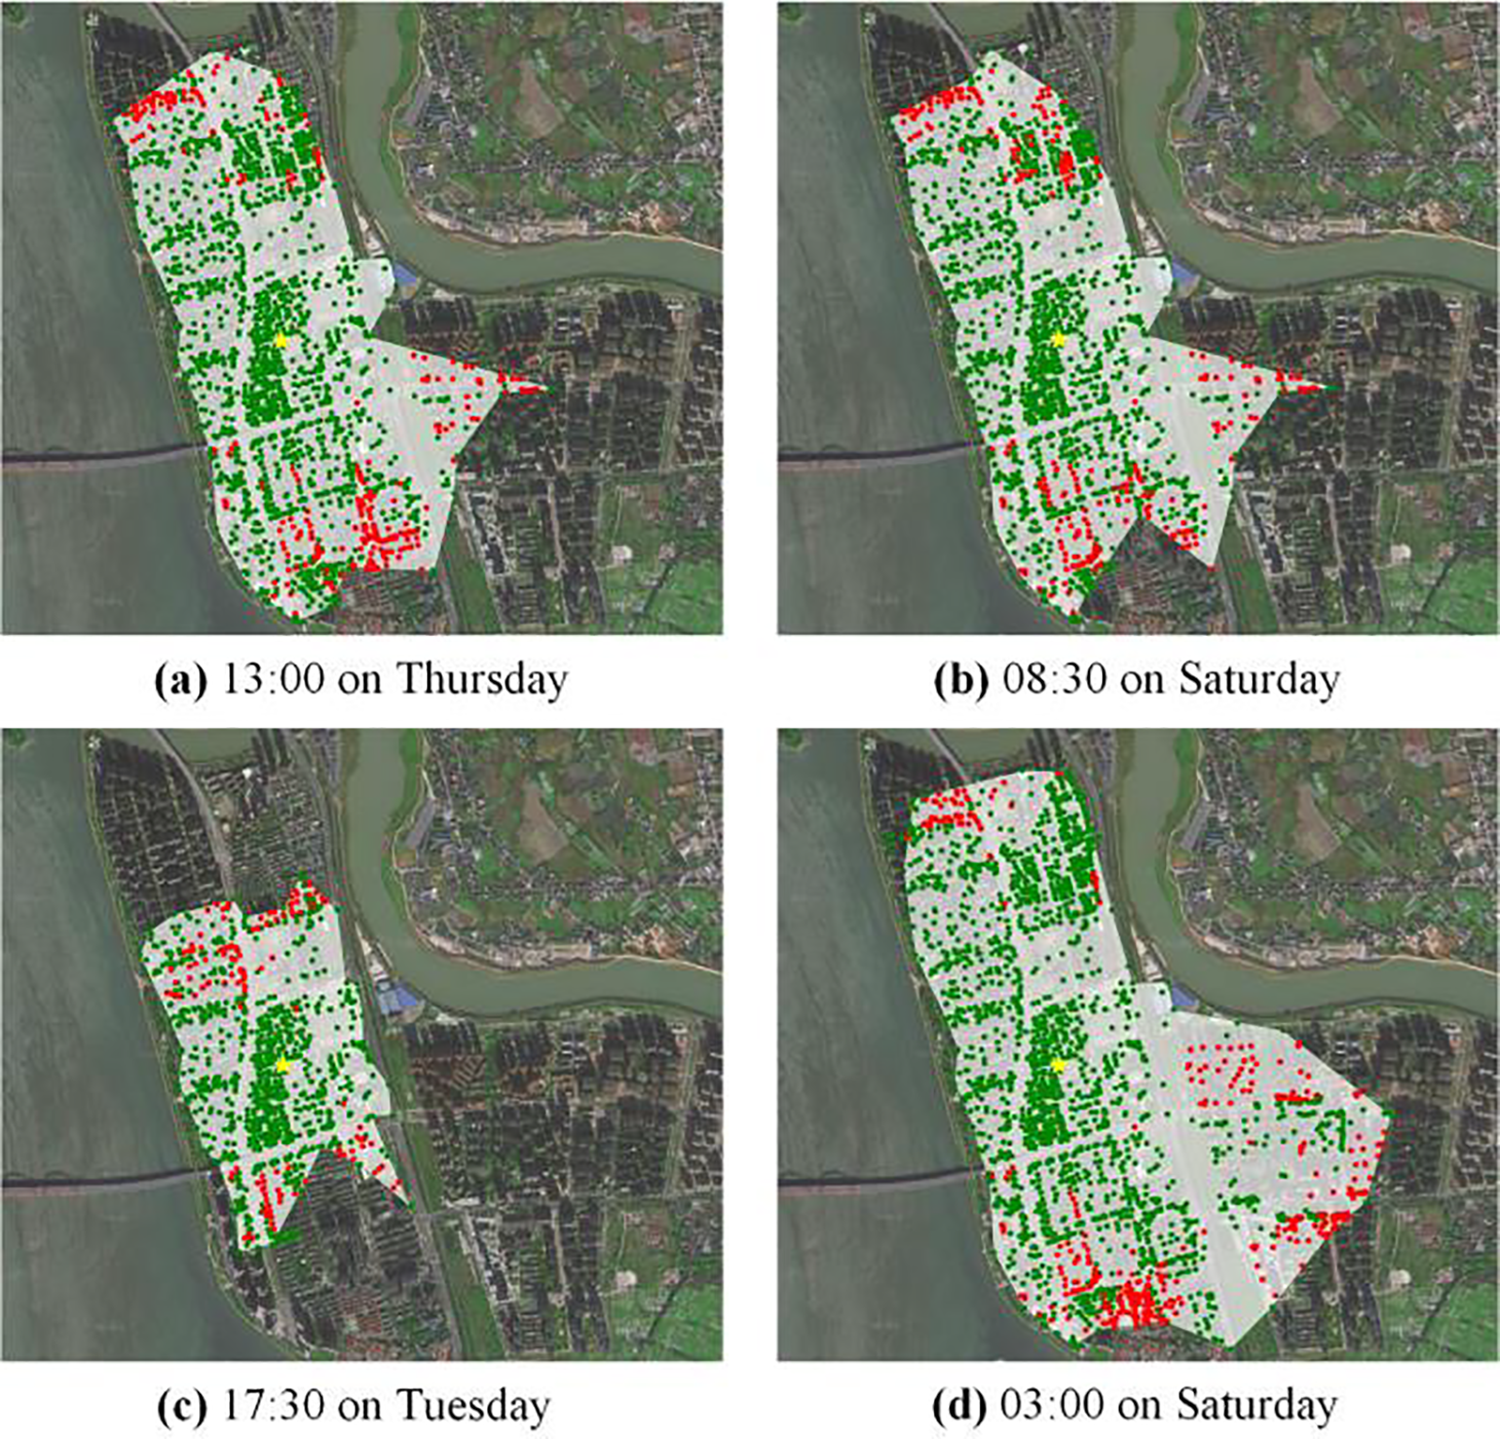
Figure 8: The effective coverage of FS-JX in the four typical simulation scenarios (green dots represent effective covered points and red dots represent ineffective covered points; visualization results when RF = 70% and RF = 90% are presented in Appendix A: Figs. S1 and S2)
In order to understand the variation rules of ECA from a vertical angle, the day with the biggest variation of ECA (Tuesday) was selected as the visualization target. The visualization results of the total 28 simulation scenarios on Tuesday are shown in Fig. 9.
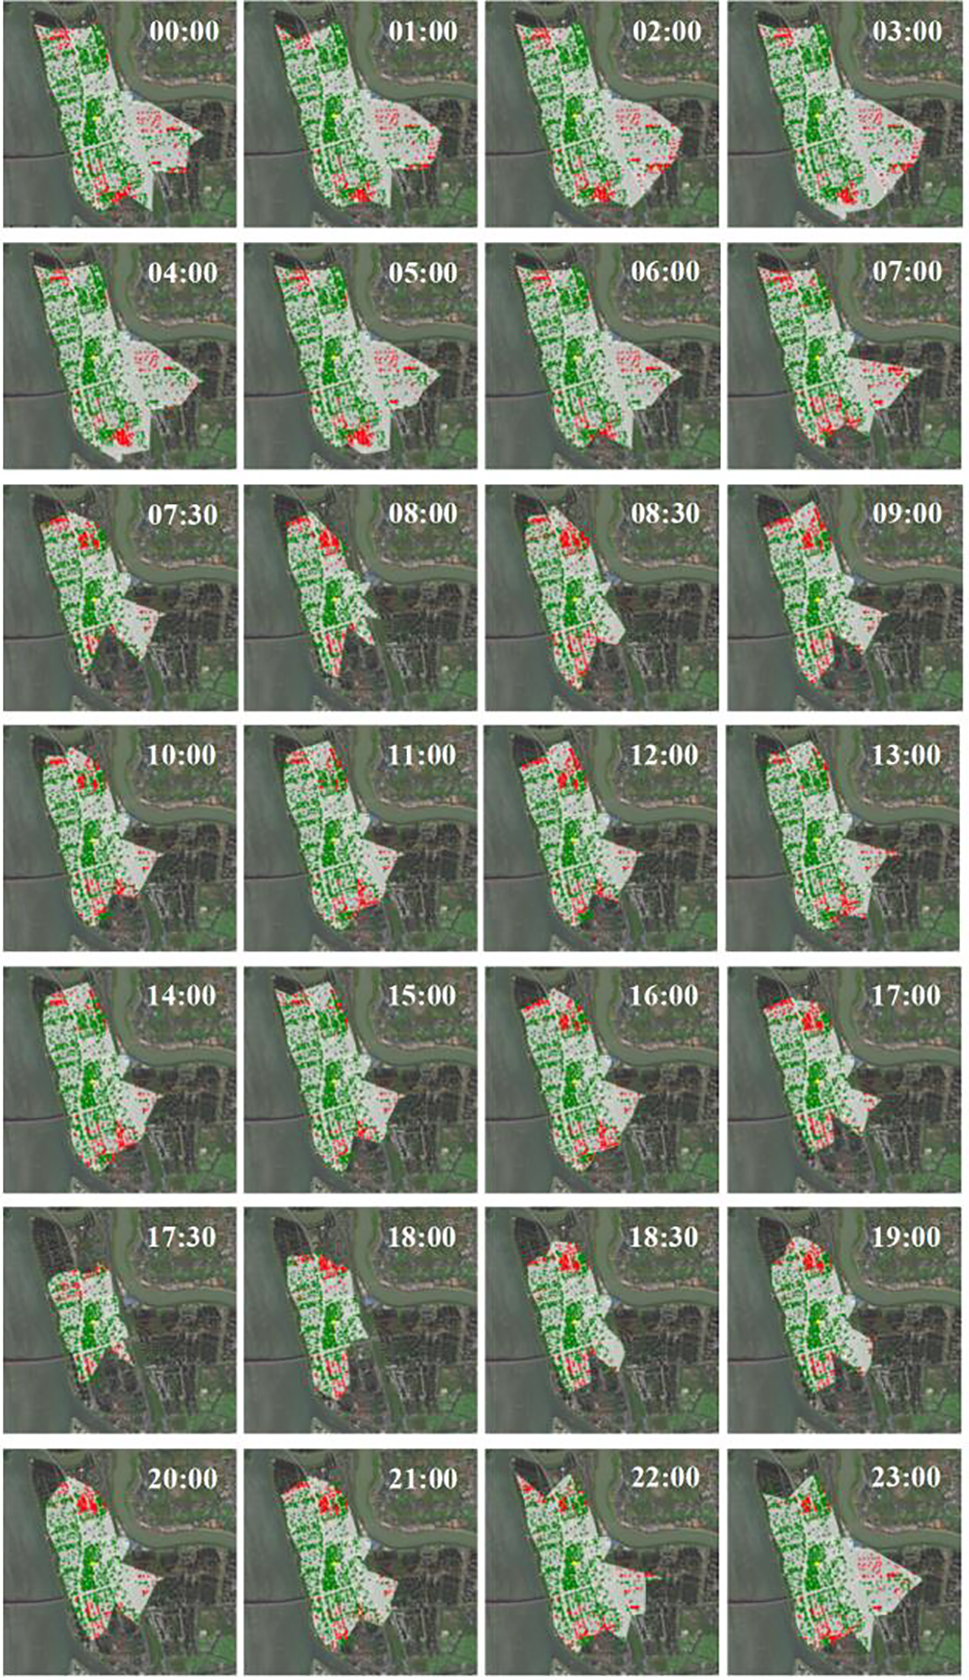
Figure 9: The visualization of effective coverage in 28 simulation scenarios on Tuesday (visualization results when RF = 70% and RF = 90% are presented in Appendix A: Figs. S3 and S4)
From Fig. 9, the effective coverage changes dynamically over time, and its variation rules are based on Fig. 4. The effective coverage was much smaller during the daytime than at night. Due to the random traffic flows, the shapes of the polygon representing the effective coverage of FS-JX are all different in the 28 scenarios. The areas of the polygon change greatly throughout the day, indicating that ECA varies significantly during the day. Regardless of whether the traffic condition is congested or smooth, there are many ineffective covered points in the simulated effective coverage, suggesting that there are always deviations between the simulated effective coverage and the actual effective coverage. Therefore, the algorithm for simulating the effective coverage should be improved consecutively to obtain the most accurate and scientific simulation results. In addition, the shapes of effective coverage are impacted significantly by rivers. As a result, the fire risk points across the rivers cannot be covered effectively.
Combining Figs. 4 and 9 shows that the effective coverage of FS-JX has been separated by the rivers (River R1, River R2, and River R3). However, except for a few highways, only three bridges (Bridge B1, Bridge B2, and Bridge B3) and one tunnel (Tunnel T1) connect fire risk points across the rivers with the land where the FS-JX is located. In addition, the bridges are long, forcing fire trucks to pass when traffic conditions get congested, especially during commuting hours. As a result, the fire services can be improved in two aspects. On the one hand, new bridges and tunnels should be built, or the roads of existing bridges should be widened to earn more time for fire rescue. On the other hand, the locations of fire stations should be adjusted, and the firefighting resources should be allocated dynamically when considering the separation impact of rivers. Consequently, the government must consider the impact of rivers before constructing new fire stations. By vertically observing and analyzing the variation rules of ECA, the space layout of firefighting resources can be adjusted, and the usage efficiency of firefighting resources can be improved. The method proposed in this paper suits common scenarios but does not suit the simulation of effective coverage after an earthquake and the prompt allocation of firefighting resources. Therefore, it is necessary to improve the models for a wider range of applications [39].
Since effective coverage of fire stations varies dynamically with traffic conditions, it is difficult for the government to evaluate the effectiveness of fire stations’ fire services. In this paper, the travel times calculation model and the effective coverage simulation model were used to simulate a fire station in China. The real-time effective coverage of FS-JX was simulated, and the ECA was calculated by calling the Web API of Baidu Maps. In order to achieve a reasonable allocation of firefighting resources and an effective evaluation of urban fire services, the time-weighted value of ECAs within a consecutive week (TECA) was added to the simulation models as a new index. The effectiveness of fire services can be evaluated by comparing TECA to the maximum area of effective coverage in a fire station specified in China’s national standard GB 51080-2015. In previous studies, the influence of rivers on urban fire services has been ignored. Therefore, FS-JX, a fire station surrounded by rivers on three sides located in Changsha, China, was chosen as the study object.
A total of 196-time points in a consecutive week were set as simulation scenarios for effective coverage (195 effective simulation scenarios) to grasp ECA’s variation rules over time. In the data extraction phase, 9,917 risk point POIs around FS-JX were extracted, and 1,933,815 sets of valid sample data were obtained. In order to analyze the variations of ECAs more accurately, the reduction factor of travel times of fire trucks was assumed to be 70%, 80%, and 90%. With the assumption that the RF is 80%, the results of data analysis show that the ECA fluctuated between 1.58 and 4.17 km2. The corresponding TECA was calculated to be 3.26 km2. The results indicate that the fire services level of FS-JX is quite low and has great room for improvement. The visualization results show that the effective coverage points are concentrated near FS-JX. However, many fire risk points around FS-JX are still out of effective coverage. By visualizing the four typical simulation scenarios and all 28 simulation scenarios on Tuesday, it is obvious to see the separation impact of River R1, River R2, and River R3 on the fire services of FS-JX. Therefore, urban planners and relevant departments need to consider the impacts of terrain factors such as rivers. In summary, to improve urban fire services, there are two ways to achieve scientific planning for the fire stations: fire station locations should be planned according to the data and visualization results, and the impact of rivers should be considered before building new fire stations.
In the future, the models for simulating effective coverage should be improved, considering special scenarios when the travel of fire trucks can be impacted after an earthquake disaster. In addition, the impact of the mountain terrain on the fire services should also be studied. The proposed simulation models can provide data support for optimizing the fire station locations, increasing the effective coverage of fire stations, and improving the fire services level.
Acknowledgement: The authors wish to express their sincere gratitude to all anonymous reviewers and journal editors for their invaluable expertise and insightful suggestions, which have significantly enhanced the quality of this paper.
Funding Statement: This study received financial support from the National Natural Science Foundation of China (No. 52204202), the Hunan Provincial Natural Science Foundation of China (No. 2023JJ40058), and the Science and Technology Program of Hunan Provincial Departent of Transportation (No. 202122).
Author Contributions: The authors confirm contribution to the paper as follows: study conception and design: Liu Dingli, Zhu Sicheng; data collection: Liu Weijun, Zhu Sicheng; analysis and interpretation of results: Li Ying, Zhou Tian, Zhu Sicheng; draft manuscript preparation: Liu Dingli, Zhu Sicheng. All authors reviewed the results and approved the final version of the manuscript.
Availability of Data and Materials: There are no restrictions on the availability of data and materials. Therefore, all materials and data used in this review are readily accessible to interested readers. Some data are listed in Appendix A. If you have any interest in all the detailed data used in this paper, please email zhusicheng@stu.csust.edu.cn.
Conflicts of Interest: The authors declare that they have no conflicts of interest to report regarding the present study.
References
1. Jones, M. W., Abatzoglou, J. T., Veraverbeke, S., Andela, N., Lasslop, G. et al. (2022). Global and regional trends and drivers of fire under climate change. Reviews of Geophysics, 60(3). https://doi.org/10.1029/2020RG000726 [Google Scholar] [CrossRef]
2. Wang, Z. N., Chen, J., Cheng, W. C., Arulrajah, A., Horpibulsuk, S. (2018). Investigation into the tempo-spatial distribution of recent fire hazards in China. Natural Hazards, 92(3), 1889–1907. https://doi.org/10.1007/s11069-018-3264-5 [Google Scholar] [CrossRef]
3. Pellegrini, A. F. A., Ahlstrom, A., Hobbie, S. E., Reich, P. B., Nieradzik, L. P. et al. (2018). Fire frequency drives decadal changes in soil carbon and nitrogen and ecosystem productivity. Nature, 553(7687), 194–198. https://doi.org/10.1038/nature24668 [Google Scholar] [PubMed] [CrossRef]
4. National Fire and Rescue Administration Homepage. https://www.119.gov.cn/gk/sjtj/2022/26442.shtml (accessed 24/03/2023). [Google Scholar]
5. Jaldell, H. (2016). How important is the time factor? Saving lives using fire and rescue services. Fire Technology, 53(2), 695–708. https://doi.org/10.1007/s10694-016-0592-4 [Google Scholar] [CrossRef]
6. Runefors, M. (2019). Measuring the capabilities of the swedish fire services to save lives in residential fires. Fire Technology, 56(2), 583–603. https://doi.org/10.1007/s10694-019-00892-y [Google Scholar] [CrossRef]
7. Chen, Y. H., Wu, G. H., Chen, Y., Xia, Z. L. (2023). Spatial location optimization of fire stations with traffic status and urban functional areas. Applied Spatial Analysis and Policy, 16(2), 771–788. https://doi.org/10.1007/s12061-023-09502-5 [Google Scholar] [CrossRef]
8. Liu, D. L., Xu, Z. S., Yan, L., Fan, C. G. (2020). Dynamic estimation system for fire station service areas based on travel time data. Fire Safety Journal, 118, 103238. https://doi.org/10.1016/j.firesaf.2020.103238 [Google Scholar] [CrossRef]
9. Okuyama, R., Mitsume, N., Fujii, H., Uchida, H. (2021). Discontinuous-galerkin-based analysis of traffic flow model connected with multi-agent traffic model. Computer Modeling in Engineering & Sciences, 128(3), 949–965. https://doi.org/10.32604/cmes.2021.015773 [Google Scholar] [CrossRef]
10. Galán Moreno, M. J., Sánchez Medina, J. J., Álvarez Álvarez, L., Rubio Royo, E. (2009). Numerical simulation and natural computing applied to a real world traffic optimization case under stress conditions: “La Almozara” district in Saragossa. Computer Modeling in Engineering & Sciences, 50(3), 191–226. https://doi.org/10.3970/cmes.2009.050.191 [Google Scholar] [CrossRef]
11. Han, F., Xie, R., Lai, M. Y. (2018). Traffic density, congestion externalities, and urbanization in China. Spatial Economic Analysis, 13(4), 400–421. https://doi.org/10.1080/17421772.2018.1459045 [Google Scholar] [CrossRef]
12. Liu, D. L., Xu, Z. S., Wang, Z. Y., Fan, C. G. (2020). Regional evaluation of fire apparatus requirements for petrol stations based on travel times. Process Safety and Environmental Protection, 135, 350–363. https://doi.org/10.1016/j.psep.2020.01.012 [Google Scholar] [CrossRef]
13. Liu, D. L., Xu, Z. S., Wang, Z. Y., Zhou, Y., Fan, C. G. (2021). Estimation of effective coverage rate of fire station services based on real-time travel times. Fire Safety Journal, 120, 103021. https://doi.org/10.1016/j.firesaf.2020.103021 [Google Scholar] [CrossRef]
14. Ministry of Housing and Urban-Rural Development of the People's Republic of China (MOHURDMinistry of Public Security of the People's Republic of China (MPS) (2015). Code for Planning of Urban Fire Control GB51080-2015. Beijing: China Architecture & Building Press. [Google Scholar]
15. Sisman, A., Yildirim, R. E. (2019). Determining new fire station location, response time coverage area approach. Fresenius Environmental Bulletin, 28(11A), 8548–8554. [Google Scholar]
16. Ahmadi Choukolaei, H., Jahangoshai Rezaee, M., Ghasemi, P., Saberi, M., Yazdi, M. (2021). Efficient crisis management by selection and analysis of relief centers in disaster integrating GIS and multicriteria decision methods: A case study of Tehran. Mathematical Problems in Engineering, 2021, 1–22. https://doi.org/10.1155/2021/5944828 [Google Scholar] [CrossRef]
17. Aydinoglu, A. C., Iqbal, A. S. (2021). Determining parking demand and locating parking areas using geographic analytics methods. Journal of Urban Planning and Development, 147(1). https://doi.org/10.1061/(asce)up.1943-5444.0000650 [Google Scholar] [CrossRef]
18. Kılıc, D., Yagci, C., Iscan, F. (2023). A GIS-based multi-criteria decision analysis approach using AHP for rural settlement site selection and eco-village design in Erzincan. Turkey Socio-Economic Planning Sciences, 86. https://doi.org/10.1016/j.seps.2022.101478 [Google Scholar] [CrossRef]
19. Wang, Y., Roy, N., Zhang, B. (2023). Multi-objective transportation route optimization for hazardous materials based on GIS. Journal of Loss Prevention in the Process Industries, 81, 104954. https://doi.org/10.1016/j.jlp.2022.104954 [Google Scholar] [CrossRef]
20. Ghodusinejad, M. H., Noorollahi, Y., Zahedi, R. (2022). Optimal site selection and sizing of solar EV charge stations. Journal of Energy Storage, 56, 105904. https://doi.org/10.1016/j.est.2022.105904 [Google Scholar] [CrossRef]
21. Echeverria Iriarte, F. J., Abrego, A., Gonzalez De Audicana, M. (2018). Analysis of fire services coverage in Spain. DYNA, 93(1), 247–251. https://doi.org/10.6036/8408 [Google Scholar] [CrossRef]
22. Hou, G. J., Li, Q. W., Song, Z. G., Zhang, H. (2021). Optimal fire station locations for historic wood building areas considering individual fire spread patterns and different fire risks. Case Studies in Thermal Engineering, 28, 101548. https://doi.org/10.1016/j.csite.2021.101548 [Google Scholar] [CrossRef]
23. Chevalier, P., Thomas, I., Geraets, D., Goetghebeur, E., Janssens, O. et al. (2012). Locating fire stations: An integrated approach for Belgium. Socio-Economic Planning Sciences, 46(2), 173–182. https://doi.org/10.1016/j.seps.2012.02.003 [Google Scholar] [CrossRef]
24. Kaffash, S., Nguyen, A. T., Zhu, J. (2021). Big data algorithms and applications in intelligent transportation system: A review and bibliometric analysis. International Journal of Production Economics, 231, 107868. https://doi.org/10.1016/j.ijpe.2020.107868 [Google Scholar] [CrossRef]
25. Zhao, X. L., Xu, Y. M., Lovreglio, R., Kuligowski, E., Nilsson, D. et al. (2022). Estimating wildfire evacuation decision and departure timing using large-scale GPS data. Transportation Research Part D-Transport and Environment, 107, 103277. https://doi.org/10.1016/j.trd.2022.103277 [Google Scholar] [CrossRef]
26. Gao, G., Wang, Z., Liu, X., Li, Q., Wang, W. et al. (2019). Travel behavior analysis using 2016 Qingdao’s household traffic surveys and Baidu electric map API data. Journal of Advanced Transportation, 2019, 1–18. https://doi.org/10.1155/2019/6383097 [Google Scholar] [CrossRef]
27. Xue, Y., Li, C. (2020). Extracting Chinese geographic data from Baidu map API. 20(4), 805–811. https://doi.org/10.1177/1536867X20976313 [Google Scholar] [CrossRef]
28. Song, Y., Lyu, Y., Qian, S., Zhang, X., Lin, H. et al. (2022). Identifying urban candidate brownfield sites using multi-source data: The case of Changchun city. China Land Use Policy, 117, 106084. https://doi.org/10.1016/j.landusepol.2022.106084 [Google Scholar] [CrossRef]
29. Liu, D. L., Xu, Z. S., Zhou, Y., Fan, C. G. (2019). Heat map visualisation of fire incidents based on transformed sigmoid risk model. Fire Safety Journal, 109, 102863. https://doi.org/10.1016/j.firesaf.2019.102863 [Google Scholar] [CrossRef]
30. Chen, S., Wei, X., Xia, N., Yan, Z., Yuan, Y. et al. (2019). Understanding road performance using online traffic condition data. Journal of Transport Geography, 74, 382–394. https://doi.org/10.1016/j.jtrangeo.2018.12.004 [Google Scholar] [CrossRef]
31. Alvarez, P., Lerga, I., Serrano-Hernandez, A., Faulin, J. (2018). The impact of traffic congestion when optimising delivery routes in real time. A case study in Spain. International Journal of Logistics Research and Applications, 21(5), 529–541. https://doi.org/10.1080/13675567.2018.1457634 [Google Scholar] [CrossRef]
32. Mishra, S., Singh, V., Gupta, A., Bhattacharya, D., Mudgal, A. (2023). Adaptive traffic signal control for developing countries using fused parameters derived from crowd-source data. Transportation Letters, 15(4), 296–307. https://doi.org/10.1080/19427867.2022.2050493 [Google Scholar] [CrossRef]
33. Zhu, S. C., Liu, W. J., Liu, D. L., Li, Y. (2023). The impact of dynamic traffic conditions on the sustainability of urban fire services. Sustainable Cities and Society, 96, 104667. https://doi.org/10.1016/j.scs.2023.104667 [Google Scholar] [CrossRef]
34. Liu, D. L., Xu, Z. S., Yan, L., Wang, F. Y. (2020). Applying real-time travel times to estimate fire services coverage rate for high-rise buildings. Applied Sciences, 10(19), 6632. https://doi.org/10.3390/app10196632 [Google Scholar] [CrossRef]
35. Aktaş, E., Özaydın, Ö., Bozkaya, B., Ülengin, F., Önsel, Ş. (2013). Optimizing fire station locations for the Istanbul metropolitan municipality. Interfaces, 43(3), 240–255. https://doi.org/10.1287/inte.1120.0671 [Google Scholar] [CrossRef]
36. National Fire Protection Association (NFPA) (2016). NFPA 1710: Standard for the organization and deployment of fire suppression operations, emergency medical operations, and special operations to the public by career fire departments. Quincy: National Fire Protection Association (NFPA). [Google Scholar]
37. Yang, L., Jones, B. F., Yang, S. H. (2007). A fuzzy multi-objective programming for optimization of fire station locations through genetic algorithms. European Journal of Operational Research, 181(2), 903–915. https://doi.org/10.1016/j.ejor.2006.07.003 [Google Scholar] [CrossRef]
38. Montello, D. R., Battersby, S. E. (2022). Another look at the “Mercator Effect” on global-scale cognitive maps: Not in areas but in directions. Annals of the American Association of Geographers, 112(2), 468–486. https://doi.org/10.1080/24694452.2021.1931001 [Google Scholar] [CrossRef]
39. Hou, G., Chen, S., Zhou, Y., Wu, J. (2017). Framework of microscopic traffic flow simulation on highway infrastructure system under hazardous driving conditions. Sustainable and Resilient Infrastructure, 2(3), 136–152. [Google Scholar]
Figure S1: The effective coverage of FS-JX in the four typical simulation scenarios, RF = 70%
Figure S2: The effective coverage of FS-JX in the four typical simulation scenarios, RF = 90%
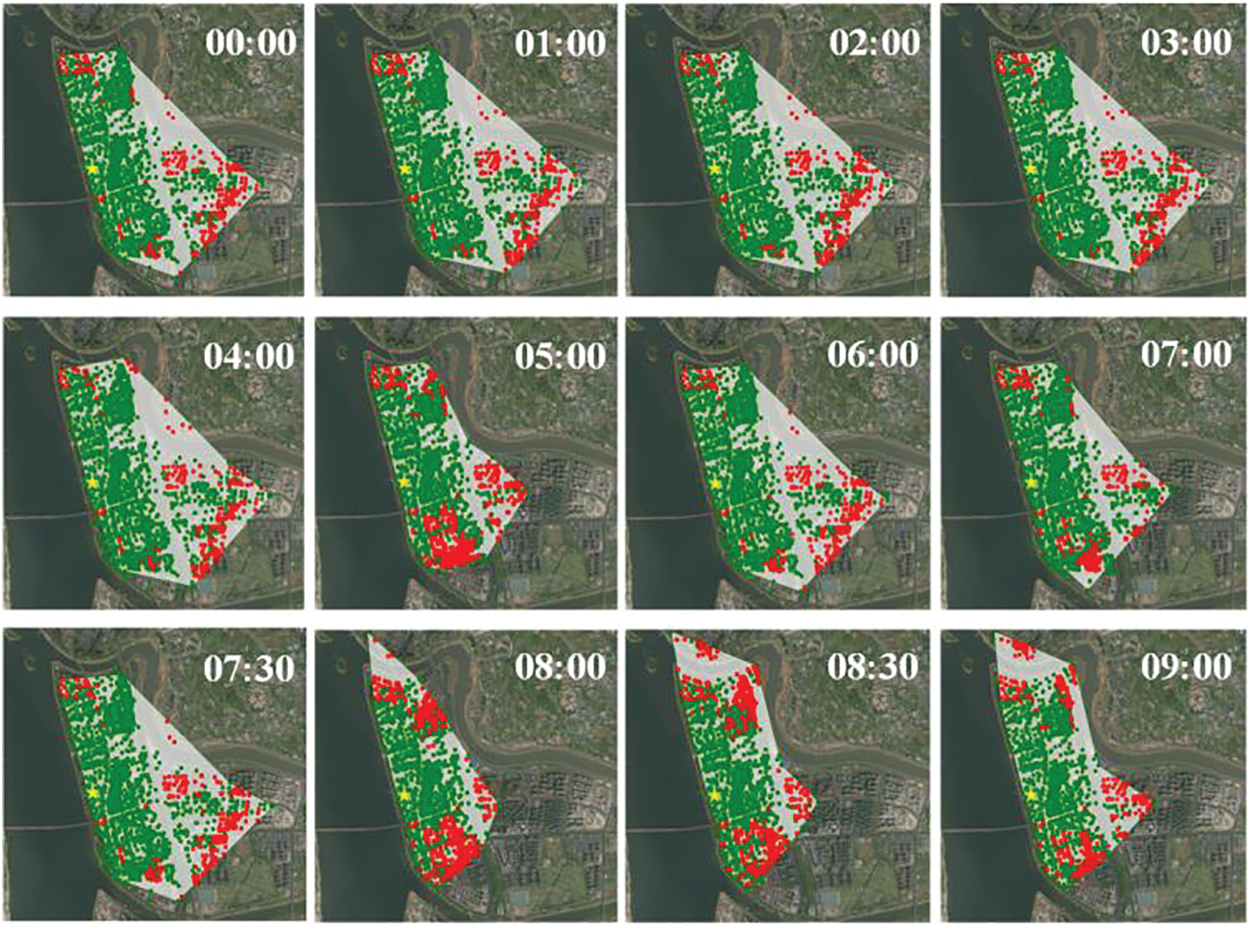
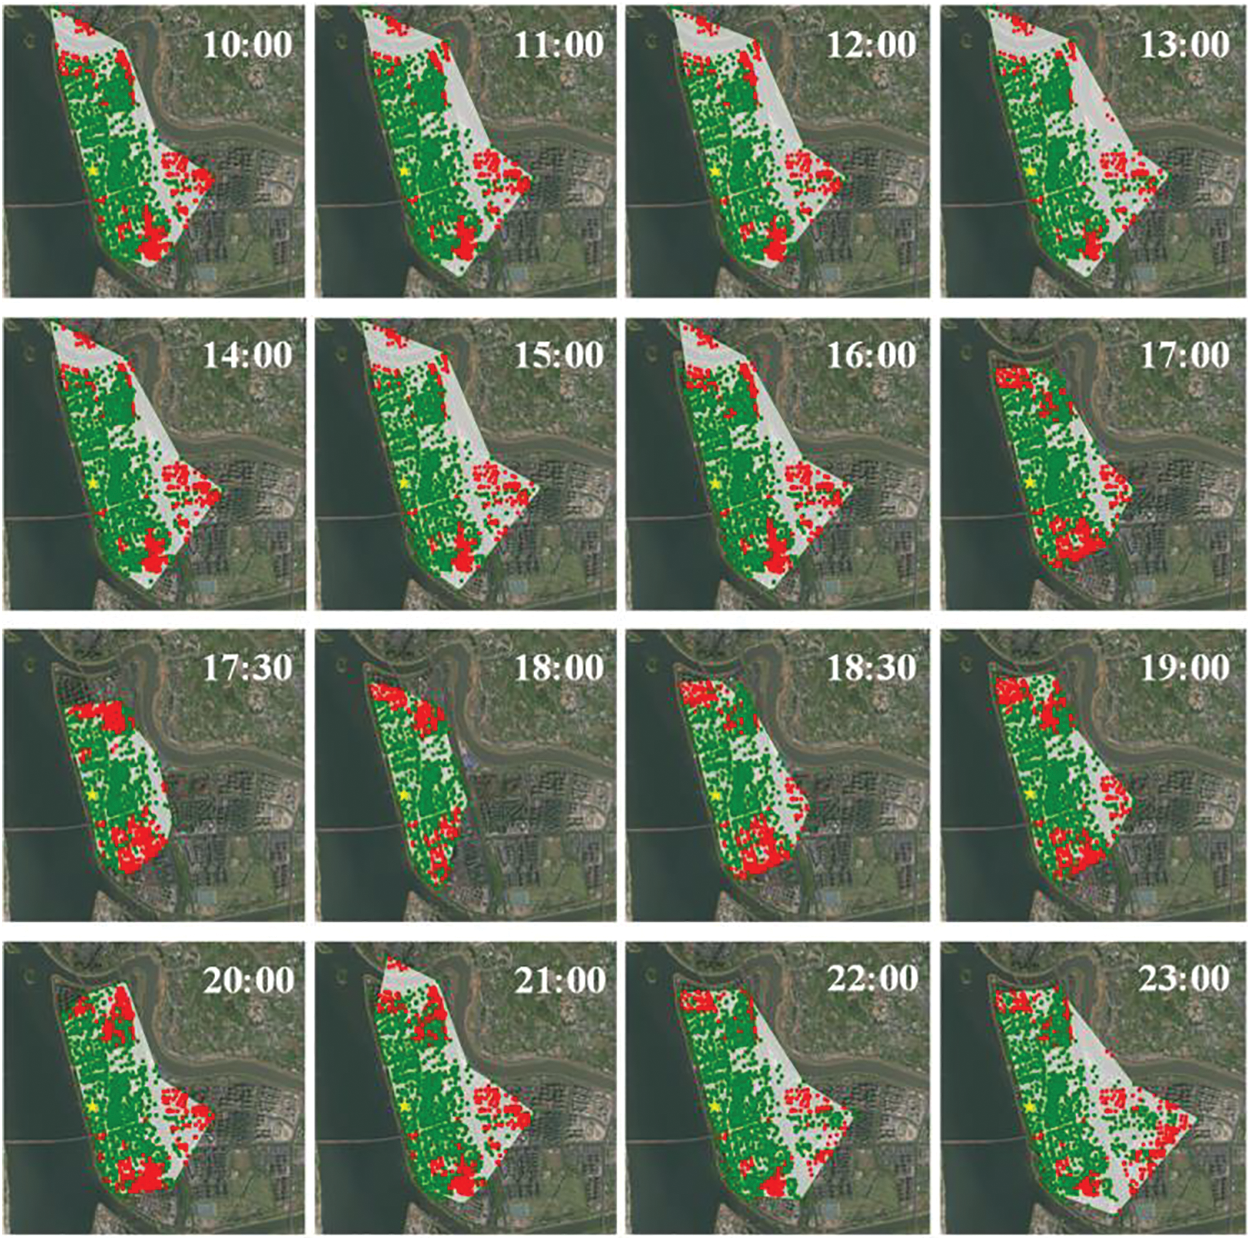
Figure S3: The visualization of effective coverage in 28 simulation scenarios on Tuesday, RF = 70%
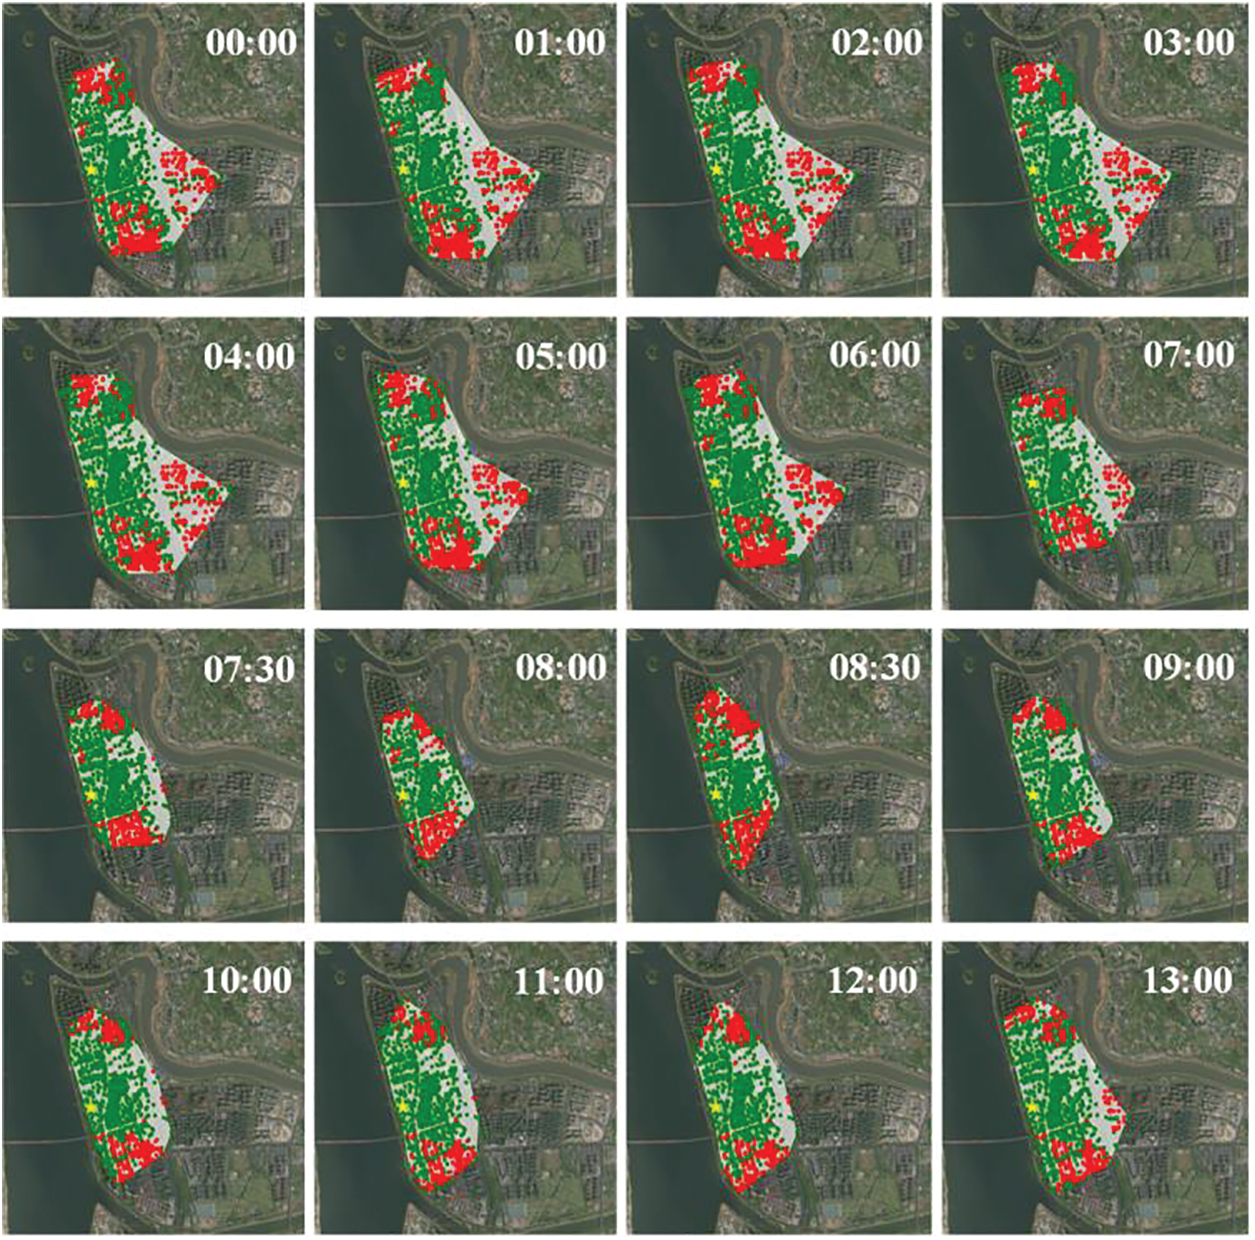
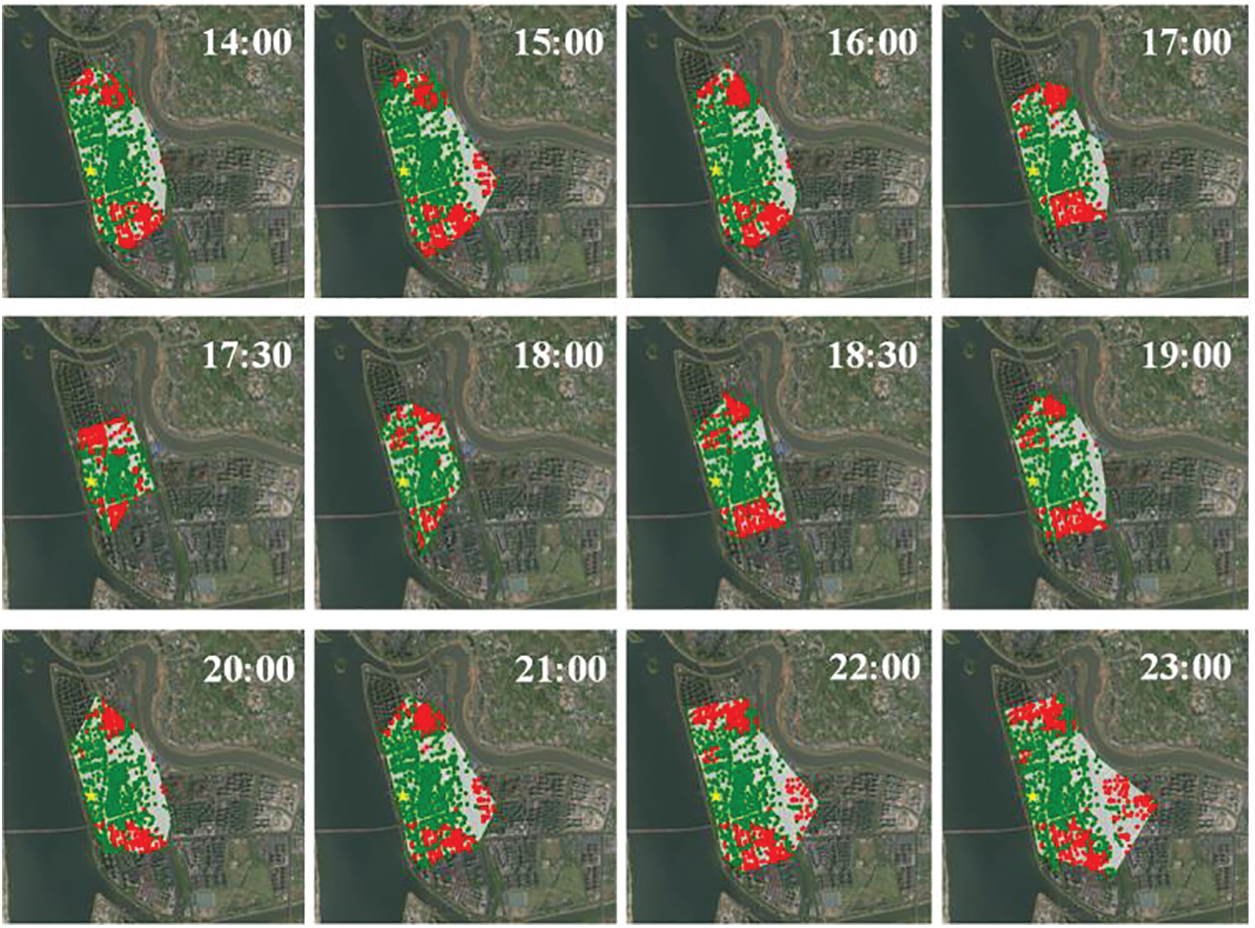
Figure S4: The visualization of effective coverage in 28 simulation scenarios on Tuesday, RF = 90%
Cite This Article
 Copyright © 2024 The Author(s). Published by Tech Science Press.
This work is licensed under a Creative Commons Attribution 4.0 International License , which permits unrestricted use, distribution, and reproduction in any medium, provided the original work is properly cited.
 Downloads
 Citation Tools