
 Submit a Paper
 Propose a Special lssue
 Open Access
ARTICLE

Performance Prediction Based Workload Scheduling in Co-Located Cluster
School of Computer Science and Technology, Hangzhou Dianzi University, Hangzhou, 310018, China
* Corresponding Author: Congfeng Jiang. Email:
(This article belongs to the Special Issue: Machine Learning Empowered Distributed Computing: Advance in Architecture, Theory and Practice)
Computer Modeling in Engineering & Sciences 2024, 139(2), 2043-2067. https://doi.org/10.32604/cmes.2023.029987
Received 17 March 2023; Accepted 11 December 2023; Issue published 29 January 2024
 View Full Text
 Download PDF
Abstract
Cloud service providers generally co-locate online services and batch jobs onto the same computer cluster, where the resources can be pooled in order to maximize data center resource utilization. Due to resource competition between batch jobs and online services, co-location frequently impairs the performance of online services. This study presents a quality of service (QoS) prediction-based scheduling model (QPSM) for co-located workloads. The performance prediction of QPSM consists of two parts: the prediction of an online service’s QoS anomaly based on XGBoost and the prediction of the completion time of an offline batch job based on random forest. On-line service QoS anomaly prediction is used to evaluate the influence of batch job mix on on-line service performance, and batch job completion time prediction is utilized to reduce the total waiting time of batch jobs. When the same number of batch jobs are scheduled in experiments using typical test sets such as CloudSuite, the scheduling time required by QPSM is reduced by about 6 h on average compared with the first-come, first-served strategy and by about 11 h compared with the random scheduling strategy. Compared with the non-co-located situation, QPSM can improve CPU resource utilization by 12.15% and memory resource utilization by 5.7% on average. Experiments show that the QPSM scheduling strategy proposed in this study can effectively guarantee the quality of online services and further improve cluster resource utilization.Keywords
With the expansion of Internet applications and the growth of the cloud computing industry, the number and size of data centers are also expanding globally. The average annual growth rate of the global IDC (Internet Data Center) industry scale was 22% from 2014 to 2020 [1]. According to the public data of the China Information and Communications Research Institute, the global data center market has maintained a steady growth trend from 2017 to 2021. The market size has increased from $46.55 billion to $67.93 billion, with an average annual compound growth rate of 9.91% in five years. It is expected that the global data center market size will further increase to $82.05 billion in 2023.
The continuous growth of the cloud computing industry has resulted in a rapid expansion of data center size and a massive increase in energy consumption [2]. The total global power consumption of data centers has reached 3% of global electricity generation, and this percentage is expected to double by 2025 [3,4]. In stark contrast to its enormous energy consumption, the data center’s resource utilization rate has always been low. Data indicates that the current resource utilization rate of the majority of data centers is only 10% to 20% [1]. Clearly, the daily running of data centers generates a significant amount of waste. Therefore, improving data center resource utilization will reduce construction costs and energy consumption.
Online services and offline batch tasks are the two categories of applications deployed in data centers [5]. Search engines, e-commerce websites, and online social services are all examples of online service programs that passively handle user requests and generate profit. Online services are sensitive to response delays and have stringent availability and stability requirements. Service level agreements (SLA) are commonly used by cloud service providers to assure the performance and quality of online services. Distributed batch jobs, also known as offline jobs, are mainly based on computational logic [6], mainly representing data analysis jobs, data warehouse jobs, and machine learning model training jobs related to distributed computing models such as MapReduce [7]. The main feature of such jobs is that they are not sensitive to delays. Even if the procedure fails, it can be attempted again at a later time. Therefore, batch tasks typically have a lower priority than online services.
In the early days of cloud computing, when the number of users was limited, platforms typically deployed online services and batch jobs to distinct clusters. Due to the rapid development of big data processing, artificial intelligence, and other technologies, the scale and complexity of batch tasks have increased significantly, resulting in frequent resource shortages in clusters of batch jobs. In the cluster where online services are located, however, there are frequently a large number of gratis resources due to the characteristics of the access mode. Under the premise of ensuring the performance of online services, many cloud service providers, including Alibaba, Google, and others, progressively deploy online services and batch tasks to the same cluster with shared resources. This technology is known as hybrid deployment.
In normal circumstances, online services are unable to completely utilize CPU resources, whereas batch jobs have an immediate CPU resource requirement. In order to give online services higher priority, it is customary for hybrid deployment technology to simultaneously allocate a CPU core to online services and batch tasks. The competition between online services and batch jobs for CPU and memory resources frequently results in performance degradation for both [8–11], despite the fact that hybrid deployment technology has increased resource efficiency. The term for this phenomenon is performance interference. When severe performance interference occurs, online service quality cannot be guaranteed, and efficiency and throughput of bulk job execution are drastically diminished. In addition, the complexity and dynamic nature of jobs, as well as the diversity of hardware resources, make scheduling challenging in a hybrid deployment system. The effective task scheduling technique of a co-located deployment cluster, which can effectively ensure the performance of online services and batch jobs while optimizing resource usage, is therefore of immense economic value. The following are the principal contributions made by this paper:
• We propose an online service anomalous QoS (quality of service) prediction method based on XGBoost. This method can determine, following a hybrid deployment of batch jobs and online services, whether the response time of online services will exceed the upper limit.
• To reduce the total waiting time of batch jobs, we present a random forest-based method for predicting the completion time of batch jobs.
• We design a mixed load scheduling model QPSM (prediction-based scheduling model) based on the performance prediction of online services and batch jobs. The experimental results confirm the model’s validity and precision.
The rest of the paper is organized as follows: we briefly outline related work in Section 2 and introduce hybrid deployment load performance prediction in Section 3. Then, we elaborate on the hybrid deployment load scheduling strategy in Section 4. The experiment evaluation and analysis of the proposed strategy are presented in Section 5. Finally, in Section 6, we explain the conclusion and future work.
The hybrid load scheduling method is more complicated than the traditional strategy built for a single load since it must simultaneously consider the characteristics of different loads. Currently, a variety of cluster management systems may schedule mixed loads. These cluster management systems typically implement resource allocation and work scheduling via a centralized design. Using Google’s Borg cluster management system [12] as an illustration, the resource isolation method minimized interference between distinct activities to the greatest extent possible. Contrary to Borg’s solution, Mesos [13] solved the problem of resource allocation through negotiation in order to support several computing frameworks, such as Spark and Flink simultaneously. Omega [14] and Apollo [15] embraced the concept of decentralization to shorten the scheduling time of jobs as much as possible. They would simultaneously manage numerous schedulers. These schedulers might monitor each other’s status in real-time, and each scheduler could be aware of the cluster’s available resources. In actual production environments, the decentralized technique is utilized less frequently since it is typically difficult to achieve the worldwide optimal scheduling impact. In the above scheduling system, the scheduler does not rigorously differentiate between online services and batch jobs when scheduling tasks. Alibaba and Baidu both use distinct scheduling techniques for online services and batch activities. Taking Alibaba as an example, online services are deployed in a containerized manner by the Sigma scheduler [16], while offline jobs are scheduled by Fuxi [17], and all offline jobs run directly on the physical machine. Conflicts between Sigma and Fuxi are coordinated by a global coordinator.
The aforementioned scheduling systems typically employ heuristic strategies, such as over-provisioning, over-subscribing, and over-commitment to improve resource utilization [18]. Several studies [19–22] have optimized these heuristic algorithms, but there is no comprehensive performance analysis for diverse workloads; task preemption and rescheduling are prevalent. In addition, the majority of task rescheduling algorithms base their decisions on the static resource requirements of tasks, which may result in arbitrary task scheduling. However, online services cannot guarantee QoS (quality of service).
Delimitrou et al. [23–26] discussed how to effectively guarantee the QoS of online services while improving system resource utilization. Both Bubble [25,27] and Prophet [28] predicted performance disturbances to determine the hybrid deployment of various online services and batch jobs but neither makes any restrictions on the resources available to the load and still manages and distributes the shared resources in the cluster through the operating system. Smite [29] extended Bubble-Up [25] to multi-core platforms by evaluating the interference between distinct CPU cores. Quasar [23] categorized various workloads based on their runtime characteristics and then executed hybrid deployment procedures while guaranteeing online service performance was not impacted. Only focusing on the combination of loads, the aforementioned research results fail to efficiently manage cluster resources. Therefore, if these results can be utilized in conjunction with the cluster resource management, cluster resource utilization will be enhanced. For instance, Avalon [30] used this procedure. It first calculated the appropriate hybrid deployment approach between various loads, and then combined the self-designed resource management strategy to improve the cluster’s resource utilization.
Different from the above method of ensuring QoS by determining the load combination, Heracles [24] ensured that the QoS of online services is always maintained within a reasonable range by adjusting the resource allocation strategy. Ubik [31] explored the impact of cache partitioning on online service QoS in the case of hybrid deployment through simulation. Dirigent [32] described the change in online service response time in the case of memory resource competition. At the same time, it limited the performance of batch jobs through DVFS [33] to ensure that the service quality of online services was not significantly affected. The disadvantage of the above feedback resource management strategies is that to ensure the service quality of online services, the performance of batch jobs will be affected to a certain extent. When the performance of batch jobs is reduced, the resource utilization of clusters will still be low.
At present, some studies propose that parallel query technology can be used to reduce the long-tail latency of online services when the system is under high load. Haque et al. [34] believed that their parallelism could be appropriately increased for time-consuming query operations so that these operations did not violate QoS. Contrary to Haque et al., since increasing the parallelism of time-consuming operations would increase the waiting delay of short query operations, Li et al. [35] believed that the parallelism of time-consuming query operations should be reduced to ensure the performance of short query operations. These studies above only focus on the performance of online services and do not consider the interference of batch jobs on the performance of online services.
The Internet of Things (IoT) has grown rapidly recently, and it is also a hot research topic, with researchers studying the data characteristics of its internal elements (server nodes, sensors, and networks), predicting and controlling resources, and finally forming an effective scheduling policy. In [36], the memory-augmented autoencoder method was used to detect anomalies in the time series feature data within the IoT. In [37], the reinforcement learning method was used to schedule virtual machines in the industrial IoT in real time. Gao et al. [38] used reinforcement learning to offload location-privacy-oriented tasks to the edge for calculation. Exploring effective resource scheduling strategies in the IoT will attract continued interest from industry and academia.
Different from the adaptive co-located scheduling model proposed by Yuan et al. [39], this study determines the load combination for hybrid deployment by predicting the interference between online services and batch jobs. However, unlike Bubble and Prophet, which predicted the degree of interference through hardware resource utilization, we use the types of batch jobs, the amount of data processed, and the number of online services. In addition, the scheduling model proposed in this paper takes optimization measures for the scheduling of batch jobs, which ensures the QoS of online services and improves the execution efficiency of batch jobs.
3 Hybrid Deployment Load Performance Prediction
3.1 Prediction of QoS Anomalies in Online Services Based on XGBoost
The co-located deployment technology brings a huge challenge to the scheduling of online services and batch jobs while improving resource utilization. The performance of both online services and offline jobs degrades because of the competition for resources between them. When the competition for resources between different loads is too fierce, the task scheduler must adopt certain strategies to mitigate the situation. Most of the current schedulers, such as Google’s Borg and Alibaba’s Level-0 policy, prioritize the QoS of online services by stopping the execution of batch jobs to allow online services to have as many resources as possible. For the stopped offline jobs, the scheduler selects a server with sufficient resources to redeploy them. Although this approach guarantees the performance of online services, it increases the data center’s energy consumption and causes some resource waste because the stopped batch jobs still need to re-execute the previously executed computational logic after being rescheduled. Therefore, this study tries to propose a QoS exception prediction model for online services that can determine whether the QoS of an online service will be violated after the deployment of the offline job when a batch job needs to be scheduled to the same server if the server has already deployed the online service, so as to avoid repeated computations as much as possible. In this paper, we use the response time of the online service to characterize the QoS of the online service.
Many indicators can be used to predict the abnormal QoS of online services. For example, resource utilization can be predicted by utilizing hardware resources such as CPU and memory [40]. Furthermore, from the perspective of time, it can be predicted according to the historical visits in the same period [41]. In addition, it can also be predicted from the perspective of microarchitecture using the relevant indicators of hardware counters [42].
The above prediction schemes only use a single dynamic feature or static feature. The dynamic feature will change over time, while the static feature is fixed. Using a certain feature alone will make the trained model adapt to a relatively single situation. The abnormal QoS prediction model proposed in this paper takes the type of batch jobs (workload_type), the amount of data to be processed by batch jobs (input_size) and the current access to online service (
The model considers both dynamic and static information. The types of batch jobs and the amount of data to be processed by batch jobs are static features, and the RPS of online services is dynamic information. It should be noted that the abnormal QoS prediction model proposed in this paper is not to predict the specific response time of online services but to judge whether the response time of online services will break through the upper limit value after the hybrid deployment of batch jobs and online services, which is one of the bases for subsequent batch job scheduling.
The XGBoost model is used to predict if the online service response time will surpass the upper limit, which is essentially a binary classification problem. Before training the model, the relevant online service response time is obtained based on various feature value combinations. The data is then manually labeled to provide a dataset for model training. After classification, the data set is proportionally divided into the training and test sets. The parameters of the XGBoost model are then trained using the training set, and the model’s validity is validated using the test set.
The input of the online service abnormal QoS prediction model is the combination of some dynamic and static characteristics of the current mixed load and a binary classification value. These combinations together form the training data set
XGBoost [43] is an ensemble learning model composed of several CART decision trees [44]. Compared with the traditional reinforcement learning model, the main advantage of XGBoost is that Taylor expansion is adopted for the second derivative of the loss function. In addition, the regular term is added to improve the training accuracy of the model. Furthermore, when finding the best partition point, XGBoost does not use a greedy strategy but uses an approximate algorithm, which greatly reduces the training time of the model. The following is a brief introduction to the key operational processes in the XGBoost model.
For each decision tree in XGBoost, the region defined by split node J is recorded as formula (2).
Suppose that
After calculating the profit value of each splitting case, it is necessary to select the splitting method with the largest profit value to split the data set, as shown in formula (4).
After determining the utmost profit value, the decision tree is divided based on the characteristic corresponding to the revenue value. The preceding procedure is repeated for the remaining features to be selected until the model can no longer be separated, at which point the decision tree model is complete.
The procedure for developing a QoS anomaly prediction model for an online service is as follows: The initial stage is to collect data. In this study, which captures the 95th quantile value of the QoS of online services under certain batch jobs with a fixed amount of processing data and fixed traffic, we primarily collect all data that may impact the Quality of Service (QoS) of online services. The next stage is to label the data. In this paper, the maximum limit of the online service’s Quality of Service (QoS) is set to 10 ms. Exceeding this value indicates that the online service’s QoS has been compromised, and this QoS value is the outlier. The next step is model generation. On the basis of the aforementioned labeled data, the data set is divided into a training set and a test set at a ratio of 3:1. The training set and XGBoost model are then used to train an online service. QoS anomaly prediction model that matches the data distribution of the training set, and the test set is used to evaluate the performance of the trained model. Model application represents the final stage. This sample will be used to train an anomaly prediction model for online service QoS anomalies, which will then be deployed to the online environment to aid in the scheduling of online services and batch tasks. The scheduling history data will be used to continuously update the existing model, thereby increasing its predictive accuracy.
3.2 Batch Jobs Completion Time Prediction Based on Random Forest
To achieve the least possible total waiting time in the batch jobs scheduling process, the scheduler must alter the task execution order based on the batch jobs’ completion times. However, because the completion time of batch jobs cannot be correctly predicted prior to their execution, it is important to develop a prediction model of the batch jobs’ completion times, which can provide effective scheduling recommendations.
Due to the different execution logic for various categories of Hadoop jobs, a Hadoop job may be divided into multiple MapReduce tasks simultaneously, resulting in varying execution times. In addition, the execution time for the same type of Hadoop jobs can vary depending on the quantity of data processed. Even in a mixed deployment environment, online services have minimal impact on the completion time of batch jobs, as batch jobs consume the majority of CPU resources. In contrast, online services typically have low CPU resource demands. In conclusion, the execution duration of batch jobs is affected by the types of batch jobs and the volume of data they must process. As shown in formula (5), this paper selects the categories of batch jobs and the amount of data that batch jobs must process as feature vectors for the prediction model of batch job completion time.
Unlike the online service abnormal QoS prediction model, which is a classification problem, the prediction of batch jobs completion time is a regression problem. Because the training data set contains relatively little data and the feature dimensions used in training are few, the general machine learning model is difficult to apply to this scenario. In order to effectively solve this problem, this paper chooses a random forest as the training model. Compared with the more powerful neural network, the random forest can maintain a higher prediction accuracy even when the data set is small. It can also effectively deal with the nonlinear relationship between the characteristics of offline operations and the completion time. Furthermore, there is no need to manually mark the data, so the construction of the prediction model of batch jobs completion time mainly includes three steps:
(1) Data collection. This step mainly extracts the data needed for training the random forest model from the log data, including the types of batch jobs, the amount of data processed by batch jobs and the completion time of batch jobs.
(2) Model generation. The collected sample data are divided into a training set and a test set at a ratio of 3:1. Then, the training set is used to train the random forest model, and then the test set is used to verify the validity of the trained random forest model. If the prediction effect of the model is not good, the relevant parameters need to be adjusted to improve the prediction accuracy of the model further.
(3) Model application. After the training, the prediction model of batch jobs completion time will guide the scheduling of batch jobs in real-time. If any batch jobs have never appeared before that need to be scheduled during the scheduling process, the model will be retrained.
4 Hybrid Deployment Load Scheduling
This section proposes a hybrid load scheduling model, QPSM, comprised primarily of online service and batch jobs scheduling, based on the online service abnormal QoS prediction method and the prediction method of batch jobs completion time, respectively. Experimental results demonstrate that the hybrid load scheduling model proposed in this paper can reduce the total waiting time of batch tasks while maintaining the quality of online services.
Multiple online services deployed on the same server have caused memory resources to become a bottleneck limiting the efficacy of online services due to their extremely high memory requirements. In addition, online services are typically required to reserve resources to deal with high-volume events, such as large promotions on e-commerce websites and high-volume events in online social services. Therefore, in designing the mixed load scheduling model, it is stipulated that only one form of online service is permitted to be deployed on a server, so that online services will not interfere with one another.
Fig. 1 depicts the scheduling procedure for the online service. First, the scheduler will compile the running information of every server in the cluster, and then it will randomly select one of the idle servers as the target machine. After determining the target server and determining that the online service must be containerized, the scheduler will distribute the online service’s image to the server and launch the online service.
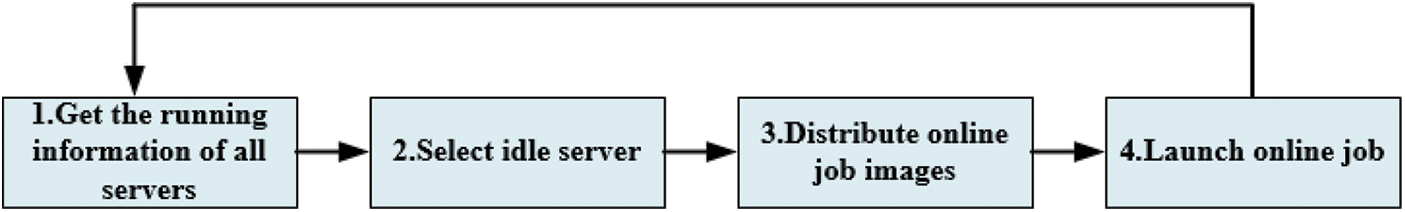
Figure 1: Online service scheduling process
Comparatively to online service scheduling, the scheduling strategy for batch jobs is more complex. Since each batch job has varying importance, each batch job submitted must be prioritized beforehand. In this scheduling policy, the user who submits the task specifies the priority of the available batch jobs. The higher the job’s priority value, the higher its priority. If the user does not specify a priority for batch jobs, the system default priority will be applied. Additionally, it is necessary to measure the job scale for each batch of submitted tasks. In the case of equal priority, the batch job scheduling strategy designed in this paper will tend to execute smaller batch jobs and follow the temporary jobs-first principle with preference. This paper uses the batch job completion time to define the job scale in order to quantitatively assess the scale of batch tasks. The scale of a task is greater the longer it takes to complete it. Using the prediction method proposed in the previous section, the completion time of batch tasks can be anticipated in advance. The priority principle for small tasks is predicated primarily on two factors: First, the majority of batch tasks in the current hybrid deployment cluster execute quickly. Second, prioritizing the execution of jobs with shorter runtimes can reduce the long-tail latency of batch tasks, resulting in the shortest possible total waiting time. In conclusion, the scheduling order of all batch jobs can be determined if the priority and execution duration of each batch job are known.
As depicted in Fig. 2, the scheduler uses an independent queue to store all batch tasks submitted to the cluster during the scheduling process. In contrast to conventional queues, the batch task scheduling queue proposed in this paper consists of multiple sub-queues. The batch jobs held in each sub-queue have the same priority, with the exception of those stored in the sub-queue closest to the queue’s head, which have a higher priority. In addition, the head task of each sub-queue is guaranteed to be the smallest job with the same priority, so each sub-queue is essentially a priority queue. When the newly submitted task arrives, the subqueue’s characteristics must remain unchanged.
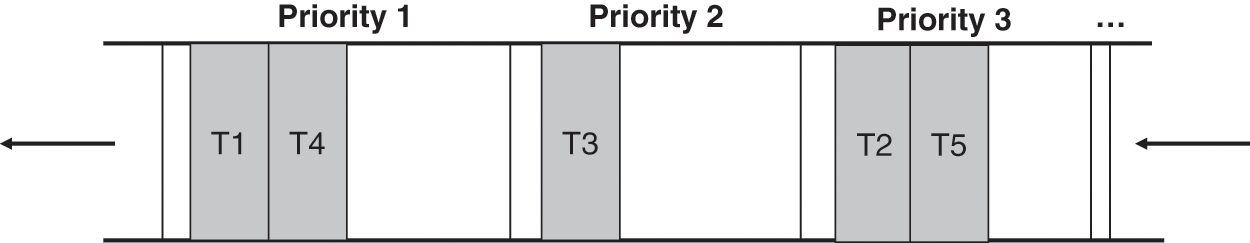
Figure 2: Schematic diagram of batch jobs scheduling queue
Fig. 3 depicts the interaction between batch tasks and the job queue as they are submitted and executed. Fig. 3a illustrates the process of enqueuing a job when a user submits a new job. When a new job is added to the queue, the priority of the task should be determined first. If no precedence is specified, the system default priority is applied. Then, locate the sub-queue that corresponds with the job’s priority and insert the task at the end of the sub-queue. The relative position of the job order in the sub-queue is then readjusted based on the job’s size. It can be seen from the above steps that the time complexity of finding sub-queues and inserting jobs from the end of the queue is
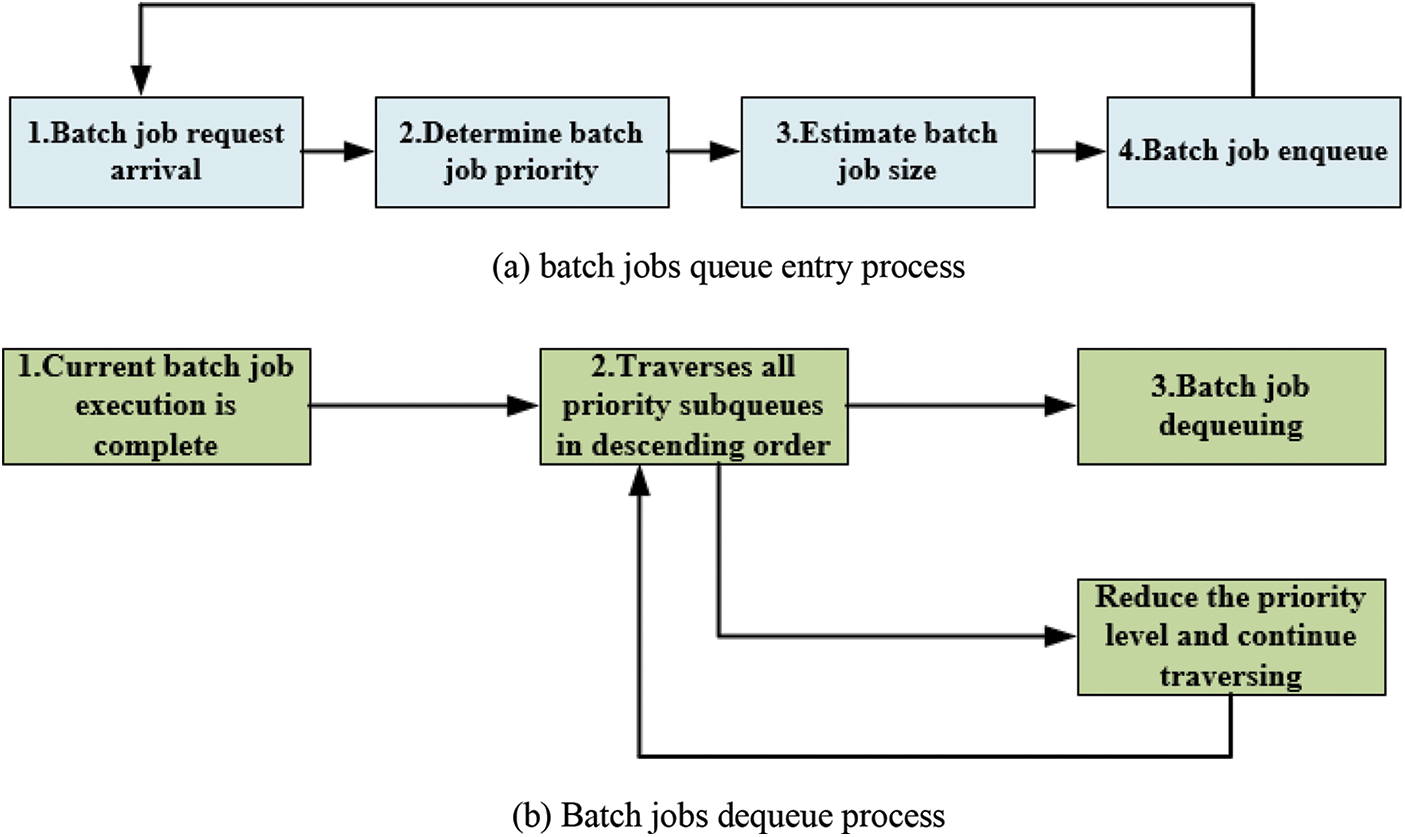
Figure 3: Batch jobs queue interaction process
4.3 Hybrid Deployment Load Scheduling Strategy
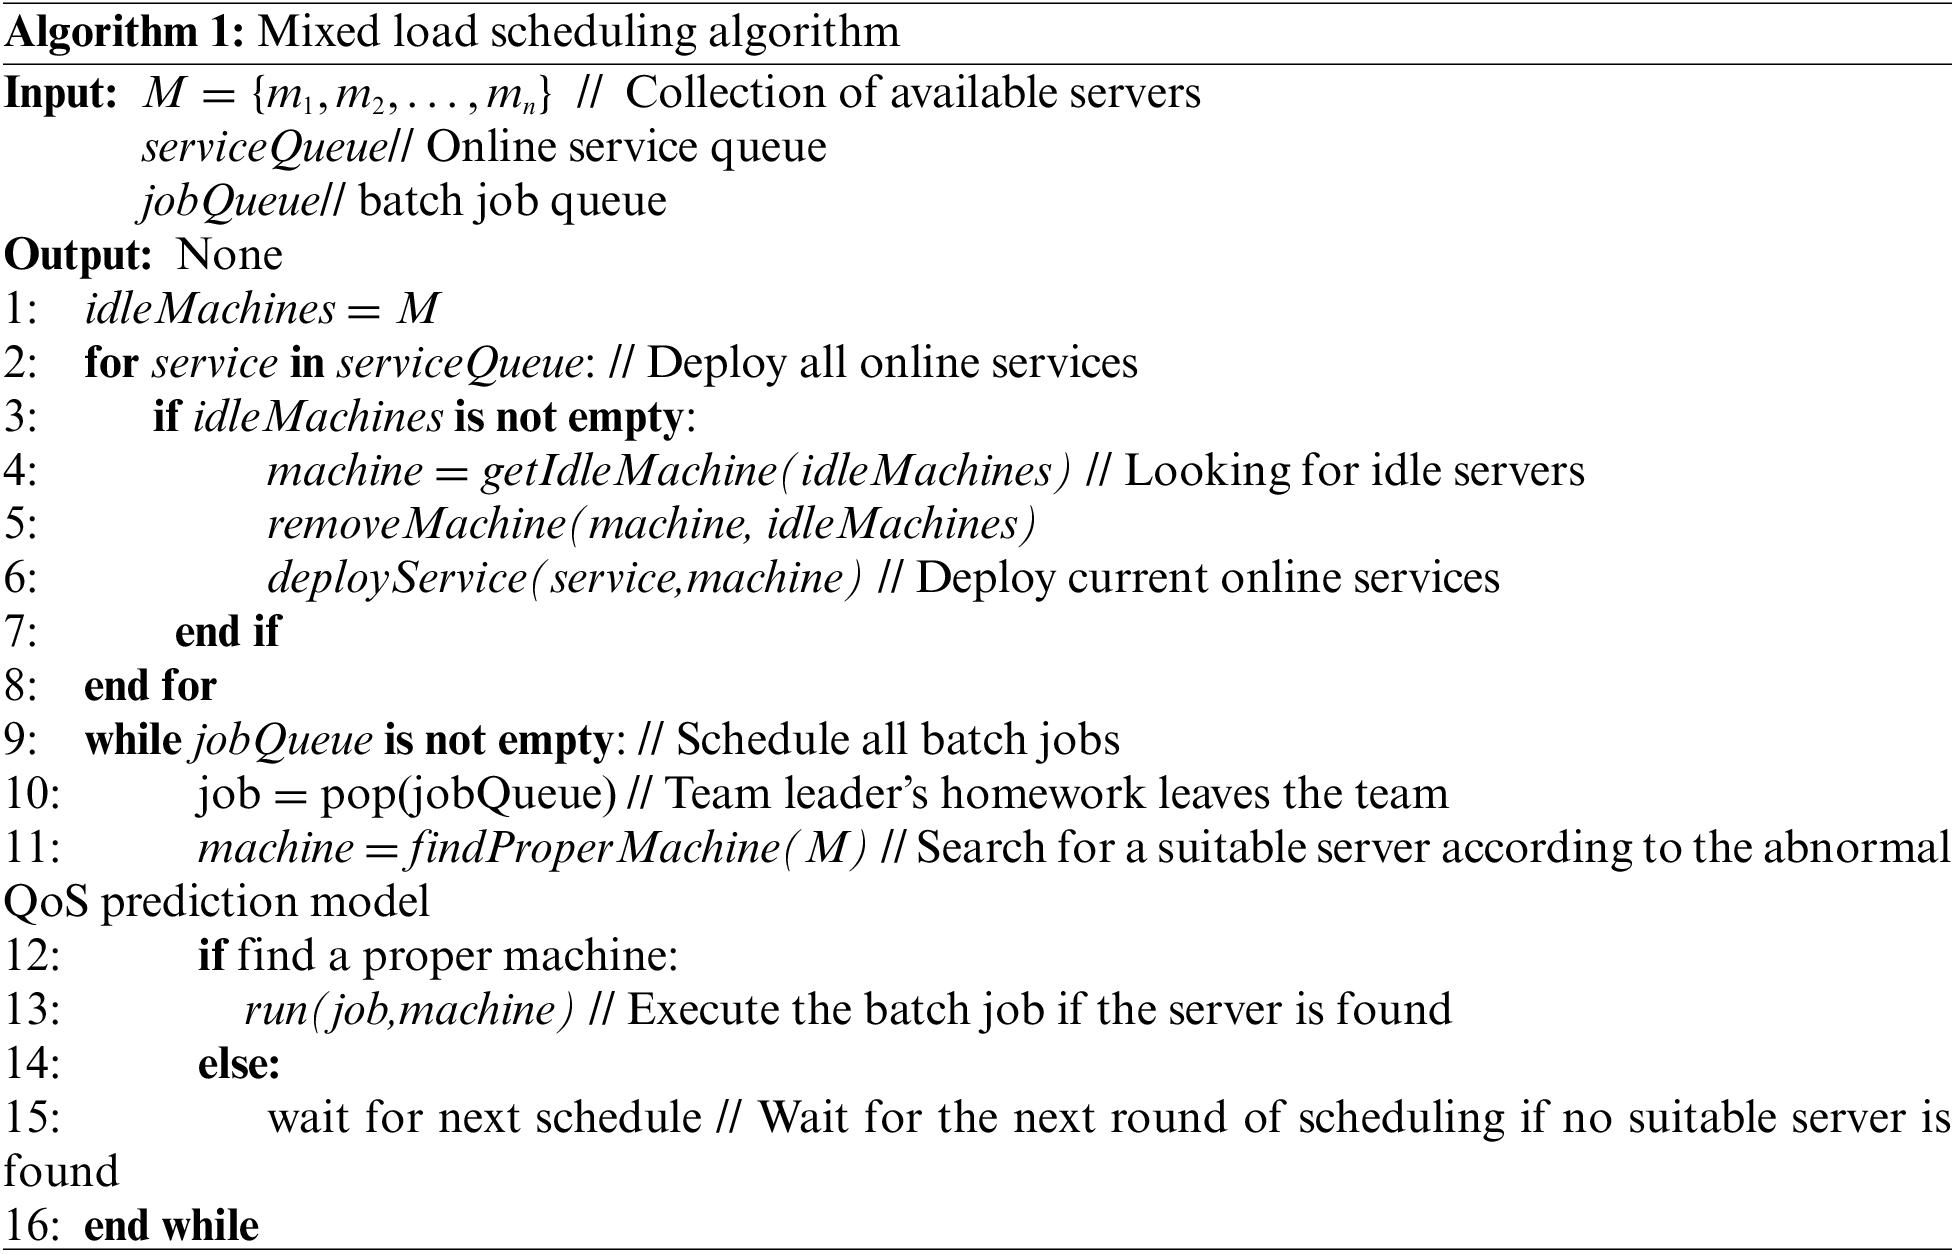
According to the above-mentioned online service and batch job scheduling strategies, this paper designs a hybrid load scheduling model (QPSM) that can effectively ensure the QoS of online services. The scheduling process of this model is shown in Algorithm 1.
The hybrid load scheduling model QPSM proposed in this paper is divided into two parts. The first part distributes all online jobs to idle servers, and the second part schedules batch jobs. When judging whether batch jobs can be deployed to a server, the service running on the server must be judged first.
If no online service is deployed, just deploy batch jobs directly on the server. Otherwise, it is necessary to judge whether the response time of the online service will be too high after the batch jobs are deployed according to the online service’s abnormal QoS prediction algorithm. If not, the batch jobs can also be deployed directly. In addition, jobs that are not successfully scheduled the first time will be downgraded in priority and then rescheduled. This is because a job that is unsuccessfully scheduled for the first time generally requires more resources and takes longer to execute. Therefore, downgrading its priority can ensure that jobs with low resource requirements and short execution times are scheduled preferentially.
5.1 Construction of Hybrid Deployment Environment
According to certain strategies, this paper selects several different online services and batch jobs from two well-known benchmark test suites, CloudSuite and BigDataBench. Then, deploy different workloads into the same cluster with shared resources to achieve a hybrid deployment environment. Finally, this mixed deployment cluster is the experimental environment for all subsequent experiments.
5.1.1 Online Service and Batch Jobs Selection
1) Selection of Online Services
Online services generally deployed in data centers with high frequency include e-commerce, social services, and search engines. To reduce the service response time as much as possible, all large and medium-sized online services currently use data caching services. Its function is to put most of the hot data or data likely to be accessed soon from the back-end storage devices such as databases into the cache in advance. In addition, most cache services are designed based on memory, so manipulating the data in the cache is much more efficient than manipulating the data in the database or file system.
For common online services currently deployed in data centers, the cache service’s response time largely determines the online service’s QoS. As a result, in this paper, the cache service is used as the online service in the mixed load running environment. To make the deployed cache service as close to the actual production environment as possible, this paper selects the Data-Caching load from the CloudSuite benchmark suite as the online cache service. Because CloudSuite has been iterated through multiple versions, the load performance has been relatively close to the service performance of the actual production environment.
2) Selection of Batch Jobs
Most of the batch jobs currently executed in the data center are distributed batch tasks based on big data computing frameworks such as Hadoop, Spark, and Flink. Therefore, in order to be closer to the production environment, this paper selects eight representative batch jobs from the BigDataBench benchmark suite. Depending on how jobs are implemented, they can be divided into two categories, one is computing jobs and the other is data warehouse jobs. First, the five computing jobs are introduced.
Grep: The Grep algorithm will search for qualified strings in the file based on a given string or regular expression and count the number of occurrences of each string.
MD5: The MD5 algorithm is a relatively common encryption algorithm at present. The distributed version of the MD5 algorithm mainly parallelizes it, which further improves the execution efficiency of the algorithm.
RandSample: The RandSample algorithm mainly performs random sampling operations, and the sampling ratio needs to be specified by the user.
WordCount: The WordCount algorithm mainly counts the word frequency of each word in the file, and the output result is each word and the number of times each word appears.
TeraSort: TeraSort algorithm is a sort algorithm designed for distributed systems. The industry usually uses the TeraSort algorithm to measure the performance of each distributed data processing framework by processing 1 TB of data.
In addition, the jobs related to the three data warehouses are mainly implemented by SQL statements, which respectively select, aggregate and join the data in multiple tables. Therefore, the implementation of these three batch jobs needs to rely on Hive and Hadoop simultaneously. The main function of Hive is to analyze SQL statements, transform them into one or more MapReduce tasks, and then invoke the interfaces provided by Hadoop to perform these tasks.
5.1.2 Online Service and Batch Jobs Deployment
In this paper, two nodes are utilized to construct the mixed load deployment scenario. The scheduling model proposed in this paper is not concerned about the batch job throughput, which is one of the primary reasons for not using more nodes. Hadoop’s master node is one of the two nodes, while the slave node is the other. The cluster has Java version 1.8 and Hadoop version 2.8.5 installed. In addition, the master node is solely responsible for scheduling and performs no actual work. Table 1 lists the configurations of the two nodes.
Table 1 demonstrates that the subordinate node has five times the number of CPU cores and eight-and-a-half times the amount of available memory as the master node. The master node is only responsible for processing read-write requests and generating the execution plan for MapReduce tasks. Since processing requests and generating the execution plan require fewer CPU and memory resources, the master node does not require excessive resource allocation. The slave node must store data and execute MapReduce operations, so its number of CPU cores and available memory is significantly greater than that of the master node.
Deployment of Online Services: Data Caching requires the discrete deployment of the server and client, both of which are containerized. Therefore, the Docker environment must be deployed beforehand on the slave node. To minimize the impact of the external network on the response time of the server, both the server and the client are simultaneously deployed on the subordinate node. In addition, 4 servers and 1 client are deployed to handle the high concurrent request volume.
Deployment of Batch Jobs: For the eight batch jobs selected in this article, the BigDataBench benchmark suite provides two shell scripts for each task. One is used to generate the data that the task needs to process, and the other is used to call the relevant Java package to start the Hadoop program. Therefore, from the perspective of compatibility, all batch jobs in the experimental cluster will be deployed in the form of Shell scripts. In addition, in order to be as close as possible to the deployment environment of Alibaba Cloud, all batch jobs are run directly on the physical machine rather than deployed through containers like online services.
5.2 Evaluation of Online Service Abnormal QoS Prediction
5.2.1 Feature Validity Analysis
Through the statistical analysis of the experimental data, we chose the type of offline jobs, the amount of data processed by batch jobs, and the number of visits to online services as indicators to predict the QoS anomaly of online services.
First, we count the average QoS values of online services for different batch jobs under different input data volumes and different access volumes, so as to represent the impact of different types of batch jobs on the QoS of online services, as shown in Fig. 4.
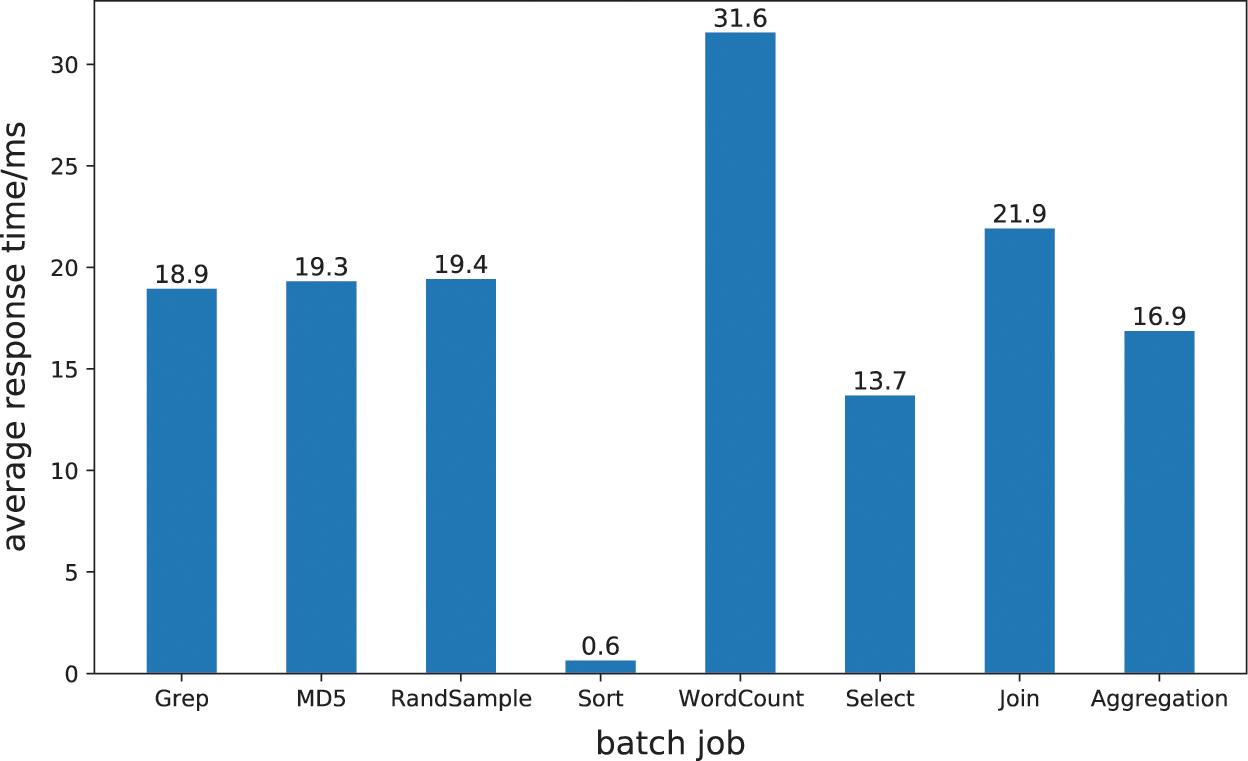
Figure 4: The impact of different batch jobs on the response time of the cache service
Fig. 4 demonstrates that the impact of various offline loads on online services is inconsistent. This is primarily due to the fact that various offline loads have distinct computing logic, resulting in varying resource requirements. Sort has the smallest impact on online service among the eight offline tasks chosen for the experiment. When hybrid deployment with Sort demand occurs, the online service’s average response time is less than 1 millisecond, which has almost no task impact. This is due to the fact that Sort load does not involve, or rarely involves, a variety of CPU operations, instead focusing on memory and disk operations. Therefore, when memory and disk storage space are sufficient, the sort load has a negligible influence on the online service. Grep, MD5, and RandSample have the same impact on online services, with Grep having a slightly lesser impact on online service response time. Regular expression matching is the primary execution logic of Grep load in the execution logic of tasks. The primary function of MD5’s execution logic is to encrypt sequences, so a significant portion of the execution logic of MD5 consists of logical operations. This has a similar effect on online services as Grep load and MD5 load. RandSample can use the pipeline mechanism of CPU instructions to get all the data it needs. Hard and soft interrupts will not happen often, so the effect on online services is moderate. WordCount is the batch job that has the largest effect on online services. During the execution of this task, it will be necessary to enumerate the occurrences of each word, necessitating a large number of arithmetic operations. The arithmetic operation will consume numerous CPU time slices, slowing the CPU’s processing speed for requests for online service access.
In terms of SQL load, the Select operation has the least effect on online service response time, whereas the Join operation has the greatest effect. This is due to the fact that Select only entails data filtering, which is comparable to Grep load but requires fewer CPU resources. On the other hand, the Join operation includes the Cartesian product, grouping, and statistical operations, and its demand for CPU and memory resources is greater than that of the relatively simple Select operation. This demonstrates that as the complexity of SQL load logic operations increases, their effect on online service performance will become increasingly significant.
Fig. 5 depicts the effect of different data processing volumes on the average response time of online services when both batch tasks and traffic volumes fluctuate simultaneously. According to the overall trend, the average response time of online services gradually increases as the volume of data processed grows. It demonstrates that as data input increases, the impact of offline operations on online services continually increases, which is consistent with what was anticipated prior to the experiment. Moreover, based on experimental findings, when the amount of data processed by the offline load is less than 9 GB, the effect of each offline load on the response time of the online service changes significantly. When more than 9 GB of data is processed, the effect of the offline load on the response time of online services is relatively stable.
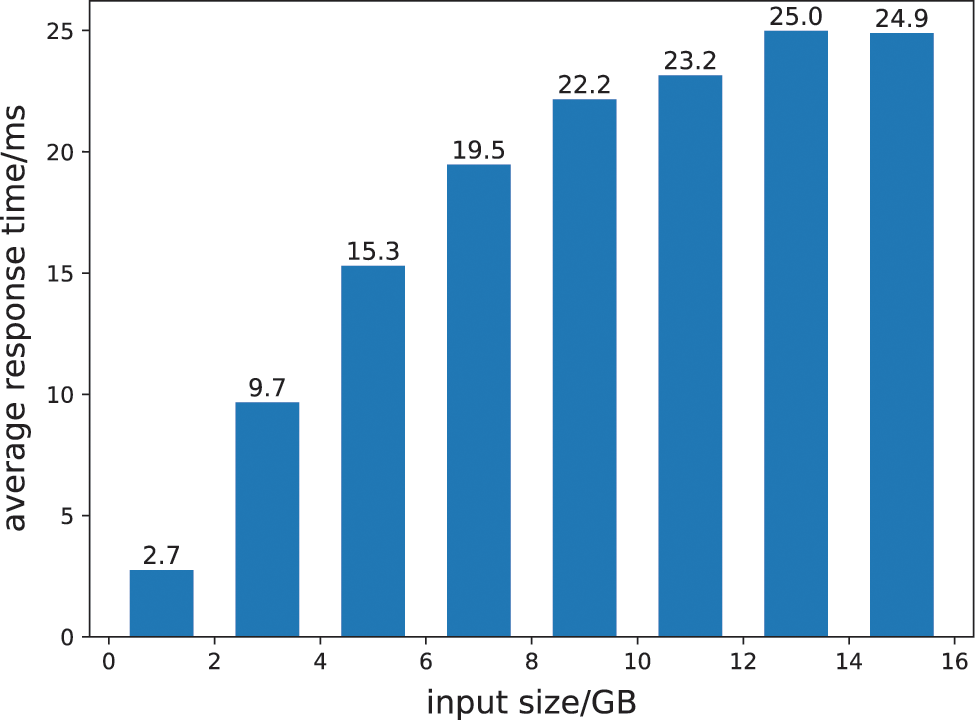
Figure 5: The impact of different data processing volumes on online services
Fig. 6 illustrates the impact of different traffic volumes on the response time of online services when batch tasks are deployed. Before the hybrid deployment of batch tasks and online services, the separately deployed online services were subjected to a stress test. The experiment determined that when the number of visits per second exceeds 290, the 95th percentile value of the response time for the online service will exceed the predetermined response time threshold. Therefore, the traffic is divided into three main categories and ten minor categories based on the maximum value of 290 K. The number of visits for the three main categories is, respectively, one thousand, ten thousand, and one hundred thousand. Fig. 6 depicts the classification of subcategories. According to the overall trend, the average response time of online services will progressively increase as the number of visits rises. This is because the server must utilize more CPU and memory when processing numerous network requests, particularly TCP-based requests. Memory resources are primarily used to store the package word for each TCP connection, whereas CPU resources are primarily used to monitor and process read and write events for each TCP connection. Therefore, the average response time of online services decreased as the number of visits increased within each broad category.
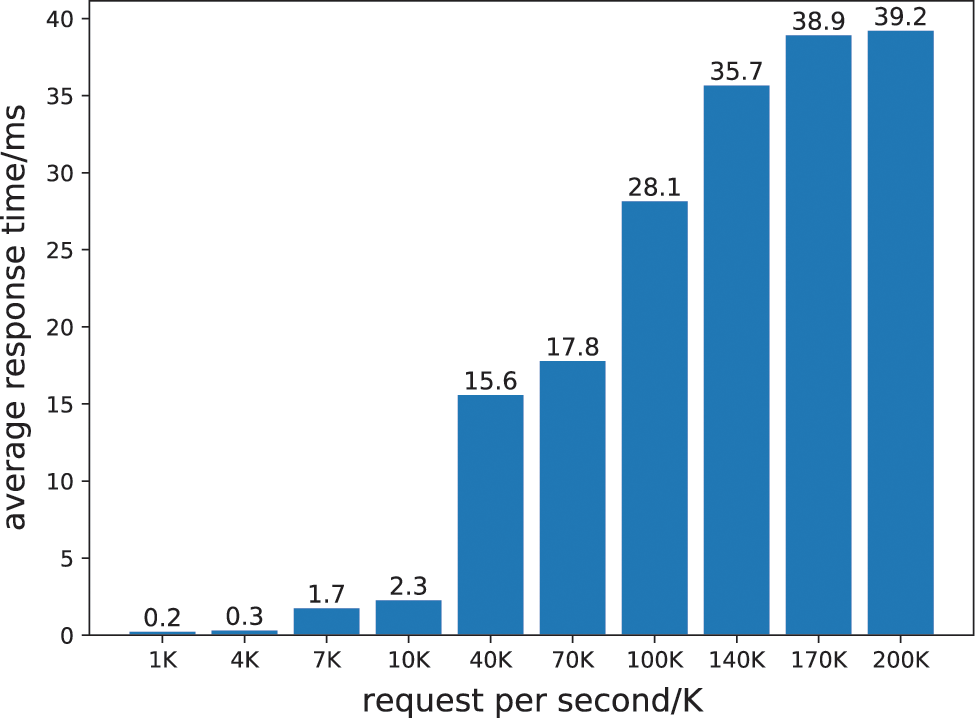
Figure 6: The impact of different RPS on online services
In contrast, there was typically an increase in average response time between categories. Fig. 6 reveals that although batch jobs will affect the response time of online services when the access volume of online services is small, the impact of batch jobs on online services will not violate the QoS of online services for batch jobs with a fixed amount of input data. However, when traffic increases, batch tasks can easily affect the quality of online services.
Fig. 7 is a three-dimensional representation of the data in these four dimensions that demonstrates the influence of the types of batch jobs, the quantity of data processed by batch jobs, and the number of visits to online services on the performance of online services in a more comprehensive manner. The three axes represent the type of batch jobs, the quantity of data processed by batch jobs, and the number of online service visits per second. Each point’s color represents the 95th percentile response time for online services. The darker the color, the faster the online service’s response time and the higher its efficacy. In contrast, it indicates that the online service has a slower response time.
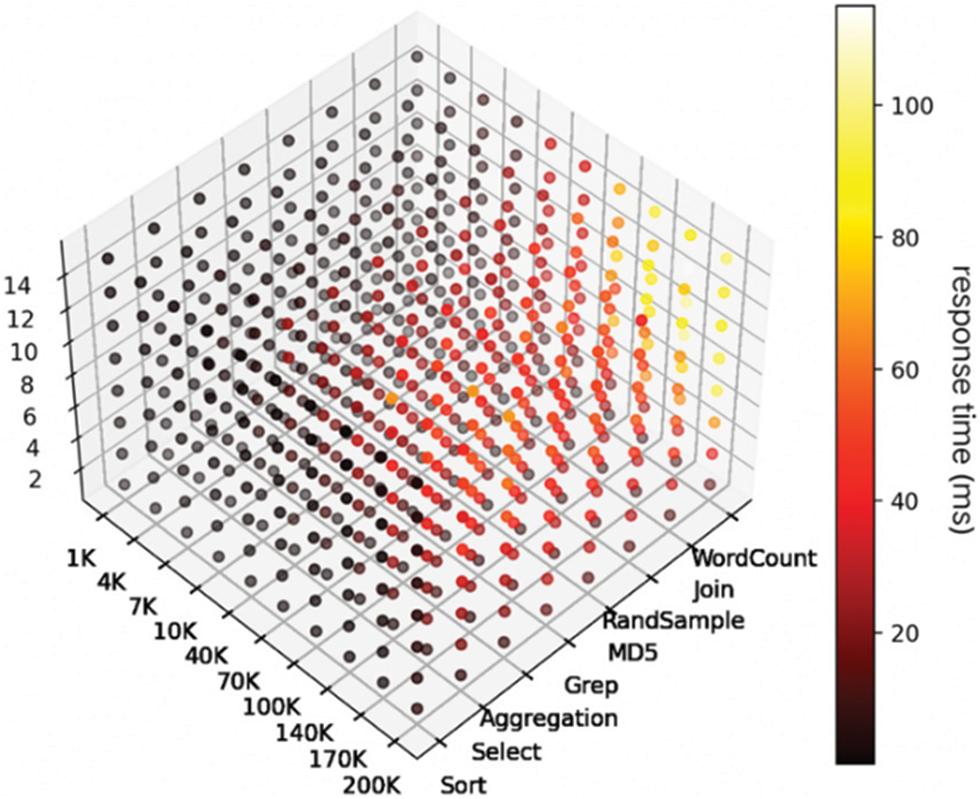
Figure 7: The impact of different characteristics on online service performance from a three-dimensional perspective
Fig. 7 provides a more precise view of the performance variations of online services along multiple dimensions. First, it can be observed that the number distribution of dark points and weak points is relatively uniform and that there are no apparent biases, indicating that the data collected in the experiment are highly representative. Therefore, the QoS prediction model for online services trained with this data set can have greater universality.
In addition, most light spots are related to three types of offline loads: WordCount, Join and RandSample. With the increase in traffic and data processing, WordCount, Join and RandSample offline loads are more likely to affect the QoS of online services. However, when the number of visits and data processing is small, no matter what kind of batch jobs is used, it has an obvious impact on online service QoS. This is consistent with the conclusion from the previous analysis of a single dimension.
To sum up, the load type of batch jobs, the amount of data processed by batch jobs and the number of visits to online services can affect the QoS of online services to varying degrees. Therefore, it is reasonable to use these three indexes as feature vectors in an online service abnormal QoS prediction model.
5.2.2 Experimental Evaluation and Comparison
Because the online service abnormal QoS prediction model proposed in this study is essentially a classification problem, the Accuracy, Recall and F1 scores are used to evaluate the effect of the model in the experiment. To prove the efficiency of the online service abnormal QoS prediction method proposed in this paper, Logistic Regression and Support Vector Machine (SVM) are used as comparison methods in the experiment. Logistic regression adopts the loss function as shown in formula (6). Finally, the weight vector of the final solution of logistic regression can be obtained by using the gradient descent method to get the minimum value of the loss function. In this paper, the most commonly used Gaussian kernel function is used as the kernel function in the comparison method when using a support vector machine. Its mathematical expression is shown in formula (7).
where
5.2.3 Experimental Result Analysis
During the experiment, dividing the data into a training set and a test set in a certain proportion is necessary. In order to avoid the accidental effect of model training caused by a specific data segmentation method in one experiment, this experiment is conducted ten times. Before each training session, the sample data will be randomly segmented and then combined into different training and test sets.
Fig. 8 shows the accuracy changes of different models over 10 training sessions. As can be seen from the figure, the results obtained by the same model after each training are quite different, which indicates that dividing the sample data set into different training sets and test sets greatly influences the training results.
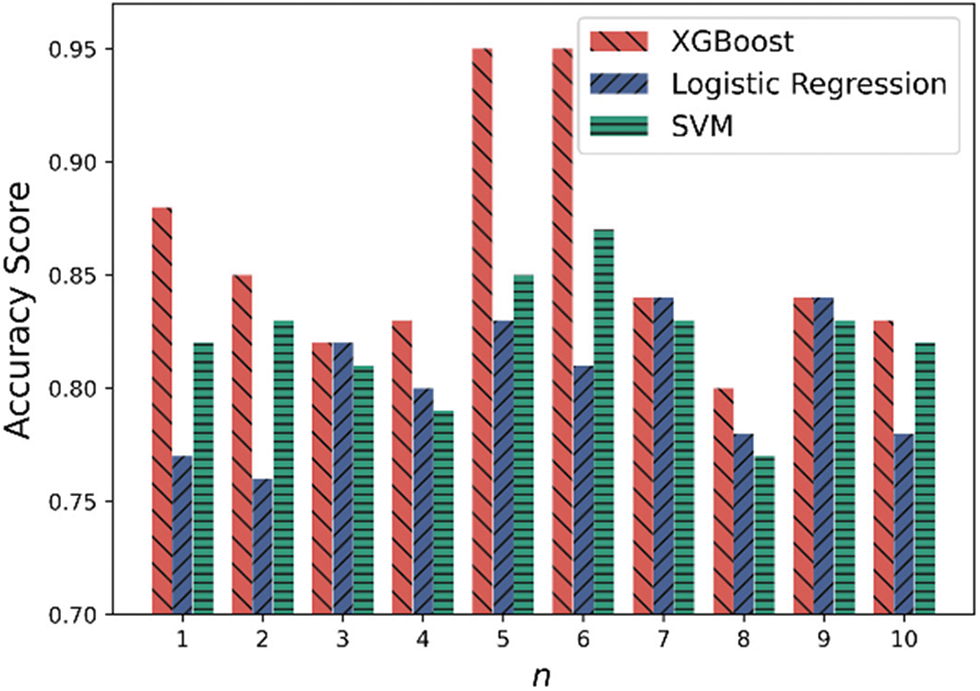
Figure 8: Comparison of model accuracy
From the comparison of models, the accuracy of the XGBoost model is always not lower than that of the logistic regression model and the SVM model. However, the comparison results between the logistic regression and SVM models depend on the training and test set. For example, in 10 experiments, the average accuracy of the XGBoost model is 0.86, that of the logistic regression model is 0.80, and that of the SVM model is 0.82. Therefore, the XGBoost model is slightly better than the logistic regression model and the SVM model in terms of average accuracy.
Since the accuracy of the model does not completely reflect its quality, it is also necessary to compare the pros and cons of each model by combining the recall rate and F1 score. The recall and F1 ratings of three models are displayed in Fig. 9. The recall rate of the SVM model is always lower than that of the XGBoost and logistic regression models, as shown in Fig. 9a. In only two out of ten training sessions, the recall rate of the XGBoost model is lower than that of the logistic regression model. In contrast, the recall of the logistic regression model is marginally greater or equal to that of XGBoost. In 10 experiments, the average recall of the XGBoost model was 5% and 21% greater than that of the logistic regression and SVM models, respectively.
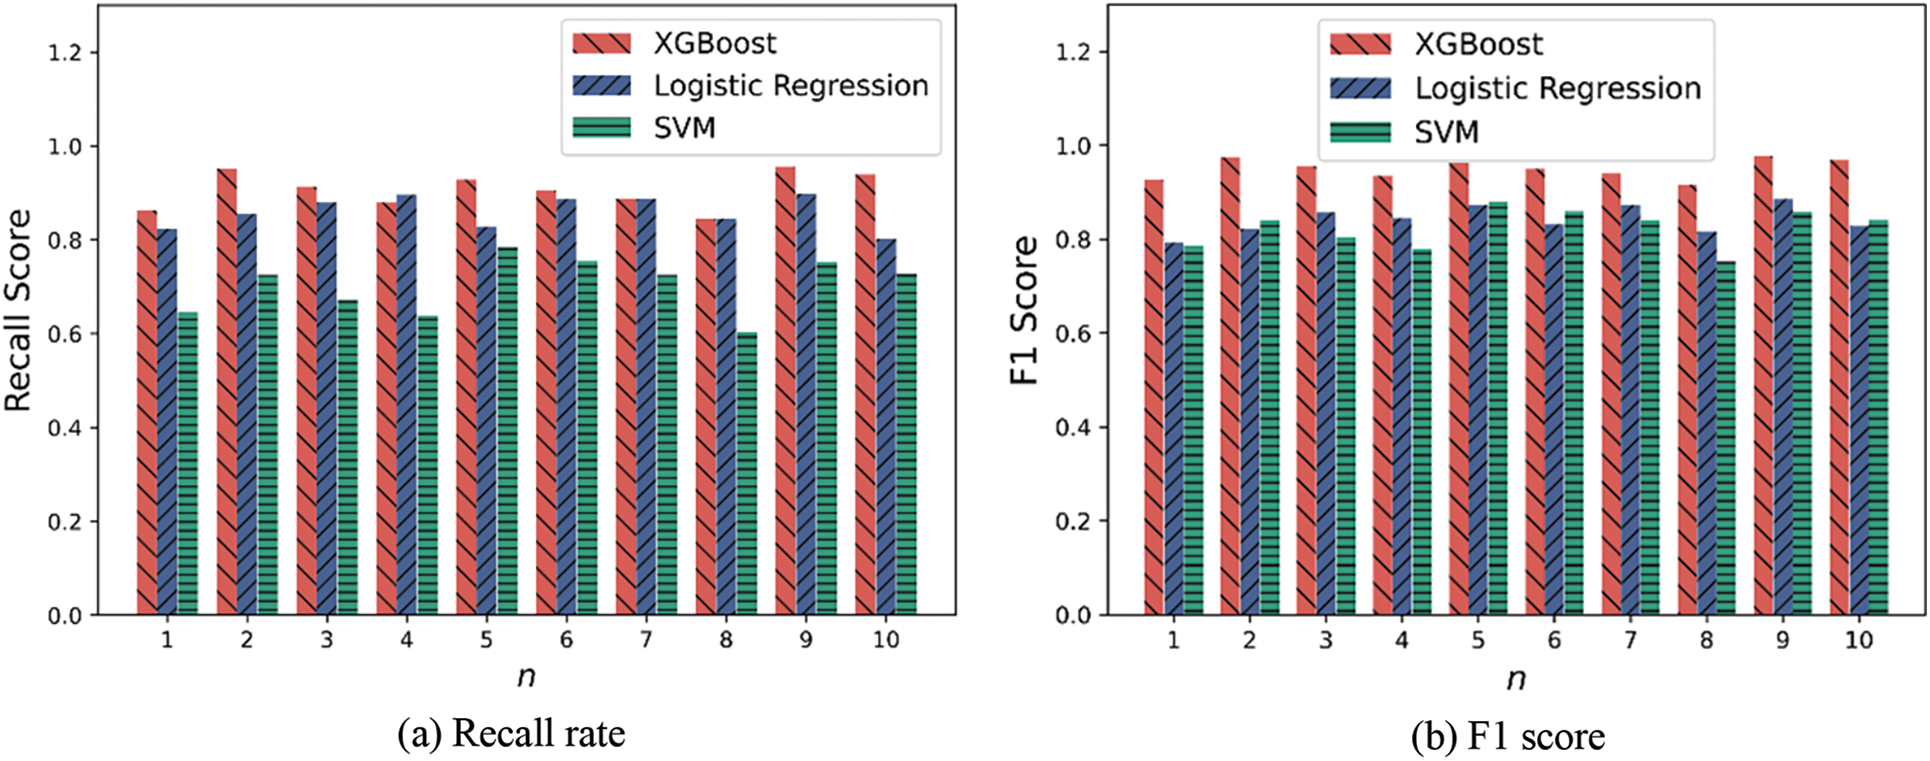
Figure 9: Comparison of model recall rate and F1 score
Furthermore, it can be seen from Fig. 9b that the F1 score of XGBoost is 11% and 13% higher on average than the logistic regression and SVM models, respectively, in 10 training sessions. To sum up, the XGBoost-based online service abnormal QoS prediction method proposed in this paper can predict the possible impact of batch jobs on online service performance at a high level. At the same time, considering the three indicators of accuracy rate, recall rate, and F1 score and the subsequent scheduling process, the XGBoost model of the fifth experiment is used as the online service abnormal QoS prediction model.
5.3 Evaluation of Batch Jobs Completion Time Prediction
5.3.1 Experimental Evaluation Index
Since the prediction of the completion time of batch jobs is essentially a regression problem, the evaluation indicators for classification problems introduced in the previous subsection are no longer applicable. Therefore, in order to objectively evaluate the prediction model of the batch job completion time based on the random forest proposed in this subsection. Effectiveness: This experiment uses the mean absolute deviation (MAE) as an evaluation indicator. The definitions and functions of the two are introduced below.
The mathematical definition of mean absolute error is shown in formula (8), representing the true and predicted values. The calculation principle of MAE is to sum the absolute values of the difference between all the actual values and the predicted values and then take the average value. This indicator can well measure the deviation from the predicted value.
5.3.2 Experimental Result Analysis
To prove the efficiency of the prediction model for offline job completion time based on the random forest proposed in this paper, linear regression [45] and Support Vector Regression (SVR) [46] are selected as comparison models. The main idea of linear regression is similar to that of logistic regression. It is necessary to determine a curve to minimize the residual error from the curve at each point. The mapping function does not need to transform the continuous result value into a discrete value. The SVR model belongs to an application of SVM in the regression field, and their ideas are similar. The main idea of SVR is to determine a hyperplane so that the distance between all data points and this hyperplane is as small as possible.
To avoid the influence of the different divisions of data sets on the experimental results, each group of experiments is also conducted 10 times, and each division of data sets is different from other times. At the same time, 75% of the data is used to train the model and 25% of the data is used to verify the validity of the model every time the data set is segmented. The MAE value and the experimental results are shown in Fig. 10. Tables 2 and 3 record the average and standard deviation of the three models MAE and R2 in 10 experiments, respectively.
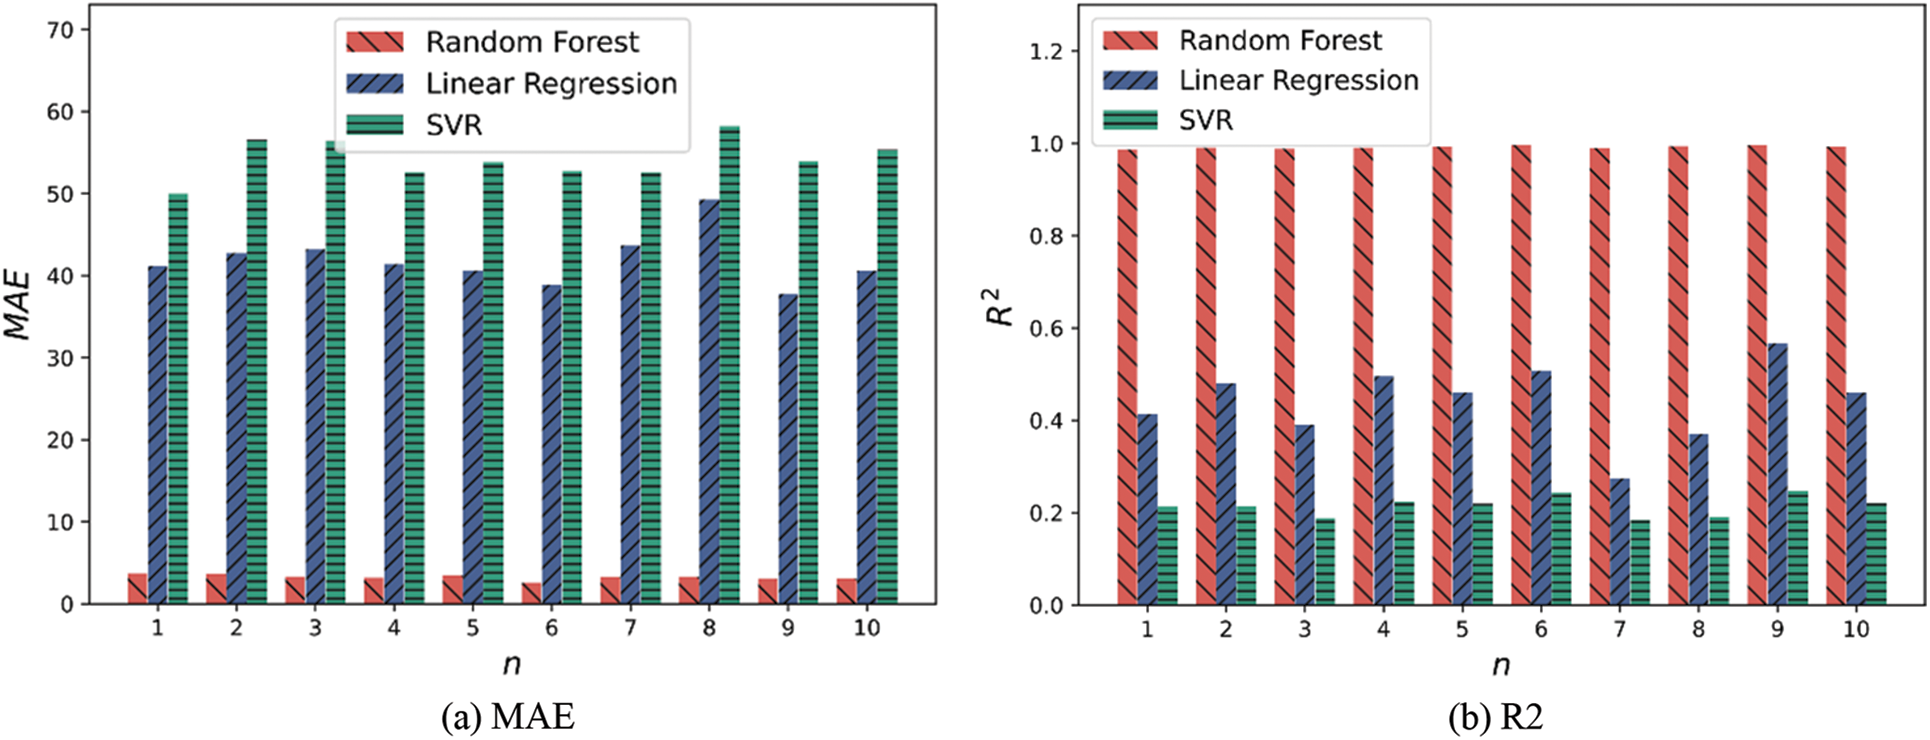
Figure 10: Comparison of model MAE and R2
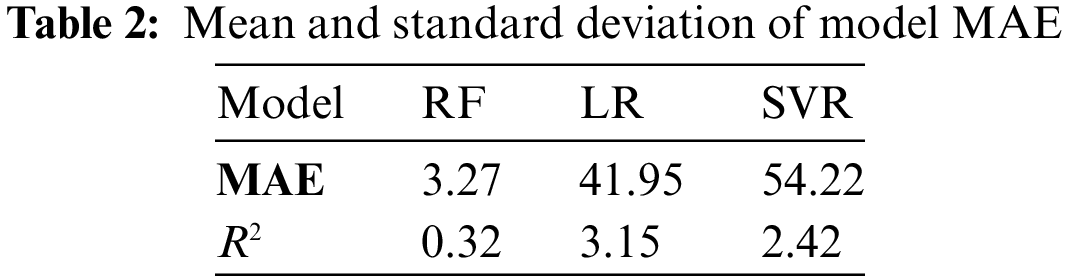
It can be seen from the above chart that the performance of random forest is better than that of linear regression and the SVR model, whether from MAE or
5.4 Hybrid Load Scheduling Evaluation
This section mainly provides a comprehensive evaluation of the hybrid load scheduling model proposed above. The evaluation is mainly divided into batch job scheduling, waiting time, and system resource utilization. Different from the data used in the previous training model, the experiment in this section keeps the type of each load unchanged but adjusts the amount of data to be processed by each batch job to be [2, 4, 6, 8, 10, 12, 14, 16] (unit: GB), so there are 64 batch jobs in total, and all batch job requests arrive in a random and disordered manner. At the same time, the number of visits to online services per second is adjusted to [1, 5, 10, 50, 100, 150, 200] (unit: k).
5.4.1 Batch Jobs Waiting Time Evaluation
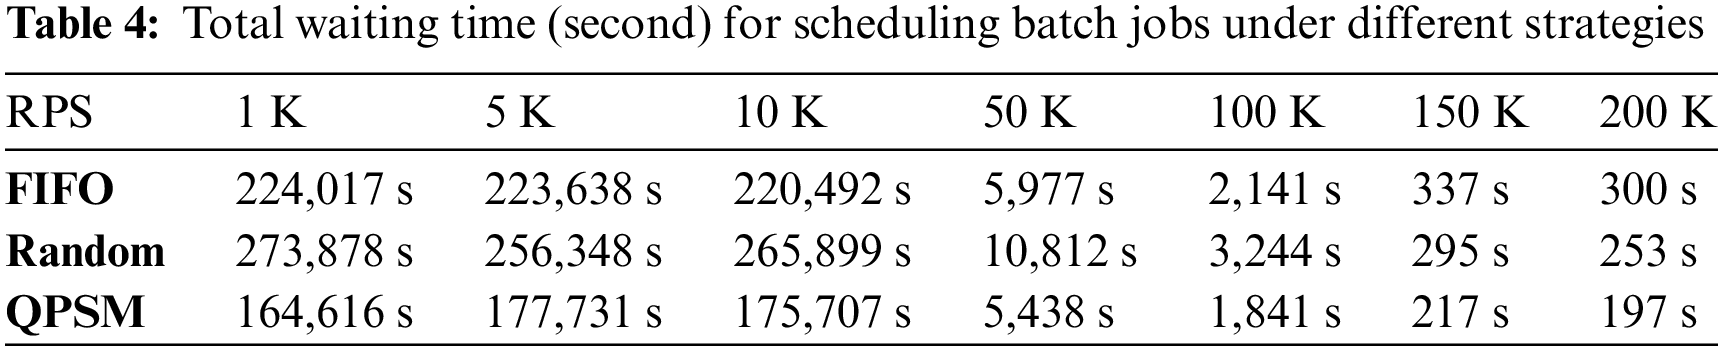
The waiting time of batch job scheduling refers to the time between when batch jobs enter the queue and when they exit the queue. The greater the efficiency of the scheduling strategy, the shorter the wait time for batch assignment scheduling. Table 4 displays the total waiting time (in seconds) demanded by the scheduling model, FIFO strategy, and random scheduling strategy proposed in this paper in order to schedule all batch tasks under varying traffic conditions. Table 4 demonstrates that, when scheduling the same number of batch tasks, QPSM reduces scheduling time by up to 16 h compared to the FIFO scheduling strategy, with an average reduction of approximately 6 h. The maximum reduction is 30 h, and the average reduction is approximately 11 h compared to the random scheduling strategy. Consequently, the QPSM scheduling model proposed in this paper can effectively reduce the waiting time for batch task scheduling. Additionally, less scheduling wait time allows for the simultaneous deployment of more batch tasks, thereby improving the batch jobs’ throughput.
5.4.2 System Resource Utilization Evaluation
The experiment compares the system resource utilization after adopting the QPSM scheduling model and the system resource utilization when the online service is deployed alone. The results are shown in Fig. 11.
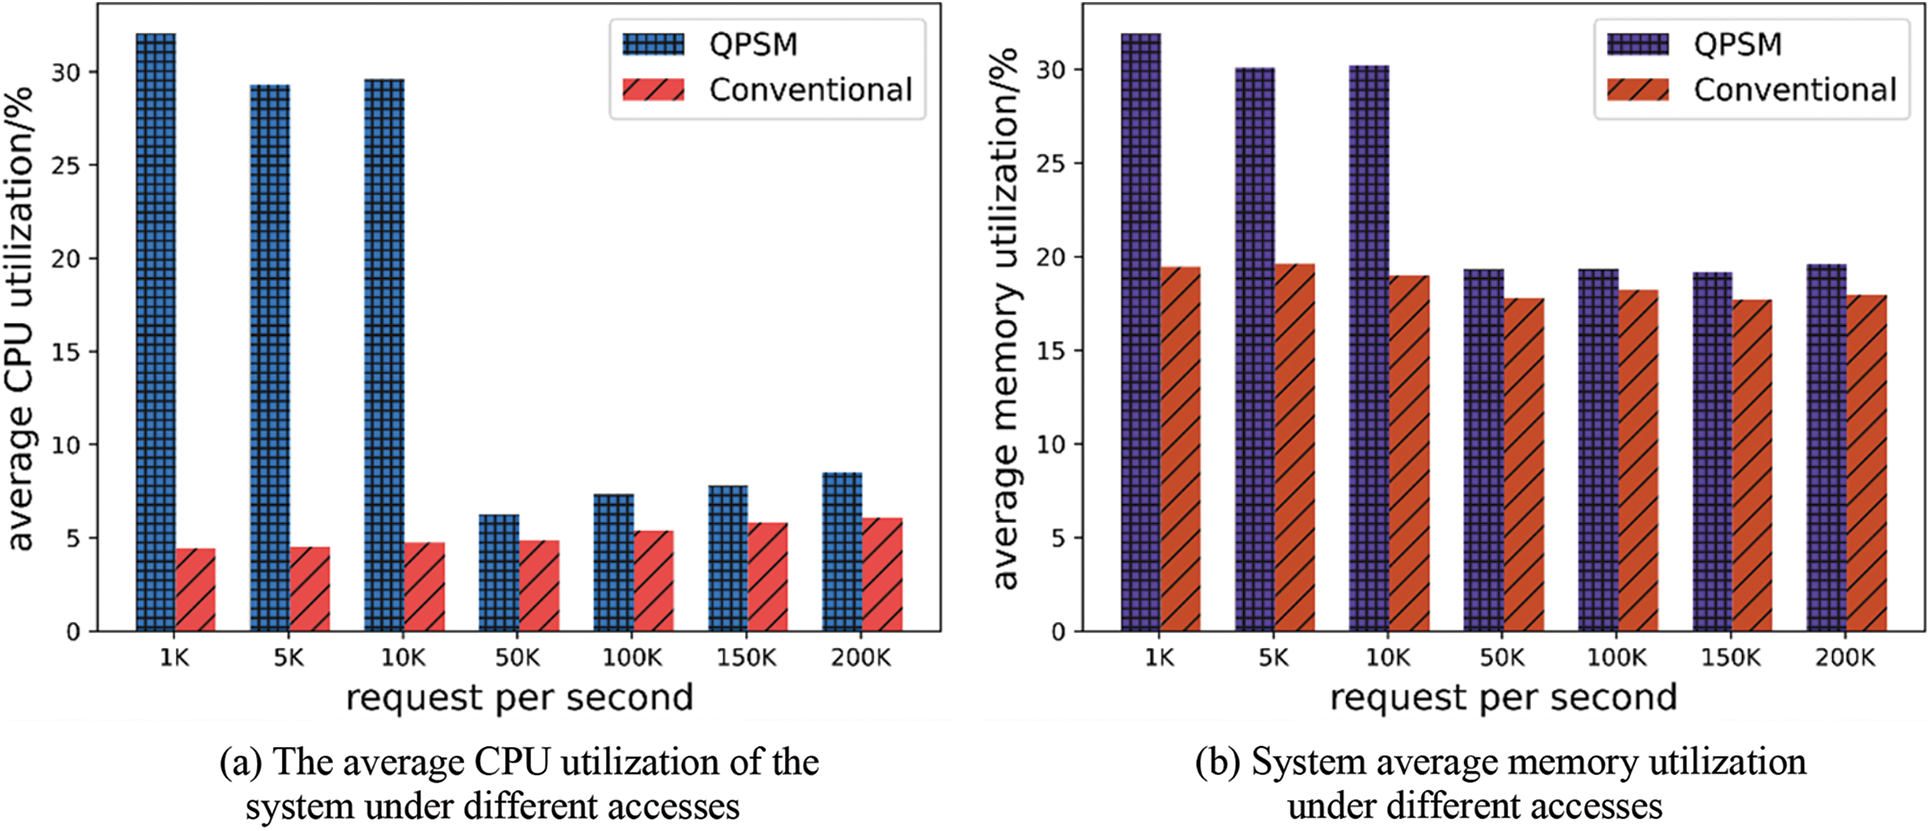
Figure 11: The average resource utilization of the system under different traffic
As can be seen from Fig. 11, compared with the traditional deployment method, the scheduling model proposed in this paper can effectively improve the utilization of system resources while ensuring the QoS of online services. %, the average memory utilization can be increased by 12.44%, with an average increase of 5.7%. In addition, with the increase in access to online services, both CPU and memory utilization show a downward trend in the case of hybrid deployment. This is because the access delay of the online service itself will continue to increase as the traffic volume increases, and the number of batch jobs that can meet the requirements of the hybrid deployment will continue to decrease. Therefore, the system’s resource utilization will decrease compared with the low access volume.
There is an abnormal phenomenon in Fig. 11a that deserves attention. The average CPU utilization of the system shows a trend of first decreasing and then increasing. When the access volume is between 50 and 100 K, the CPU resource utilization of the system is the lowest. Theoretically speaking, as the number of visits increases, the number of batch jobs that can be deployed will decrease, and the average CPU utilization of the system should show a decreasing trend. After further analysis, it is found that this phenomenon is mainly due to a certain error in the online service abnormal QoS prediction method proposed in this paper. Since 64 batch jobs need to be scheduled under different traffic volumes, the total number of batch jobs that need to be scheduled in the experiment is 448, and 19 of them are misjudged, with a misjudgment rate of 4.2%. The hybrid deployment of these 19 batch jobs and online services will not destroy the QoS of online services under the traffic volume at that time, but these jobs were not executed, and all these 19 batch jobs were misjudged under the traffic volumes of 50 and 100 K.
Fig. 12 is a statistical diagram of the average resource utilization rate of the system after all batch jobs that should be deployed are deployed. As can be seen from the figure, the average CPU and memory utilization decrease with the increase in traffic, which fully demonstrates the correctness of the above analysis.
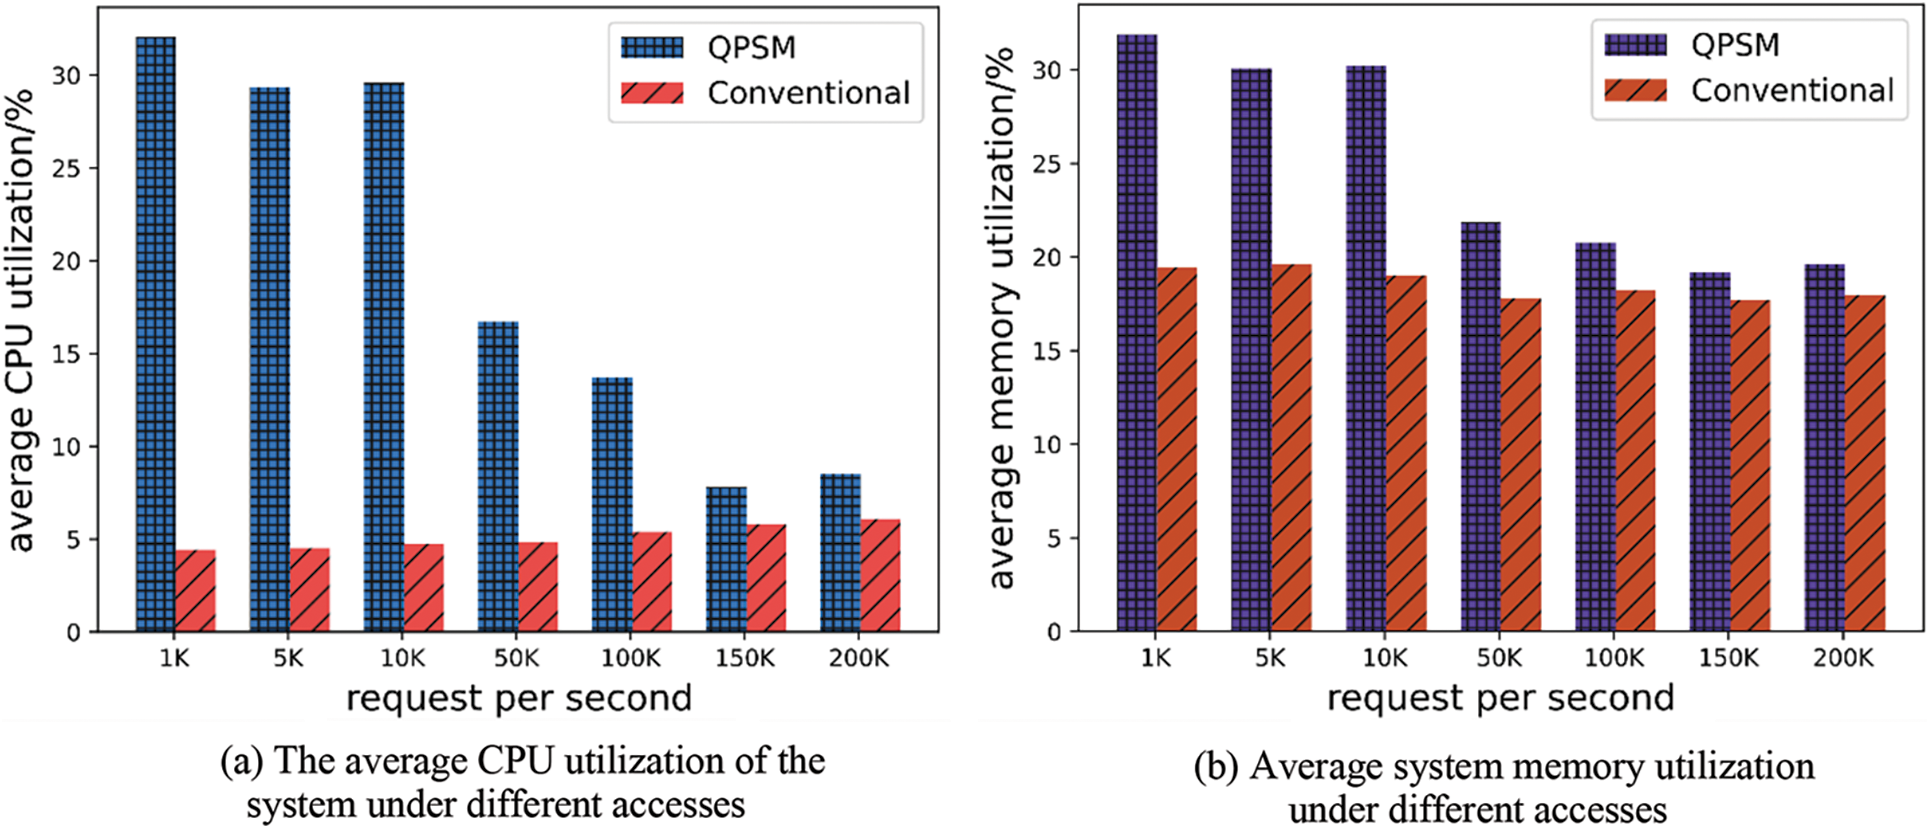
Figure 12: The average resource utilization of the system after all offline operations that meet the QoS requirements are deployed
Although hybrid deployment technology effectively improves resource utilization, resource contention impacts the performance of online services and batch jobs in the same shared resource cluster. This paper first proposed an XGBoost-based online service anomaly QoS prediction method in order to prevent batch tasks from negatively impacting the performance of online services. By analyzing the type of batch job, the quantity of data to be processed, and the access to the online service, the method can determine whether a hybrid deployment of batch jobs and online services will exceed the upper response time limit. Compared to the logistic regression model and the support vector machine model, the proposed method has an average accuracy that is 6% and 4% higher, and a recall rate that is 5% and 21% higher.
Then, this paper proposed a random forest-based method for predicting the completion time of batch jobs in order to reduce the total batch job waiting time. This method predicted the necessary execution time of batch jobs based on the types of batch jobs and the volume of data that batch jobs will process. Experiments indicate that the average absolute error value for this method is 39 and 52 percentage points lower than that of linear regression and support vector regression models, respectively, while the average fitting value is 0.55 and 0.78 percentage points higher. In addition, the experiment demonstrates that the proposed method is less sensitive to the training data and has a more stable training effect.
Lastly, based on the performance prediction of online services and batch jobs, QPSM, a mixed load scheduling model, is designed in this paper. Experiment results indicated that, when scheduling the same number of batch jobs, QPSM reduces scheduling time by approximately 6 h on average compared to the first-come, first-served strategy and approximately 11 h compared to the random scheduling strategy. Additionally, compared to a non-hybrid deployment, QPSM can increase CPU resource utilization by 12.15 percent and memory resource utilization by an average of 5.7 percent. Clearly, this model assures the QoS of online services and effectively increases server resource utilization.
Acknowledgement: None.
Funding Statement: This work is supported by the National Natural Science Foundation of China (No. 61972118), and the Key R&D Program of Zhejiang Province (No. 2023C01028).
Author Contributions: The authors confirm their contribution to the paper as follows: study conception and design: Yongjian Ren; data collection, analysis and interpretation of results: Dongyang Ou; draft manuscript preparation: Congfeng Jiang. All authors reviewed the results and approved the final version of the manuscript.
Availability of Data and Materials: This paper uses a publicly available dataset from the Internet and the readers can obtain the benchmark used in this paper from the Internet.
Conflicts of Interest: The authors declare that they have no conflicts of interest to report regarding the present study.
References
1. Masanet, E., Shehabi, A., Lei, N., Smith, S., Koomey, J. (2020). Recalibrating global data center energy-use estimates. Science, 367(6481), 984–986. [Google Scholar] [PubMed]
2. Song, J., Sun, Z. Z., Liu, H., Bao, Y. B., Yu, G. (2018). Research progress on energy consumption optimization of hybrid power supply data center. Chinese Journal of Computers, 41, 2670–2688. [Google Scholar]
3. Rong, H., Zhang, H., Xiao, S., Li, C., Hu, C. (2016). Optimizing energy consumption for data centers. Renewable and Sustainable Energy Reviews, 58, 674–691. [Google Scholar]
4. Gelenbe, E., Caseau, Y. (2015). The impact of information technology on energy consumption and carbon emissions. Ubiquity, 2015, 1–15. [Google Scholar]
5. Wang, K. J., Jia, T., Li, Y. (2020). A review of job scheduling and resource management technology in offline co-location. Journal of Software, 31, 3100–3119. [Google Scholar]
6. Luo, L., Liu, Y., Qian, D. P. (2016). Review of in-memory computing technology. Journal of Software, 27(8), 2147–2167 (In Chinese). [Google Scholar]
7. Dean, J., Ghemawat, S. (2008). MapReduce: Simplified data processing on large clusters. Communications of the ACM, 51(1), 107–113. [Google Scholar]
8. Chen, S., Delimitrou, C., Martínez, J. F. (2019). PARTIES: QoS-aware resource partitioning for multiple interactive services. Proceedings of the Twenty-Fourth International Conference on Architectural Support for Programming Languages and Operating Systems, pp. 107–120. Providence, USA: ACM. [Google Scholar]
9. Zhu, H., Lo, D., Cheng, L., Govindaraju, R., Ranganathan, P. et al. (2019). Kelp: Qos for accelerated machine learning systems. 2019 IEEE International Symposium on High Performance Computer Architecture (HPCA), pp. 172–184. Washington, USA, IEEE. [Google Scholar]
10. Sung, H., Min, J., Ha, S., Eom, H. (2019). OMBM: Optimized memory bandwidth management for ensuring QoS and high server utilization. Cluster Computing, 22, 161–174. [Google Scholar]
11. Jain, P. N., Surve, S. K. (2020). A review on shared resource contention in multicores and its mitigating techniques. International Journal of High Performance Systems Architecture, 9(1), 20–48. [Google Scholar]
12. Verma, A., Pedrosa, L., Korupolu, M., Oppenheimer, D., Tune, E. et al. (2015). Large-scale cluster management at Google with Borg. Proceedings of the Tenth European Conference on Computer Systems, pp. 1–17. Bordeaux, France, ACM. [Google Scholar]
13. Hindman, B., Konwinski, A., Zaharia, M., Ghodsi, A., Joseph, A. D. et al. (2011). Mesos: A platform for fine-grained resource sharing in the data center. NSDI, 11, 22. [Google Scholar]
14. Schwarzkopf, M., Konwinski, A., Abd-El-Malek, M., Wilkes, J. (2013). Omega: Flexible, scalable schedulers for large compute clusters. Proceedings of the 8th ACM European Conference on Computer Systems, pp. 351–364. Prague, Czech Republic ACM. [Google Scholar]
15. Boutin, E., Ekanayake, J., Lin, W., Shi, B., Zhou, J. et al. (2014). Apollo: Scalable and coordinated scheduling for cloud-scale computing. Proceedings of the 11th USENIX Conference on Operating Systems Design and Implementation, pp. 285–300. Broomfield, USA, ACM. [Google Scholar]
16. Cheng, Y., Anwar, A., Duan, X. (2018). Analyzing Alibaba’s co-located datacenter workloads. 2018 IEEE International Conference on Big Data (Big Data), pp. 292–297. Seattle, USA, IEEE. [Google Scholar]
17. Zhang, Z., Li, C., Tao, Y., Yang, R., Tang, H. et al. (2014). Fuxi: A fault-tolerant resource management and job scheduling system at internet scale. Proceedings of the VLDB Endowment, 7(13), 1393–1404. [Google Scholar]
18. Jiang, C., Qiu, Y., Shi, W., Ge, Z., Wang, J. et al. (2020). Characterizing co-located workloads in Alibaba cloud datacenters. IEEE Transactions on Cloud Computing, 10(4), 2381–2397. [Google Scholar]
19. Xuejuan, C., Yali, S. (2021). Elastic resource allocation algorithm for cloud computing data center. Computer Simulation, 38, 217–220. [Google Scholar]
20. Zhou, M. S., Dong, X. S., Chen, H., Zhang, X. J. (2020). A dynamic fine-grained resource scheduling method in cloud environment. Journal of Software, 31(12), 3981–3999 (In Chinese). [Google Scholar]
21. Xu, F., Wang, S. C., Yang, W. X. (2019). Cloud resource scheduling algorithm based on game theory. Computer Science, 46, 295–299 (In Chinese). [Google Scholar]
22. Yang, L. J., Chen, X., Huang, Y. H. (2021). Adaptive reource allocation method for cloud software services based on PSO-GA for load-time window. Small and Microcomputer Systems, 42(5), 953–960 (In Chinese). [Google Scholar]
23. Delimitrou, C., Kozyrakis, C. (2014). Quasar: Resource-efficient and QoS-aware cluster management. ACM Sigplan Notices, 49(4), 127–144. [Google Scholar]
24. Lo, D., Cheng, L., Govindaraju, R., Ranganathan, P., Kozyrakis, C. (2015). Heracles: Improving resource efficiency at scale. Proceedings of the 42nd Annual International Symposium on Computer Architecture,pp. 450–462. Portland, USA, ACM. [Google Scholar]
25. Mars, J., Tang, L., Hundt, R., Skadron, K., Soffa, M. L. (2011). Bubble-Up: Increasing utilization in modern warehouse scale computers via sensible co-locations. Proceedings of the 44th annual IEEE/ACM International Symposium on Microarchitecture, pp. 248–259. [Google Scholar]
26. Zhong, Z., He, J., Rodriguez, M. A., Erfani, S., Kotagiri, R. et al. (2020). Heterogeneous task co-location in containerized cloud computing environments. 2020 IEEE 23rd International Symposium on Real-Time Distributed Computing (ISORC), pp. 79–88, Nashville, USA, IEEE. [Google Scholar]
27. Yang, H., Breslow, A., Mars, J., Tang, L. (2013). Bubble-flux: Precise online QoS management for increased utilization in warehouse scale computers. ACM Sigarch Computer Architecture News, 41(3), 607–618. [Google Scholar]
28. Chen, Q., Yang, H., Guo, M., Kannan, R. S., Mars, J. et al. (2017). Prophet: Precise QoS prediction on non-preemptive accelerators to improve utilization in warehouse-scale computers. ACM SIGPLAN Notices, 52(4), 17–32. [Google Scholar]
29. Zhang, Y., Laurenzano, M. A., Mars, J., Tang, L. (2014). SMiTe: Precise QoS prediction on real-system SMT processors to improve utilization in warehouse scale computers. 2014 47th Annual IEEE/ACM International Symposium on Microarchitecture, pp. 406–418. Cambridge, UK, IEEE. [Google Scholar]
30. Chen, Q., Wang, Z., Leng, J., Li, C., Zheng, W. et al. (2019). Avalon: Towards QoS awareness and improved utilization through multi-resource management in datacenters. Proceedings of the ACM International Conference on Supercomputing, pp. 272–283. Phoenix, USA, ACM. [Google Scholar]
31. Kasture, H., Sanchez, D. (2014). UBIK: Efficient cache sharing with strict QoS for latency-critical workloads. ACM Sigplan Notices, 49(4), 729–742. [Google Scholar]
32. Zhu, H., Erez, M. (2016). Dirigent: Enforcing QoS for latency-critical tasks on shared multicore systems. ACM SIGARCH Computer Architecture News, 44, 33–47. [Google Scholar]
33. Zhuo, C., Luo, S., Gan, H., Hu, J., Shi, Z. (2019). Noise-aware DVFS for efficient transitions on battery-powered IoT devices. IEEE Transactions on Computer-Aided Design of Integrated Circuits and Systems, 39(7), 1498–1510. [Google Scholar]
34. Haque, M. E., Eom, Y. H., He, Y., Elnikety, S., Bianchini, R. et al. (2015). Few-to-many: Incremental parallelism for reducing tail latency in interactive services. ACM Sigplan Notices, 50(4), 161–175. [Google Scholar]
35. Li, J., Agrawal, K., Elnikety, S., He, Y., Lee, I. T. A. et al. (2016). Work stealing for interactive services to meet target latency. Proceedings of the 21st ACM Sigplan Symposium on Principles and Practice of Parallel Programming, pp. 1–13. Barcelona, Spain, ACM. [Google Scholar]
36. Gao, H., Qiu, B., Barroso, R. J. D., Hussain, W., Xu, Y. et al. (2022). TSMAE: A novel anomaly detection approach for internet of things time series data using memory-augmented autoencoder. IEEE Transactions on Network Science and Engineering, 10(5), 2978–2990. [Google Scholar]
37. Ma, X., Xu, H., Gao, H., Bian, M., Hussain, W. (2022). Real-time virtual machine scheduling in industry IoT network: A reinforcement learning method. IEEE Transactions on Industrial Informatics, 19(2), 2129–2139. [Google Scholar]
38. Gao, H., Huang, W., Liu, T., Yin, Y., Li, Y. (2023). PPO2: Location privacy-oriented task offloading to edge computing using reinforcement learning for intelligent autonomous transport systems. IEEE Transactions on Intelligent Transportation Systems, 24(7), 7599–7612. [Google Scholar]
39. Yuan, T., Ou, D., Wang, J., Jiang, C., Cérin, C. et al. (2021). PPCTS: Performance prediction-based co-located task scheduling in clouds. International Conference on Algorithms and Architectures for Parallel Processing, pp. 245–257. Xiamen, China, Springer. [Google Scholar]
40. Borkowski, M., Schulte, S., Hochreiner, C. (2016). Predicting cloud resource utilization. Proceedings of the 9th International Conference on Utility and Cloud Computing, pp. 37–42. New York, USA, ACM. [Google Scholar]
41. Khan, A. U., Ratha, B. K. (2015). Time series prediction QoS routing in software defined vehicular ad-hoc network. 2015 International Conference on Man and Machine Interfacing (MAMI), pp. 1–6. New Jersey, USA, IEEE. [Google Scholar]
42. Zhang, X., Tune, E., Hagmann, R., Jnagal, R., Gokhale, V. et al. (2013). CPI2: CPU performance isolation for shared compute clusters. Proceedings of the 8th ACM European Conference on Computer Systems, pp. 379–391. Prague, Czech Republic, ACM. [Google Scholar]
43. Chen, T., Guestrin, C. (2016). XGBoost: A scalable tree boosting system. Proceedings of the 22nd ACM Sigkdd International Conference on Knowledge Discovery and Data Mining, pp. 785–794. New York, USA, ACM. [Google Scholar]
44. Tang, R., Zhang, X. (2020). CART decision tree combined with boruta feature selection for medical data classification. 2020 5th IEEE International Conference on Big Data Analytics (ICBDA), pp. 80–84. New Jersey, USA, IEEE. [Google Scholar]
45. Kumari, K., Yadav, S. (2018). Linear regression analysis study. Journal of the Practice of Cardiovascular Sciences, 4(1), 33. [Google Scholar]
46. Li, S., Fang, H., Liu, X. (2018). Parameter optimization of support vector regression based on sine cosine algorithm. Expert Systems with Applications, 91, 63–77. [Google Scholar]
Cite This Article
 Copyright © 2024 The Author(s). Published by Tech Science Press.
This work is licensed under a Creative Commons Attribution 4.0 International License , which permits unrestricted use, distribution, and reproduction in any medium, provided the original work is properly cited.
 Downloads
 Citation Tools