
 Submit a Paper
 Propose a Special lssue
 Open Access
ARTICLE

CAW-YOLO: Cross-Layer Fusion and Weighted Receptive Field-Based YOLO for Small Object Detection in Remote Sensing
1 College of Artificial Intelligence and Big Data, Henan University of Technology, Zhengzhou, 450001, China
2 College of Information Science and Engineering, Henan University of Technology, Zhengzhou, 450001, China
* Corresponding Author: Weiya Shi. Email:
(This article belongs to the Special Issue: Machine Learning-Guided Intelligent Modeling with Its Industrial Applications)
Computer Modeling in Engineering & Sciences 2024, 139(3), 3209-3231. https://doi.org/10.32604/cmes.2023.044863
Received 10 August 2023; Accepted 04 December 2023; Issue published 11 March 2024
 View Full Text
 Download PDF
Abstract
In recent years, there has been extensive research on object detection methods applied to optical remote sensing images utilizing convolutional neural networks. Despite these efforts, the detection of small objects in remote sensing remains a formidable challenge. The deep network structure will bring about the loss of object features, resulting in the loss of object features and the near elimination of some subtle features associated with small objects in deep layers. Additionally, the features of small objects are susceptible to interference from background features contained within the image, leading to a decline in detection accuracy. Moreover, the sensitivity of small objects to the bounding box perturbation further increases the detection difficulty. In this paper, we introduce a novel approach, Cross-Layer Fusion and Weighted Receptive Field-based YOLO (CAW-YOLO), specifically designed for small object detection in remote sensing. To address feature loss in deep layers, we have devised a cross-layer attention fusion module. Background noise is effectively filtered through the incorporation of Bi-Level Routing Attention (BRA). To enhance the model’s capacity to perceive multi-scale objects, particularly small-scale objects, we introduce a weighted multi-receptive field atrous spatial pyramid pooling module. Furthermore, we mitigate the sensitivity arising from bounding box perturbation by incorporating the joint Normalized Wasserstein Distance (NWD) and Efficient Intersection over Union (EIoU) losses. The efficacy of the proposed model in detecting small objects in remote sensing has been validated through experiments conducted on three publicly available datasets. The experimental results unequivocally demonstrate the model’s pronounced advantages in small object detection for remote sensing, surpassing the performance of current mainstream models.Keywords
With the advancement of aerospace remote sensing technology, the tasks such as classification, segmentation, detection, and tracking of remote sensing images have emerged as focal points in the modern field of image processing. In recent years, deep learning-based object detection algorithms have achieved notable breakthroughs in various domains [1]. Despite the success of these object detection algorithms [2–5] in detecting medium and large objects in remote sensing object detection tasks, challenges persist when it comes to small objects characterized by a limited number of pixel values. Even the current more advanced object detection algorithms [6–9] cannot completely overcome this challenge. The definition of small objects varies in different scenarios, and there are fundamental approaches for classification: 1) Based on relative scale, object instances whose relative area, i.e., the ratio of the area of the bounding box to the area of the image, has a median between 0.08% and 0.58% for all object instances in the same category are defined as small objects; 2) Based on absolute scale, i.e., from the perspective of the absolute pixel size of the object, the most common definition comes from the MSCOCO dataset [10], a generalized dataset in the field of object detection, which defines a small object as an object with a resolution of less than 32 pixels by 32 pixels.
Presently, there are two types of object detection models based on deep learning: single-stage detection models and two-stage detection models. Unfortunately, both detection models exhibit notable shortcomings in the performance of small object detection compared to other sizes of objects [11]. Persistent challenges in small object detection include the following: Firstly, the risk of losing object information is pronounced. Common contemporary object detectors are typically comprised of a backbone and a detection head, with the latter making decisions based on the representation output by the former. While these models have proven effective and yielded unprecedented success, general feature extraction networks often employ down-sampling operations to filter out noise and reduce the spatial resolution of the feature maps. While this loss has minimal impact on the model’s performance for medium and large object detection, it proves fatal for small objects. The detection head struggles to provide accurate predictions in highly structured representations when the subtle features of small objects are nearly eliminated from the deep features. Secondly, noise adversely affects feature representation, and discriminative features are crucial for both classification and localization tasks. Small objects typically exhibit low resolution and poor feature quality, posing challenges in learning discriminatively from the distorted structures. Simultaneously, regional features of small objects are susceptible to background and other environmental factors, introducing additional noise into the deep learning process. Thirdly, small objects exhibit low tolerance for perturbation of bounding frames. In most object detection algorithms, localization—one of the primary tasks—is formulated as a regression problem. The localization branch is designed to output bounding box offsets, and the Intersection over Union (IoU) metric is commonly used for accuracy evaluation. However, even a slight deviation significantly lowers the IoU, exacerbating the learning difficulty of the regression branch. Numerous scholars have proposed solutions to these challenges in small object detection. For example, Bai et al. [12] proposed a feature-enhanced pyramid and shallow feature reconstruction network (FEPS-Net) based on feature enhancement to address the difficulty of detecting densely distributed small ships in synthetic aperture radar (SAR) ship images. FEPS-Net proposes a feature enhancement pyramid that includes a spatial enhancement module for enhancing spatial location information and suppressing background noise, and a feature alignment module for solving the problem of feature misalignment during feature fusion; in addition, for the problem of detecting small ships in SAR ship images, a shallow feature reconstruction module is designed to extract the semantic information of small ships. Huang et al. [13] proposed a cross-scale feature fusion pyramid network for the problem of fewer small object features in the deep network, in which the Cross-Scale Fusion Module (CSFM) is introduced to perform multi-scale fusion in order to ensure that there are enough small object features in the output features, and in this way to solve the problem of difficult detection of small objects in remote sensing images. While these existing methods have improved detection accuracy to some extent, they still face limitations:1) Most detection models targeting small objects adopt only the multi-scale fusion method, neglecting the cross-layer fusion strategy and the determination of the fusion factor; 2) The Spatial Pyramid Pooling (SPP) module in many models does not incorporate smaller receptive fields and self-learning weighted ideas, hindering small object detection; 3) The optimization of the frame regression loss calculation method is overlooked in most models, resulting in poor locating ability for small objects.
To tackle the challenges associated with detecting small objects, we propose the Cross-Layer Fusion and Weighted Receptive Field-based YOLO [14] (CAW-YOLO) for small object detection in remote sensing. This approach utilizes the YOLOX-S object detection model as the baseline model. Firstly, Bi-Level Routing Attention (BRA) [15] is introduced into the backbone network to enhance feature extraction while effectively filtering out noise. Secondly, we propose MSCA-CBAM, an enhancement of the Convolutional Block Attention Module (CBAM) [16], addressing the limitations of CBAM. Thirdly, we present a weighted multi-receptive field atrous spatial pyramid pooling module, leveraging the concept of receptive field weighting to augment the detection capability for small objects. Fourthly, a cross-layer attention fusion module is constructed using a multi-scale fusion scheme, which fuses shallow and deep features, so that the information of small objects is retained to the maximum extent in the fused feature map. Finally, we address the low tolerance of small objects to bounding box perturbations by incorporating the joint Normalized Wasserstein Distance (NWD) [17] and Efficient Intersection over Union (EIoU) [18] losses as the model’s box regression loss function. The following summarizes the contributions of the paper:
1. Utilizing YOLOX-S [19] as the baseline model, we propose CAW-YOLO for remote sensing small objects, which surpass current mainstream object detection models used for multiple small object datasets in remote sensing.
2. A cross-layer attention fusion module is proposed which is to preserve the information of small objects in the fused feature map to the greatest extent and reduce the redundancy in the feature fusion process through the attention mechanism. It is worth mentioning that we propose an improved CBAM based on CBAM in this module.
3. Based on a weighting mechanism, a multi-receptive field atrous spatial pyramid pooling module is proposed so that the model can dynamically adjust the importance of different sizes of receptive field feature maps according to different inputs.
4. We adopt a joint box regression loss function to address the low tolerance of small objects to bounding box disturbances while maintaining a high convergence speed in the model.
The remainder of the article is organized as follows: Section 2 reviews some related work. Section 3 describes the materials and methods of our work. Section 4 presents our experimental results and discusses their significance. Finally, Section 5 provides a concise summary of our findings and suggests directions for future research.
In recent years, the attention mechanism has gained widespread use across various task models, such as language and vision, due to its exceptional performance. Attention systems operate by selectively weighting input variables to determine output variables. In visual models, attention systems suppress irrelevant information by assigning weights to features in the object area. SENet [20] obtains the weights corresponding to each channel through compression and assigns the corresponding weights to each channel; CBAM calculates the attention weights in both spatial and channel dimensions to better focus on the features of interest; CA (Coordinate Attention) [21] is essentially spatial attention by performing average pooling horizontally and vertically, and assigns different weight coefficients to different locations in space after embedding the location information in the channel attention.
Multi-scale feature fusion forms the foundational structure for addressing small object detection problems. Deeper Convolutional Neural Network (CNN) structures generate multi-layer feature maps with diverse spatial resolutions. Lower layers contain finer-grained and more localized features, while higher layers offer richer semantic information. The challenge arises because features of small objects may vanish in deeper layers due to down-sampling. Therefore, feature fusion integrates features at different levels or branches, enhancing the representation of small object features. SSD [22] first attempts to use pyramid features for object detection. Feature Pyramid Networks (FPN) [23] uses lateral connectivity and top-down feature fusion to construct a feature pyramid with stronger semantics. In addition, Path Aggregation Network (PAN) [24] adds bottom-up enhancement based on FPN to improve the information flow. EfficientDet [25] repeats the bidirectional path multiple times to facilitate higher-level feature fusion. In addition to manually designing the network, NAS-FPN [26] attempts to find stronger feature pyramid structures with the help of neural structure search.
2.3 Current Mainstream Small Object Detection Model
Presently, numerous mainstream small object detection models exist. Wang et al. [27] proposed M-CenterNet, which was an improvement on CenterNet. Instead of predicting a single central point, M-CenterNet predicts four central points, enhancing the model’s accuracy in pinpointing small objects and improving detection accuracy. Li et al. [28] proposed TridentNet, emphasizing the impact of receptive fields on small objects. TridentNet suggested that smaller receptive fields are more suitable for detecting these objects and employs a multi-scale detection framework to balance them with objects of other sizes. Most current object detection models use rectangular bounding boxes to represent objects across various recognition stages like anchors, proposals, and final predictions. While convenient, these boxes only offer initial object positioning, resulting in rough feature extraction. To address this, Yang et al. [29] proposed RepPoints. RepPoints uses a set of points for object localization, employing adaptive to position these points accurately. This approach limits the spatial scope of the object, highlighting semantically important areas and providing a more refined positioning method. Hong et al. [30] proposed SSPNet (Scale Selection Pyramid Network) to enhance the representation of small objects in FPN by employing a scale enhancement module and scale selection module. The former ensures that the model focuses on objects of different scales throughout each layer to prevent the small objects from being overwhelmed by the large number of backgrounds, while the latter facilitates feature sharing between adjacent layers in FPN, ensuring gradient consistency. Lu et al. [31] proposed AF-SSD (Attention and Feature-fusion SSD), which enhances the detection ability for small objects by fusing shallow and deep feature information through a multi-layer feature fusion structure.
In this section, we elucidate the proposed method and delve into the implementation details of each module.
3.1 General Structure of the Model
We use YOLOX-S as the baseline model and propose an improved model, named CAW-YOLO, for small objects in remote sensing. The overall structure of the model is shown in Fig. 1, illustrating the data flow with arrows. The whole model is comprised of the Backbone, Neck and Head. The Backbone plays the role of extracting image features. Considering that small object features are easily affected by background noise in the process of feature extraction, CAW-YOLO adds Bi-Level Routing Attention (BRA) to the last layer of Backbone, so that the model can filter background noise in the process of feature extraction. The BRA module is based on sparse sampling rather than down-sampling, it can retain the fine-grained detail information on the one hand, and achieve the purpose of saving the computation quantity on the other hand as well. The retention of fine-grained features in the network can improve the model’s ability to discriminate small objects. In order to enhance the model’s ability of multi-scale perception, especially for small-scale objects, we propose WMFASPP instead of SPP [32] in YOLOX-S, which enhances the model’s multi-scale perception ability through dynamic weighting. In the Neck, we adopt the cross-layer fusion method, fusing feature maps d2, d3 and d4 through the Cross-layer Attention Fusion Module. Finally, the detection results are processed in the Head. To be clear here, although BRA has a good ability to optimize the model, it also has a negative impact, that is, excessive use of BRA in the model will introduce too many parameters, affecting the detection speed of the model. For an object detection model for industrial applications, its real-time performance must be ensured, as a result, only one BRA is used in order to avoid introducing too many parameters.

Figure 1: Overall architecture of CAW-YOLO
3.2 Cross-Layer Attention Fusion Module
In the task of object detection, the shallow features of the network have a smaller receptive field, and the extracted features are more similar to the input, including more fine-grained features such as color, texture, corners and edges, which are more conducive to the network’s localization of small objects. While the deep features of the network, after multi-layer convolution operations, contain more abstract semantic information, in which the detailed features of small objects are almost eliminated, which is the reason why many object detection models have poor performance for small object detection. Addressing this, the improved model performs cross-layer feature fusion in YOLOX-S’s Neck. We propose a Cross-layer Attention Fusion Module (CAFM) to fuse shallow features with deep features, and use the attention mechanism to reduce the redundancy of feature fusion.
Before introducing the entire CAFM in detail, it is necessary to introduce the attention module used in CAFM: MSCA-CBAM in detail. The main function of MSCA-CBAM in CAFM is to filter useless features and reduce feature information redundancy during feature fusion. The structure of CBAM will be introduced below, and its defects will be analyzed. Finally, how MSCA-CBAM is improved from CBAM will be introduced.
CBAM is comprised of a Channel Attention Module (CAM) and a Spatial Attention Module (SAM), which are cascaded together. The CAM utilizes max-pooling and average-pooling to respectively compress the input features
Here,
The feature mapping
Here,
While CBAM proves efficient as an attention module, it has still some drawbacks. Firstly, the use of global average-pooling in the CAM for feature compression can lead to some amount of missing feature information. Secondly, it demands more computing resources, increasing computational complexity. The work [33] proposed the Multi-Spectral Channel Attention Module (MSCAM), which proves that the global average-pooling used by CAM in calculating channel attention is essentially the zero-frequency pooling of the Discrete Cosine Transform (DCT) from the frequency perspective. However, this obviously ignores other useful frequency components. Although maximum pooling is also utilized in CAM to supplement the frequency information, this is still not an optimal solution. Based on the work [33], the CBAM is improved by utilizing 2D DCT instead of global average-pooling in CAM, which introduces frequency information into the attention process, includes more useful frequency information during feature compression. This avoids missing feature information attributed to global average pooling, allowing the network to better filter noise during feature extraction. The improved CBAM is referred to as MSCA-CBAM, and its structure is shown in Fig. 2.

Figure 2: Structure of MSCA-CBAM
Instead of global average pooling, 2D DCT is utilized as follows: the feature map is divided into multiple parts according to the number of channels, and each undergoes 2D DCT calculation using different frequency components, including the zero-frequency component (i.e., global average pooling), thereby compressing more frequency information. As shown in Fig. 2,
Here, Eq. (4) is the basis function of 2D DCT. In Eq. (3),
3.2.2 The Structure of the Cross-Layer Attention Fusion Module
The implementation process of the cross-layer attention fusion module will be described in detail below, including the selection of required fusion features and the selection of fusion methods.
As shown in Fig. 3, the output features of layers d2, d3, and d4 in the Backbone are utilized for cross-layer feature fusion. This involves combining shallow features with deep features using the three output features p1, p2, and p3 of the PAN in the Neck. In contrast to the conventional cross-layer fusion, this approach directly fuses Backbone features with PAN output features, avoiding additional processing by the FPN and the PAN. Compared with the latter, by directly fusing with the output features of PAN, the number of parameters of the model can be minimally increased while fusing the deep and shallow features to avoid overfitting the network; secondly, in the backbone part of the network, since the features are only less processed, there are more fine-grained features of the retained small objects, which will inevitably result in the loss of the fine-grained features of the small objects if they are fused in the FPN and the PAN and undergo too much processing.

Figure 3: Cross-layer fusion network structure
The structure of CAFM is shown in Fig. 4a. Here,

Figure 4: Structure of CAFM. (a) Overall structure of CAFM; (b) SPD layer; (c) Overall structure of dynamic convolution
3.3 Weighted Multi-Receptive Field WMFASPP
Spatial Pyramid Pooling (SPP) is utilized in the Backbone of YOLOX-S, which aims at extracting spatial feature information at different scales of the receptive field, and improving the robustness of the model to spatial layout and object variability. Chen et al. [36] proposed Atrous Spatial Pyramid Pooling (ASPP). ASPP fundamentally differs from SPP by eschewing pooling operations and employing a series of dilation convolutions with varying dilation rates to create a pooling pyramid. This approach offers distinct advantages: compared to pooling operations, downsampling with dilated convolutions acquires feature maps with diverse receptive fields while preserving fine-grained image features crucial for small object detection. Based on the above theories, we propose the Weighted Multi-receptive Field Atrous Spatial Pyramid Pooling (WMFASPP), Its structure is shown in Fig. 4.
WMFASPP constructs feature maps with different receptive fields through ordinary convolution and dilated convolution. The dilation rates of dilated convolutions are set at 2, 3, 4, and 5, corresponding to receptive field sizes of 1 × 1, 3 × 3, 7 × 7, 9 × 9, and 11 × 11, respectively. The smaller receptive fields ensure the network captures features of small objects, while the multi-scale receptive fields empower the network to gather information across various scales. Leveraging dilated convolution ensures the retention of fine-grained features during downsampling, preserving detailed image information and enhancing small-scale object detection. To adaptively learn the importance of different receptive field feature maps, a weighted fusion concept is employed. Different weights are multiplied with distinct receptive field feature maps before the splicing operation. Moreover, regarding the generation of weights, instead of taking the traditional way of generating compressed feature maps using global average pooling, the 2D DCT mentioned in the previous section is utilized. As shown in Fig. 5, the input feature map of WMFASPP undergoes 2D DCT compression, followed by feature extraction via a fully connected two-layer structure. Finally, the Sigmoid function activate to yield the 6 feature map weights
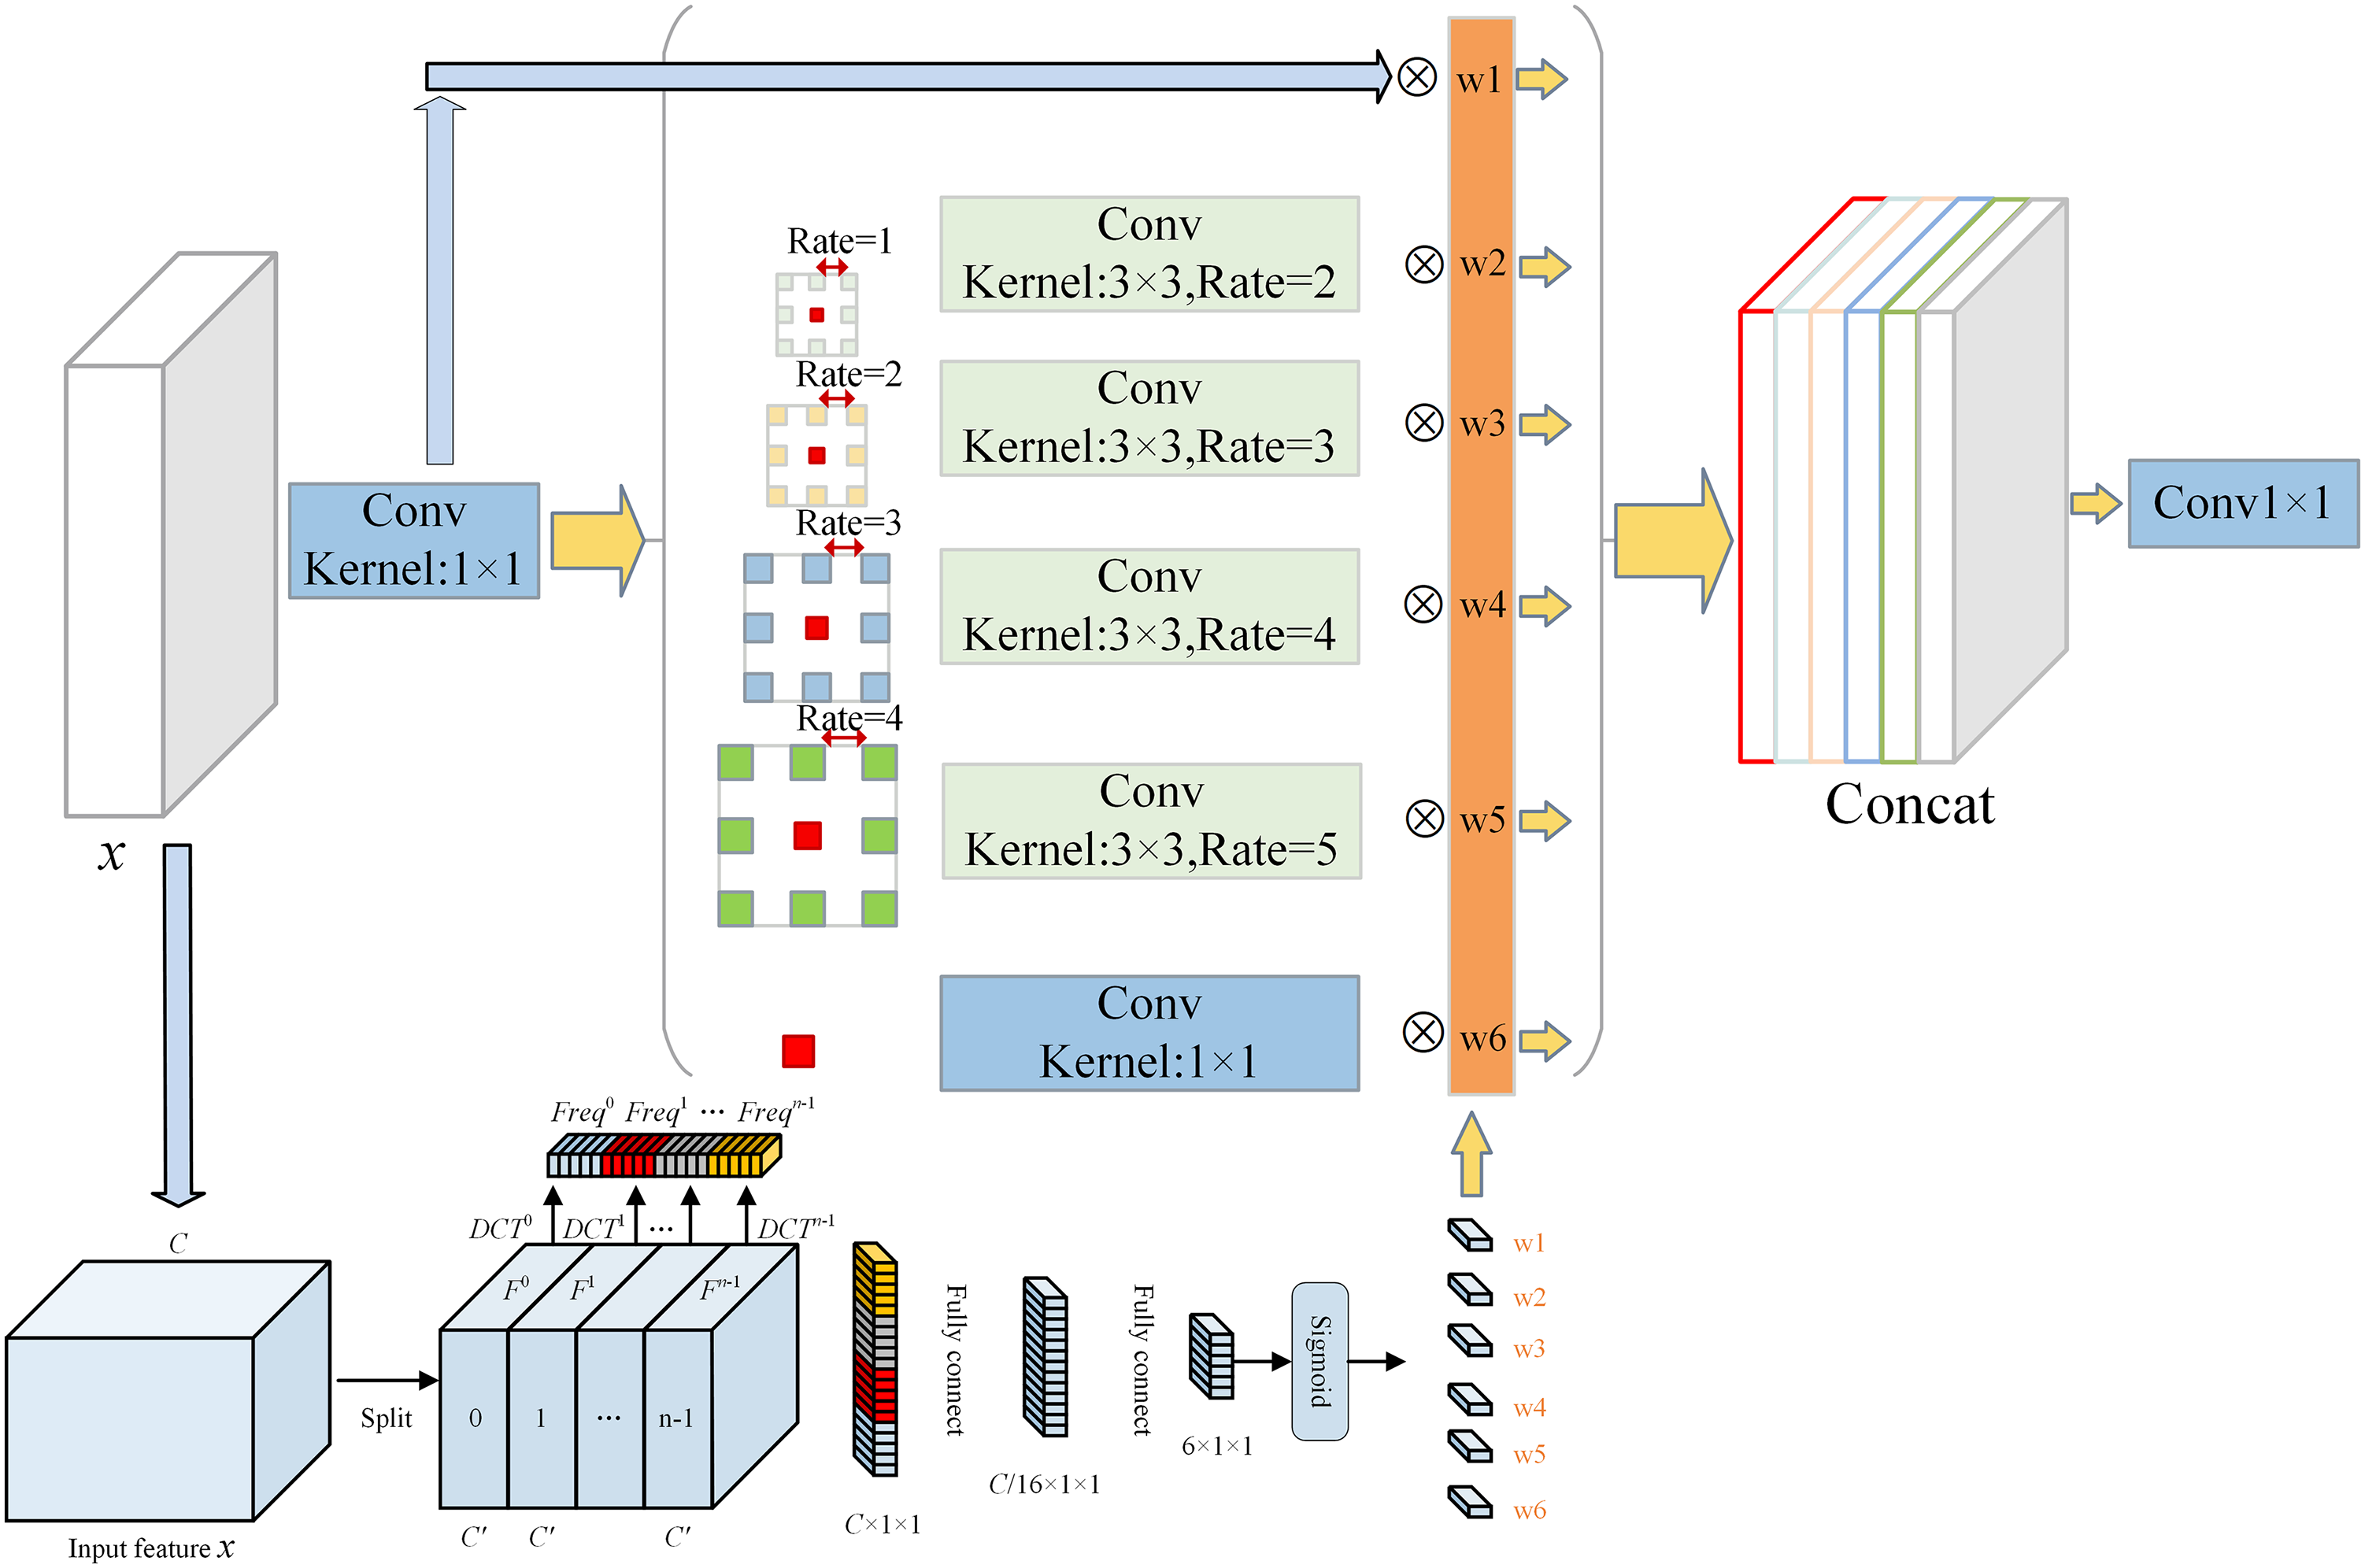
Figure 5: Overall structure of WMFASPP
3.4 Joint Box Regression Loss of NWD and EIoU
To mitigate the susceptibility of small objects to bounding box perturbations, Wang et al. [21] proposed a novel metric utilizing the Wasserstein distance to assess small objects, which better reflects the distance between distributions even if there is no overlap between them. Compared with IoU, this metric has better properties in measuring the similarity between small objects. The Normalized Wasserstein Distance is a distance metric that measures the distance between probability distributions using the Wasserstein distance derived from optimal transportation theory. When comparing two 2D Gaussian distributions represented by
The equation can be simplified as:
Here,
Normalizing it results in NWD:
Here,
Recognizing that relying solely on NWD as a distance metric for object and prediction boxes might impede model convergence, both EIoU and NWD are employed as the distance metrics in this paper. Their collective loss is the joint loss of EIoU and NWD, computed as:
Here, EIoU is calculated as:
Here,
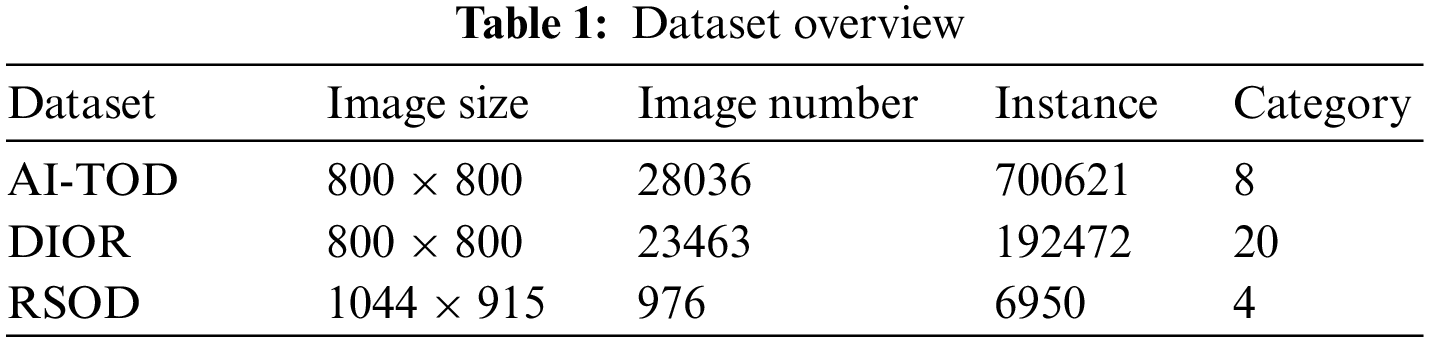
Currently, there are many datasets used in the field of remote sensing object detection. However, in most of datasets, the number of large objects is much larger than that of small objects; at the same time, some small object annotations have poor quality and may contain errors. In recent years, numerous datasets proposed for remote sensing small objects, such as DOTA [37], NWPUVHR-10 [38], UCAS_AOD [39], DIOR [40], RSOD [41], and AI-TOD [27]. Considering the number of categories and the richness of small objects in the dataset, we choose to utilize AI-TOD, DIOR, and RSOD as the experimental dataset.
DIOR is a large-scale dataset for optical remote sensing detection containing such as high-speed service areas, high-speed toll booths, airplanes, airports, baseball stadiums, basketball courts, bridges, chimneys, dams, golf courses, athletic stadiums, harbors, overpasses, boats, stadiums, storage tanks, tennis courts, train stations, vehicles, and windmills in total 20 categories. The dataset has a total of 23463 images and 192472 instances, out of which 5862 will be used as a train set, 5863 as a validation set, and 11738 as a test set. RSOD is an open remote sensing dataset including 4 categories of airplanes, fuel tanks, playgrounds, and overpasses. The dataset has a total of 976 images and 6950 instances, which are randomly divided into a train set and a test set according to the ratio of 8:2. AI-TOD is a newer remote sensing object detection dataset, which mainly focuses on the small objects, including airplane bridge storage-tank ship swimming-pool vehicle person AI-TOD is a newer remote sensing object detection dataset, which mainly focuses on small objects, including airplanes, bridges, storage-tanks, ships, swimming-pools, vehicles, persons, and wind-mills, with 8 categories and a total of 28,036 images, of which 14,018 are used as a train set, and 14,018 as a test set (such as PASCAL VOC (156.6 pixels), MS COCO (99.5 pixels) or DOTA (55.3 pixels)). The details of the three datasets are summarized in Table 1.
In order to prove the reliability of the dataset used for the experiment, the aspect ratio of the object boxes in the dataset was counted as shown in Fig. 6. There are a large number of small objects in all three data mentioned in the experiment, which meets the experimental requirements of remote sensing small objects.

Figure 6: Aspect ratio of the object box in the datasets. (a) aspect ratio of the object box in AI-TOD; (b) aspect ratio of the object box in DIOR; (c) aspect ratio of the object box in RSOD
In our experiment, the hardware configuration for model training and performance evaluation is Intel Core i7-12700KF (3.60 GHz), with 32 GB of RAM, GPU model NVIDIA RTX A4000, and 16 GB of video memory; the software environment is Windows 10, Python 3.8, PyTorch 1.9, and CUDA framework for parallel acceleration. Parallel accelerated computing, CUDA version 11.0. In order to have a fair comparison of the model performance, the Adam optimizer is used uniformly in the experiments, the momentum size is set to 0.937, the learning rate adopts the cosine annealing algorithm, the initial learning rate is 1e−3, the minimum learning rate is 0.01 times of the initial learning rate, the batch size and the epoch is set to 16 and 300, respectively.
In the object detection task, the commonly used evaluation metrics are Average Precision (AP), detection speed FPS (Frames Per Second) and the amount of model parameters (Params). The AP is a comprehensive metric in the task of object detection. For the detection of multi-category objects, the AP usually denotes mean average precision (mAP) which is obtained by the average of different category APs. But, in order to specifically show the detection effect of the proposed model for small objects. we adopts the same evaluation metrics as in the work [27] in the comparison experiments for the AI-TOD dataset. This is a more stringent COCO metric, which includes AP, AP0.5, AP0.75, APvt, APt, APs, APm and APl. AP denotes the AP with IoU = 0.50:0.05:0.95 (the average of the values on the IOU thresholds), and AP0.5 denotes the AP with IOU = 0.50 (equally to mAP in PASCAL VOC metric, is the metric that can best represent the comprehensive performance of the detection model). AP0.75 denotes APs with IOU = 0.75 (a very strict metric). APs denotes AP for small objects with areas less than 322 and greater than 162. APm denotes AP for medium-sized objects with areas between 322 and 962. APl denotes AP for large objects with areas greater than 962. In addition, APvt and APt are very tiny and tiny objects, corresponding to areas ranging from greater than 22 less than 82 and greater than 82 less than 162, respectively.
4.4 Experimental Results and Analysis
In this section, the effectiveness of the proposed method is evaluated and analyzed, utilizing YOLOX-S as the baseline network. It is worth mentioning that all three datasets were utilized in a set of comparative experiments in this chapter, and the AI-TOD dataset was utilized in the subsequent improved module comparisons
In order to prove the superiority of the proposed model over the current mainstream object detection models and its generalizability among different datasets, comparisons are made with multiple models on the AI-TOD dataset, the RSOD dataset and the DIOR dataset, respectively, and the comparison results are shown in Tables 2 and 3.
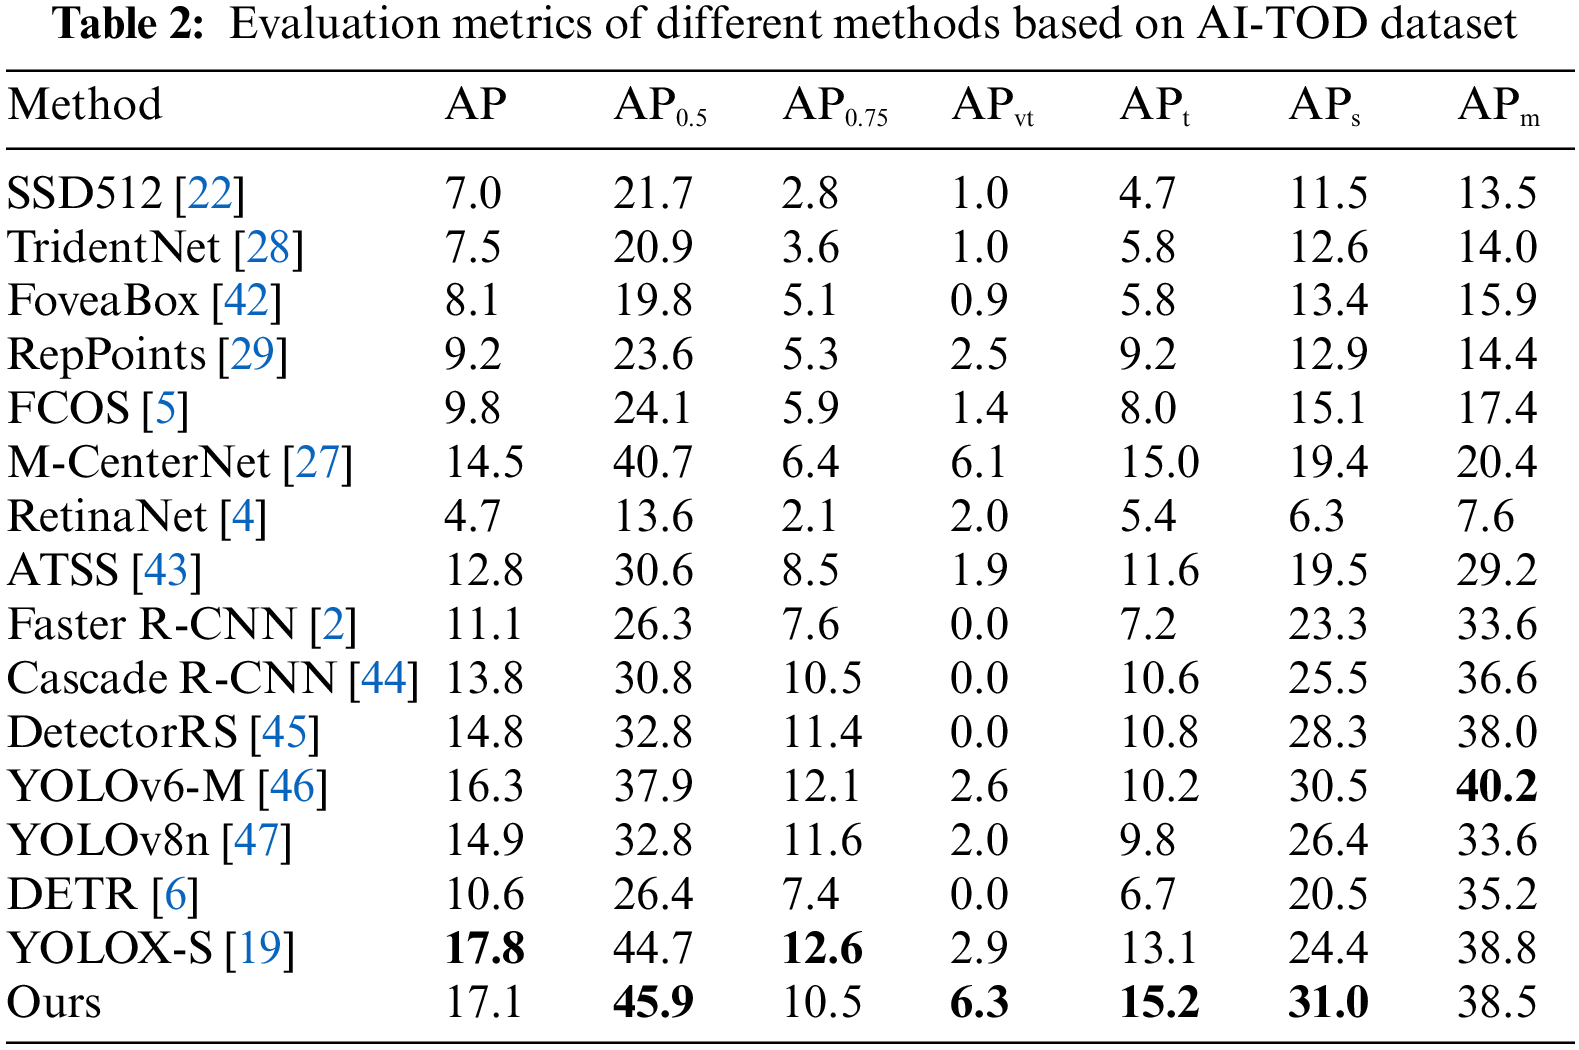
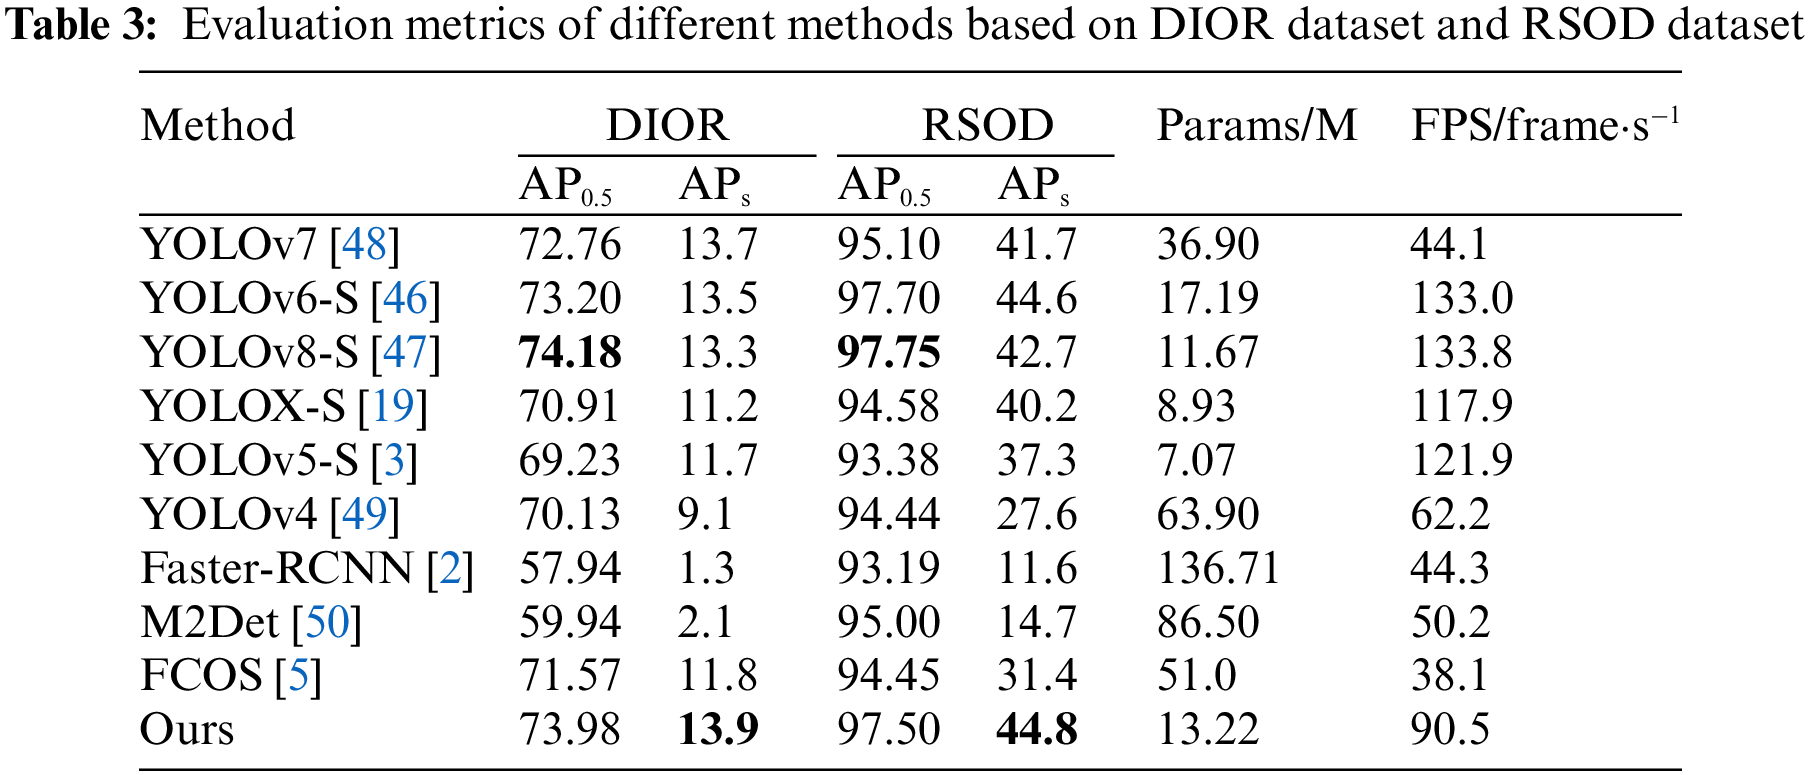
The results of the comparison experiments for the AI-TOD dataset are shown in Table 2. Even the current state-of-the-art detection model’s APvt tends to be close to 0 (which indicates that it is difficult to detect tiny objects with area sizes of 22~82), while the APvt value of the proposed model in this paper reaches 6.3%. Compared with YOLOv8n, YOLOv6-M, M-CenterNet, YOLOX-S, DETR, and Faster R-CNN, the APvt values of the model in this paper are 4.3%, 3.7%, 0.2%, 3.4%, 6.3%, and 6.3% higher, respectively. In addition, the AP0.5 and APt values of the proposed model are the highest, which indicates that the proposed model has the best detection performance for small objects compared to the other models. It is worth mentioning that many metrics of the model in this paper have reached the highest in Table 2, but the values of AP and APm are not the highest. Because, for objects of different scales, it is a problem to keep the AP of small objects rising while the AP of large objects is also rising. And, the model proposed in this paper, on the basis of YOLOX-S, strengthens the attention to small objects, it is inevitable that the model’s attention to medium and large objects will decline. This is also the reason why the APm of the model proposed in this paper is smaller than that of YOLOX-S, and also causes the AP metric of the model proposed in this paper to be slightly inferior to that of YOLOX-S. However, from a global perspective, the APvt, APt and APs metrics of the model proposed in this paper have been greatly improved compared with YOLOX-S, while the AP metric has only decreased by 0.7%. It is very cost-effective to reduce the AP metric or exchange for a large improvement in the accuracy of small objects. In the comparison experiments on the RSOD and DIOR datasets, the results are shown in Table 3, the proposed model outperforms the current mainstream object detection models in the comparison of each metric. The APs reach 13.9% and AP0.5 reaches 73.98% on the DIOR dataset, while the APs reach 44.8% and AP0.5 reaches 97.50% on the RSOD dataset.
In order to explore the difference between the proposed detection model in terms of parameter amount and detection speed with respect to the current mainstream object detection model, parameter amount and detection speed are compared between the current mainstream detection models and the proposed model, and the comparison results are shown in Table 3. The parameter amount of the detection model proposed in this paper is only 13.22 M, and the detection speed can reach 90.5 frame·s−1. The parameter amount is only 4.29 M higher than the baseline model YOLOX-S, and the detection speed is up to 90.5 frame·s−1 to meet the requirement of real-time detection. In addition, compared with the other models in the table, the parameter amount of the proposed model is only larger than that of YOLOX-S, YOLOv8-S and YOLOv5-S, and the number of parameters of the rest of the models is larger than that of the model in this paper. Finally, it should be noted that with the increase of modules, the detection speed and parameter number of the model will be affected to a certain extent, but at the cost of a small number of parameters and detection speed, improving the detection accuracy of small objects is cost-effective, which is not inferior to the current mainstream detectors (YOLOv8, etc.).
In order to directly reflect the detection ability of the improved model on remote sensing small objects, the detection effect is compared using the BASELINE, the proposed model, YOLOv8-S and YOLOv7, and the detection effect is shown in Fig. 7. Compared with the other three current mainstream models in the detection of remote sensing small objects in the process of a large number of leakage detection, the improved model has greatly improved this situation. This proves that the model structure proposed in this paper plays an important role in the detection process of small objects.

Figure 7: The detection effect is compared with the BASELINE, the proposed model, YOLOv8-S, and YOLOv7. (a) The detection effect of the proposed model; (b) The detection effect of YOLOv8-S; (c) The detection effect of YOLOv7; (d) The detection effect of baseline
In order to verify the effectiveness of each improvement method proposed in this paper, a set of ablation experiments were designed on the AI-TOD dataset, and the results of the experiments are shown in Table 4. A “√” indicates that the method was added. All the methods proposed in this paper improve the model AP0.5 by a total of 1.2%, APt by 2.1% and APvt by 3.4%. It illustrates that the model’s detection ability for remote sensing objects, especially small objects, can be significantly improved when all the improved methods are utilized. In addition, after utilizing all the methods, the number of parameters only increases by 4.29 M compared with the original model, and the FPS only decreases by 27.4 frame·s−1, which only uses less overhead in exchange for a larger improvement.
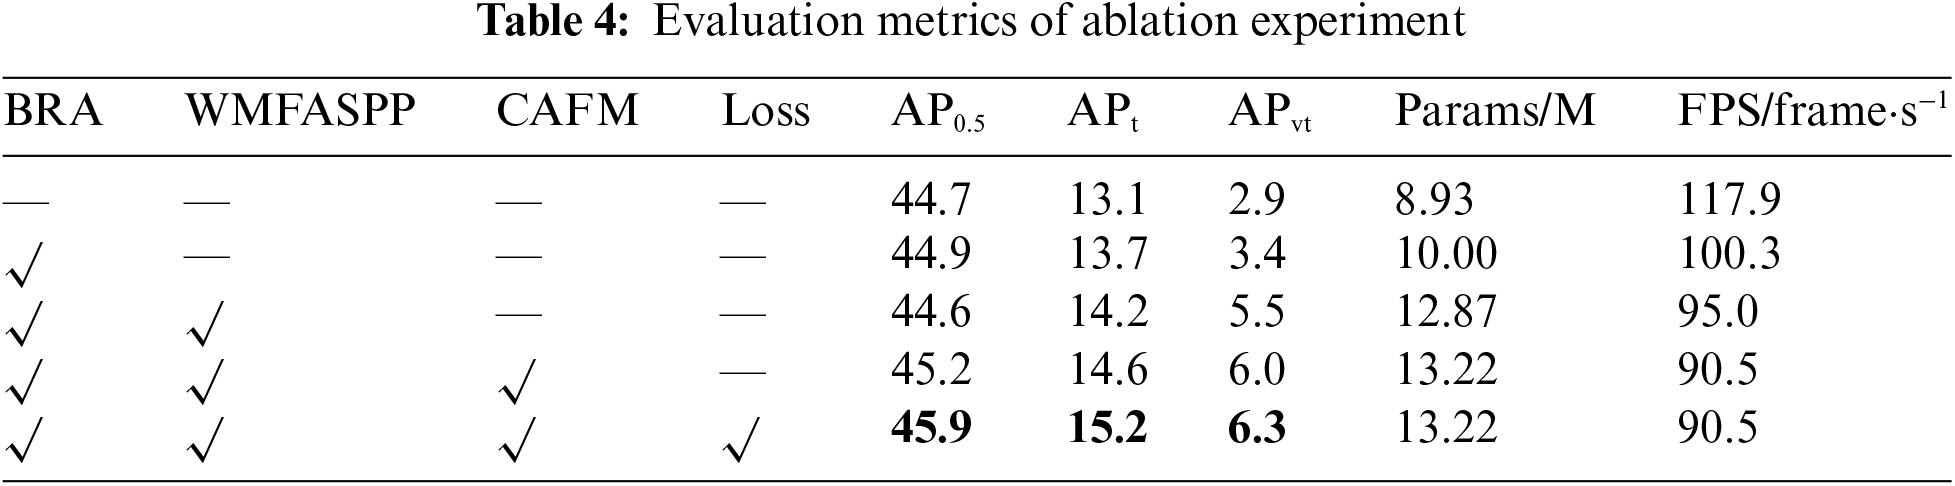
From the overall point of view, the improved model in this paper has some advantages in improving both AP0.5 and APs. At the same time, due to the addition of each improvement method, the complexity of the model will inevitably be enhanced, and it will be slightly inferior to the original model in terms of the number of parameters and detection speed. However, the small increase in the number of parameters and detection speed does not affect the lightweight and real-time performance of the model, and it is very cost-effective to exchange a small amount of overhead for the improvement of detection accuracy.
4.4.3 Experimental Analysis of MSCA-CBAM
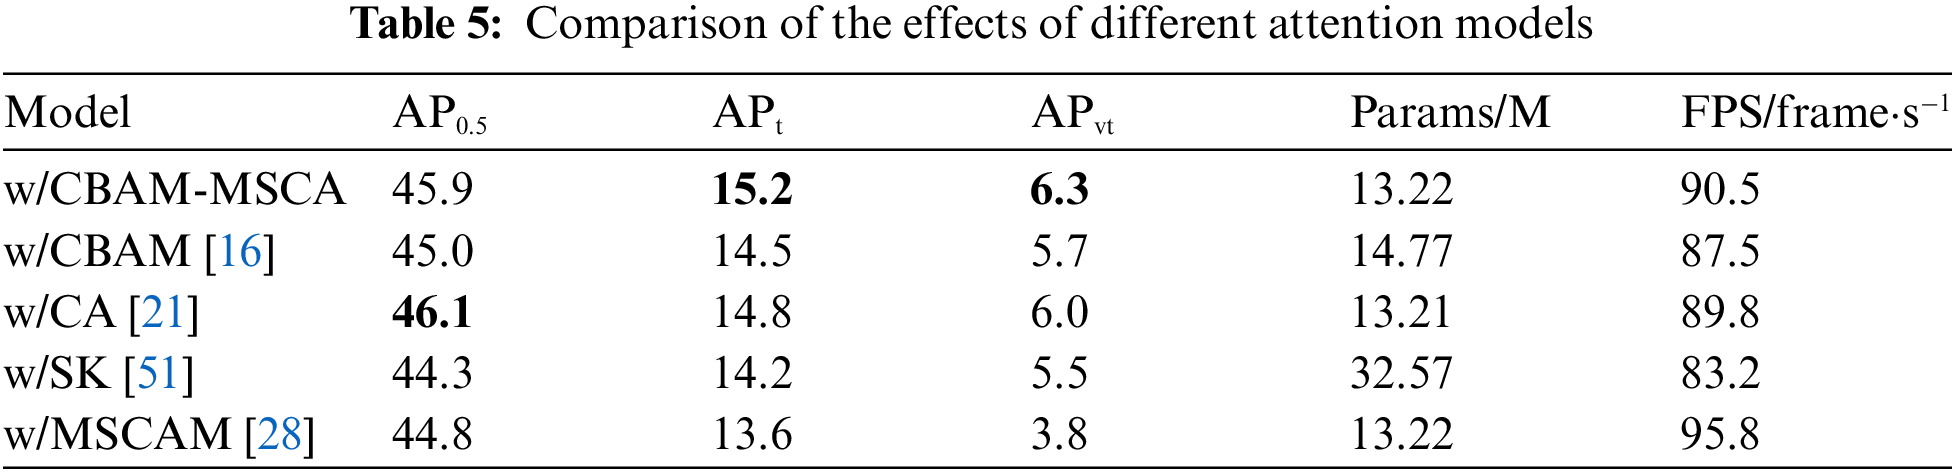
To further validate the effectiveness of MSCA-CBAM, a set of side-by-side comparison experiments of attention modules are done in this paper, replacing MSCA-CBAM with CBAM, CA, SK and MSCAM attention modules respectively on the basis of the model proposed in this paper on the AI-TOD dataset, and the experimental results are shown in Table 5. As can be seen from Table 5, the different attention modules all bring different changes in performance, while the model utilizing MSCA-CBAM achieves the highest in terms of detection accuracy. In terms of the number of model parameters, the addition of MSCA-CBAM only results in a model parameter of 13.22 M, which is only 0.01 M higher than that of CA and lower than that of CBAM, which is 14.77 M. This is due to the fact that pre-determined frequency components are utilized in the 2D DCT transforms, so no additional parameter number is introduced when using multi-band components for feature compression.
In order to increase the interpretability of the performance of each attention model, the effect of each attention model is visualized and analyzed on a small object remote sensing image using a heat map, and the visualization results are shown in Fig. 8. Among them, MSCA-CBAM achieves the best both in terms of heat map response strength and response tightness.

Figure 8: Heat map visualization results. (a) Original image; (b) Heat map of MSCA-CBAM; (c) Heat map of CBAM; (d) Heat map of CA; (e) Heat map result of SK; (f) Heat map of MSCAM
4.4.4 Experimental Analysis of WMFASPPF
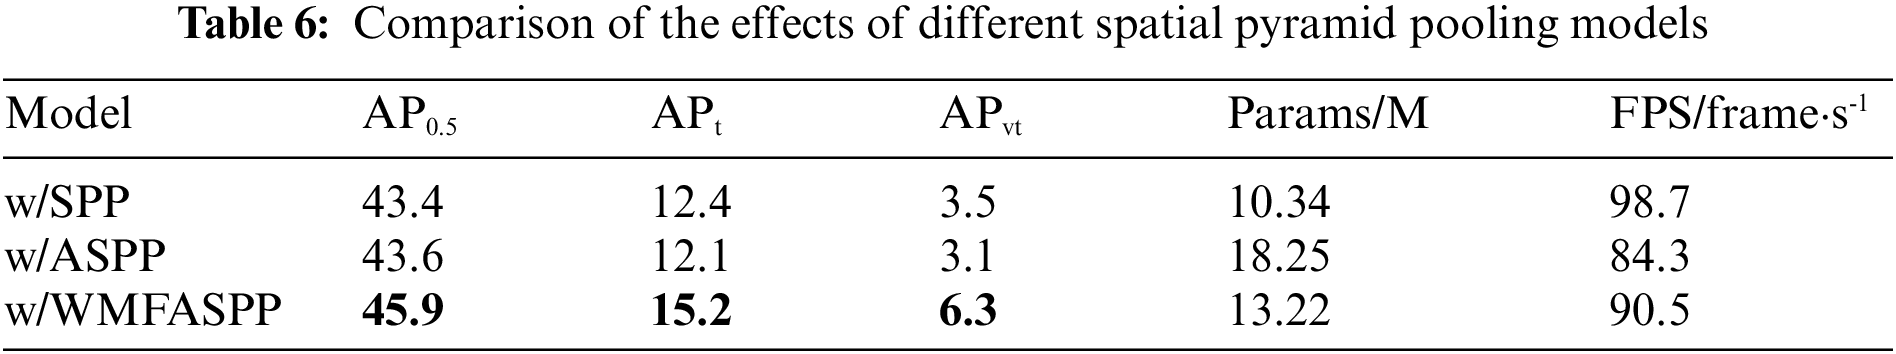
In order to explore the superiority of WMFASPP, a set of comparative experiments were conducted utilizing the models proposed in this paper with SPP, ASPP and WMFASPP, respectively, and the results are shown in Table 6. Among them, the model with WMFASPP achieves the best detection accuracy, with an improvement of 2.5% and 2.3% in AP0.5, 2.8% and 3.1% in APt, and 2.8% and 3.2% in APvt, relative to the use of SPP and the use of ASPP, respectively. Therefore, by constructing additional small receptive fields and adaptive weighting in the spatial pyramid pooling module, it can strengthen the model’s multi-scale perception ability and adaptive scale reinforcement ability, which can effectively improve the model’s accuracy for small object detection. In addition, WMFASPP has a smaller number of parameters than ASPP, for several reasons: Firstly, the 2D DCT utilized in WMFASPP does not add additional parameters. Secondly, more 1 × 1 convolution is utilized in ASPP for feature extraction, which is the main reason for the large number of ASPP parameters. Thirdly, WMFASPP initially reduces the channel by more than ASPP, which results in a lower number of convolution module parameters in the middle.
4.4.5 Experimental Analysis Box Regression Loss Function
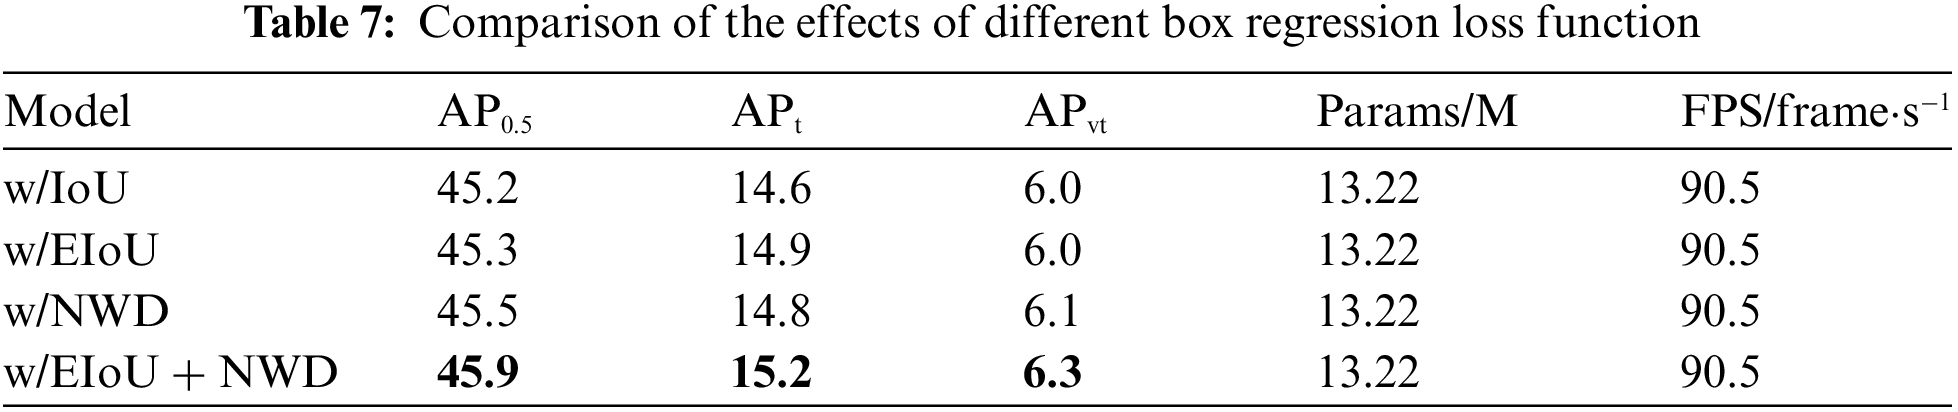
In order to investigate the effectiveness of the joint loss of EIoU and NWD, a set of cross-sectional comparison experiments of the box regression loss function are designed in this paper, utilizing the IoU loss, EIoU loss, NWD loss and the joint box regression loss in the model proposed in this paper, respectively, and the experimental results are shown in Table 7. Compared to the model utilizing IoU loss alone as the box regression loss, higher accuracy is obtained by utilizing the joint box regression loss (0.7% improvement in AP0.5, 0.6% improvement in APt, and 0.3 improvement in APvt).
4.4.6 Comparison of Cross-Layer Fusion Feature Maps
In order to demonstrate the effectiveness of CAFM proposed in this paper, feature maps will be visualized utilizing the output from the bottom layer of the cross-layer fusion model and without utilizing the cross-layer fusion model, and the results of the visualization are shown in Fig. 9 (Fig. 8a is the input image). Compared with the model without cross-layer fusion method, the object features in the detected images can be clearly observed in the output feature map of the model utilizing the CAFM proposed in this paper, and the feature response is stronger in comparison.

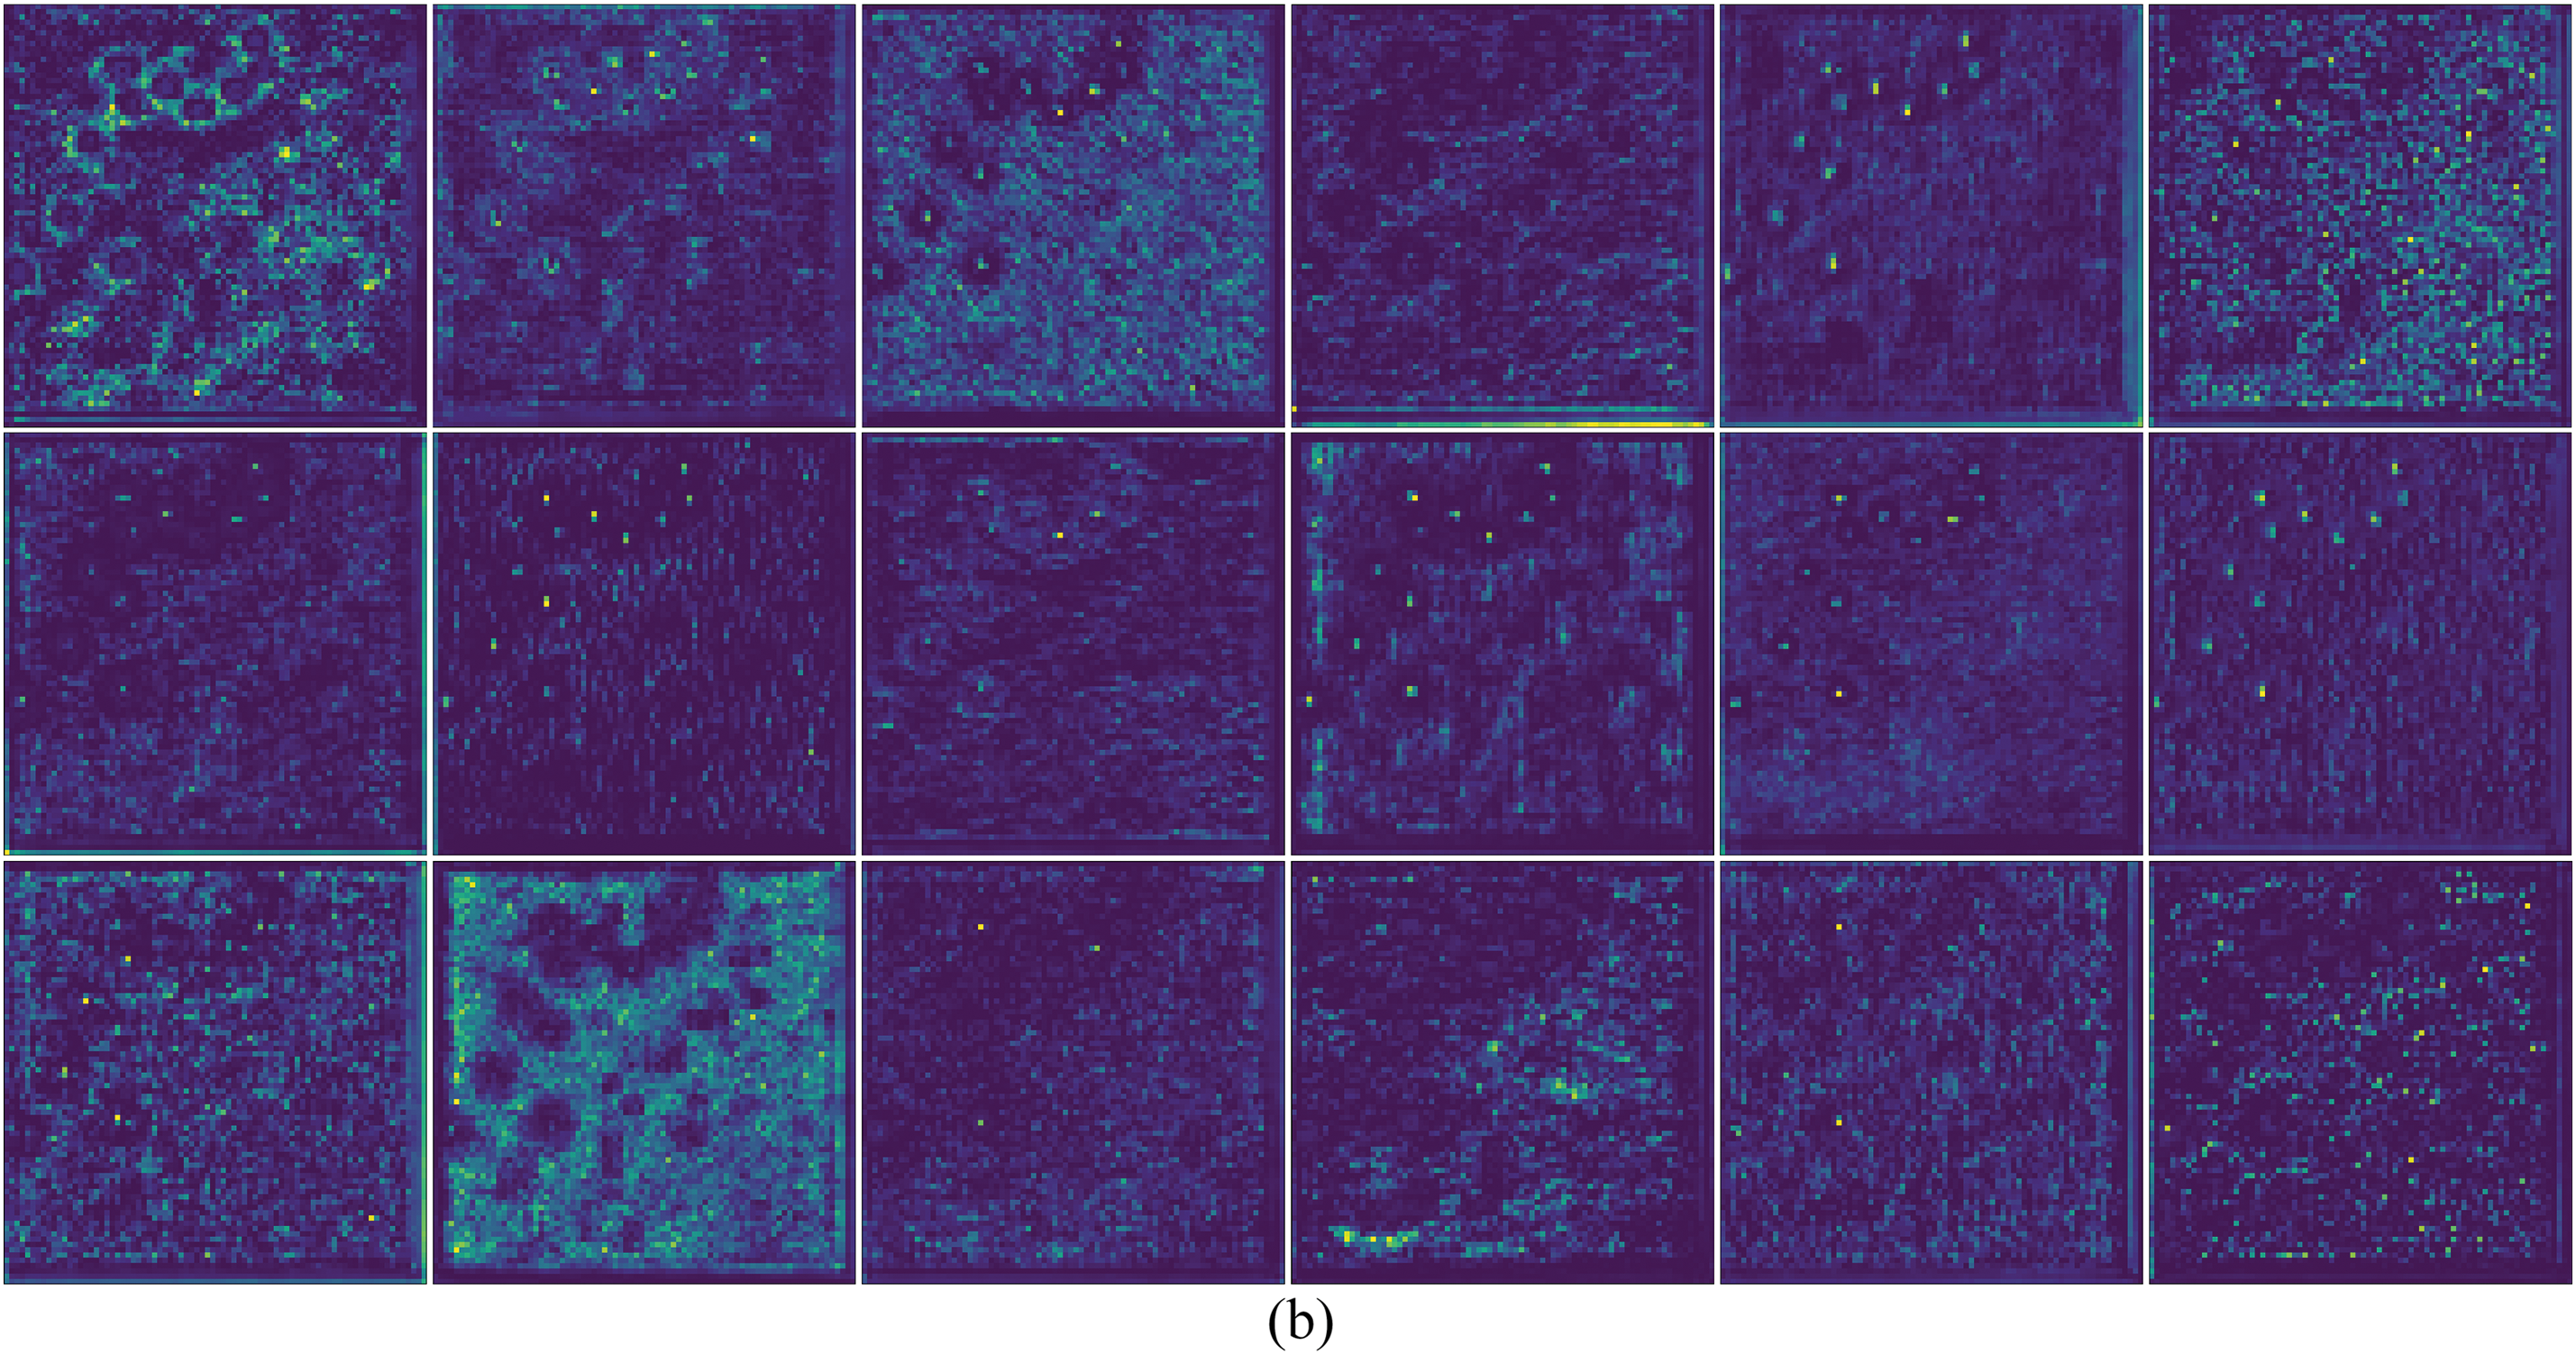
Figure 9: Feature visualization results of the bottom layer output of the models. (a) Visualization of model with cross-layer fusion; (b) Visualization of model without cross-layer fusion
Aiming at the problem that it is difficult to detect small objects in remote sensing images, this paper proposes CAW-YOLO for small objects in remote sensing by utilizing the YOLOX-S object detection model as the baseline model. It firstly incorporates BRA into the feature extraction stage of the model so that the model can filter out the background noise interfering with the detection of small objects in the feature extraction stage. A weighted multi-receptive field atrous spatial pyramid pooling module is then constructed by increasing the feature maps of small receptive field and adaptive weights to enhance the multi-scale, especially small-scale, perception capability of the module. Furthermore, a cross-layer attention fusion module is proposed, so that the model can maximize the retention of small object features, and an improved CBAM attention module is also proposed in which the CBAM attention module is improved by a 2D DCT transform, which introduces frequency information into the attention so that it can optimize the performance of CBAM attention; finally, the joint box regression loss of NWD and EIoU is utilized to cope with the sensitivity of the small object to the slight offset of the object frame. The effectiveness and generalizability of the improved model are demonstrated on three remote sensing datasets, AI-TOD, DIOR and RSOD, and on the AI-TOD dataset, which is the most difficult to detect, the APvt reached 6.3%, a 3.4% improvement over the baseline. However, due to the inclusion of the improved module, it is bound to increase a certain number of parameters and detection speed, and the future model needs to be researched in the direction of high accuracy and lightweight.
Acknowledgement: The authors wish to express their appreciation to the reviewers for their helpful suggestions which greatly improved the presentation of this paper. We are also very grateful to the editors for their patient and friendly reminders, as well as for their efforts in editing the manuscript.
Funding Statement: This work was supported in part by the National Natural Science Foundation of China under Grant 62006071, and part by the Science and Technology Research Project of Henan Province under Grant 232103810086.
Author Contributions: The authors confirm contribution to the paper as follows: study conception and design: Weiya Shi; experimental data collection, analysis and interpretation of results, and draft manuscript preparation: Shaowen Zhang; review of paper content: Shiqiang Zhang. All authors reviewed the results and approved the final version of the manuscript.
Availability of Data and Materials: Publicly available datasets were analyzed in this study. AI-TOD data set download address is: https://github.com/jwwangchn/AI-TOD; The current address of the ROSD dataset is: https://github.com/RSIA-LIESMARS-WHU/RSOD-Dataset-; DIOR download address is: http://www.escience.cn/people/gongcheng/DIOR.html.
Conflicts of Interest: The authors declare that they have no conflicts of interest to report regarding the present study.
References
1. Zou, Z., Chen, K., Shi, Z., Guo, Y., Ye, J. (2023). Object detection in 20 years: A survey. Proceedings of the IEEE, 111(3), 257–276. [Google Scholar]
2. Girshick, R. (2015). Fast R-CNN. Proceedings of the IEEE International Conference on Computer Vision, pp. 1440–1448. Santiago, Chile. [Google Scholar]
3. Ren, S., He, K., Girshick, R., Sun, J. (2017). Faster R-CNN: Towards real-time object detection with region proposal networks. IEEE Transactions on Pattern Analysis & Machine Intelligence, 39(6), 1137–1149. [Google Scholar]
4. Lin, T. Y., Goyal, P., Girshick, R., He, K., Dollár, P. (2017). Focal loss for dense object detection. Proceedings of the IEEE International Conference on Computer Vision, pp. 2980–2988. Venice, Italy. [Google Scholar]
5. Tian, Z., Shen, C., Chen, H., He, T. (2019). FCOS: Fully convolutional one-stage object detection. Proceedings of the IEEE/CVF International Conference on Computer Vision, pp. 9627–9636. Seoul, Korea (South). [Google Scholar]
6. Jocher, G. (2020). YOLOv5. https://github.com/ultralytics/yolov5 (accessed on 05/01/2023). [Google Scholar]
7. Zhu, X., Su, W., Lu, L., Li, B., Wang, X. et al. (2021). Deformable DETR: Deformable transformers for end-to-end object detection. International Conference on Learning Representations, Barcelona, Spain. [Google Scholar]
8. Wei, S., Zeng, X., Qu, Q., Wang, M., Su, H. et al. (2020). HRSID: A high-resolution SAR images dataset for ship detection and instance segmentation. IEEE Access, 8, 120234–120254. [Google Scholar]
9. Chen, Q., Wang, Y., Yang, T., Zhang, X., Cheng, J. et al. (2021). You only look one-level feature. Proceedings of the IEEE/CVF Conference on Computer Vision and Pattern Recognition, pp. 13039–13048. [Google Scholar]
10. Lin, T. Y., Maire, M., Belongie, S., Hays, J., Perona, P. et al. (2014). Microsoft COCO: Common objects in context. Computer Vision-ECCV 2014: 13th European Conference, pp. 740–755. Zurich, Switzerland. [Google Scholar]
11. Cheng, G., Yuan, X., Yao, X., Yan, K., Zeng, Q. et al. (2023). Towards large-scale small object detection: Survey and benchmarks. IEEE Transactions on Pattern Analysis and Machine Intelligence, 55(5), 1–20. [Google Scholar]
12. Bai, L., Yao, C., Ye, Z., Xue, D., Lin, X. et al. (2023). Feature enhancement pyramid and shallow feature reconstruction network for SAR ship detection. IEEE Journal of Selected Topics in Applied Earth Observations and Remote Sensing, 16, 1042–1056. [Google Scholar]
13. Huang, W., Li, G., Chen, Q., Ju, M., Qu, J. (2021). CF2PN: A cross-scale feature fusion pyramid network based remote sensing target detection. Remote Sensing, 13(5), 847. [Google Scholar]
14. Redmon, J., Divvala, S., Girshick, R., Farhadi, A. (2016). You only look once: Unified, real-time object detection. Proceedings of the IEEE Conference on Computer Vision and Pattern Recognition, pp. 779–788. Las Vegas, NV, USA. [Google Scholar]
15. Zhu, L., Wang, X., Ke, Z., Zhang, W., Lau, R. W. (2023). BiFormer: Vision transformer with bi-level routing attention. Proceedings of the IEEE/CVF Conference on Computer Vision and Pattern Recognition, pp. 10323–10333. Vancouver, Canada. [Google Scholar]
16. Woo, S., Park, J., Lee, J. Y., Kweon, I. S. (2018). Cbam: Convolutional block attention module. Proceedings of the European Conference on Computer Vision (ECCV), pp. 3–19. Munich, Germany. [Google Scholar]
17. Wang, J., Xu, C., Yang, W., Yu, L. (2021). A normalized Gaussian Wasserstein distance for tiny object detection. https://doi.org/10.48550/arXiv.2110.13389 [Google Scholar] [CrossRef]
18. Zhang, Y. F., Ren, W., Zhang, Z., Jia, Z., Wang, L. et al. (2022). Focal and efficient IOU loss for accurate bounding box regression. Neurocomputing, 506, 146–157. [Google Scholar]
19. Ge, Z., Liu, S., Wang, F., Li, Z., Sun, J. (2021). YOLOX: Exceeding yolo series in 2021. https://doi.org/10.48550/arXiv.2107.08430 [Google Scholar] [CrossRef]
20. Hu, J., Shen, L., Sun, G. (2018). Squeeze-and-excitation networks. Proceedings of the IEEE Conference on Computer Vision and Pattern Recognition, pp. 7132–7141. Salt Lake City, UT, USA. [Google Scholar]
21. Hou, Q., Zhou, D., Feng, J. (2021). Coordinate attention for efficient mobile network design. Proceedings of the IEEE/CVF Conference on Computer Vision and Pattern Recognition, pp. 13713–13722. [Google Scholar]
22. Liu, W., Anguelov, D., Erhan, D., Szegedy, C., Reed, S. et al. (2016). SSD: Single shot multibox detector. Computer Vision-ECCV 2016: 14th European Conference, pp. 21–37. Amsterdam, The Netherlands. [Google Scholar]
23. Lin, T. Y., Dollár, P., Girshick, R., He, K., Hariharan, B. et al. (2017). Feature pyramid networks for object detection. Proceedings of the IEEE Conference on Computer Vision and Pattern Recognition, pp. 2117–2125. Honolulu, HI, USA. [Google Scholar]
24. Li, H., Xiong, P., An, J., Wang, L. (2018). Pyramid attention network for semantic segmentation. https://doi.org/10.48550/arXiv.1805.10180 [Google Scholar] [CrossRef]
25. Tan, M., Pang, R., Le, Q. V. (2020). EfficientDet: Scalable and efficient object detection. Proceedings of the IEEE/CVF Conference on Computer Vision and Pattern Recognition, pp. 10781–10790. Seattle, WA, USA. [Google Scholar]
26. Ghiasi, G., Lin, T. Y., Le, Q. V. (2019). NAS-FPN: Learning scalable feature pyramid architecture for object detection. Proceedings of the IEEE/CVF Conference on Computer Vision and Pattern Recognition, pp. 7036–7045. Beach, CA, USA. [Google Scholar]
27. Wang, J., Yang, W., Guo, H., Zhang, R., Xia, G. S. (2021). Tiny object detection in aerial images. International Conference on Pattern Recognition (ICPR), pp. 3791–3798. Milan, Italy. [Google Scholar]
28. Li, Y., Chen, Y., Wang, N., Zhang, Z. (2019). Scale-aware trident networks for object detection. Proceedings of the IEEE/CVF International Conference on Computer Vision, pp. 6054–6063. Seoul, Korea (South). [Google Scholar]
29. Yang, Z., Liu, S., Hu, H., Wang, L., Lin, S. (2019). RepPoints: Point set representation for object detection. Proceedings of the IEEE/CVF International Conference on Computer Vision, pp. 9657–9666. Seoul, Korea (South). [Google Scholar]
30. Hong, M., Li, S., Yang, Y., Zhu, F., Zhao, Q. et al. (2021). SSPNet: Scale selection pyramid network for tiny person detection from UAV images. IEEE Geoscience and Remote Sensing Letters, 19, 1–5. [Google Scholar]
31. Lu, X., Ji, J., Xing, Z., Miao, Q. (2021). Attention and feature fusion SSD for remote sensing object detection. IEEE Transactions on Instrumentation and Measurement, 70, 1–9. [Google Scholar]
32. He, K., Zhang, X., Ren, S., Sun, J. (2015). Spatial pyramid pooling in deep convolutional networks for visual recognition. IEEE Transactions on Pattern Analysis and Machine Intelligence, 37(9), 1904–1916. [Google Scholar] [PubMed]
33. Qin, Z., Zhang, P., Wu, F., Li, X. (2021). FcaNet: Frequency channel attention networks. Proceedings of the IEEE/CVF International Conference on Computer Vision, pp. 783–792. Montreal, Canada. [Google Scholar]
34. Sunkara, R., Luo, T. (2022). No more strided convolutions or pooling: A new CNN building block for low-resolution images and small objects. Joint European Conference on Machine Learning and Knowledge Discovery in Databases, pp. 443–459. Grenoble, France. [Google Scholar]
35. Chen, Y., Dai, X., Liu, M., Chen, D., Yuan, L. et al. (2020). Dynamic convolution: Attention over convolution kernels. Proceedings of the IEEE/CVF Conference on Computer Vision and Pattern Recognition, pp. 11030–11039. Seattle, USA. [Google Scholar]
36. Chen, L. C., Papandreou, G., Schroff, F., Adam, H. (2017). Rethinking atrous convolution for semantic image segmentation. https://doi.org/10.48550/arXiv.1706.05587 [Google Scholar] [CrossRef]
37. Xia, G. S., Bai, X., Ding, J., Zhu, Z., Belongie, S. et al. (2018). DOTA: A large-scale dataset for object detection in aerial images. Proceedings of the IEEE Conference on Computer Vision and Pattern Recognition, pp. 3974–3983. Salt Lake City, UT, USA. [Google Scholar]
38. Cheng, G., Han, J., Zhou, P., Guo, L. (2014). Multi-class geospatial object detection and geographic image classification based on collection of part detectors. ISPRS Journal of Photogrammetry and Remote Sensing, 98(98), 119–132. [Google Scholar]
39. Zhu, H., Chen, X., Dai, W., Fu, K., Ye, Q. et al. (2015). Orientation robust object detection in aerial images using deep convolutional neural network. 2015 IEEE International Conference on Image Processing, pp. 3735–3739. Quebec, Canada. [Google Scholar]
40. Li, K., Wan, G., Cheng, G., Meng, L., Han, J. (2020). Object detection in optical remote sensing images: A survey and a new benchmark. ISPRS Journal of Photogrammetry and Remote Sensing, 159(11), 296–307. [Google Scholar]
41. Long, Y., Gong, Y., Xiao, Z., Liu, Q. (2017). Accurate object localization in remote sensing images based on convolutional neural networks. IEEE Transactions on Geoscience and Remote Sensing, 55(5), 2486–2498. [Google Scholar]
42. Kong, T., Sun, F., Liu, H., Jiang, Y., Li, L. et al. (2020). FoveaBox: Beyound anchor-based object detection. IEEE Transactions on Image Processing, 29, 7389–7398. [Google Scholar]
43. Zhang, S., Chi, C., Yao, Y., Lei, Z., Li, S. Z. (2020). Bridging the gap between anchor-based and anchor-free detection via adaptive training sample selection. Proceedings of the IEEE/CVF Conference on Computer Vision and Pattern Recognition, pp. 9759–9768. Seattle, WA, USA. [Google Scholar]
44. Cai, Z., Vasconcelos, N. (2018). Cascade R-CNN: Delving into high quality object detection. Proceedings of the IEEE Conference on Computer Vision and Pattern Recognition, pp. 6154–6162. Salt Lake City, UT, USA. [Google Scholar]
45. Qiao, S., Chen, L. C., Yuille, A. (2021). Detectors: Detecting objects with recursive feature pyramid and switchable atrous convolution. Proceedings of the IEEE/CVF Conference on Computer Vision and Pattern Recognition, pp. 10213–10224. [Google Scholar]
46. Li, C., Li, L., Jiang, H., Weng, K., Geng, Y. et al. (2022). YOLOv6: A single-stage object detection framework for industrial applications. https://doi.org/10.48550/arXiv.2209.02976 [Google Scholar] [CrossRef]
47. Jocher, G. (2023). YOLOv8. https://github.com/ultralytics/ultralytics (accessed on 05/01/2023). [Google Scholar]
48. Wang, C. Y., Bochkovskiy, A., Liao, H. Y. M. (2023). YOLOv7: Trainable bag-of-freebies sets new state-of-the-art for real-time object detectors. Proceedings of the IEEE/CVF Conference on Computer Vision and Pattern Recognition, pp. 7464–7475. Vancouver, Canada. [Google Scholar]
49. Bochkovskiy, A., Wang, C. Y., Liao, H. Y. M. (2020). YOLOv4: Optimal speed and accuracy of object detection. https://doi.org/10.48550/arXiv.2004.10934 [Google Scholar] [CrossRef]
50. Zhao, Q., Sheng, T., Wang, Y., Tang, Z., Chen, Y. et al. (2019). M2Det: A single-shot object detector based on multi-level feature pyramid network. Proceedings of the AAAI Conference on Artificial Intelligence, pp. 9259–9266. HI, USA. [Google Scholar]
51. Li, X., Wang, W., Hu, X., Yang, J. (2019). Selective kernel networks. Proceedings of the IEEE/CVF Conference on Computer Vision and Pattern Recognition, pp. 510–519. Long Beach, CA, USA. [Google Scholar]
Cite This Article
 Copyright © 2024 The Author(s). Published by Tech Science Press.
This work is licensed under a Creative Commons Attribution 4.0 International License , which permits unrestricted use, distribution, and reproduction in any medium, provided the original work is properly cited.
 Downloads
 Citation Tools