
 Submit a Paper
 Propose a Special lssue
 Open Access
ARTICLE

Improving Prediction of Chronic Kidney Disease Using KNN Imputed SMOTE Features and TrioNet Model
1 Department of Information Systems, College of Computer and Information Sciences, Princess Nourah bint Abdulrahman University, P.O. Box 84428, Riyadh, 11671, Saudi Arabia
2 Department College of Computer Science and Engineering, University of Hafr Al-Batin, Hafar, Al-Batin, 39524, Saudi Arabia
3 Department of Computer Science & Information Technology, The Islamia University of Bahawalpur, P.O. Box 63100, Bahawalpur, Pakistan
4 Department of Computer Science, College of Computer Engineering and Sciences, Prince Sattam bin Abdulaziz University, P.O. Box 151, Al-Kharj, 11942, Saudi Arabia
5 Information Technology and Management, Illinois Institute of Technology, Chicago, IL 60616-3793, USA
6 Information and Communication Engineering, Yeungnam University, Gyeongsan, 38541, Korea
* Corresponding Authors: Muhammad Umer. Email: ; Imran Ashraf. Email:
Computer Modeling in Engineering & Sciences 2024, 139(3), 3513-3534. https://doi.org/10.32604/cmes.2023.045868
Received 10 September 2023; Accepted 29 November 2023; Issue published 11 March 2024
 View Full Text
 Download PDF
Abstract
Chronic kidney disease (CKD) is a major health concern today, requiring early and accurate diagnosis. Machine learning has emerged as a powerful tool for disease detection, and medical professionals are increasingly using ML classifier algorithms to identify CKD early. This study explores the application of advanced machine learning techniques on a CKD dataset obtained from the University of California, UC Irvine Machine Learning repository. The research introduces TrioNet, an ensemble model combining extreme gradient boosting, random forest, and extra tree classifier, which excels in providing highly accurate predictions for CKD. Furthermore, K nearest neighbor (KNN) imputer is utilized to deal with missing values while synthetic minority oversampling (SMOTE) is used for class-imbalance problems. To ascertain the efficacy of the proposed model, a comprehensive comparative analysis is conducted with various machine learning models. The proposed TrioNet using KNN imputer and SMOTE outperformed other models with 98.97% accuracy for detecting CKD. This in-depth analysis demonstrates the model’s capabilities and underscores its potential as a valuable tool in the diagnosis of CKD.Keywords
Precision medicine emerged as a potential field concept that offers personalized medical care. Precision medicine is especially helpful for accurate diagnosis, offering effective treatment and timely intervention for special subgroups of patients. Precision medicine is particularly helpful for chronic kidney disease (CKD). The kidneys, which resemble fist-sized beans, are positioned just below the rib cage on both sides of the spine [1]. Each day, they filter as much as 150 quarts of blood, resulting in the production of nearly 2 quarts of urine. Primarily functioning within the excretory system, the kidneys carry out the vital task of expelling excess water and waste from the body through the process of urination [2]. This intricate process encompasses a series of excretion and re-absorption steps that are crucial for maintaining a stable equilibrium of body chemicals [3]. The kidneys are essential for maintaining the right levels of salt, potassium, and acidity in the body. They also produce hormones that affect other organs. For example, these hormones help control blood pressure, make red blood cells, and manage calcium levels, among other important tasks.
CKD earns its “chronic” classification due to its gradual onset and enduring impact on the functionality of the urinary system. Factors that elevate the risk of CKD encompass high blood pressure, diabetes, and cardiovascular disease [4]. Individuals affected by CKD, particularly during its advanced stages, may encounter unfavorable effects on their neurological and immunological systems. In less developed nations, certain patients may progress to a stage where the utilization of dialysis becomes imperative as they approach the end of their lives. The Glomerular Filtration Rate (GFR), a pivotal measure of kidney function, is derived from considerations such as results from blood tests, gender, the patient’s age, and other relevant criteria [5]. Several factors can elevate the probability of CKD, such as diabetes, high blood pressure, genetic conditions, autoimmune diseases, medication misuse, exposure to toxins, and family history, often progressing silently before symptoms appear [6].
The primary culprits behind CKD are diabetes and high blood pressure. Diabetes, marked by elevated blood sugar levels, can lead to kidney damage as well as affect blood vessels, the heart, and eyes. Additionally, inadequately managed hypertension can significantly contribute to heart attacks, strokes, and the development of chronic kidney disease. Other factors that can impact kidney health include dysplasia, kidney stones, metabolic diseases, genetic diseases, tumors, recurrent urinary tract infections (UTIs), glomerulonephritis, fatness, and aging [7]. CKD is often considered a silent disease due to being asymptomatic until normal functions of the kidneys are reduced by 80%–85% to awfully low levels of 15%–20% [8]. As CKD reaches its advanced stages, several prominent symptoms become evident, including fatigue, decreased appetite, reduced energy levels, swelling in the legs and ankles, difficulties with concentration, dry skin with intense itching, sleep disturbances, nocturnal muscle cramps, puffiness around the eyes, and frequent urination, particularly during the night [9].
Presently, CKD is rapidly becoming a major health issue, resulting in millions of deaths worldwide due to the lack of timely and affordable treatment. Particularly affected are individuals from low and middle-income countries [10]. As of 2013, approximately one million people lost their lives due to CKD [11]. Developing nations bear a more substantial burden of this disease, with a total of 387.5 million CKD patients in low to average-income countries, comprising 177.4 million males and 210.1 million females [12]. These figures highlight the growing prevalence of CKD in developing countries. However, efforts are being made to improve early detection of the disease to enable timely treatment during its initial stages.
Reshma et al. [13] employed a feature selection approach on the CKD Dataset. To perform this selection, they used the Ant Colony Optimization (ACO) method, a metaheuristic algorithm employed specifically for feature selection, categorized as a Wrapper method. Initially, the dataset comprised 24 attributes. However, through the application of the feature selection algorithm, they narrowed it down to 12 pertinent features, which formed the basis for constructing their model. Notably, the model was built using the Support Vector Machine (SVM) classification algorithm. Another study [14] focused on predicting CKD using the same dataset. This dataset encompassed 24 attributes along with a singular target variable. To construct their predictive model, they employed two ML algorithms, namely K-Nearest Neighbors (KNN) and Naïve Bayes. Impressively, KNN yielded the highest accuracy at 97%, while Naïve Bayes achieved a commendable accuracy of 91%. Until now, various feature selection algorithms have been used to identify the most effective algorithm for extracting the most important features for predicting chronic kidney disease. Since many datasets have imbalanced classes, class balancing is necessary to improve the performance of classifier models. Additionally, missing data values in datasets must be addressed to improve the classification task. In this study, synthetic minority oversampling (SMOTE) is used for data balancing and K-Nearest Neighbors (KNN) imputer is used to handle missing values for CKD detection. Recently, Nimmagadda et al. [15] also analyzed KNN, SVM and regression models to detect CKD. The ensemble model has been employed by researchers in disease diagnosis [16,17].
In this scenario, computer-aided diagnosis (CAD) can play a vital role in achieving the initial stage prognosis of the disease. Machine learning (ML), a subdomain of artificial intelligence (AI) can be of great help in its diagnosis [18]. Such systems aim to assist clinical decision-makers in accurately classifying diseases. In this study, an ML-based method is introduced for diagnosing CKD. The primary contributions of this study as
• This study offers an accurate prediction model for the precision model to help kidney disease patients. An ensemble model using extreme gradient boosting (XGB), random forest (RF), and extra tree classifier (ETC) called TrioNet offers highly accurate prediction of CKD.
• The proposed model provides point-of-care testing to help medical experts make faster diagnoses and timely treatment which greatly improves the chances of patients’ survival.
• KNN imputer in the proposed approach resolves the missing values problem while SMOTE helps equalize the class-imbalance problem.
• Machine learning models such as decision tree (DT), RF, gradient boosting machine (GBM), Gaussian Naive Bayes (GNB), ETC, support vector classifier (SVC), logistic regression (LR), and stochastic gradient descent (SGD), have been employed to conduct a comparative analysis. The proposed model’s effectiveness is evaluated by contrasting its performance with state-of-the-art techniques, considering metrics such as accuracy, precision, recall, and F1 score to comprehensively analyze its capabilities.
The remaining sections of the paper follow this structure: Section 2 discusses related works that utilize ML in the context of CKD health conditions. Section 3 elaborates on the methods and the dataset employed for analysis. Section 4 presents the proposed appraoch. Section 5 is dedicated to presenting and discussing the study findings. Section 6 provides the conclusion and outlines potential future directions.
Currently, there is a growing interest in developing procedures and equipment for predicting and monitoring different diseases. In this section, recent works are explored that have utilized ML methods for forecasting the risk of CKD.
For example, in [19], ML models were employed for predicting CKD. The pre-processing phase involved handling missing values and selecting relevant features. The study utilized a total of 11 ML models, including tree-based, regression-based, and statistical models. Notably, among these models, five achieved an impressive 100% accuracy on the University of California, Irvine (UCI) dataset. These high-performing models were DT, AdaBoost (ADA), ETC, XGB, and RF. For CKD diagnosis, Zahid et al. [20] proposed an ML model that incorporated selected predominant features. Similar to the previous study, this research also implemented pre-processing and feature selection steps. The results revealed that the KNN model outperformed other learning models, achieving an impressive accuracy score of 99.50%.
The study [21] introduced a hybrid model designed for predicting CKD. The authors effectively tackled challenges related to missing values and class imbalance by leveraging the capabilities of RF. The study incorporated a variety of ML models, including GNB, GBM, Naive Bayes (NB), RF, DT, and their hybrid model. These models were applied to the UCI chronic kidney disease dataset. Notably, the hybrid ML model achieved a remarkable accuracy score of 100%. Another hybrid ML model aimed at CKD prediction, built upon Apache Spark, was proposed by Abdel-Fattah et al. [22]. The authors conducted experiments using both full feature sets and features selected through Relief-F. The outcomes demonstrated that the machine learning models DT, SVM, and GBM achieved an impressive accuracy of 100%.
Venkatesan et al. [23] unveiled an ML-based system for the early detection of CKD. In the pre-processing step, the authors applied a class imbalance technique and handled missing values using the K-NN imputer. The results of the study revealed that the ML model XGBoost achieved an impressive accuracy score of 98% for detecting CKD at an early stage. For kidney disease prediction using image data, Kumar et al. [24] proposed a system that employed ML models for recognition and prediction. The approach combined a fuzzy deep neural network with a deep learning approach. The proposed system achieved a high accuracy score of 99.23% for accurately predicting kidney diseases using image data. Dritsas et al. [25] utilized a variety of ML models for the timely prediction of CKD. With the application of pre-processing techniques, the authors addressed the issue of non-uniform class distribution using the SMOTE oversampling technique. Among the 15 ML models used in the study, the rotational forest model stood out with an accuracy score of 99.2% for predicting CKD.
In [26], the experiments were conducted using a CKD dataset comprising 25 attributes sourced from the UCI ML repository. To diagnose CKD, three machine learning models were employed DT, RF, and SVM. These models achieved prediction accuracies of 99.16%, 94.16%, and 98.3%, respectively. In reference to the discoveries outlined in [27], the CKD dataset sourced from the UCI repository was also employed to assess a range of classifiers. The classifiers utilized in this investigation encompassed artificial neural network (ANN), chi-square automatic interaction detector, linear SVM with both L1 and L2 penalties, LR, C5.0, and random tree (RT). Notably, the linear SVM, when utilizing the L2 penalty and integrating SMOTE for input data, achieved an accuracy of 98.86%. By employing a combination of SMOTE and lasso techniques for feature selection, the linear SVM obtained a similar accuracy of 98.46%. Furthermore, employing a deep neural network on the same dataset resulted in an outstanding accuracy of 99.6%.
Swain et al. [28] proposed a robust approach for CKD classification, incorporating several data pre-processing techniques. For feature selection, the authors utilized the Chi-square test and addressed class imbalances using SMOTE. The classification phase involved two ML models SVM and RF. The results represented the highest accuracy of 99.33% for CKD classification by the SVM model. In the research conducted by Almasoud et al. [29], the primary emphasis was placed on the identification of CKD through the utilization of minimal predictor variables within ML algorithms. Four distinct ML models were utilized RF, GB, LR, and SVM. Among these, the GB algorithm exhibited superior performance, boasting an impressive accuracy of 99% for the precise detection of CKD.
In the work presented in [30], Yashfi et al. introduced an approach for predicting risks associated with CKD using ML algorithms. The analysis involved data from CKD patients, and they employed ANN and RF for predictions. By selecting 20 features from a total of 25, ANN and RF were implemented, with RF achieving the highest accuracy of 97.12% for CKD risk detection. In a comparative study by Rady et al. [31], diverse algorithms, including SVM, radial basis function (RBF), multilayer perceptron (MLP),and probabilistic neural networks (PNN), were examined for predicting stages of kidney disease. Despite working with a limited dataset and a restricted feature set, the results highlighted that PNN outperformed other algorithms, achieving the highest accuracy of 96.7%. Furthermore, in [32], the authors utilized an ML technique for the prognosis of CKD. The study incorporated three ML models LR, DT, and SVM, with the application of the bagging technique to enhance the prediction accuracy. The findings demonstrate that the DT model achieved a noteworthy accuracy of 97.23% in predicting CKD.
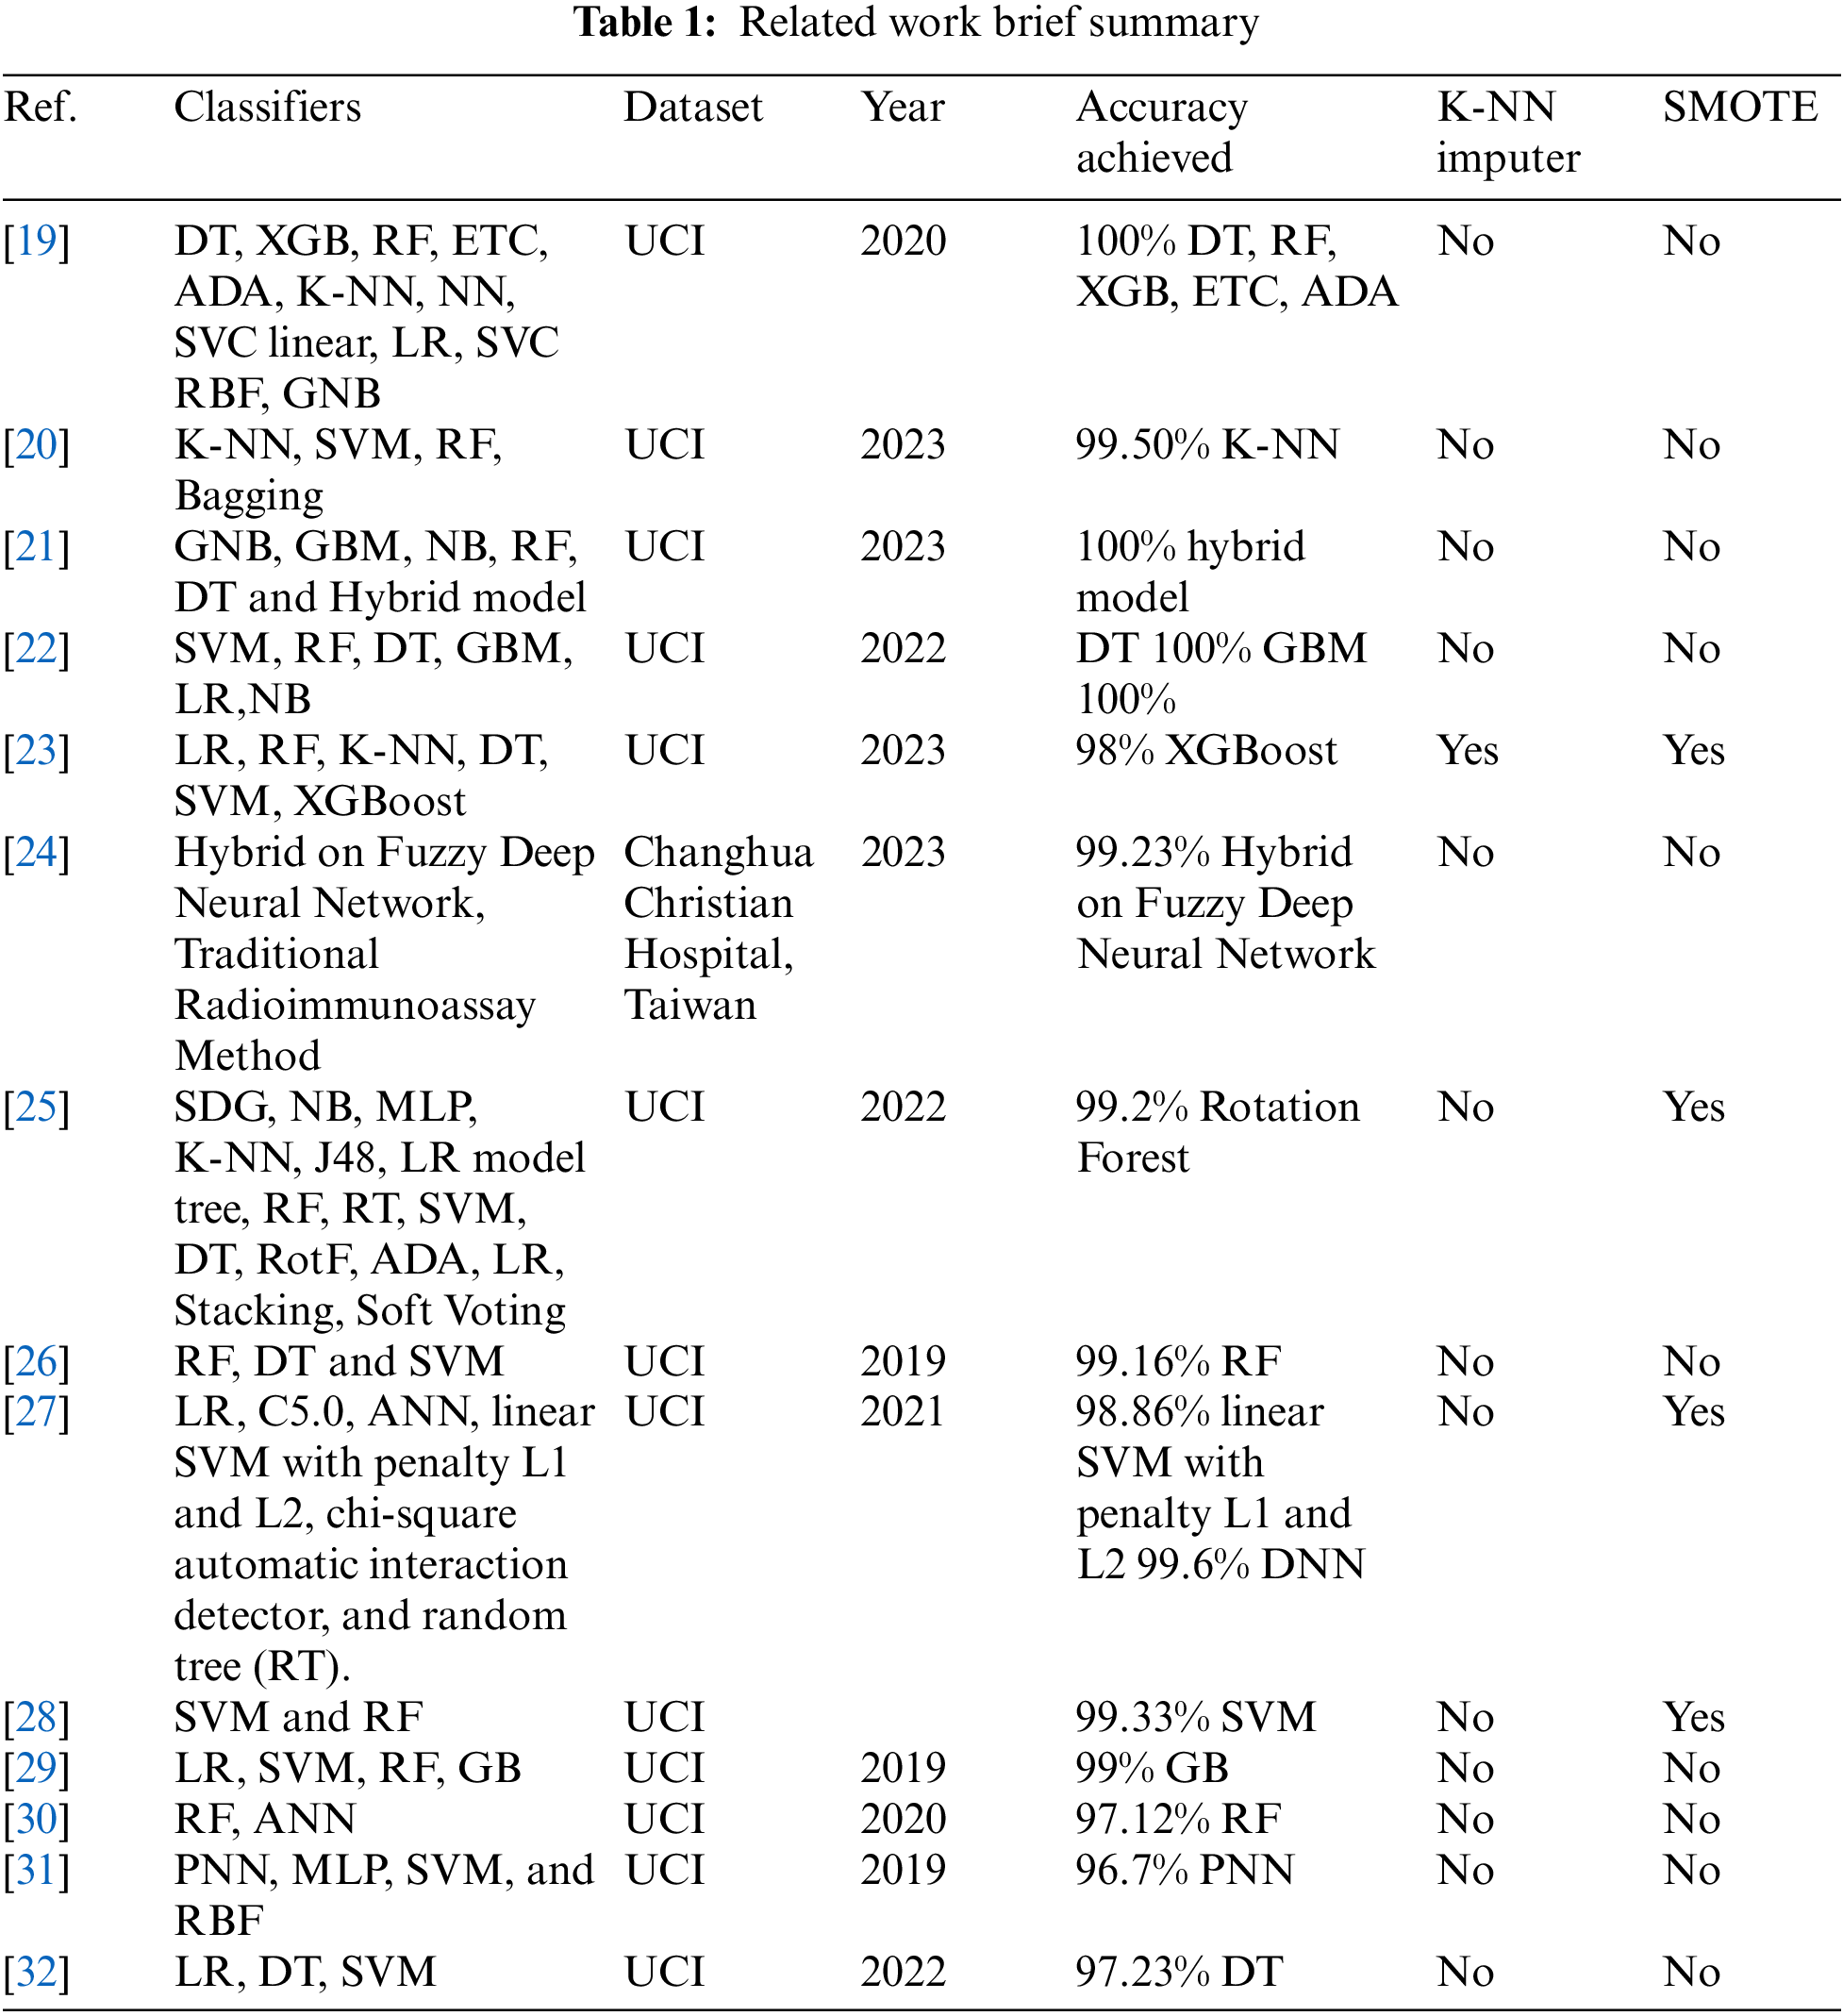
The prior works in the field of CKD prediction using ML techniques have made significant contributions, but they also face several challenges and limitations. Many CKD datasets suffer from class imbalance, where the number of positive CKD cases is significantly lower than negative cases. This imbalance can lead to biased models and reduced predictive performance. Inherent issues with data quality, such as missing values, outliers, and inconsistencies, can affect the accuracy of predictive models. Handling missing data is a common challenge that prior works have had to address. Addressing these challenges and limitations is essential for advancing the field of CKD prediction using ML, as it would lead to more reliable and clinically relevant models. This paper addresses both challenges to get improved results in detecting CKD. For a comprehensive overview of the related studies, a comparative summary is shown in Table 1.
This section of the research delineates the materials and methods employed in predicting kidney disease. It encompasses a succinct overview of the chronic kidney disease dataset, the data pre-processing steps, a description of ML models utilized, the proposed methodology, and the evaluation parameters employed for assessing the performance of the ML models.
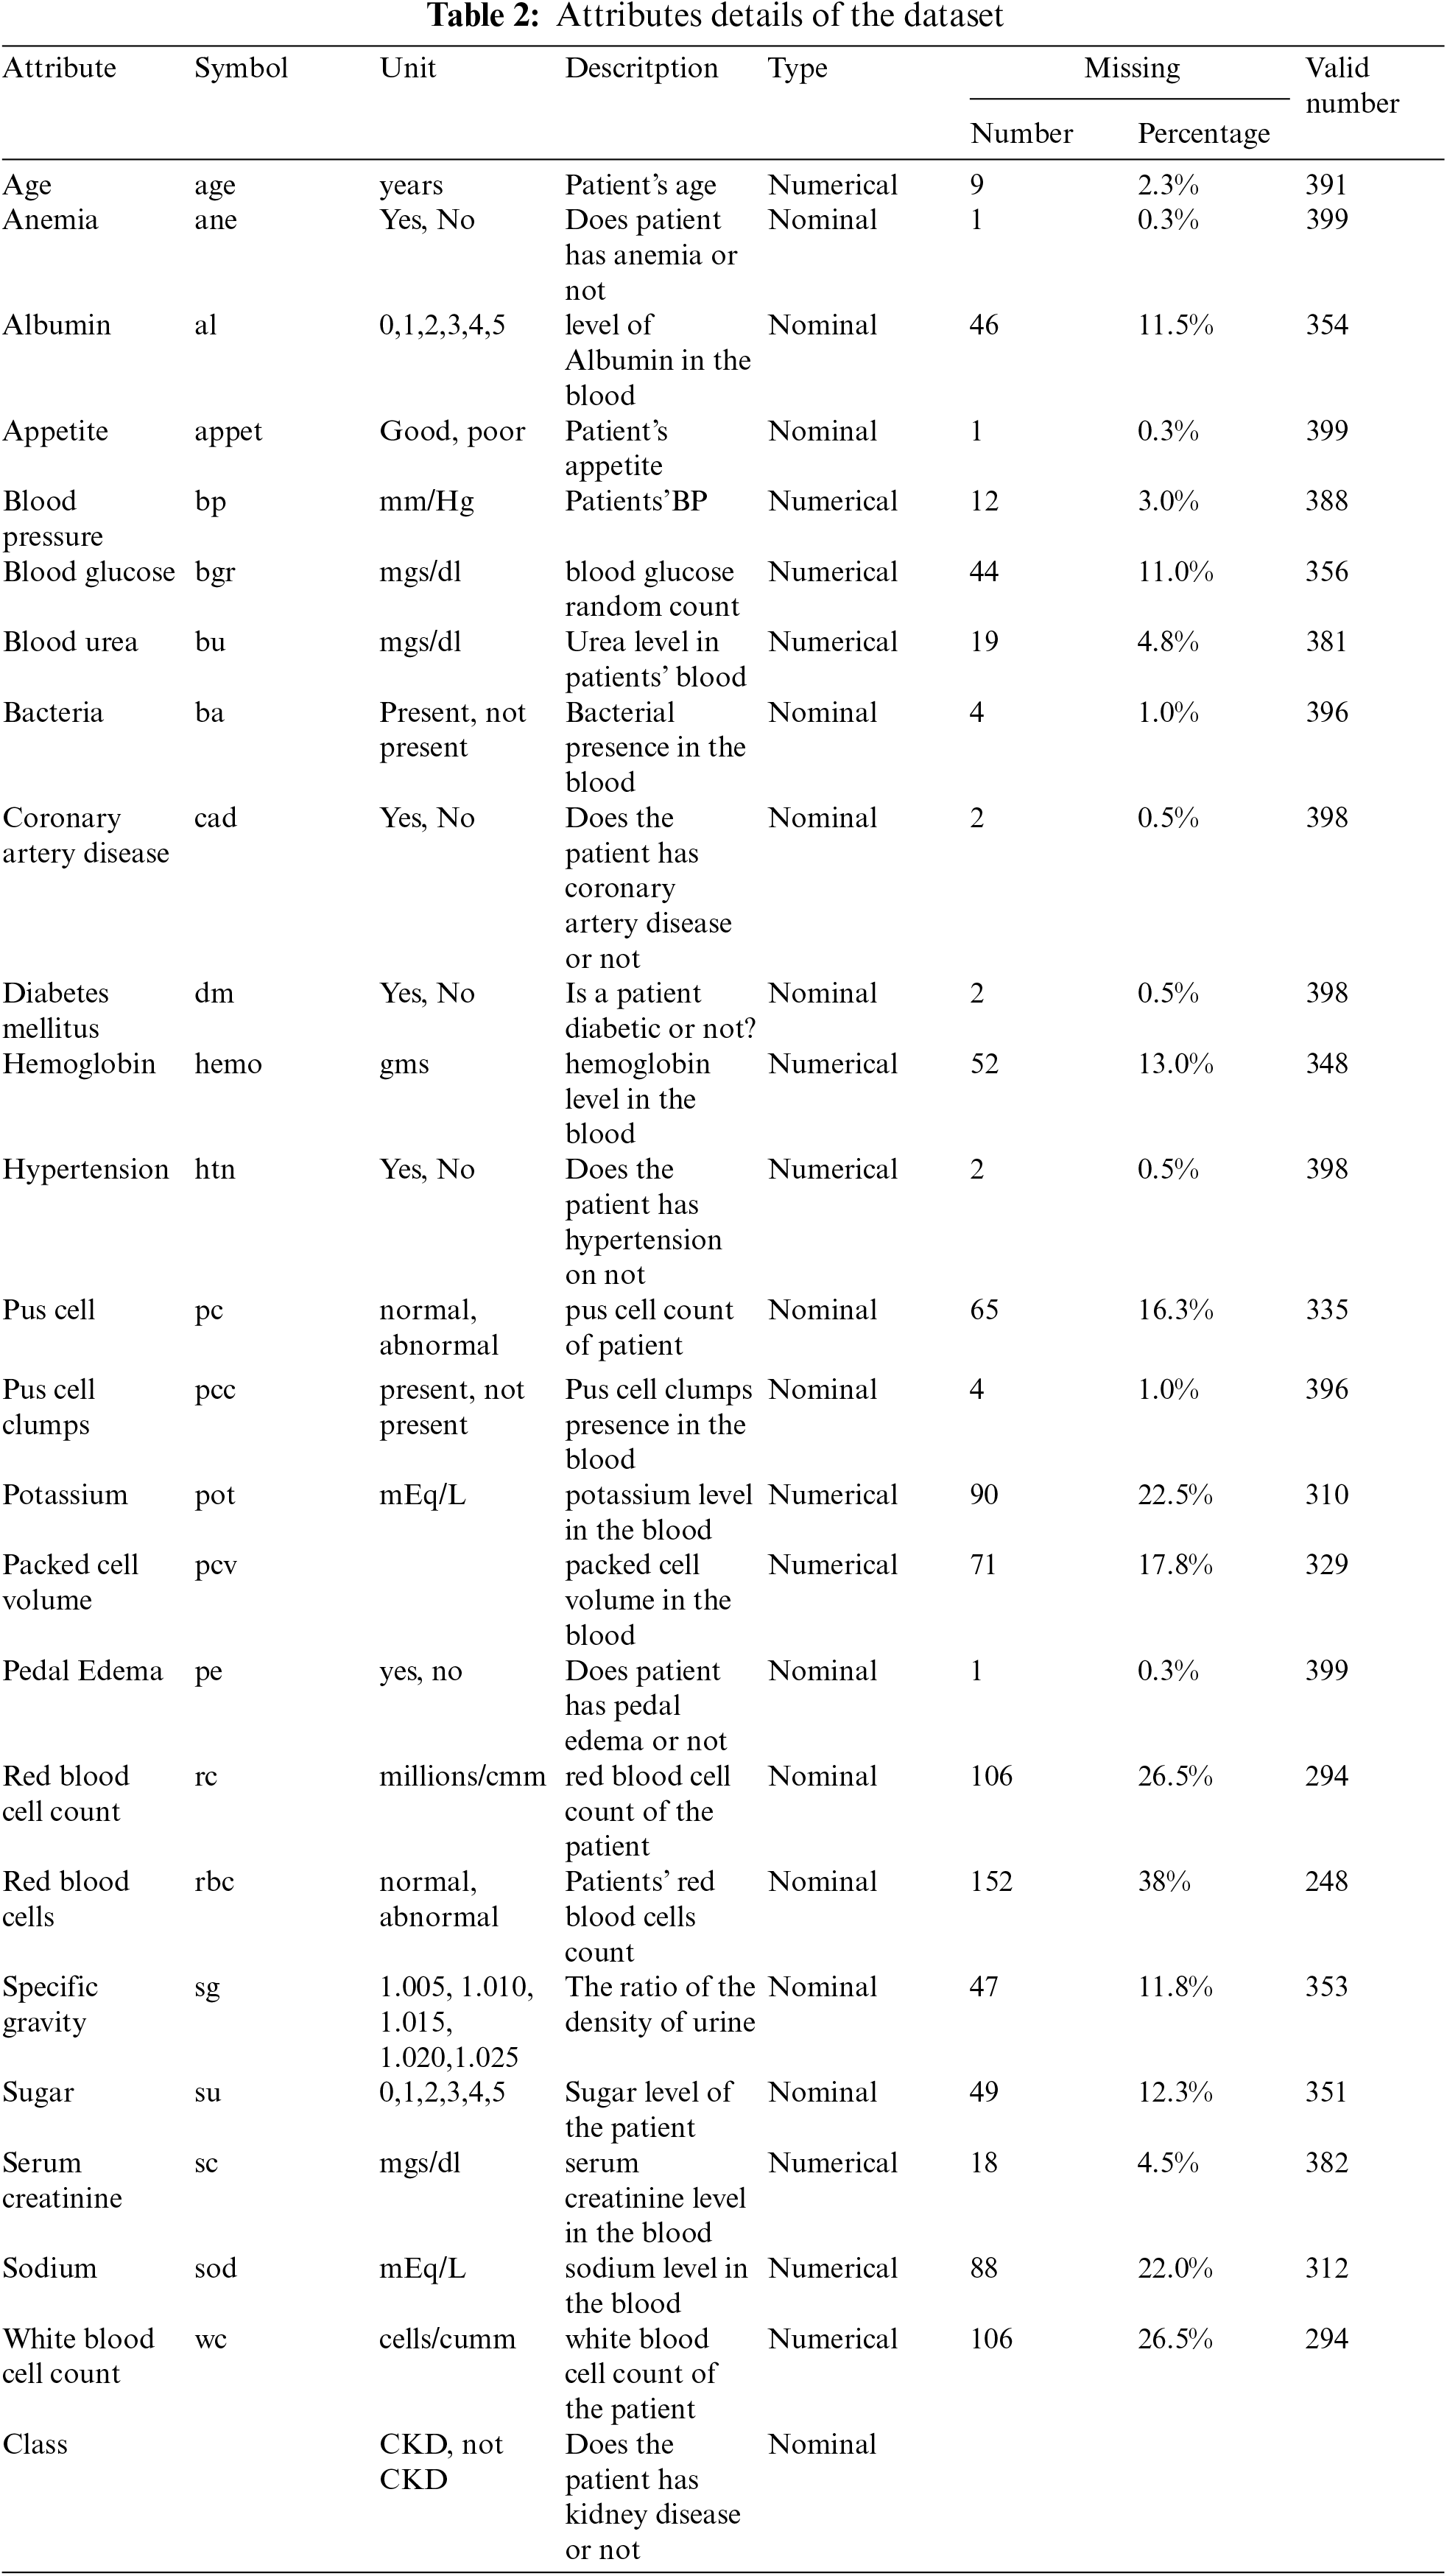
This research utilizes a dataset containing information on patients diagnosed with CKD, which was collected from India’s Apollo Hospital over a two-month period in 2015. This dataset originates from the UCI data repository [33]. The dataset consists of 400 observations, which may include instances with incomplete or missing values. Among these observations, there are records for 250 CKD patients and 150 individuals without CKD. This breakdown represents 62.5% associated with CKD cases and 37.5% with non-CKD cases. The age of the individuals in the dataset ranges from 2 to 90 years. The CKD dataset consists of 24 features, which include 11 numeric features and 13 nominal features. Moreover, the 25th feature serves as an indicator for CKD classification. As demonstrated in Table 2.
The CKD dataset presented challenges related to outliers and missing data, which necessitated a thorough cleaning during the preprocessing phase. Additionally, the model’s performance is biased due to an inherited imbalance in the dataset class. The pre-handling phase involved addressing these issues through missed imputation and estimation values, removing outliers that introduced noise, and balancing the dataset [33,34]. The problem of class imbalance is addressed through the implementation of SMOTE. Initially, the dataset contained numerous missing values, with only a complete record for 158 patients available. During the preprocessing stage, significant attention is given to imputing these missing values, primarily through the utilization of the KNN imputer. After the completion of this imputation process, the dataset is carefully balanced. It encompassed 250 instances of patients with CKD and 150 instances of patients without CKD, resulting in an uneven distribution that could potentially affect the performance of the model. To mitigate this, dataset balancing is carried out as a crucial preprocessing step.
3.3 SMOTE (Synthetic-Minority-Oversampling-Technique)
To handle the class imbalance problems present in the CKD dataset this study makes use of SMOTE. Oversampling is a technique that entails increasing the number of instances in the minority class in comparison to the majority class, effectively enhancing the presence and representation of the underrepresented minority class.
This approach can contribute to enhancing model accuracy by generating a richer set of features for training purposes [34]. SMOTE is a contemporary methodology specifically designed to address overfitting concerns within imbalanced datasets. It functions by randomly selecting instances from the minority class and identifying their K-nearest neighbors within that same class. This process aids in the creation of synthetic samples that contribute to a more balanced representation of classes and, subsequently more robust model training [35]. Based on these neighbors, new synthetic instances are constructed, these synthetic instances are the same as the original instances as these synthetic instances are developed using existing features. This process aims to create a more balanced representation of the minority class without duplicating existing data.
Although SMOTE proves effective in addressing class imbalance, it may not be the optimal choice for high-dimensional datasets due to the potential introduction of additional noise. However, in the context of this study, SMOTE is employed to create a new training dataset, effectively tackling the class imbalance issue and enabling more robust model training.
In contemporary times, gathering data from various origins forms the bedrock for analysis, insights generation, theory validation, and other endeavors [36]. Nevertheless, it is crucial to acknowledge the potential for human errors during data extraction, leading to an issue of incomplete information. Consequently, efficiently handling missing values becomes a critical step in data preprocessing. The choice of imputation method to address these gaps significantly influences model performance. One noteworthy approach for missing values imputation is the KNN imputer provided by sci-kit-learn. It is the best alternative to orthodox imputation approaches. By powering the Euclidean distance matrix, the KNN imputer identifies the nearest neighbors to the observations containing missing values. The imputation process involves weighing available data by discounting the missing values while computing the Euclidean distance.
3.5 Eliminating Missing Values from Dataset
The subsequent data management technique involves the removal of instances containing missed values. In the second experimental set, this method is implemented, where all records with any missing values are excluded from the analysis. This means that any observation in the dataset that has at least one field with missing information is entirely removed from the dataset.
ML is of great importance in improving the precision and effectiveness of predicting chronic kidney disease. Various ML algorithms are available for classifying CKD. Python’s Scikit-learn library offers a diverse range of freely available ML classifiers, extensively used by a substantial user base, making significant contributions to the study. In this study, the Scikit-learn library is utilized to implement a range of machine learning models, including SVM, KNN, XGBoost, Stochastic Gradient Decent Classifier (SGDC), NB, LR, RF, and DT.
RF, an ensemble classifier, achieves remarkable prediction accuracy by aggregating multiple weak learners. It utilizes bootstrap bagging to train numerous DTs ( Decision Trees) with different bootstrap samples [37]. A training set is sub-sampled to a bootstrap sample, during this process, maintaining the sample size of the original dataset. Predictions are made based on DT by RF and other ensemble classifiers [38]. Identifying the root node attribute is a significant challenge in constructing these decision trees at each stage of the tree-building process. Let
3.6.2 Gradient Boosting Machine
GBM classifier is an ML algorithm that combines multiple weak learners to create a powerful predictive model [39,40]. GBM is loss function-dependent, which can be customized to suit specific needs. The GBM backs various common loss functions, as long as they are differentiable. In classification, logarithmic loss is commonly used, while regression often utilizes squared errors. One advantage of gradient boosting is that new loss function derivation is not needed each time the algorithm is employed. Instead, the system can be applied with any differentiable loss function. Higher accuracy can be achieved with GMB by fine-tuning multiple hyperparameters. For instance, the parameter n = 100 indicates the prediction contributing tree numbers to be 100. The final forecast is the aggregation of individual forecasts of 100 DTs through voting. Another crucial hyper-parameter is “max depth,” which is often set to 60, allowing each DT 60 levels of depth at maximum. This control over the tree’s depth helps prevent overfitting and enhances generalization capabilities.
LR stands out as the most prevalent technique employed for binomial classification tasks [41]. This method is distinguished by its utilization of the logistic equation or sigmoid function. An S-shaped curve denoting a Sigmoid function effectively transforms any input value into an output value that ranges between 0 and 1.
The base of the natural logarithms is denoted as
In the given context,
Extremely Randomized Trees, abbreviated as ETC, is an ensemble learning technique primarily employed for classification tasks [42]. Much like the RF classifier, ETC also employs the strategy of creating multiple decision trees and then aggregating their predictions to enhance the model’s precision and resilience. Yet, what sets ETC apart from RF is its approach to constructing decision trees [43]. Unlike RF, which picks a subset of features and evaluates the optimal split point at each node, ETC takes a distinct path. ETC chooses split points randomly across the feature space, resulting in quicker training times and reduced susceptibility to overfitting [44].
3.6.5 Support Vector Classifier
SVC is a popular ML technique that aims to identify a hyperplane in N-dimensional space for classifying data points [45]. The primary goal of this algorithm is to find the hyperplane that maximizes the margin between classes. The dimensionality, represented by N, varies depending on the number of features. While comparing two features is relatively straightforward, dealing with multiple features for classification can be more complex. By maximizing the margin, the accuracy of prediction is enhanced by SVC. Fuzzy SVC has been utilized by researchers in pathological brain detection [46].
DT is a widely acclaimed ML algorithm used comprehensively for solving classification and regression tasks [47,48]. The key challenge in constructing a decision tree lies in selecting leveler root nodes, which is known as ‘attribute selection’. Two prominent techniques commonly used for attribute selection include ‘information gain’ and ‘Gini index (GI)’. The GI can be calculated using the following equation:
The DI is a metric utilized to measure the impurity of data within a dataset.
KNN is an ML model that does not rely on a dependent variable to make predictions for a given dataset [36]. Instead, the model is provided with ample training data, and it determines a data point’s neighborhood. The KNN model calculates the distance between the nearest neighbors of a new data point and the data point itself. The ‘K’ value specifies the number of nearest neighbors to consider, and it determines the majority of the neighbors’ votes. For instance, if ‘K’ = 1, the new data point is assigned to the class of the closest neighbor.
The GNB model utilizes Bayes’ theorem. The output of an event is predicted using unconditional probabilities in GNB [49,50]. If a sample is classified into
In the above equation, the probability of class
3.6.9 Stochastic Gradient Decent Classifier
SGDC functions by amalgamating concepts from both LR and SVM [34]. It adopts the convex loss function characteristic of LR, endowing it with robust classification capabilities. Particularly well-suited for multiclass classification tasks, SGDC employs the one vs. all (OvA) strategy to combine multiple classifiers. One of SGDC’s noteworthy advantages lies in its proficiency in handling large datasets, processing one example per iteration. Due to the regression-based approach, SGDC is both straightforward to implement and comprehend. However, achieving optimal performance necessitates careful parameter tuning for SGDC. Additionally, it is important to note that SGDC is highly sensitive to feature scaling, which should be taken into account for improved results.
XGBoost stands as a rapid supervised learning algorithm, chosen for its precise and reliable classification capability [42]. Its efficacy in this task is attributed to the presence of regularized learning capabilities, which aid in achieving smoother final weights and prevent overfitting issues.
ML model’s effectiveness is measured based on metrics such as precision, accuracy, recall, and the F1 score.
Accuracy is a metric that represents the proportion of correct predictions made by the classifiers compared to the total predictions on the test data. Its highest possible value is 1, which indicates that classifier predictions are 100% correct, while the lowest possible value is 0, meaning all the predictions are false. It is calculated as follows:
where TN is a true negative, TP is a true positive, FP is a false positive and FN is a false negative.
A positive predictive value, commonly known as precision, measures the value of True Positive (TP) instances among all the instances that are classified as true positives and False positives (FP). A precision score of 1 indicates that all instances considered as positive are actually positive. However, it is noteworthy that this metric does not affect positive instances mistakenly predicted as positive, even if they are labeled as negative.
Recall, often referred to as sensitivity, signifies the proportion of positive classified instances out of all the actual positive instances. The recall metric is defined as follows:
Classifiers’ performance is not evaluated as a definitive representation by “recall” and “precision” results, so the F1 score is of utmost importance because it combines both recall and precision, providing a balanced evaluation with a value between 0 and 1. It is calculated using the harmonic mean of recall and precision and is calculated using
Missing values play a vital role in assessing learning models’ performance. For any research aiming for good performance, it is necessary to handle missing values. In this study, we utilized KNN imputer to handle this problem. For the experimentation, the dataset is divided into the ratio of 70:30, this means that 70% of the data is used for the training of the models and the remaining 30% used for the testing of the models. For the efficient prognosis of kidney disease, this study proposed an ensemble learning technique that consists of three machine learning models (RF, ETC, and XGB). We called this model TrioNet. In the ensemble learning approach predictions from the different models are combined together to attain a higher value of accuracy. In this ensemble learning framework, each model has its own strength and weakness that plays a vital role in increasing the efficiency of the prediction. The proposed system architectural diagram is shown in the Fig. 1.
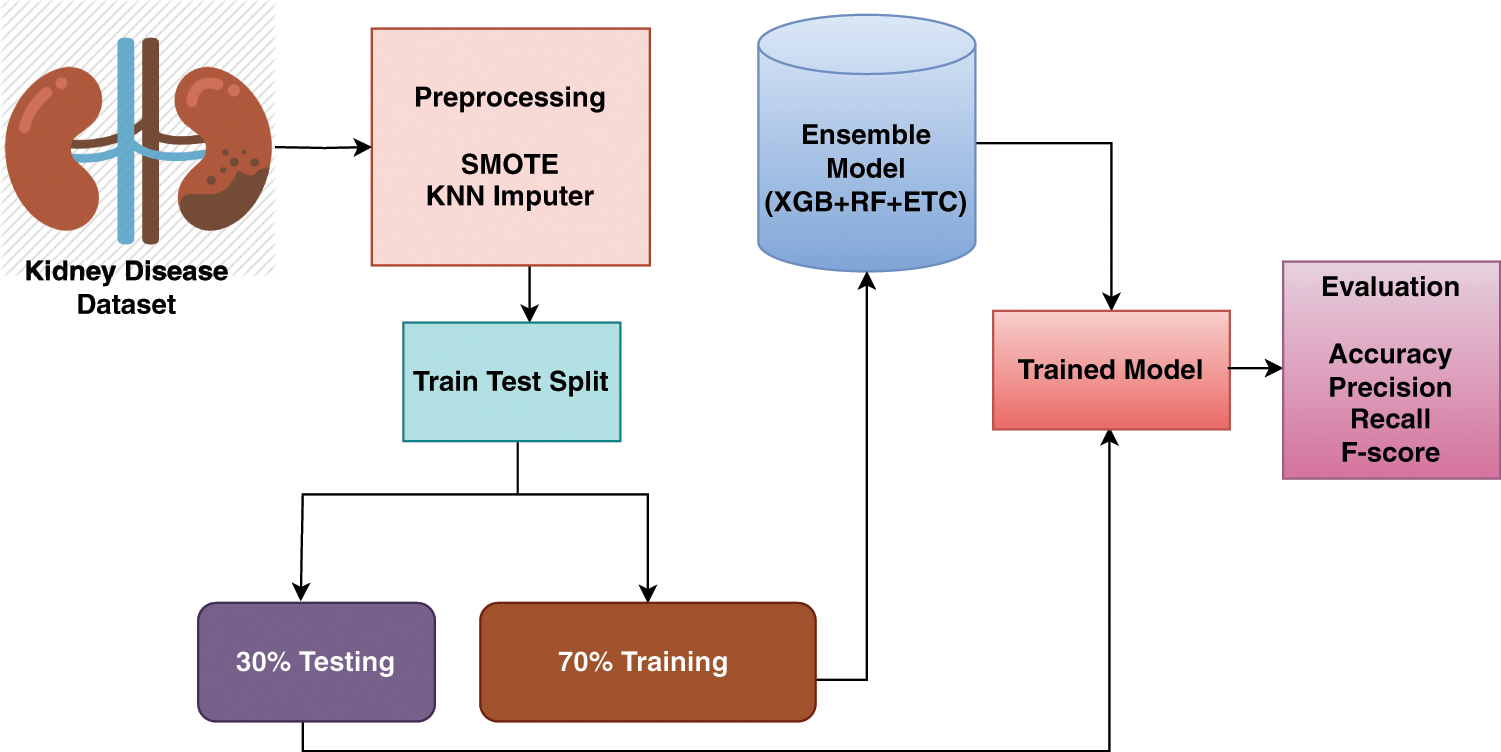
Figure 1: Workflow of TrioNet for chronic kidney disease detection
The TrioNet works by aggregating predictions from three different machine learning algorithms. In general, building such an ensemble entails training numerous models on the same dataset and then combining their predictions. This process requires individually training the XGB, RF, and ETC models on the same dataset. Each model generates an estimated probability for the target variable’s various classifications. These probabilities may be added together to provide the final prediction for each instance in the dataset. A popular method for combining predictions is to take an average of all predicted probabilities. To create accurate and robust predictions, the proposed ensemble model capitalizes on the particular characteristics of three separate machine-learning algorithms. We can increase the model’s generalizability and decrease overfitting by training all models on the chronic kidney disease dataset and integrating their predictions. The following is an outline of Algorithm 1, which offers a full explanation of how the proposed ensemble model operates:
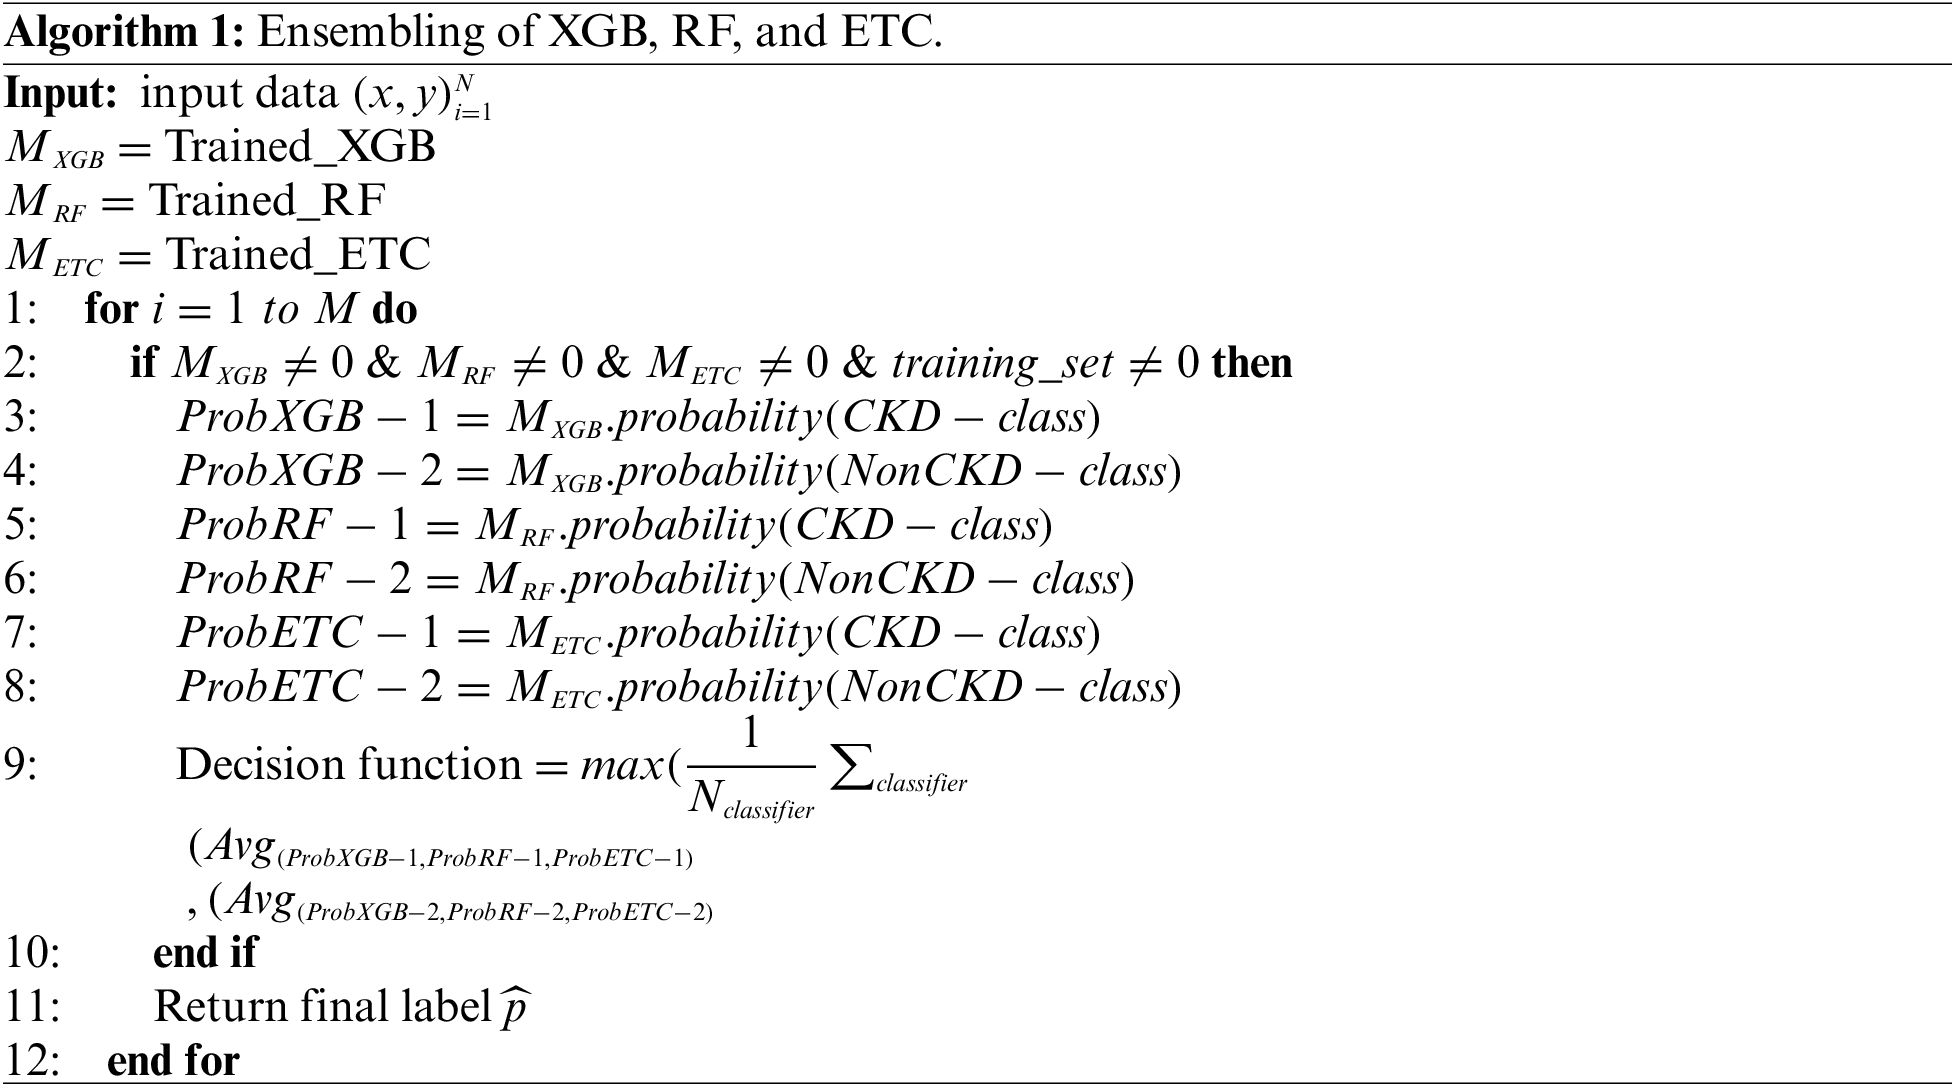
Within the proposed ensemble model, the prediction probabilities for individual test samples, denoted as
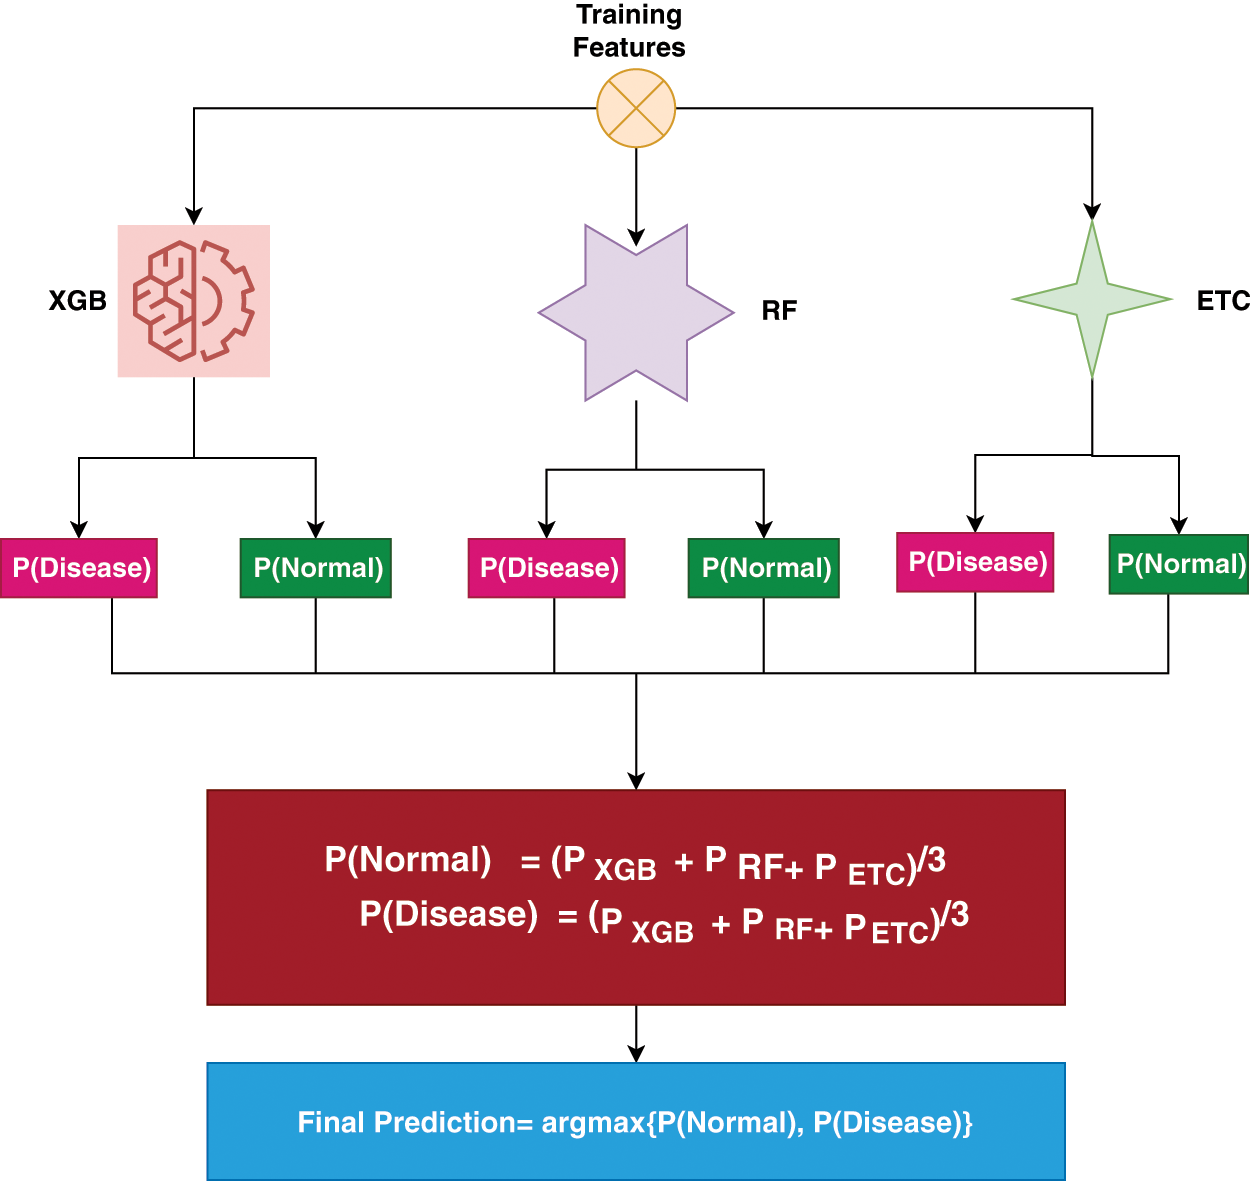
Figure 2: Ensemble architecture
This section discusses the results and discussions on CKD detection. This section of the study also contains a comparison of the recent state-of-the-art models with the proposed approach.
5.1 Experimental Results of Learning Models by Removing Missing Values
During the initial phase of the experiments, the main focus is on dealing with any missing values present in the dataset. These occurrences of missing data are removed from the dataset. Following this, the adjusted dataset is employed to train machine learning models. Table 3 displays the outcomes of ML models using the dataset with missing values removed.
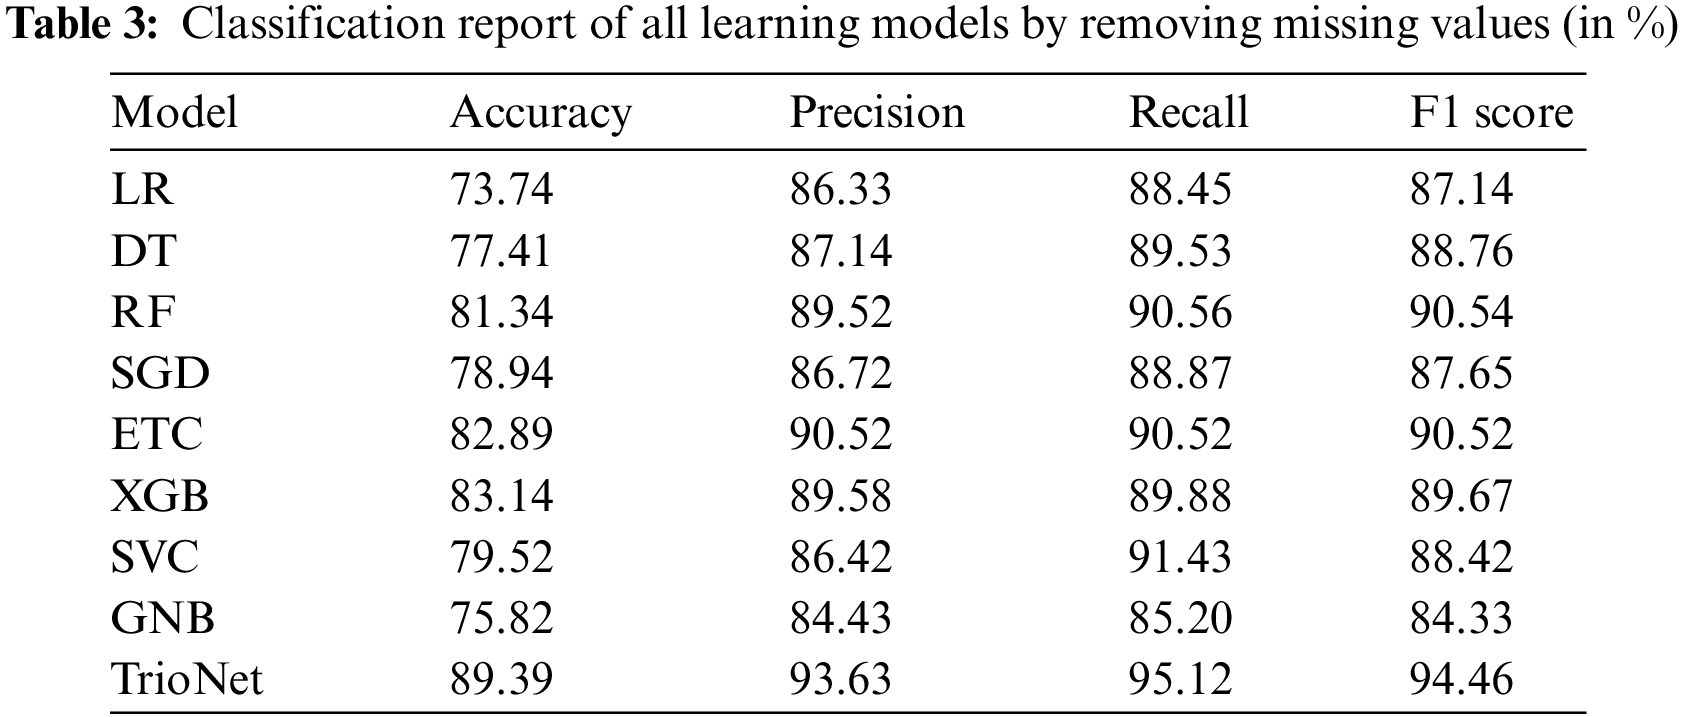
Results indicate that the XGB, ETC, and RF classifiers achieve a high accuracy score by attaining 83.14%,82.89%, and 81.34%, respectively. RF displayed precision, recall, and F1 scores of 90.56%, 89.52%, and 90.54%, respectively. ETC demonstrated 90.52% precision, recall, and F1 score. In a similar vein, XGBoost attained 89.58%, 89.88%, and 89.67% for precision, recall, and F1 scores, respectively. In contrast, LR demonstrated lower effectiveness, yielding an accuracy rate of 73.74%, a precision of 86.33%, a recall of 88.45%, and an F1 score of 87.14%. On the other hand, the proposed TrioNet outperformed other models, attaining an accuracy of 89.39%, a recall of 95.12%, a precision of 93.63%, and an F1 score of 94.46%. The superior performance of TrioNet, an ensemble model using XGB, RF, and ETC, can be attributed to its ability to combine the diverse strengths of these three models, reduce overfitting, improve robustness, balance precision, and recall, and create a more comprehensive understanding of the data. This ensemble approach effectively predicts kidney disease, making it a reliable and accurate choice for such medical applications.
5.2 Experimental Results of Learning Models Using KNN-Imputed Values
The KNN imputer is used to tackle the issue of missing values that are present in the CKD dataset. The presence of missing values in the dataset is detected during the data preprocessing phase and this thing greatly affects the performance of all learning models. KNN imputer imputes the missing values by calculating the Euclidean distance of neighboring values. After applying the KNN imputer, the resultant dataset is used to train and evaluate the machine learning models. ML model’s performance is shown in the Table 4.
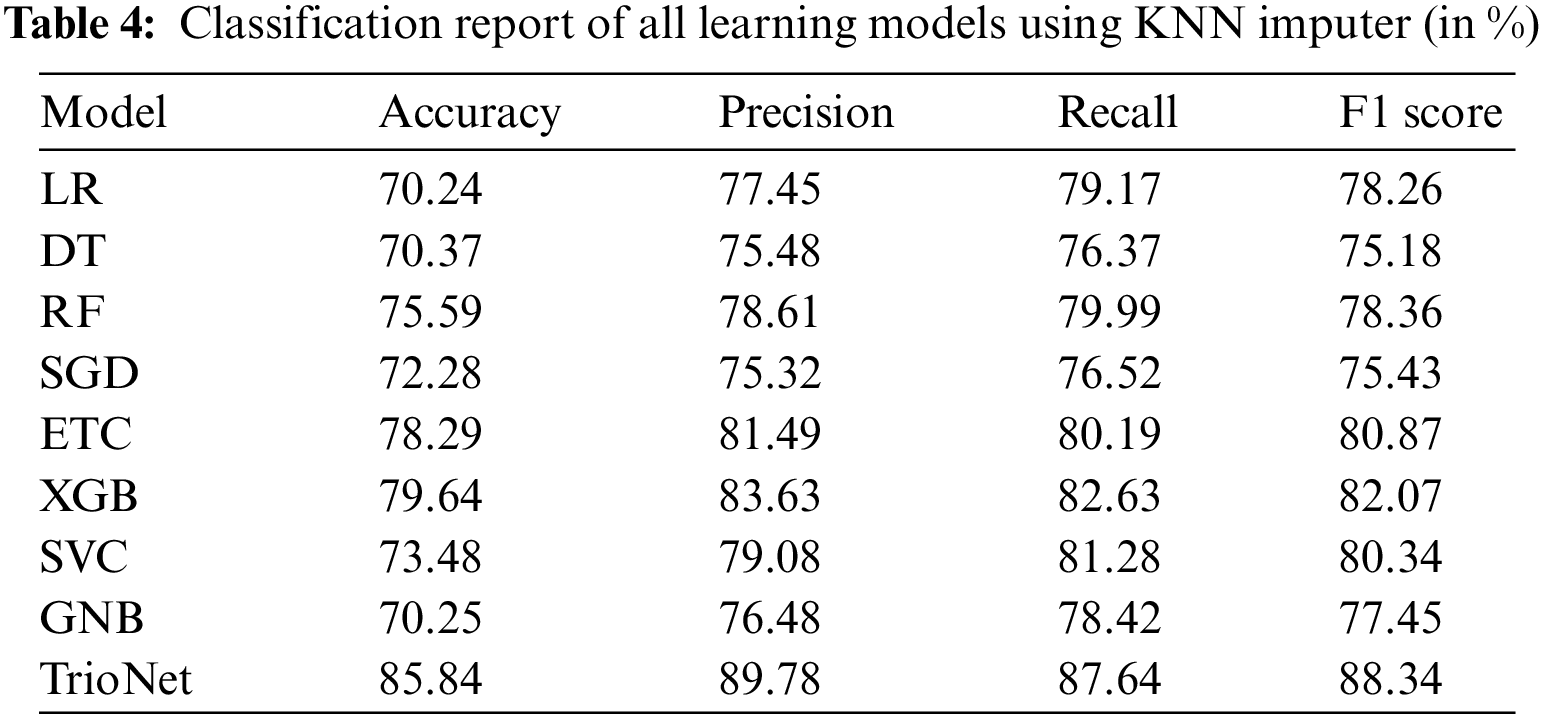
The experimental findings indicate that XGB, ETC, and RF achieved accuracies of 79.64%, 78.29%, and 75.59%, respectively. However, the suggested voting classifier surpassed all of them, achieving an impressive accuracy rate of 85.84%. Furthermore, TrioNet achieves a precision of 89.78%, a recall value of 87.64%, and an F1 score of 88.34%. The regression model LR shows an accuracy of 70.24%, which is lower than all models.
5.3 Experimental Results of Learning Models Using SMOTE Dataset
In the third set of experiments, the class imbalanced problem that is present in the dataset is treated using the SMOTE. In the preprocessing of the dataset, it has been observed that there is a class imbalanced problem. There are a total of 400 instances in the dataset and out of these 250 belong to the CKD patients class and 150 belong to the non-CKD class. it is clear from the fact that came from the preprocessing of the dataset that 62.5% instances belong to the CKD class and 37.5% belong to the non-CKD class. This class imbalanced problem is handled with the SMOTE. SMOTE is a widely used method used for the oversampling of data. training of the machine learning models done on the dataset obtained after applying SMOTE. Performance of the machine learning models using SMOTE balanced data is shown in the Table 5.
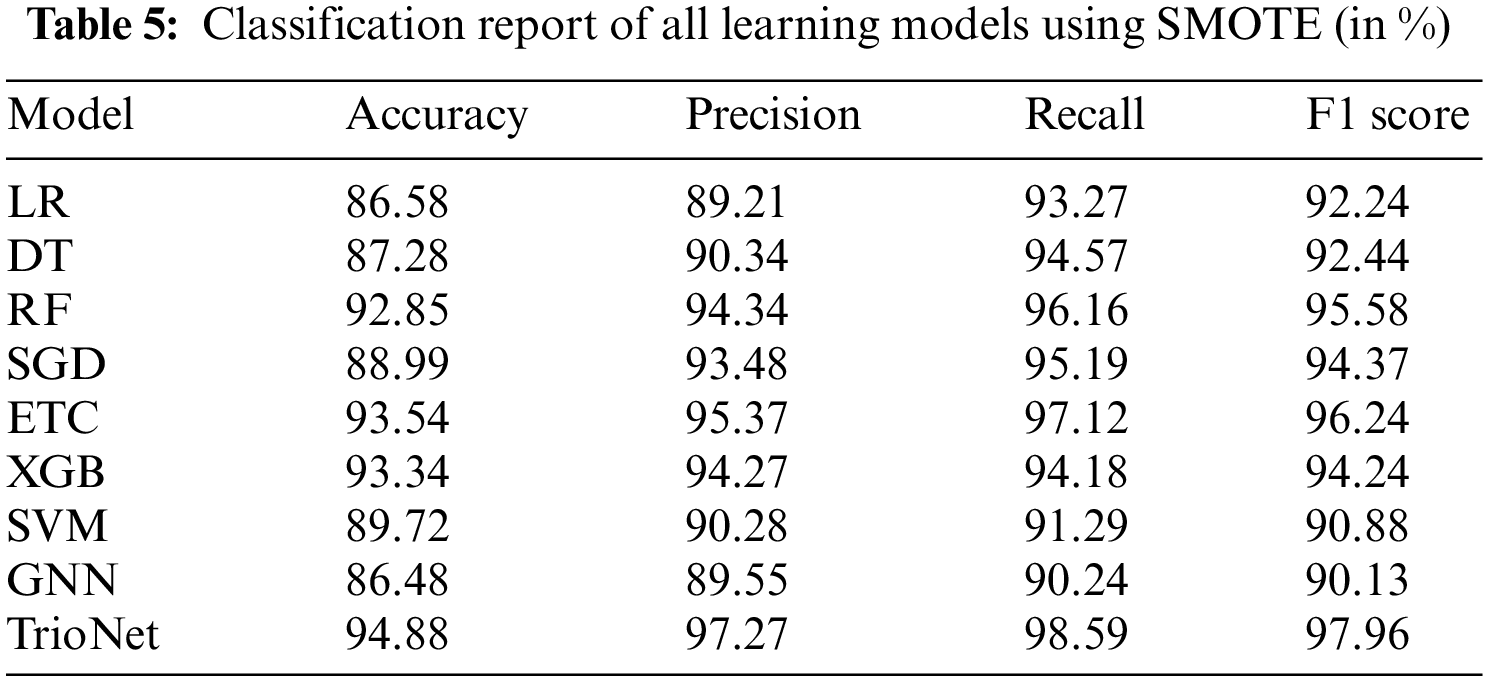
The results of the learning models show that the proposed stacked ensemble model outperformed other models in terms of accuracy value and achieved an accuracy score of 94.88%. Similarly, the performance of the individual learning model also improved as, ETC achieved 93.54%, RF 92.85%, and XGB achieved a 93.34% accuracy score on the balanced dataset. Tree-based model DT achieved an accuracy value of 87.28%. The two low performers on the balanced dataset are probability-based and regression-based methods which are GNB and LR achieved accuracy scores of 86.58% and 86.48%, respectively. Nonetheless, TrioNet outperforms using the upsampled dataset, showing its efficiency in detecting CKD.
5.4 Experimental Results of Learning Models Using KNN-Imputed Features and SMOTE
In the final set of experiments, SMOTE is used to tackle the class imbalance problem, and KNN imputer is used to handle the missing values. Results of this set of experiments are shown in the Table 6. using both SMOT and KNN imputer handles the class imbalanced problem and missing values concurrently. this will potentially increase the efficacy of the learning models. Subsequently, machine learning models are trained and evaluated after the implementation of KNN imputer and SMOTE.
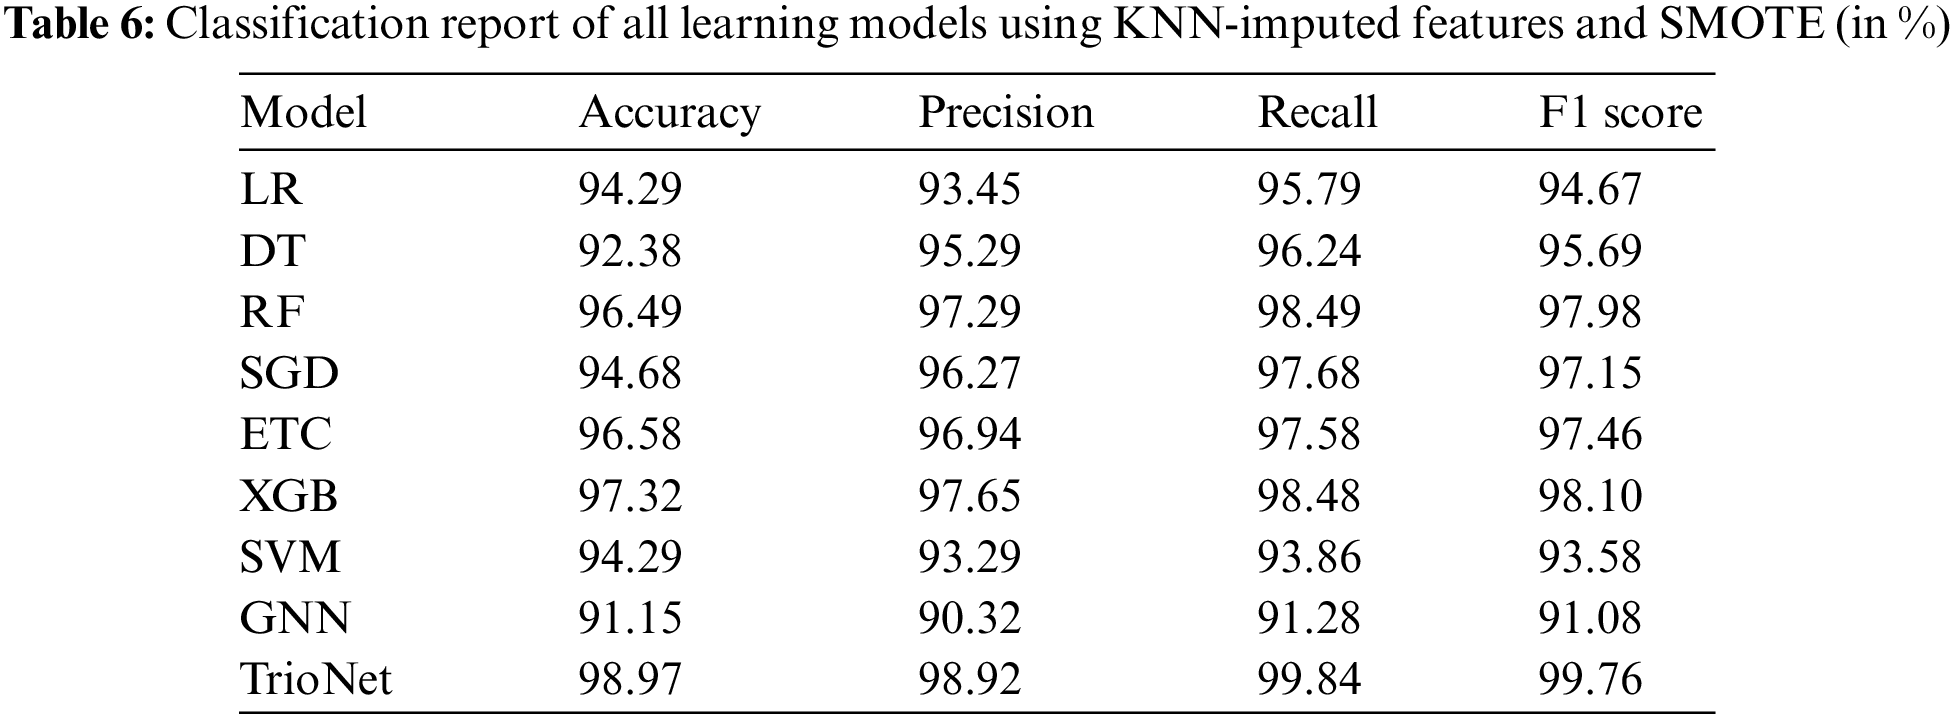
Experiment findings indicate that using KNN imputer and SMOTE enhances model performance. For example, the proposed voting classifier outperforms all other learning models with an accuracy of 98.97%. Furthermore, with 98.92% precision, 99.84% recall, and F1 score of 99.76%. The trioNet model achieves the greatest values in terms of all evaluation metrics. GNB has the worst performance with an accuracy score of 91.15%.
It is clear that TrioNet, which combines XGB, RF, and ETC, performs admirably and is especially successful for CKD diagnosis, resulting in higher accuracy and evaluation metrics when compared to other models, including the GNB.
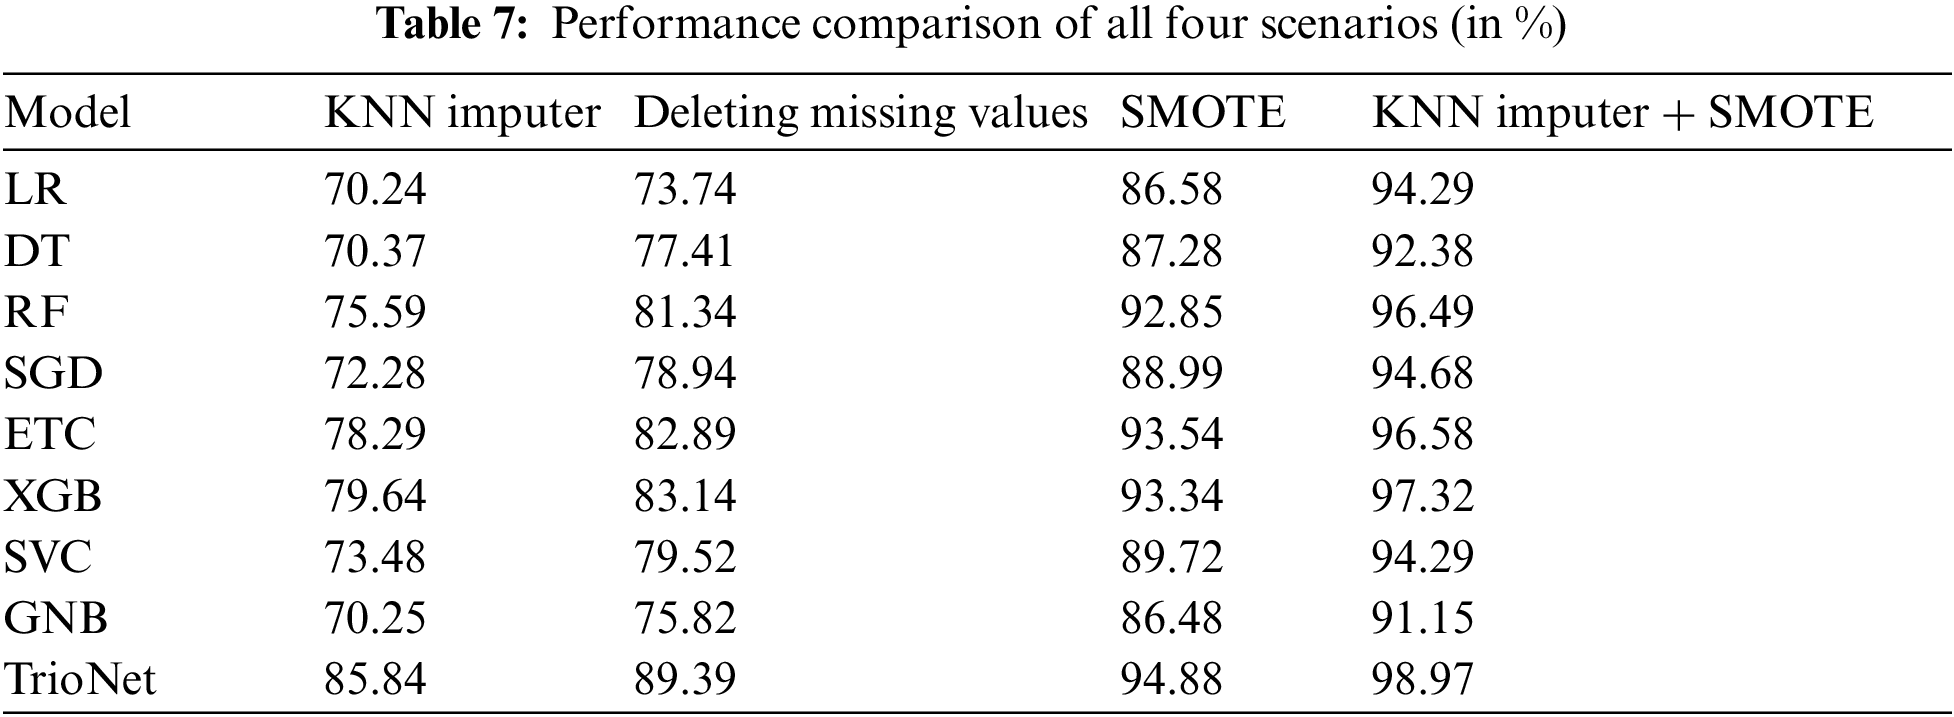
To evaluate the effectiveness of the KNN imputer and SMOTE, we conducted a comparison across four scenarios: (i) deletion of missing values, (ii) application of the KNN imputer, (iii) utilization of SMOTE for up-sampling, and (iv) a combination of both SMOTE and the KNN imputer. Our assessment revealed that the fourth scenario, involving the initial use of the KNN imputer followed by SMOTE for up-sampling, exhibited significant improvement over the other three experiments. For a comprehensive performance analysis and clarity, please refer to Table 7 which displays the results of the machine learning models in all scenarios.
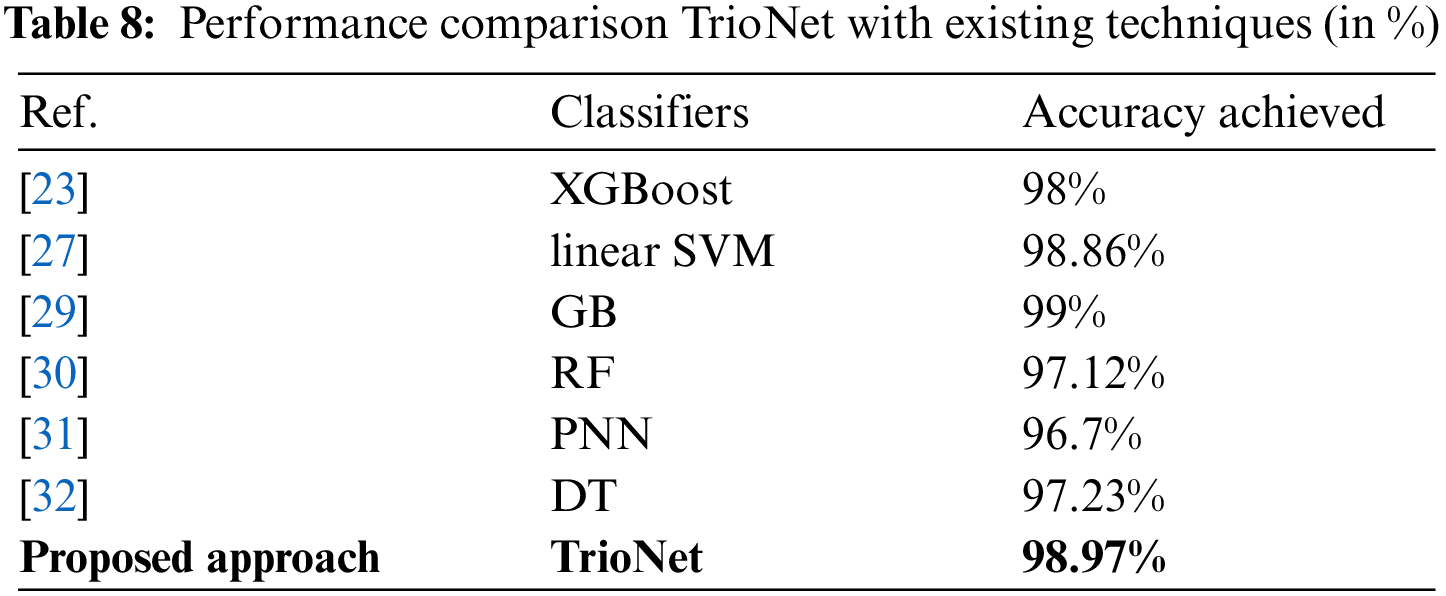
5.6 Comparison with State-of-the-Art Techniques
In this section, a comparison with state-of-the-art CKD detection models is performed. This review took into account a number of recent research from the literature that served as comparative points. In the study by [30], an accuracy of 97.12% was achieved. Reference [32] demonstrated that a tree-based model, DT, achieved an accuracy of 97.23%, whereas in [31], the PNN model was employed, resulting in a 96.7% accuracy. Furthermore, references [23] and [27] reported impressive accuracy scores of 98% and 98.86%, respectively. Despite the high reported accuracy in these studies, the proposed models displayed commendable results, as outlined in Table 8. The results indicate the competitive performance of our proposed approach compared to the state-of-the-art models, underscoring its effectiveness in CKD detection.
5.7 Challenges and Future Directions
The research discusses the development of TrioNet, an ensemble learning technique for the prognosis of kidney disease. The study does not extensively address external validation or transferability of the proposed model. One direction for future research involves conducting clinical validation studies in collaboration with healthcare institutions. Real-world testing of TrioNet within clinical settings can provide valuable insights into its effectiveness and practical utility. It enables the model to be evaluated in the context of real patient cases and healthcare workflows, allowing us to assess its impact on clinical decision-making and patient outcomes. Consider integrating various data types (e.g., imaging, genetic, clinical notes) for a more comprehensive patient profile, which may lead to more accurate predictions. In Future research, TrioNet’s performance will be evaluated on diverse datasets to ensure its applicability in different clinical settings. Real-world testing can provide insights into the model’s effectiveness and practical utility.
Kidney disease, a prevalent health concern, encompasses a range of conditions affecting the vital filtration and regulatory functions of the kidneys. The growing incidence of kidney disease underscores the need for comprehensive research aimed at early detection, accurate diagnosis, and effective management strategies. This research introduces a comprehensive framework designed to accurately diagnose chronic kidney disease in patients, comprising two distinct segments. The initial phase involves dataset normalization through the utilization of KNN-imputed and SMOTE techniques. The proposed TrioNet model encompasses XGB, RF, and ETC models. The exceptional accuracy of 98.97% observed in the results underscores the capability of ensemble models to furnish a potential solution for the early identification of chronic kidney disease. A comparison against state-of-the-art models further highlights the superiority of the proposed model. The forthcoming trajectory of this research aims to extend the approach by creating a stacked ensemble that combines both machine learning and deep learning models. This expansion seeks to elevate the model’s performance in handling datasets of greater dimensionality, thus yielding more generalized and robust outcomes.
Acknowledgement: This research was funded by Princess Nourah bint Abdulrahman University Researchers Supporting Project Number PNURSP2023R333, Princess Nourah bint Abdulrahman University, Riyadh, Saudi Arabia.
Funding Statement: This research was funded by Princess Nourah bint Abdulrahman University Researchers Supporting Project Number PNURSP2024R333, Princess Nourah bint Abdulrahman University, Riyadh, Saudi Arabia.
Author Contributions: study conception and design: Muhammad Umer, Nazik Alturki, Oumaima Saidani, and Amal Alshardan; data collection: Shtwai Alsubai, Abdulaziz Altamimi and Muhammad Umer; analysis and interpretation of results: Muhammad Umer, Marwan Omar, and Shtwai Alsubai; draft manuscript preparation: Muhammad Umer, Imran Ashraf, Nazik Alturki, Oumaima Saidani, and Amal Alshardan; funding: Abdulaziz Altamimi, Nazik Alturki. All authors reviewed the results and approved the final version of the manuscript.
Availability of Data and Materials: All the data related to the development of the proposed model can be found upon suitable request from the corresponding authors.
Conflicts of Interest: The authors declare that they have no conflicts of interest to report regarding the present study.
References
1. NIH (2018). Your kidneys, how they work-niddk. https://www.niddk.nih.gov/health-information/kidney-disease/kidneys-how-they-work#::~:text=Each%20of% (accessed on 09/09/2023). [Google Scholar]
2. Foundation, N. K. (2020). Kidney disease: The basics. https://www.kidney.org/news/newsroom/factsheets/KidneyDiseaseBasics (accessed on 09/09/2023). [Google Scholar]
3. Reiser, J. (2011). Filtering new facts about kidney disease. Nature Medicine, 17(1), 44–45. [Google Scholar] [PubMed]
4. Dan, Z., Zhao, Y., Bi, X., Wu, L., Ji, Q. (2022). Multi-task transformer with adaptive cross-entropy loss for multi-dialect speech recognition. Entropy, 24(10), 1429. [Google Scholar] [PubMed]
5. Yang, Y., Tian, Z., Song, M., Ma, C., Ge, Z. et al. (2022). Detecting the critical states of Type 2 diabetes mellitus based on degree matrix network entropy by cross-tissue analysis. Entropy, 24(9), 1249. [Google Scholar] [PubMed]
6. Furman, D., Campisi, J., Verdin, E., Carrera-Bastos, P., Targ, S. et al. (2019). Chronic inflammation in the etiology of disease across the life span. Nature Medicine, 25(12), 1822–1832. [Google Scholar] [PubMed]
7. Koye, D. N., Magliano, D. J., Nelson, R. G., Pavkov, M. E. (2018). The global epidemiology of diabetes and kidney disease. Advances in Chronic Kidney Disease, 25(2), 121–132. [Google Scholar] [PubMed]
8. Care, U. (2020). Kidney (renal) failure. https://www.urologyhealth.org/urology-a-z/k/kidney-(renal)-failure (accessed on 09/09/2023). [Google Scholar]
9. Abdel-Kader, K. (2022). Symptoms with or because of kidney failure? Clinical Journal of the American Society of Nephrology, 17(4), 475–477. [Google Scholar] [PubMed]
10. Ruiz-Arenas, R., Sierra-Amor, R., Seccombe, D., Raymondo, S., Graziani, M. S. et al. (2017). A summary of worldwide national activities in chronic kidney disease (CKD) testing. EJIFCC, 28(4), 302–314. [Google Scholar] [PubMed]
11. Star, D. (2019). Over 35,000 develop kidney failure in bangladesh every year. https://www.thedailystar.net/city/news/18m-kidney-patients-bangladesh-every-year-1703665 (accessed on 09/09/2023). [Google Scholar]
12. Desk, P. A. E. (2020). Women affected at work and in businesses. https://en.prothomalo.com/bangladesh/roundtable/women-affected-in-workplaces-and-businesses (accessed on 09/09/2023). [Google Scholar]
13. Reshma, S., Shaji, S., Ajina, S. R., Vishnu Priya, S. R., Janisha, A. (2020). Chronic kidney disease prediction using machine learning. International Journal of Engineering Research and, 9(7). https://doi.org/10.17577/ijertv9is070092 [Google Scholar] [CrossRef]
14. Deepika, B., Rao, V., Rampure, D. N., Prajwal, P., Gowda, D. et al. (2020). Early prediction of chronic kidney disease by using machine learning techniques. American Journal of Computer Science and Engineering Survey, 8(2), 7. [Google Scholar]
15. Nimmagadda, S. M., Agasthi, S. S., Shai, A., Khandavalli, D. K. R., Vatti, J. R. (2023). Kidney failure detection and predictive analytics for ckd using machine learning procedures. Archives of Computational Methods in Engineering, 30(4), 2341–2354. [Google Scholar]
16. Su, Q., Wang, F., Chen, D., Chen, G., Li, C. et al. (2022). Deep convolutional neural networks with ensemble learning and transfer learning for automated detection of gastrointestinal diseases. Computers in Biology and Medicine, 150, 106054. [Google Scholar] [PubMed]
17. Yu, X., Qin, W., Lin, X., Shan, Z., Huang, L. et al. (2023). Synergizing the enhanced rime with fuzzy K-nearest neighbor for diagnose of pulmonary hypertension. Computers in Biology and Medicine, 165, 107408. [Google Scholar] [PubMed]
18. Devarajan, G. G., Nagarajan, S. M., Amanullah, S. I., Mary, S. S. A., Bashir, A. K. (2023). AI-assisted deep NLP-based approach for prediction of fake news from social media users. IEEE Transactions on Computational Social Systems, 1–11. https://doi.org/10.1109/TCSS.2023.3259480 [Google Scholar] [CrossRef]
19. Ekanayake, I. U., Herath, D. (2020). Chronic kidney disease prediction using machine learning methods. 2020 Moratuwa Engineering Research Conference (MERCon), Moratuwa, Sri Lanka, IEEE. [Google Scholar]
20. Ullah, Z., Jamjoom, M. (2022). Early detection and diagnosis of chronic kidney disease based on selected predominant features. Journal of Healthcare Engineering, 2023, 3553216. https://doi.org/10.1155/2023/3553216 [Google Scholar] [PubMed] [CrossRef]
21. Khalid, H., Khan, A., Zahid Khan, M., Mehmood, G., Shuaib Qureshi, M. et al. (2023). Machine learning hybrid model for the prediction of chronic kidney disease. Computational Intelligence and Neuroscience, 2023, 9266889. https://doi.org/10.1155/2023/9266889 [Google Scholar] [PubMed] [CrossRef]
22. Abdel-Fattah, M. A., Othman, N. A., Goher, N. (2022). Predicting chronic kidney disease using hybrid machine learning based on apache spark. Computational Intelligence and Neuroscience, 2022, 9898831. https://doi.org/10.1155/2022/9898831 [Google Scholar] [PubMed] [CrossRef]
23. Venkatesan, V. K., Ramakrishna, M. T., Izonin, I., Tkachenko, R., Havryliuk, M. (2023). Efficient data preprocessing with ensemble machine learning technique for the early detection of chronic kidney disease. Applied Sciences, 13(5), 2885. [Google Scholar]
24. Kumar, K., Pradeepa, M., Mahdal, M., Verma, S., RajaRao, M. et al. (2023). A deep learning approach for kidney disease recognition and prediction through image processing. Applied Sciences, 13(6), 3621. [Google Scholar]
25. Dritsas, E., Trigka, M. (2022). Machine learning techniques for chronic kidney disease risk prediction. Big Data and Cognitive Computing, 6(3), 98. [Google Scholar]
26. Revathy, S., Bharathi, B., Jeyanthi, P., Ramesh, M. (2019). Chronic kidney disease prediction using machine learning models. International Journal of Engineering and Advanced Technology, 9(1), 6364–6367. [Google Scholar]
27. Chittora, P., Chaurasia, S., Chakrabarti, P., Kumawat, G., Chakrabarti, T. et al. (2021). Prediction of chronic kidney disease–A machine learning perspective. IEEE Access, 9, 17312–17334. [Google Scholar]
28. Swain, D., Mehta, U., Bhatt, A., Patel, H., Patel, K. et al. (2023). A robust chronic kidney disease classifier using machine learning. Electronics, 12(1), 212. [Google Scholar]
29. Almasoud, M., Ward, T. E. (2019). Detection of chronic kidney disease using machine learning algorithms with least number of predictors. International Journal of Advanced Computer Science and Applications, 10(8). https://doi.org/10.14569/IJACSA.2019.0100813 [Google Scholar] [CrossRef]
30. Yashfi, S. Y., Islam, M. A., Sakib, N., Islam, T., Shahbaaz, M. et al. (2020). Risk prediction of chronic kidney disease using machine learning algorithms. 2020 11th International Conference on Computing, Communication and Networking Technologies (ICCCNT), Kharagpur, India, IEEE. [Google Scholar]
31. Rady, E. H. A., Anwar, A. S. (2019). Prediction of kidney disease stages using data mining algorithms. Informatics in Medicine Unlocked, 15, 100178. [Google Scholar]
32. Tekale, S., Shingavi, P., Wandhekar, S., Chatorikar, A. (2018). Prediction of chronic kidney disease using machine learning algorithm. International Journal of Advanced Research in Computer and Communication Engineering, 7(10), 92–96. [Google Scholar]
33. Machine Learning University (2015). Chronic_kidney_disease. https://archive.ics.uci.edu/ml/datasets/Chronic_Kidney_Disease (accessed on 09/09/2023). [Google Scholar]
34. Umer, M., Sadiq, S., Missen, M. M. S., Hameed, Z., Aslam, Z. et al. (2021). Scientific papers citation analysis using textual features and smote resampling techniques. Pattern Recognition Letters, 150, 250–257. [Google Scholar]
35. Shafiq, M., Tian, Z., Bashir, A. K., Jolfaei, A., Yu, X. (2020). Data mining and machine learning methods for sustainable smart cities traffic classification: A survey. Sustainable Cities and Society, 60, 102177. [Google Scholar]
36. Juna, A., Umer, M., Sadiq, S., Karamti, H., Eshmawi, A. et al. (2022). Water quality prediction using KNN imputer and multilayer perceptron. Water, 14(17), 2592. [Google Scholar]
37. Breiman, L. (2001). Random forests. Machine Learning, 45, 5–32. [Google Scholar]
38. Iwendi, C., Bashir, A. K., Peshkar, A., Sujatha, R., Chatterjee, J. M. et al. (2020). Covid-19 patient health prediction using boosted random forest algorithm. Frontiers in Public Health, 8, 357. [Google Scholar] [PubMed]
39. Ashraf, I., Narra, M., Umer, M., Majeed, R., Sadiq, S. et al. (2022). A deep learning-based smart framework for cyber-physical and satellite system security threats detection. Electronics, 11(4), 667. [Google Scholar]
40. Friedman, J. H. (2001). Greedy function approximation: A gradient boosting machine. The Annals of Statistics, 29(5), 1189–1232. http://www.jstor.org/stable/2699986 (accessed on 30/12/2023). [Google Scholar]
41. Besharati, E., Naderan, M., Namjoo, E. (2019). LR-HIDS: Logistic regression host-based intrusion detection system for cloud environments. Journal of Ambient Intelligence and Humanized Computing, 10(9), 3669–3692. [Google Scholar]
42. Umer, M., Sadiq, S., Nappi, M., Sana, M. U., Ashraf, I. et al. (2022). ETCNN: Extra tree and convolutional neural network-based ensemble model for COVID-19 tweets sentiment classification. Pattern Recognition Letters, 164, 224–231. [Google Scholar] [PubMed]
43. Kumar, V. A., Sharmila, S., Kumar, A., Bashir, A., Rashid, M. et al. (2021). A novel solution for finding postpartum haemorrhage using fuzzy neural techniques. Neural Computing and Applications, 35, 1–14. https://doi.org/10.1007/s00521-020-05683-z [Google Scholar] [CrossRef]
44. Geurts, P., Ernst, D., Wehenkel, L. (2006). Extremely randomized trees. Machine Learning, 63, 3–42. [Google Scholar]
45. Sarwat, S., Ullah, N., Sadiq, S., Saleem, R., Umer, M. et al. (2022). Predicting students’ academic performance with conditional generative adversarial network and deep SVM. Sensors, 22(13), 4834. [Google Scholar] [PubMed]
46. Zhang, Y. D., Wang, S. H., Yang, X. J., Dong, Z. C., Liu, G. et al. (2015). Pathological brain detection in mri scanning by wavelet packet tsallis entropy and fuzzy support vector machine. SpringerPlus, 4(1), 1–16. [Google Scholar]
47. Manzoor, M., Umer, M., Sadiq, S., Ishaq, A., Ullah, S. et al. (2021). RFCNN: Traffic accident severity prediction based on decision level fusion of machine and deep learning model. IEEE Access, 9, 128359–128371. [Google Scholar]
48. Shahzad Farooq, S., Fiaz, M., Mehmood, I., Kashif Bashir, A., Nawaz, R. et al. (2021). Multi-modal data analysis based game player experience modeling using LSTM-DNN. Computers, Materials & Continua, 68(3), 4087–4108. https://doi.org/10.32604/cmc.2021.015612 [Google Scholar] [CrossRef]
49. Majeed, R., Abdullah, N. A., Faheem Mushtaq, M., Umer, M., Nappi, M. (2021). Intelligent cyber-security system for IoT-aided drones using voting classifier. Electronics, 10(23), 2926. [Google Scholar]
50. Rish, I. (2001). An empirical study of the naive bayes classifier. JCAI 2001 Workshop on Empirical Methods in Artificial Intelligence, vol. 3. Seattle, Washington, USA. [Google Scholar]
Cite This Article
 Copyright © 2024 The Author(s). Published by Tech Science Press.
This work is licensed under a Creative Commons Attribution 4.0 International License , which permits unrestricted use, distribution, and reproduction in any medium, provided the original work is properly cited.
 Downloads
 Citation Tools