
 Submit a Paper
 Propose a Special lssue
 Open Access
ARTICLE

Contact Stress Reliability Analysis Model for Cylindrical Gear with Circular Arc Tooth Trace Based on an Improved Metamodel
1 School of Intelligent Manufacturing & Automobile, Chengdu Industrial Vocational Technical College, Chengdu, 610218, China
2 School of Intelligent Manufacturing, Panzhihua University, Panzhihua, 617000, China
3 School of Electrical Engineering, Chengdu Industry and Trade College, Chengdu, 601165, China
4 School of Mechanical Engineering, Sichuan University, Chengdu, 601165, China
5 Chengdu Technological University, Chengdu, 611730, China
* Corresponding Author: Yang Wu. Email:
(This article belongs to the Special Issue: Computer-Aided Uncertainty Modeling and Reliability Evaluation for Complex Engineering Structures)
Computer Modeling in Engineering & Sciences 2024, 140(1), 593-619. https://doi.org/10.32604/cmes.2023.046319
Received 26 September 2023; Accepted 21 November 2023; Issue published 16 April 2024
 View Full Text
 Download PDF
Abstract
Although there is currently no unified standard theoretical formula for calculating the contact stress of cylindrical gears with a circular arc tooth trace (referred to as CATT gear), a mathematical model for determining the contact stress of CATT gear is essential for studying how parameters affect its contact stress and building the contact stress limit state equation for contact stress reliability analysis. In this study, a mathematical relationship between design parameters and contact stress is formulated using the Kriging Metamodel. To enhance the model’s accuracy, we propose a new hybrid algorithm that merges the genetic algorithm with the Quantum Particle Swarm optimization algorithm, leveraging the strengths of each. Additionally, the “parental inheritance + self-learning” optimization model is used to fine-tune the Kriging Metamodel’s parameters. Following this, a mathematical model for calculating the contact stress of Variable Hyperbolic Circular-Arc-Tooth-Trace (VH-CATT) gears using the optimized Kriging model was developed. We then examined how different gear parameters affect the VH-CATT gears’ contact stress. Our simulation results show: (1) Improvements in R2, RMSE, and RMAE. R2 rose from 0.9852 to 0.9974 (a 1.22% increase), nearing 1, suggesting the optimized Kriging Metamodel’s global error is minimized. Meanwhile, RMSE dropped from 3.9210 to 1.6492, a decline of 57.94%. The global error of the GA-IQPSO-Kriging algorithm was also reduced, with RMAE decreasing by 58.69% from 0.1823 to 0.0753, showing the algorithm’s enhanced precision. In a comparison of ten experimental groups selected randomly, the GA-IQPSO-Kriging and FEM-based contact analysis methods were used to measure contact stress. Results revealed a maximum error of 12.11667 MPA, which represents 2.85% of the real value. (2) Several factors, including the pressure angle, tooth width, modulus, and tooth line radius, are inversely related to contact stress. The descending order of their impact on the contact stress is: tooth line radius > modulus > pressure angle > tooth width. (3) Complex interactions are noted among various parameters. Specifically, when the tooth line radius interacts with parameters such as pressure angle, tooth width, and modulus, the resulting stress contour is nonlinear, showcasing a multifaceted contour plane. However, when tooth width, modulus, and pressure angle interact, the stress contour is nearly linear, and the contour plane is simpler, indicating a weaker coupling among these factors.Keywords
Gears are fundamental components in mechanical equipment [1]. Their widespread application in sectors such as aviation, wind power, automotive, and energy can be attributed to attributes like high transmission efficiency, robust carrying capacity, consistent transmission ratio, and prolonged service life [2,3]. The CATT gear, first introduced by Japanese scholars, stands out due to its distinctive design [4]. The gear’s tooth trace follows a curved arc, allowing its tooth profile to be an involute, arc, or parabola. Such gears boast multiple advantages: high contact rate, formidable bearing capacity, absence of axial force, extensive contact, peak transmission efficiency, lasting service life, superior flatness, and reduced noise. Research on the meshing theory and contact characteristics of CATT gear has been ongoing since its inception. Tseng et al. developed the mathematical model, root cutting condition, contact characteristics, and transmission error of CATT gear milling with a straight-edged rotary cutter [5,6]. Zhao et al. delved into the forming principle of milling circular arc gears using a rotating tool. They established the tooth flanks equation for CATT gear with a variable hyperbolic arc tooth profile, which includes the transitional tooth flanks equation. Additionally, they introduced a calculation method covering the full range of tooth flank parameters [7,8]. Ma et al. explored the reconstruction method for tooth flanks of CATT gear with a variable hyperbolic arc tooth profile, demonstrating that the middle section adopts an involute profile while the rest follows a hyperbolic envelope [9]. Luo et al. formulated equations to compute the principal curvature, induced curvature, and sliding rate of the tooth surface for CATT gear with the said profile and observed their variable trends [10]. Wei et al. formulated a new contact stress equation for this gear profile, accounting for factors like normal force, total bearing length, comprehensive curvature radius, and position angle [11]. Fuentes Aznar et al. compared stress and transmission errors among spur gear, helical gear, and circular arc gear using the finite element method [12]. Zhang et al. introduced a mathematical model for line-contact CATT gear and assessed its contact characteristics [13]. Ma et al. examined mismatched meshing transmission theory for symmetric curved cylindrical gears and analyzed real-time tooth contact during the full meshing process [14]. Guo et al. provided an analytical solution for the contact characteristics of VH-CATT gear, accounting for the elastic deformation of tooth flanks. They further studied its parameters on the gear’s contact characteristics [15]. Chen et al. presented a computer-aided design method for curved cylindrical gears, emphasizing the active design of the meshing line function. They investigated meshing attributes, mechanical properties, and meshing line function parameters concerning contact mode, maximum stress variation, and transmission error load function [16]. Zhang et al. evaluated the impact of design parameters, such as tool radius, on contact and meshing characteristics [17]. They also crafted a contact stress prediction model for VH-CATT gear using an enhanced metamodel and considered the effects of parameter changes on contact stress [18]. Another study established the reliability analysis model for cylindrical gear with a variable hyperbolic circular arc tooth line. This work delved into the reliability sensitivity and robust optimization of contact strength [19,20].
Metamodel is an effective method to establish contact stress calculation model for CATT gear. The commonly used metamodels include Kriging, RBF, SVM.GEP, etc. Kriging model is the moswidely used, in order to improve the accuracy of Kriging model, scholars use intelligent algorithms to optimize the parameters of Kriging. Pholdee et al. used genetic algorithm to optimize Kriging’s correlation function parameters to improve the accuracy of their model [21]. Qin et al. proposed a new kriging method based on the AK-IS and truncated importance sampling method, whale optimization algorithm (WOA) was used to optimize the proposed model and improve its fitting accuracy [22]. Zhang et al. proposed an improved Kriging optimization model based on an improved QPSO algorithm, in which all performance indexes were improved [18]. Thedy et al. proposed an adaptive kriging algorithm based on PSO algorithm to improve the working characteristics of the model [23].
The contact stress limit state equation is the basis of reliability analysis of gear contact stress. The limit state equation is obtained by subtracting the actual gear contact stress that calculated by the contact stress prediction model from the allowable contact stress of the material. The calculation of contact stress in CATT gear relies heavily on a precise mathematical model, which is pivotal for examining how various parameters impact this stress. In order to solve the problem that there is currently no unified standard theoretical formula for calculating the contact stress of cylindrical gears with a circular arc tooth trace, and to build the contact stress limit state equation for reliability analysis. This paper introduces a mathematical model that links the CATT gear’s design parameters with its contact stress, utilizing the kriging metamodel. To heighten the accuracy of this model’s fit, we present a new hybrid algorithm that merges the genetic algorithm with the Quantum Particle Swarm optimization algorithm. To further optimize the parameters of the kriging metamodel, we have implemented an optimal model based on “parental inheritance + self-learning.” With the enhanced Kriging metamodel in place, we have established a refined mathematical model to compute the CATT gear’s contact stress and subsequently explore how its design parameters influence this stress.
The paper are organized as below: the forming principle and mathematical model of the VH-CATT gear are introduced in Section 2. The finite element model for contact stress analysis on the VH-CATT gear are established in the Section 3. Contact stress reliability analysis model for VH-CATT gear based on an improved metamodel by using a new hybrid algorithm that merges the genetic algorithm with the Quantum Particle Swarm optimization algorithm are developed in Section 4. The efficacy of the GA-IQPSO hybrid intelligent algorithm introduced for optimizing Kriging are tested and a contact stress prediction model for VH-CATT gear using the proposed GA-IQPSO-Kriging model are established in Section 5. And the Influence of design parameters on contact stress of the VH-CATT gear are discussed in Section 6. Section 7 provides the conclusion of this study.
2 VH-CATT Forming Principle and Mathematical Model
The geometric structure of the VH-CATT gear (hereafter referred to simply as “VH-CATT gear”) is depicted in Fig. 1. The gear is milling by a rotary cutter with a straight cutter edge, and the gear tooth line obtained by cutter milling is a space circular arc line. The tooth profile found in the middle section is an involute line, while the other sections consist of envelope lines from a hypercurve family with consistent transitions, so it is called VH-CATT [24]. These features make the gear less sensitive to coaxiality installation errors, resulting in benefits such as reduced noise, a high degree of alignment, and a simplified structure. Regarding machining, the VH-CATT gear can be crafted using several methods, as outlined by. These methods are rotary cutter milling, gear hobbing, translation-device milling, and angle cutter milling. Among these, the rotary cutter milling method stands out because of its ability to employ either a single or double blade for milling, combined with its straightforward machine structure and high processing efficiency. Consequently, this study utilizes a rotary double-edge milling cutter to mill the VH-CATT gear. The virtual machine prototype for this gear is presented in Fig. 2. This prototype comprises various components: a bed (1), a cutter (2), a tool (3), a Z-axis mechanism (4), an X-axis mechanism (5), a tooth blank (6), indexing mechanism (7), and Y-axis mechanism (8).

Figure 1: VH-CATT gear

Figure 2: Machine virtual prototype for VH-CATT gear
The machine tool spindle has a rotating double-edged milling cutter referenced as (2). This cutter, denoted as (3), is firmly attached to the spindle tool (2) and rotates with it. As the cutter spins, its blade forms two distinct conical surfaces. The outer edge of the cutter produces a positive cone suitable for machining concave surfaces. In contrast, the inner edge forms an inverted cone designed for machining convex surfaces. Throughout the machining process, the gear blank (6) both rotates around its axis and moves back and forth along the Y-axis, coordinating closely with the motion of the cutting tool. This enables the cutting tool to shape both the concave and convex flanks of the gear teeth simultaneously. After finishing one tooth space (or alveoli), the gear blank shifts position using the indexing mechanism (7) to start machining the next one. This sequence continues until the entire gear is precisely machined.
2.2 VH-CATT Gear Mathematical Model
The coordinate system for machining with the VH-CATT double-edged rotary cutter gear is illustrated in Fig. 3.

Figure 3: Coordinate system of double-edge cutting VH-CATT gear
The machined gear has a reference radius of Rg, a rotation angle of ψ, a cutter head radius of Rt, a rotation angle of θ, and a tooth width of B.
2.2.2 Revolution Surface Equation of Tool and Its Normal Vector
The equation for the revolution surface of the tool in
where Rt is the cutter head’s nominal radius, ∓ or ± is the inner (or outer) cutting edge,
Its vector equation in
After differentiating, we obtain:
The revolution surface equation of the tool and its normal vector can be expressed as:
2.2.3 Meshing Condition and Equation for the Line of Contact
The velocities of the tooth blank and the tool at the engagement point are denoted as vt and vg where vtg is the relative speed of the gear and tool at the engagement point. Therefore, the gear workpiece and the tool must satisfy the specified mesh conditions.
Assuming M represents the immediate contact point between the tool and the gear workpiece, the vectors originating from Ot and Og and leading to M are denoted, respectively.
where
Then,
According to the Eqs. (15) and (16),
The equation that describes the contact line between the tool and the gear workpiece is derived from the path followed by the contact point within a fixed coordinate system based on the meshing principle:
In the process of gear processing, the motion trajectory of the contact point between the tool and the gear workpiece in the fixed coordinate system is the contact line between the tool and the gear workpiece. The tooth flanks equation can be obtained by transforming the line of contact equation into the Od-xd, yd, zd coordinate system. Therefore, it is necessary to establish the transformation matrix between coordinates Ot-xt, yt, zt and Od-xd, yd, zd.
The transformation matrix Mgt from the Ot-xt, yt, zt coordinate system to the Og-xg, yg, zg coordinate system is:
The transformation matrix Mdg from the Og-xg, yg, zg coordinate system to the Od-xd, yd, zd coordinate system is:
Then, the tooth’s surface equation can be obtained
Then,
3 Contact Stress Analysis for VH-CATT Gear Based on Finite Element
3.1 Gear Three-Dimensional Model
The 3D model of the VH-CATT gear was established using the gear modeling method described in previous studies [7,8]. The parameters of the VH-CATT gear investigated in this paper are shown in Table 1.

A single-gear and 5-tooth assembly model is shown in Fig. 4.
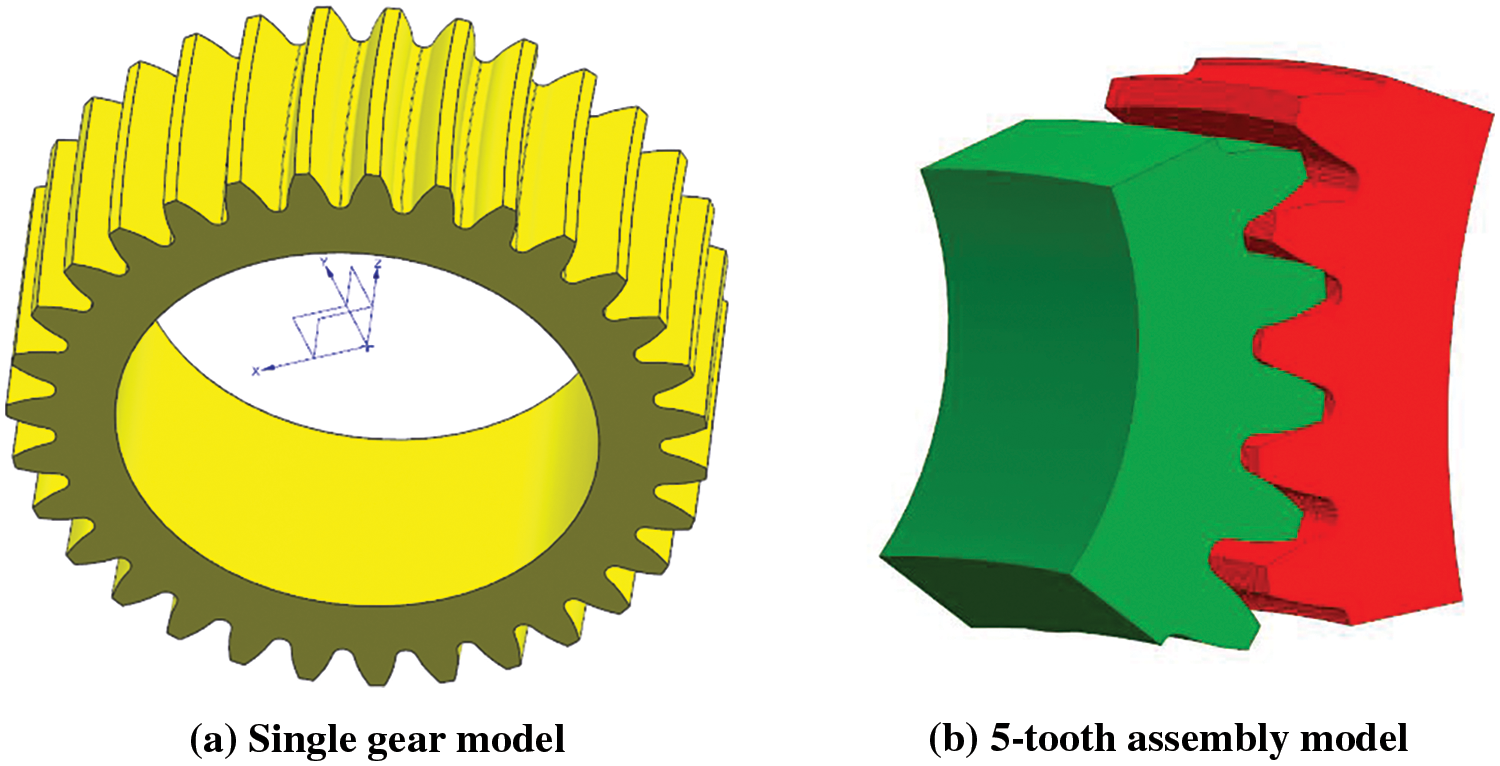
Figure 4: Three-dimensional model
3.2 Definition Material Property
CrNiMo6 was chosen as the gear material. Its primary composition includes C (0.15%–0.20%), Si (≤0.40%), Mn (0.40%–0.60%), S (≤0.035%), P (≤0.035%), Cr (1.50%–1.80%), Ni (1.40%–1.70%), and Mo (0.25%–0.35%). The mechanical properties of this material are as follows: σb (1180–1420 MPa), σs (835 MPa), δ (≥7%), ψ (≥30%), and αkv (≥41 J/cm2). The material also has an elasticity modulus (E) of 2.08 GPa and a Poisson’s ratio of 0.298. This material data for CrNiMo6 was input into ABAQUS and then applied to the VH-CATT gears.
3.3 Set Contact and Constraint Boundaries
The interaction was designated as “Static, General” and as “surface to surface contact (Standard)”, both illustrated in Fig. 5a. Using a nonlinear approach, the interaction type was defined as the contact. For the contact stress finite element analysis, the contact type is “Frictionless,” the numerical solution type is “Direct,” and the solution method follows the “Full Newton” approach. The MPC (multi-point constraint) originates from the rotation centers of both the active and the driven wheels. Except for its rotation axis, other directions of the driving wheel are fixed. Additionally, other rotation and translation axes are fixed. For the driven wheel, the MPC is both fixed and omnidirectional, as depicted in Fig. 5b.

Figure 5: Contact setting and constraint boundaries
The sweeping method was employed to segment the mesh of the gear pair, choosing the mesh type as C3D8I. For the entire gear, the finite element mesh size was set at 2 mm, while it was 0.02 mm for the contact area. Fig. 6 illustrates the results of the gear mesh segmentation. For the driving wheel, there were 171477 nodes and 161600 N.mm elements, all the C3D8I linear hexahedral element type. In contrast, the driven wheel had 181278 nodes and 171120 elements of the same C3D8I type. The combined total number of elements for both gears amounted to 332720.

Figure 6: Meshing results of gears
3.5 Solution and Visualization
After executing the “Definition Material Property,” “Set Contact and Constraint Boundaries,” and “Meshing” steps, the software was run to analyze the contact stress. Parallel computation in the solution was utilized due to the significant number of finite elements, totaling 332,720 for each gear pair. The finite element analysis provides the contact stress nephogram for the gear and pinion of VH-CATT gear, as shown in Fig. 7. Specifically, Fig. 7a depicts the contact stress nephogram for the pinion wheel of VH-CATT gear, while Fig. 7b showcases the stress nephogram for the driven wheel of VH-CATT gear. Fig. 8 details the contact area between the pinion wheel and the gear wheel of the VH-CATT gear. In Fig. 8a, the contact area for the pinion wheel of VH-CATT gear is presented, and Fig. 8b highlights the contact area for the gear wheel of VH-CATT gear.

Figure 7: Contact stress analysis results for the VH-CATT
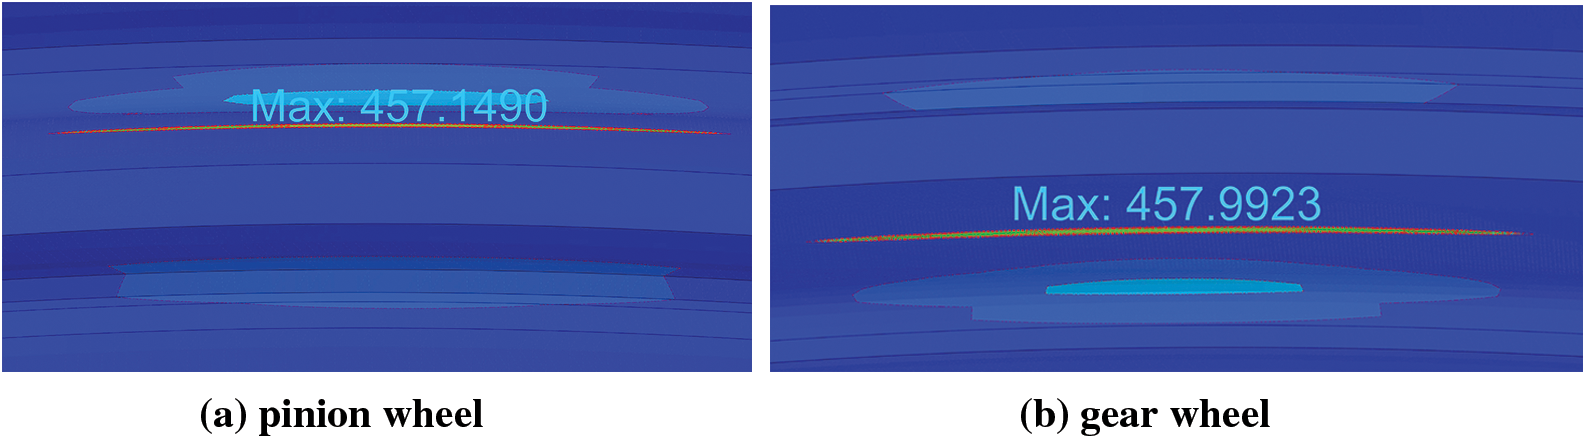
Figure 8: Contact area situation for VH-CATT
From Fig. 7, the maximum contact stress of the driving wheel is 457.149 MPA, found at the 82452 elements and 88592 nodes, while for the driven wheel, it is 457.9923 MPA, located at the 85072 elements and 91328 nodes. The difference in stress between the pinion wheel and the gear is 0.8433 MPA. The findings from our analysis method closely match the Hertz contact theory. Fig. 8 shows that the contact area between the pinion wheel and the gear becomes elliptical under load, which aligns with the theoretical expectations of VH-CATT. This confirms that the contact region for point contact gears is elliptical when subjected to load, further emphasizing that the contact type for a cylindrical gear with an arc tooth is point contact.
In summary, the contact region between the driving and driven wheels under load takes an elliptical shape, consistent with the theoretical model of VH-CATT gears. This reaffirms the elliptical nature of the contact area for VH-CATT gears under load.
4 Contact Stress Reliability Analysis Model for VH-CATT Gears Based on an Improved Metamodel
4.1 Test Design and Response Results
The probability density function (PDF) for variables adhering to a particular distribution can be represented as follows:
where N is the number of the variables,
If the design parameters such as modulus, pressure angle, tool radius, and tooth width follow a normal distribution, then:
where
According to reference [25], the contact characteristics of VH-CATT gear exhibit nonlinearity. Therefore, this paper selects appropriate values of

We used the orthogonal test method for our experimental design. As outlined in Table 2, our study considers four factors: pressure angle, tooth width, modulus, and tooth radius. Each of these factors has three parameter levels, necessitating the use of an L9(34) orthogonal test table. We employed finite element analysis to assess the contact stress for various combinations of these four factors, as presented in the L9(34) orthogonal table. The comprehensive results of the orthogonal test can be found in Table 3.

Full factor experiments were carried out on all factors in Table 2, and 9 test combinations in the orthogonal test were excluded. Among the remaining 72 test combinations, 5 combinations were randomly selected as the testing set, shown in the Table 4.

4.2.1 Principle of Kriging Metamodel
The Kriging model excels in fitting highly nonlinear functions. The fitting process can be understood as assigning linear weights to the response values of the known sampling function [18].
where
where
In Eq. (26), the accuracy of the Kriging model is influenced by a specific parameter. The optimization of the Kriging model’s accuracy can be addressed using the maximum likelihood estimation method.
To minimize the root mean square error (RMSE) between the predicted and actual values of the Kriging model, the following approximate expression of the Kriging model can be employed as:
where the
4.2.2 Accuracy Evaluation Indexes of Metamodel
The correlation coefficient (denoted as R2), root mean square error (RMSE), and relative maximum absolute error (RMAE) are commonly employed to evaluate the accuracy of the metamodel [18].
(1) Coefficient Correlation (R2)
(2) Root Mean Square Error (RMSE)
(3) Relative Maximum Absolute Error (RMAE)
In Eqs. (29) to (31), N represents the number of samples used to test the effectiveness of the model,
The Genetic Algorithm (GA) is an adaptive global optimization search algorithm inspired by the principles of “natural selection” and the “mechanism of favoring the strong and eliminating the weak” from biology. It emulates the processes of natural selection and genetic variation from biological evolution to find the optimal solution to a problem. GA is a subset of evolutionary computing and was first introduced by Professor John H. Holland from the University of Michigan. The execution of a genetic algorithm involves three fundamental genetic operations: selection, crossover, and mutation [26].
(1) Selection: Based on the principle of natural selection, which is often described as “survival of the fittest,” individuals with distinct characteristics are chosen from the initial population to form a new generation. Assume that in a D-dimensional target search space, the population size is lg, and the ith individual can be represented as:
(2) Crossover: The selected individuals are placed in the crossover pool. With a set probability, these individuals undergo crossover to generate a new set of individuals. In the nth generation, two individuals
where
(3) Mutation: During the crossover process, specific genetic information (represented by 1 and 0 s at particular positions) might get lost, leading to variation. To acquire new genetic information, it is essential to introduce a controlled degree of variation. For every position
where
The pseudo-code and process of the genetic algorithm are illustrated in Fig. 9.

Figure 9: Process and pseudo-code of genetic algorithm
4.4 IQPSO-Improved Quantum Particle Swarm Optimization
According to reference [18], the algorithm for updating the standard quantum particle swarm position is as follows:
The “Inertia weight” is a crucial parameter in the QPSO algorithm that signifies its search capability. A prominent issue with the QPSO algorithm is its tendency for premature local optimization and slow convergence. This issue arises because the inertia weight value diminishes as the number of iterations increases.
In reference [18], adaptive methods were employed to dynamically adjust these parameters. This approach effectively addresses the challenge of the algorithm prematurely settling into local optimization. Furthermore, a natural selection strategy is applied to diversify the particle swarm, which enhances the algorithm’s global search capabilities and hastens its convergence rate.
The evolution rate of individual particles is defined as:
where the population dispersion is defined as:
The improved quantum particle swarm position updating algorithm is as follows:
The enhanced QPSO algorithm incorporates both adaptive evolution speed and dynamic population dispersion. The adaptive evolutionary speed
4.5 Improved Kriging Based on GA-QPSO
A genetic algorithm promotes the transmission of superior genes from parents to offspring through processes such as selection, crossover, and mutation. This ensures a strong global search capability. However, its downside is an increase in computational time, which diminishes the efficiency of problem resolution. On the other hand, quantum particle swarm optimization (QUPSO) works by allowing particles to benchmark themselves against the best in their group. They then enhance their fitness by learning from the top performers emulating self-awareness and social learning mechanisms. While QPSO is straightforward to implement and converges rapidly, it tends to get trapped in local optima. As cited in reference [18], this paper introduces an adaptive approach to dynamically adjust QPSO parameters. This mitigates the issue of premature local optimization. Concurrently, a natural selection method was employed to sustain the diversity of the particle population. This boosts the overall search capability of QPSO, quickens its convergence speed, and increases efficiency.
Consequently, we devised a new hybrid algorithm termed genetic quantum particle swarm (GA-IQPSO). This method synergizes the strengths of both the genetic algorithm and the enhanced quantum particle swarm optimization. It fully capitalizes on the genetic algorithm’s superior gene transmission properties and the adaptive learning prowess of the improved quantum particle swarm approach. The “parental genetics + self-learning” optimization method it employs aligns more cohesively with biological evolution theories and learning development processes. Fig. 10 illustrates the optimization process of the GA-IQPSO algorithm [18].

Figure 10: The optimization process of the GA-IQPSO algorithm
As illustrated in Fig. 10, the algorithm begins by randomly generating l0 individuals (or particles) and performs a genetic operation. Based on fitness values, individuals are categorized into two groups: lb individuals with good performance and l0-lb individuals with poor performance. Genetic optimization was performed for lb individuals with good performance, and quantum particle swarm optimization was performed for l0-lb individuals with poor performance. New l0 individuals are obtained, and the above steps are repeated until the termination condition has been satisfied. The basic operation formula is shown in equations from (31)–(34) and (40)–(42).
GA-IQPSO algorithm was used to optimize the kriging model, and the mathematical model of gear contact stress prediction and analyzing influencing factors were obtained. The main flow of the model is shown in Fig. 11.

Figure 11: Improvement process of Kriging metamodel based on GA-IQPSO algorithm
4.6 Contact Stress Reliability Analysis Model for VH-CATT Gears
The contact stress reliability analysis model for VH-CATT gears are established based on the stress-strength interference model (shown in Fig. 12). The safety margin determined by conventional design methods in parts will attenuated, and the safety margin becomes smaller. The strength and stress distribution function is used from interval to crossover, and the crossover area is the unsafe area, which width is

Figure 12: Stress-strength interference mode
Assuming that the contact stress mathematical model of the VH-CATT gears established based on the proposed improved kriging metamodel based on GA-IQPSO algorithm is
According to the definition of reliability, the reliability is:
5.1 Numerical Simulation Analysis
To evaluate the efficacy of the GA-IQPSO hybrid intelligent algorithm introduced in this article for optimizing Kriging, we employed the MATLAB numerical simulation platform. Furthermore, to enhance the accuracy of the Kriging model, we established a contact stress prediction model for VH-CATT gear using the proposed GA-IQPSO-Kriging model. We assessed the optimization impact of the Kriging model using performance metrics such as R2, RMSE, and RMAE. The performance indicators before and after the optimization are presented in Table 5.

Table 3 reveals that the GA-IQPSO-Kriging algorithm demonstrates improved metrics over the unimproved Kriging model. Specifically, the R2 value increased from 0.9852 to 0.9974, an improvement of 1.22%, suggesting a superior approximation capability of the GA-IQPSO-Kriging algorithm. RMSE decreased from 3.9210 to 1.6492, marking an enhancement in performance by 57.94%. This indicates the GA-IQPSO-Kriging algorithm’s better ability to reproduce sample values with lower global errors. RMAE dropped from 0.1823 to 0.0753, a decline of 58.69%. A value of RMAE closer to 0 suggests that the GA-IQPSO-Kriging algorithm has reduced local errors and increased precision. Consequently, the GA-IQPSO-Kriging algorithm, as presented in this paper, possesses superior approximation, global precision, and local precision. The contact stress calculation and analysis model for VH-CATT gear demonstrates greater accuracy when employing the GA-IQPSO-Kriging algorithm than when using the unimproved Kriging model.
Fig. 13 illustrates the prediction outcomes of both the GA-IQPSO-Kriging and Kriging algorithms. Specifically, Fig. 13a presents the Kriging model’s predictions, while Fig. 13b displays those of the GA-IQPSO-Kriging model. It is evident from both Figs. 13a and 13b that the GA-IQPSO-Kriging model aligns closely with the sample data, showcasing superior fitting accuracy compared to the unimproved Kriging model.
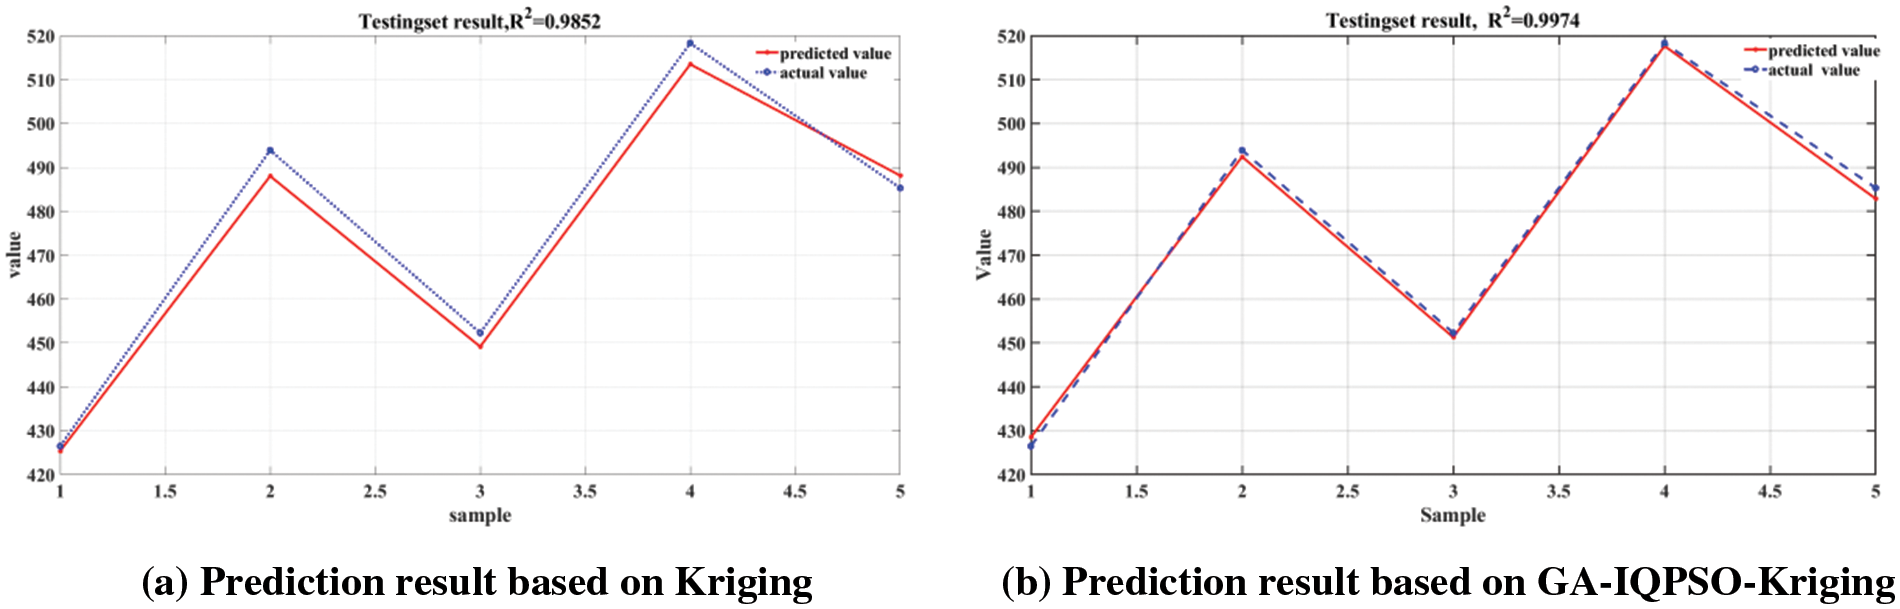
Figure 13: Residual diagram of GA-IQPSO-Kriging model
The residual diagrams for both the GA-IQPSO-Kriging algorithm and the Kriging algorithm are depicted in Fig. 14. Specifically, Fig. 14a presents the residual diagram for the Kriging model, while Fig. 14b illustrates the residual diagram for the GA-IQPSO-Kriging model.
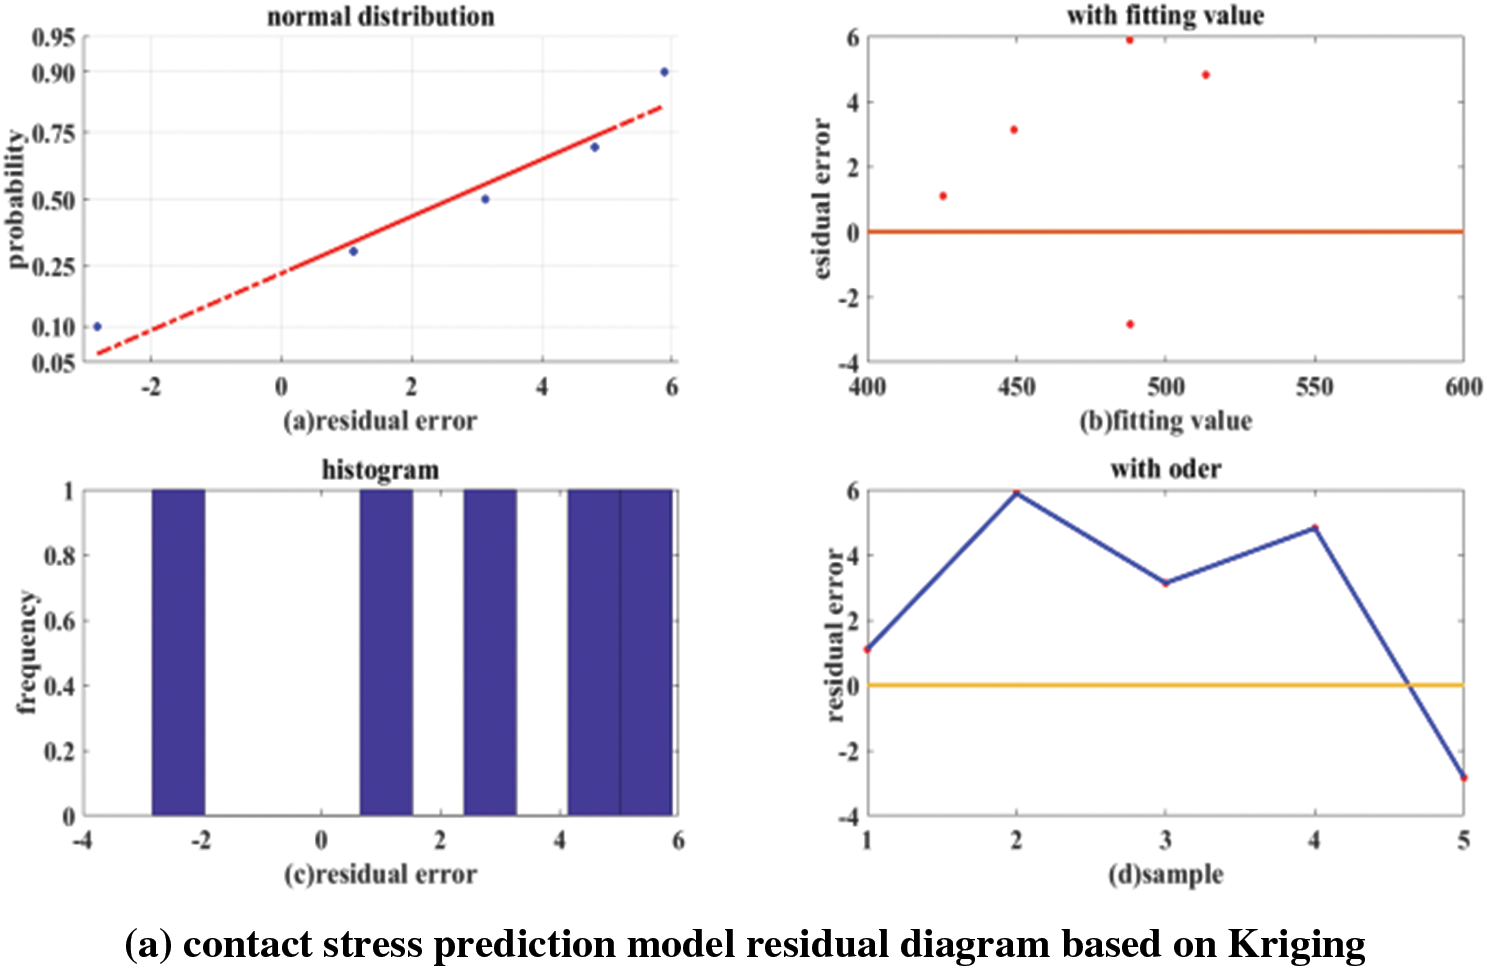

Figure 14: Residual diagram of contact stress prediction model
From Figs. 14a and 14b, it is evident that the GA-IQPSO-Kriging model introduced in this paper effectively restores sample data. Its prediction error lies within the range of [−3, 3]. In contrast, the prediction error for the Kriging model spans the interval [−3, 6]. Consequently, the error range of the Kriging model is notably greater than that of the enhanced GA-IQPSO-Kriging model.
5.2 Finite Element Verification
To evaluate the agreement between the proposed algorithm and the conventional finite element method, we randomly selected ten sets of parameters from the full-factor experiment. The contact stress was then computed using both the GA-IQPSO-Kriging and the finite element methods, the contact stress calculated by finite element methods was shown in the Fig. 15. The finite element analysis approach was set up in the same manner as previously described in this paper.

Figure 15: Finite element results for the verification set
The contact stress results from both GA-IQPSO-Kriging and finite element analysis are presented in Table 6.

Table 6 displays the contact stress calculations for ten randomly selected parameters using both the GA-IQPSO-Kriging algorithm and the finite element method. While there are discrepancies between the predicted results from GA-IQPSO-Kriging and those from the finite element analysis, the largest error is 12.11667 MPA, which represents only 2.85% of the actual value. Thus, the GA-IQPSO-Kriging model presented in this paper is effective for determining contact stresses and examining the impact of VH-CATT gear parameters.
6 Influence of Design Parameters on Contact Stress
The contact stress calculation model for VH-CATT gear was devised using the GA-IQPSO-Kriging model. We then analyzed how varying combinations of tooth width, modulus, pressure angle, and tooth line radius parameters impacted the VH-CATT gear’s contact stress. The results are displayed in Fig. 16, Fig. 16a depicts the contact stress variation due to the combined effects of tooth width and modulus. Fig. 16b presents the contact stress changes when tooth width and pressure angle are coupled. Fig. 16c illustrates the change in contact stress resulting from the combination of tooth width and tooth line radius. Fig. 16d demonstrates the contact stress alteration from the coupling of modulus and pressure angle. Fig. 16e showcases the contact stress changes due to the interplay of modulus and tooth line radius. Lastly, Fig. 16f displays the contact stress variations when pressure angle and tooth line radius are combined.

Figure 16: Contact stress in VH-CATT gears under the coupling of design parameters
Figs. 16a–16f demonstrate that variations in tooth width, modulus, pressure angle, and tooth line radius correlate negatively with contact stress. Specifically, the tooth line radius alteration leads to the most significant contact stress change, followed by the modulus and pressure angle. The last change in contact stress arises from modifications in tooth width.
From Figs. 16a to 16f, the cross coupling between different parameters causes the difference in the variation amplitude of gear contact stress. The variation range of contact stress of VH-CATT gear are as follows: variation [435.8, 484.6], [442.6, 469.1], [428.4, 507.4], [425.6, 494.8], [406.5, 529.5], [418.0, 517.5] MPA. From the range of gear contact stress change, the degree of influence on the contact stress of the gear from large to small is: Modulus-tooth line radius coupling changes > Pressure angle-tooth line radius coupling changes > Tooth width-tooth line radius coupling changes > Modulus-pressure angle coupling changes > Tooth width-modulus coupling changes > Tooth width-pressure angle coupling changes.
From Figs. 16a to 16c, it is evident that tooth width varies with modulus, pressure angle, and tooth line radius. The contact stress contour resulting from both the tooth width-modulus and tooth width-pressure angle interactions is gentle, showcasing a linear state. This suggests that these interactions do not produce highly complex contact stress contour planes and do not significantly affect contact stress. In contrast, the contour arising from the tooth width-tooth line radius interaction is less gentle, manifesting a nonlinear state. This implies a high complexity in the contact stress contour plane and signifies that the tooth width-tooth line radius interaction considerably influences the contact stress.
From Figs. 16d to 16e, the variation in modulus with both modulus-pressure angle and tooth line radius is clear. The contact stress contour plane driven by modulus-pressure angle interaction is smooth and linear, it, denoting low complexity and suggesting that this interaction does not notably affect the contact stress. However, the contour caused by the modulus-tooth line radius interaction changes sharply, revealing a nonlinear state. This denotes a high level of complexity and underscores the significant effect of the modulus-tooth line radius interaction on the contact stress.
From Fig. 16f, the nonlinear contours of contact stress due to the interaction between pressure angle and tooth line radius depict high complexity, signifying a strong influence on contact stress.
In summary, the tooth line radius exhibits notable coupling with other parameters, whereas the coupling among other parameters is relatively subtle.
(1) R2 improved from 0.9852 to 0.9974, moving closer to 1, suggesting the GA-IQPSO-Kriging algorithm’s enhanced global approximation capability. RMSE decreased from 3.9210 to 1.6492, reflecting a reduced global error. RMAE moved closer to 0, declining from 0.1823 to 0.0753, signifying the GA-IQPSO-Kriging algorithm’s reduced local error and heightened precision. When compared to the basic kriging model, the R2, RMSE, and RMAE have improved. The GA-IQPSO-Kriging algorithm introduced in this paper possesses superior approximation capacity, global accuracy, and local precision. This GA-IQPSO-Kriging model can effectively replicate sample data with a prediction error range between [−3, 3]. In contrast, the Kriging model’s prediction error spans from [−3, 6], marking a notably larger error range than the GA-IQPSO-Kriging model.
(2) The contact stress for the ten parameter sets chosen at random in the full factor experiment was computed using both GA-IQPSO-Kriging and the finite element method. The findings indicate that the maximum deviation is 12.11667 MPA, which represents 2.85% of the real value. Thus, the GA-IQPSO-Kriging model presented in this paper is apt for calculating contact stress and analyzing the influence of VH-CATT gear parameters.
(3) The modulus, tooth width, pressure angle, and tooth line radius all negatively impact contact stress. Altering the tooth line radius leads to the most notable shift in contact stress, followed by the modulus and pressure angle, with the tooth width causing the least variation in contact stress.
(4) As the tooth line radius interacts with the tooth width, modulus, and pressure angle, the contact stress contour is nonlinear and possesses a high level of complexity. There is a certain interconnectedness between the tooth line radius and the tooth width, modulus, and pressure angle. However, when the tooth width, modulus, and pressure angle parameters interact, the contact stress contour becomes nearly linear, and its complexity is considerably reduced. The interrelation between tooth width, modulus, and pressure angle is relatively minimal.
Acknowledgement: The authors thank TopEdit (www.topeditsci.com) for its linguistic assistance during the preparation of this manuscript.
Funding Statement: This work was supported by the National Natural Science Foundation of China (Project No. 51875370), the Natural Science Foundation of Sichuan Province (Project Nos. 2022NSFSC0454, 2022NSFSC1975), Sichuan Science and Technology Program (Project No. 2023ZYD0139), the University Key Laboratory of Sichuan in Process Equipment and Control Engineering (No. GK201905), Key Laboratory of Fluid and Power Machinery, Ministry of Education (No. LTDL2020-006).
Author Contributions: The authors confirm contribution to the paper as follows: study conception and design: Qi Zhang, Zhixin Chen, Yang Wu, Guoqi Xiang; forming principle and mathematical model: Qi Zhang, Yang Wu, Xuegang Zhang; contact analysis based on finite element: Yang Wu, Xuegang Zhang; Kriging Metamodel and optimization: Qi Zhang, Zhixin Chen, Guoqi Xiang; analysis and interpretation of results: Qi Zhang, Guang Wen, Xuegang Zhang, Yongchun Xie; draft manuscript preparation: Qi Zhang, Zhixin Chen, Yang Wu. All authors reviewed the results and approved the final version of the manuscript.
Availability of Data and Materials: All data generated and analyzed during this study are included in this published article.
Conflicts of Interest: The authors declare that they have no conflicts of interest to report regarding the present study.
References
1. Karthick, M., Siva Ramakrishna, C., Pugazhenthi, R., Gudadhe, N., Baskar, S. et al. (2023). Contact stress analysis of xylon coated spur gear using ANSYS workbench. Materials Today: Proceedings, 4, 232–237. [Google Scholar]
2. Ma, Z., Wang, X. (2002). Research on a highly durable and heavy duty gearing. Journal of Xi’an Jiaotong University, 3(36), 282–286 (In Chinese). [Google Scholar]
3. Wang, S. J., Hou, L., Dong, L., Xiao, H. J. (2012). Modeling and strength analysis of cylindrical gears with curvilinear shape teeth for manufacture. Sichuan Daxue Xuebao (Gongcheng Kexue Ban)/Journal of Sichuan University (Engineering Science Edition), 44(3), 210–215 (In Chinese). [Google Scholar]
4. Hasegawa, Y., Tada, H. (1952). Gear cutting machine for circular arc gear. Accretech Machinery, 18(8), 253–257 (In Japanese). [Google Scholar]
5. Tseng, R., Tsay, C. (2001). Mathematical model and undercutting of cylindrical gears with curvilinear shaped teeth. Mechanism and Machine Theory, 36(11–12), 1189–1202. [Google Scholar]
6. Tseng, R., Tsay, C. (2004). Contact characteristics of cylindrical gears with curvilinear shaped teeth. Mechanism and Machine Theory, 39(9), 905–919. [Google Scholar]
7. Zhao, F., Hou, L., Chen, Y., Luo, L. (2020). Mathematical model and generating condition analysis of cylindrical gear with circular arc tooth trace. Journal of Jilin University (Engineering and Technology Edition), 50(3), 875–885 (In Chinese). [Google Scholar]
8. Zhao, F., Hou, L., Duan, Y., Chen, Z., Chen, Y. et al. (2016). Research on the forming theory analysis and digital model of circular arc gear shaped by rotary cutter. Advanced Engineering Sciences, 48(6), 119–125 (In Chinese). [Google Scholar]
9. Ma, D., Ye, Z. H., Yang, H. (2019). Tooth surface reconstruction and tooth profile geometric analysis of circular Arc tooth trace cylindrical gears. Transactions of FAMENA, 43(1), 29–44. [Google Scholar]
10. Luo, L., Hou, L., Zhao, F., Wu, Y., Bai, Q. (2018). Analysis on geometric characteristics of cylindrical gear with variable hyperbolic circular-arc-tooth-trace. Advanced Engineering Sciences, 50(1), 171–179 (In Chinese). [Google Scholar]
11. Wei, Y., Guo, R., Liu, Y., Dong, C., Li, D. et al. (2020). Analytical calculation of the tooth surface contact stress of cylindrical gear with variable hyperbolic circular-arc-tooth-trace. Symmetry, 12(8), 1318. [Google Scholar]
12. Fuentes Aznar, A., Ruiz-Orzaez, R., Gonzalez-Perez, I. (2016). Comparison of spur, helical and curvilinear gear drives by means of stress and tooth contact analyses. Meccanica, 52(7), 1721–1738. [Google Scholar]
13. Zhang, X., Liang, Z. (2021). Mathematical model and contact characteristics of curvilinear cylindrical gears with line contact. Journal of the Brazilian Society of Mechanical Sciences and Engineering, 43(4), 183. [Google Scholar]
14. Ma, Z., Wang, X., Shen, B. (2005). Real tooth contact analysis of the cylindrical gears with symmetrical arcuate tooth trace. Journal of Xi’an Jiaotong University, 39(7), 722–725 (In Chinese). [Google Scholar]
15. Guo, R., Wei, Y., Yongping, L., Li, D., Yang, D. et al. (2021). Analytical solution to contact characteristics for a variable hyperbolic circular-arc-tooth-trace cylindrical gear. Mechanical Sciences, 12(2), 923–932. [Google Scholar]
16. Chen, Z.,Chen, Y.,Fuentes Aznar, A. (2023). Computerized design, simulation of meshing, and stress analysis of curvilinear cylindrical gears based on the active design of the meshing line function. Mechanism and Machine Theory, 188, 105389. [Google Scholar]
17. Zhang, Q., Hou, L., Tang, R., Wen, G. (2017). Method of processing and an analysis of meshing and contact of circular arc tooth trace cylindrical gears. Transactions of Famena, 40(4), 11–24. [Google Scholar]
18. Zhang, Q., Wen, G., Luo, L., Tang, R. (2020). Contact stress prediction model for variable hyperbolic circular arc gear based on the optimized kriging-response surface model. Transactions of Famena, 44(4), 59–74. [Google Scholar]
19. Zhang, Q., Wen, G., Chen, Z., Zhou, Q., Xiang, G. et al. (2022). Sensitivity analysis contact reliability of VH-CATT cylindrical gear and its reliability with material strength degradation. International Journal of Foundations of Computer Science, 33, 691–716. [Google Scholar]
20. Zhang, Q., Wen, G., Chen, Z., Zhou, Q., Xiang, G. et al. (2022). Contact stress reliability analysis based on first order second moment for variable hyperbolic circular arc gear. Advances in Mechanical Engineering, 14(7). https://doi.org/10.1177/16878132221111210 [Google Scholar] [CrossRef]
21. Pholdee, N., Bureerat, S., Nuantong, W. (2021). Kriging surrogate-based genetic algorithm optimization for blade design of a horizontal axis wind turbine. Computer Modeling in Engineering & Sciences, 126(1), 261–273. https://doi.org/10.32604/cmes.2021.012349 [Google Scholar] [CrossRef]
22. Qin, Q., Cao, X., Zhang, S. (2022). AWK-TIS: An improved AK-IS based on whale optimization algorithm and truncated importance sampling for reliability analysis. Computer Modeling in Engineering & Sciences, 135(2), 1457–1480. https://doi.org/10.32604/cmes.2023.022078 [Google Scholar] [CrossRef]
23. Thedy, J., Liao, K. (2023). Adaptive kriging adopting PSO with hollow-hypersphere space in structural reliability assessment. Probabilistic Engineering Mechanics, 74, 103513. [Google Scholar]
24. Liang, S., Luo, P., Hou, L., Duan, Y., Zhang, Q. et al. (2022). Research on processing error of special machine tool for VH-CATT cylindrical gear. Machines, 10(8), 679. [Google Scholar]
25. Tong, C., Sun, Z. L., Chai, X. D., Wang, J. (2016). Gear contact fatigue reliability based on response surface and MCMC. Journal of Northeastern University Natural Science, 37(4), 532–537. [Google Scholar]
26. Xie, L. P., Shi, J. G., Li, Y. S., Qiu, H. D., Huang, Y. C. (2016). Optimization on base bleed parameters based on genetic particle swarm algorithm. Journal of Ballistics, 28(1), 33–38. [Google Scholar]
Cite This Article
 Copyright © 2024 The Author(s). Published by Tech Science Press.
This work is licensed under a Creative Commons Attribution 4.0 International License , which permits unrestricted use, distribution, and reproduction in any medium, provided the original work is properly cited.
 Downloads
 Citation Tools