
 Submit a Paper
 Propose a Special lssue
 Open Access
ARTICLE

Enhanced Fault Detection and Diagnosis in Photovoltaic Arrays Using a Hybrid NCA-CNN Model
1 Electrical and Electronics Engineering Department, Engineering Faculty, Bilecik Seyh Edebali University, Bilecik, 11210, Turkey
2 Biosystem Engineering Department, Agriculture and Natural Sciences Faculty, Bilecik Seyh Edebali University, Bilecik, 11210, Turkey
* Corresponding Author: Yasemin Onal. Email:
(This article belongs to the Special Issue: Advanced Artificial Intelligence and Machine Learning Methods Applied to Energy Systems)
Computer Modeling in Engineering & Sciences 2025, 143(2), 2307-2332. https://doi.org/10.32604/cmes.2025.064269
Received 10 February 2025; Accepted 27 March 2025; Issue published 30 May 2025
 View Full Text
 Download PDF
Abstract
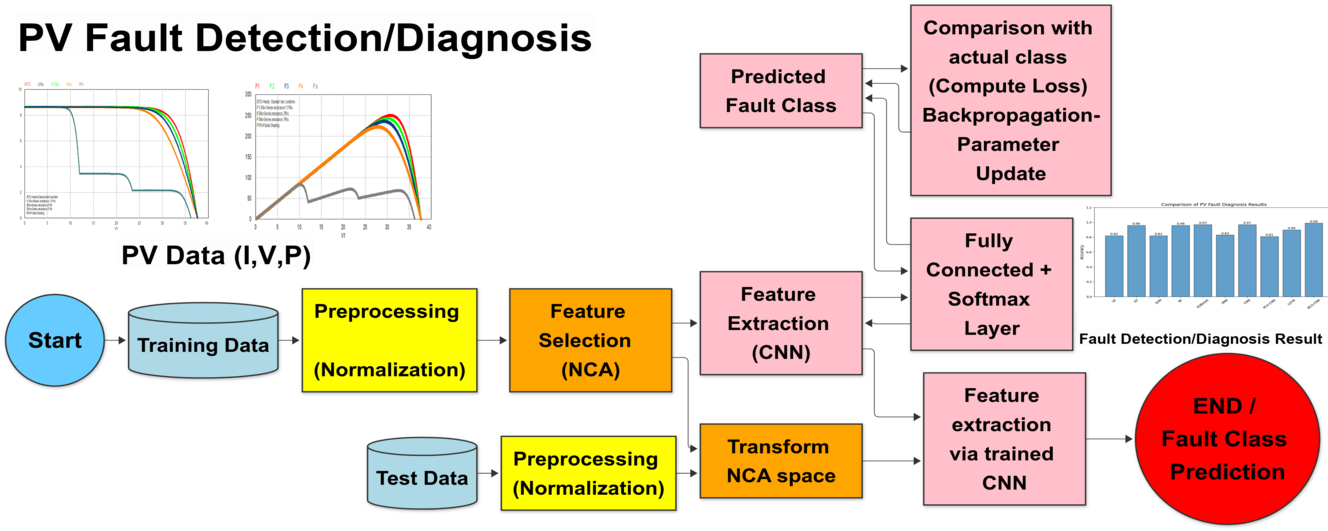
The reliability and efficiency of photovoltaic (PV) systems are essential for sustainable energy production, requiring accurate fault detection to minimize energy losses. This study proposes a hybrid model integrating Neighborhood Components Analysis (NCA) with a Convolutional Neural Network (CNN) to improve fault detection and diagnosis. Unlike Principal Component Analysis (PCA), which may compromise class relationships during feature extraction, NCA preserves these relationships, enhancing classification performance. The hybrid model combines NCA with CNN, a fundamental deep learning architecture, to enhance fault detection and diagnosis capabilities. The performance of the proposed NCA-CNN model was evaluated against other models. The experimental evaluation demonstrates that the NCA-CNN model outperforms existing methods, achieving 100% fault detection accuracy and 99% fault diagnosis accuracy. These findings underscore the model’s potential in improving PV system reliability and efficiency.Graphic Abstract
Keywords
Photovoltaic (PV) systems are vital for renewable energy but faults can reduce efficiency, reliability, and safety, increasing the risk of fire hazards. Given the high initial investment and associated risks, continuous monitoring and timely fault detection are crucial for maintaining efficiency and minimizing operational costs [1]. Common faults in PV systems, including dust accumulation, short circuits, partial shading, series resistance degradation, and aging, result in changes to the system’s electrical performance, observable through the current-voltage (I-V) characteristics [2]. Among these faults series resistance degradation, often caused by contamination or prolonged ultraviolet exposure, can significantly damage PV systems if not addressed promptly [3,4].
Early fault detection and diagnosis play a crucial role in ensuring the optimal performance of PV systems. Various fault detection techniques have been proposed, ranging from conventional methods to advanced machine learning (ML) based approaches [5]. ML-based approaches and deep learning (DL) algorithms have recently gained prominence in PV system fault detection due to their capability to analyze large datasets and extract meaningful patterns [6]. Researchers have explored different ML classifiers such as Decision Trees (DT), Random Forests (RF), Support Vector Machines (SVM), and Artificial Neural Networks (ANN) to enhance fault diagnosis accuracy [7,8]. DTs are valued for their simplicity and interpretability, effectively diagnosing issues such as line-to-line faults, open circuits, and partial shading. However, their reliance on splitting criteria may limit their performance in complex, dynamic conditions [8]. RF enhances DTs by leveraging an ensemble approach, improving accuracy and efficiency in diagnosing faults like line-to-line faults, degradation, and shading [9]. RF encounters challenges including data sparsity, imbalanced datasets, and high computational demands. SVM is renowned for its robustness and high accuracy in diagnosing complex PV system faults, such as short circuits, open circuits, shading faults, and degradation [10,11]. Additionally, ensemble learning approaches have been proposed to improve classification performance in grid-connected PV systems.
PV fault detection methods balance interpretability, efficiency, and accuracy. Hybrid Artificial Intelligence (AI) approaches, combining ML’s feature extraction with DL’s classification strengths, outperform single methods, enhancing reliability, scalability, and diagnostic performance. Approaches like hybrid learning machines [12], feature extraction techniques such as principal component analysis (PCA) [13], and wavelet packet transform [14] have shown promising results. These hybrid methods leverage the dimensionality reduction and feature extraction strengths of ML while utilizing the superior classification capabilities of DL, resulting in enhanced overall performance in data-driven tasks [15,16]. PCA has been widely used for PV fault detection [17] but has limitations in classification tasks due to its unsupervised nature and inability to preserve class relationships [18]. While PCA reduces dimensionality by capturing data variance, it disregards fault class distinctions, affecting accuracy.
This limitation can reduce PCA’s effectiveness in fault detection tasks. To address this, NCA has been introduced [19], as it not only reduces dimensionality but also retains intra-class and inter-class data scattering, improving classification accuracy. This capability allows NCA to effectively differentiate between fault types, enhancing its utility in PV fault diagnosis by improving classification accuracy and reliability. NCA has been effectively used as a preprocessing step for ANN classifiers in PV power estimation [20].
The literature contains very few studies utilizing the NCA-CNN hybrid method. Among these, one study proposed a hybrid model to enhance the accuracy of tomato leaf disease classification by combining features extracted from different CNN architectures and selecting the most relevant ones with NCA before classification [21]. Another study in [22], is integrated wavelet transform, singular values, and NCA-CNN methods for automatic modulation recognition of communication signals. Besides, the literature [23] applied the NCA-CNN algorithm in an Internet of Things (IoT) based system to improve the monitoring of diabetic patients, aiming for more effective health data tracking and better disease management. Although NCA-CNN has been explored in various domains to a limited extent, its application to PV fault detection has not yet been addressed in the literature. The key aspect lies in the system architecture required to capture the specific features of the measurements derived from the system outputs. In physics, PV faults exhibit distinct characteristics in PV current-voltage and power-voltage graphs. Our study is the first to apply NCA-CNN analysis for PV fault detection, bridging this gap in the research. The integration of NCA and CNN provides several advantages over traditional ML models. Firstly, NCA effectively filters out redundant and irrelevant features, reducing computational complexity and mitigating the risk of overfitting. Secondly, CNNs excel at capturing spatial dependencies and local feature patterns, which conventional ML classifiers may struggle to detect [24].
The success of NCA-CNN varies across different application areas, depending on the nature of the problem and how errors impact system outputs. Even within the fault analysis literature, performance results and system architecture vary significantly depending on the specific system and its operational conditions [25,26]. Unlike fault analysis, applying it to a field like disease progression monitoring in healthcare would lead to entirely different system architectures [24]. Given these variations, applying NCA-CNN for PV fault detection and analyzing the results is particularly valuable for real-world PV system monitoring, enhancing reliability and efficiency. This study uniquely adapts and optimizes NCA-CNN for photovoltaic systems, making a significant contribution to the PV fault detection literature. While DL-based fault detection has gained momentum in PV systems, a critical gap remains in studies focused on extracting optimal features for PV faults. Our research addresses this gap by presenting a structured NCA-CNN framework that effectively eliminates irrelevant data while maximizing fault differentiation, setting a new benchmark in the field. Rather than merely extending existing NCA-CNN applications, this study introduces a transformative adaptation specifically tailored for PV fault detection. By redefining how PV faults are identified, diagnosed, and prevented, our approach makes significant scientific and practical contributions to the advancement of renewable energy diagnostics.
Contributions of the proposed method in the PV fault detection/diagnosis process are as follows:
• Optimized Feature Selection: Integrating NCA with CNN enables automatic feature selection, eliminating noise and enhancing PV fault detection accuracy.
• Superior Spatial Feature Extraction: Unlike traditional ML and Long Short-Term Memory (LSTM) models, NCA-CNN excels in capturing spatial dependencies, making it more robust for analyzing distinct PV fault hierarchies.
• Enhanced Fault Differentiation: The model precisely detects complex PV faults, including series resistance and shading effect issues.
• Performance Superiority: NCA-CNN achieved the highest accuracy (0.99), outperforming XGBoost, PCA-CNN, and LSTM, as confirmed by statistical analysis.
• Reduced Computational Complexity: NCA reduces dimensionality, boosting efficiency while preserving fault detection performance.
The paper proposes an innovative hybrid model, an integration of NCA and CNN, for accurate and early detection of partial shading and series resistance breakdown faults in PV systems. The hybrid model is designed to address the key challenges of accurate classification of complex fault patterns and precise interpretation of I-V curve variations. I-V curves simulated from the direct current side of the PV array are used in the experimental studies. NCA is used to automatically identify and extract important features from I, V, and power (P) values derived from the I-V curve. These features serve as inputs to a CNN classifier that provides accurate and systematic fault diagnosis in PV systems. The remainder of this paper is organized as follows: Section 2 presents the mathematical model of the PV panel, including the modeling of series resistance and partial shading faults. Section 3 introduces the proposed NCA-CNN method and its comparison with PCA, detailing NCA, CNN, and their integration into the hybrid model. Section 4 discusses the experimental studies, including data description, evaluation metrics, and fault detection and diagnosis results. Finally, conclusions and future research directions are provided.
2.1 Mathematical Model of PV Panel
Fig. 1 illustrates the equivalent circuit of an ideal PV cell. To obtain the I-V characteristics of a PV panel, the single-diode or two-diode equivalent circuit of the PV cell is among the most commonly utilized approaches. The classical single-diode model is typically employed to obtain the fundamental characteristics of a PV panel. This equivalent circuit is modeled as an electrical circuit that includes the current source generated by the incident light, a small resistor in series with the source, a large resistor in parallel, and a diode in parallel. The fundamental equation, derived from semiconductor theory [27], that mathematically describes the I-V characteristics of an ideal PV cell is given by Eq. (1) [28].
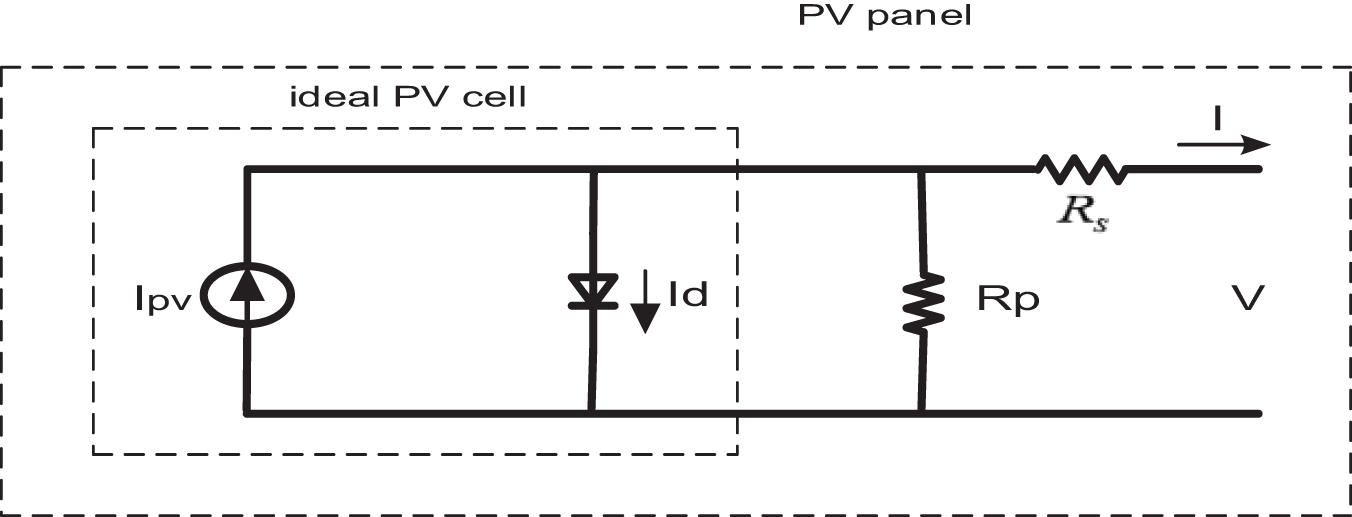
Figure 1: The single-diode model of a theoretical PV cell, along with the equivalent circuit representation of a practical PV device, includes both series and parallel resistances
where
The equation of a basic PV cell does not adequately represent the I-V characteristics of a practical PV array. Practical PV arrays consist of several interconnected PV cells, and accurately observing the characteristics at the terminals of the PV array requires the inclusion of additional parameters in the fundamental Eq. (2).
where
The PSIM software package is used for the design, control, and simulation of power electronics and digital motor control circuits and provides fast and accurate results [30]. The PV fault modes and synthetic dataset utilized in this study were generated by simulating the experimental dataset obtained using the FL60-250MBP monocrystalline PV panel, as employed in their research within the PSIM [17]. The module’s key parameters under Standard Test Conditions (1000 W/m2, 25°C) include a maximum power current (Impp 8.21 A), a maximum power voltage (Vmpp 30.52 V), a short-circuit current (Isc 8.64 A), and an open-circuit voltage (Voc 37.67 V). Structurally, it comprises 60 monocrystalline silicon PV cells connected in series, organized into three sub-arrays of 20 PV cells each. To safeguard the module, three bypass diodes are integrated, each connected in an anti-parallel configuration to protect the corresponding PV sub-array [17]. In the PSIM simulation circuit, a solar module is used to account for changes in solar irradiation and ambient temperature. The physical model of the PV module used is shown in Fig. 2. A large number of parameters must be entered into the solar module. Some of these parameters can be obtained from the manufacturer’s data sheets, while others, such as photocurrent, diode saturation current, series and parallel resistances, and ideality factor, are determined using the physical model. The PV panel under investigation consists of 60 PV cells connected in series [18].
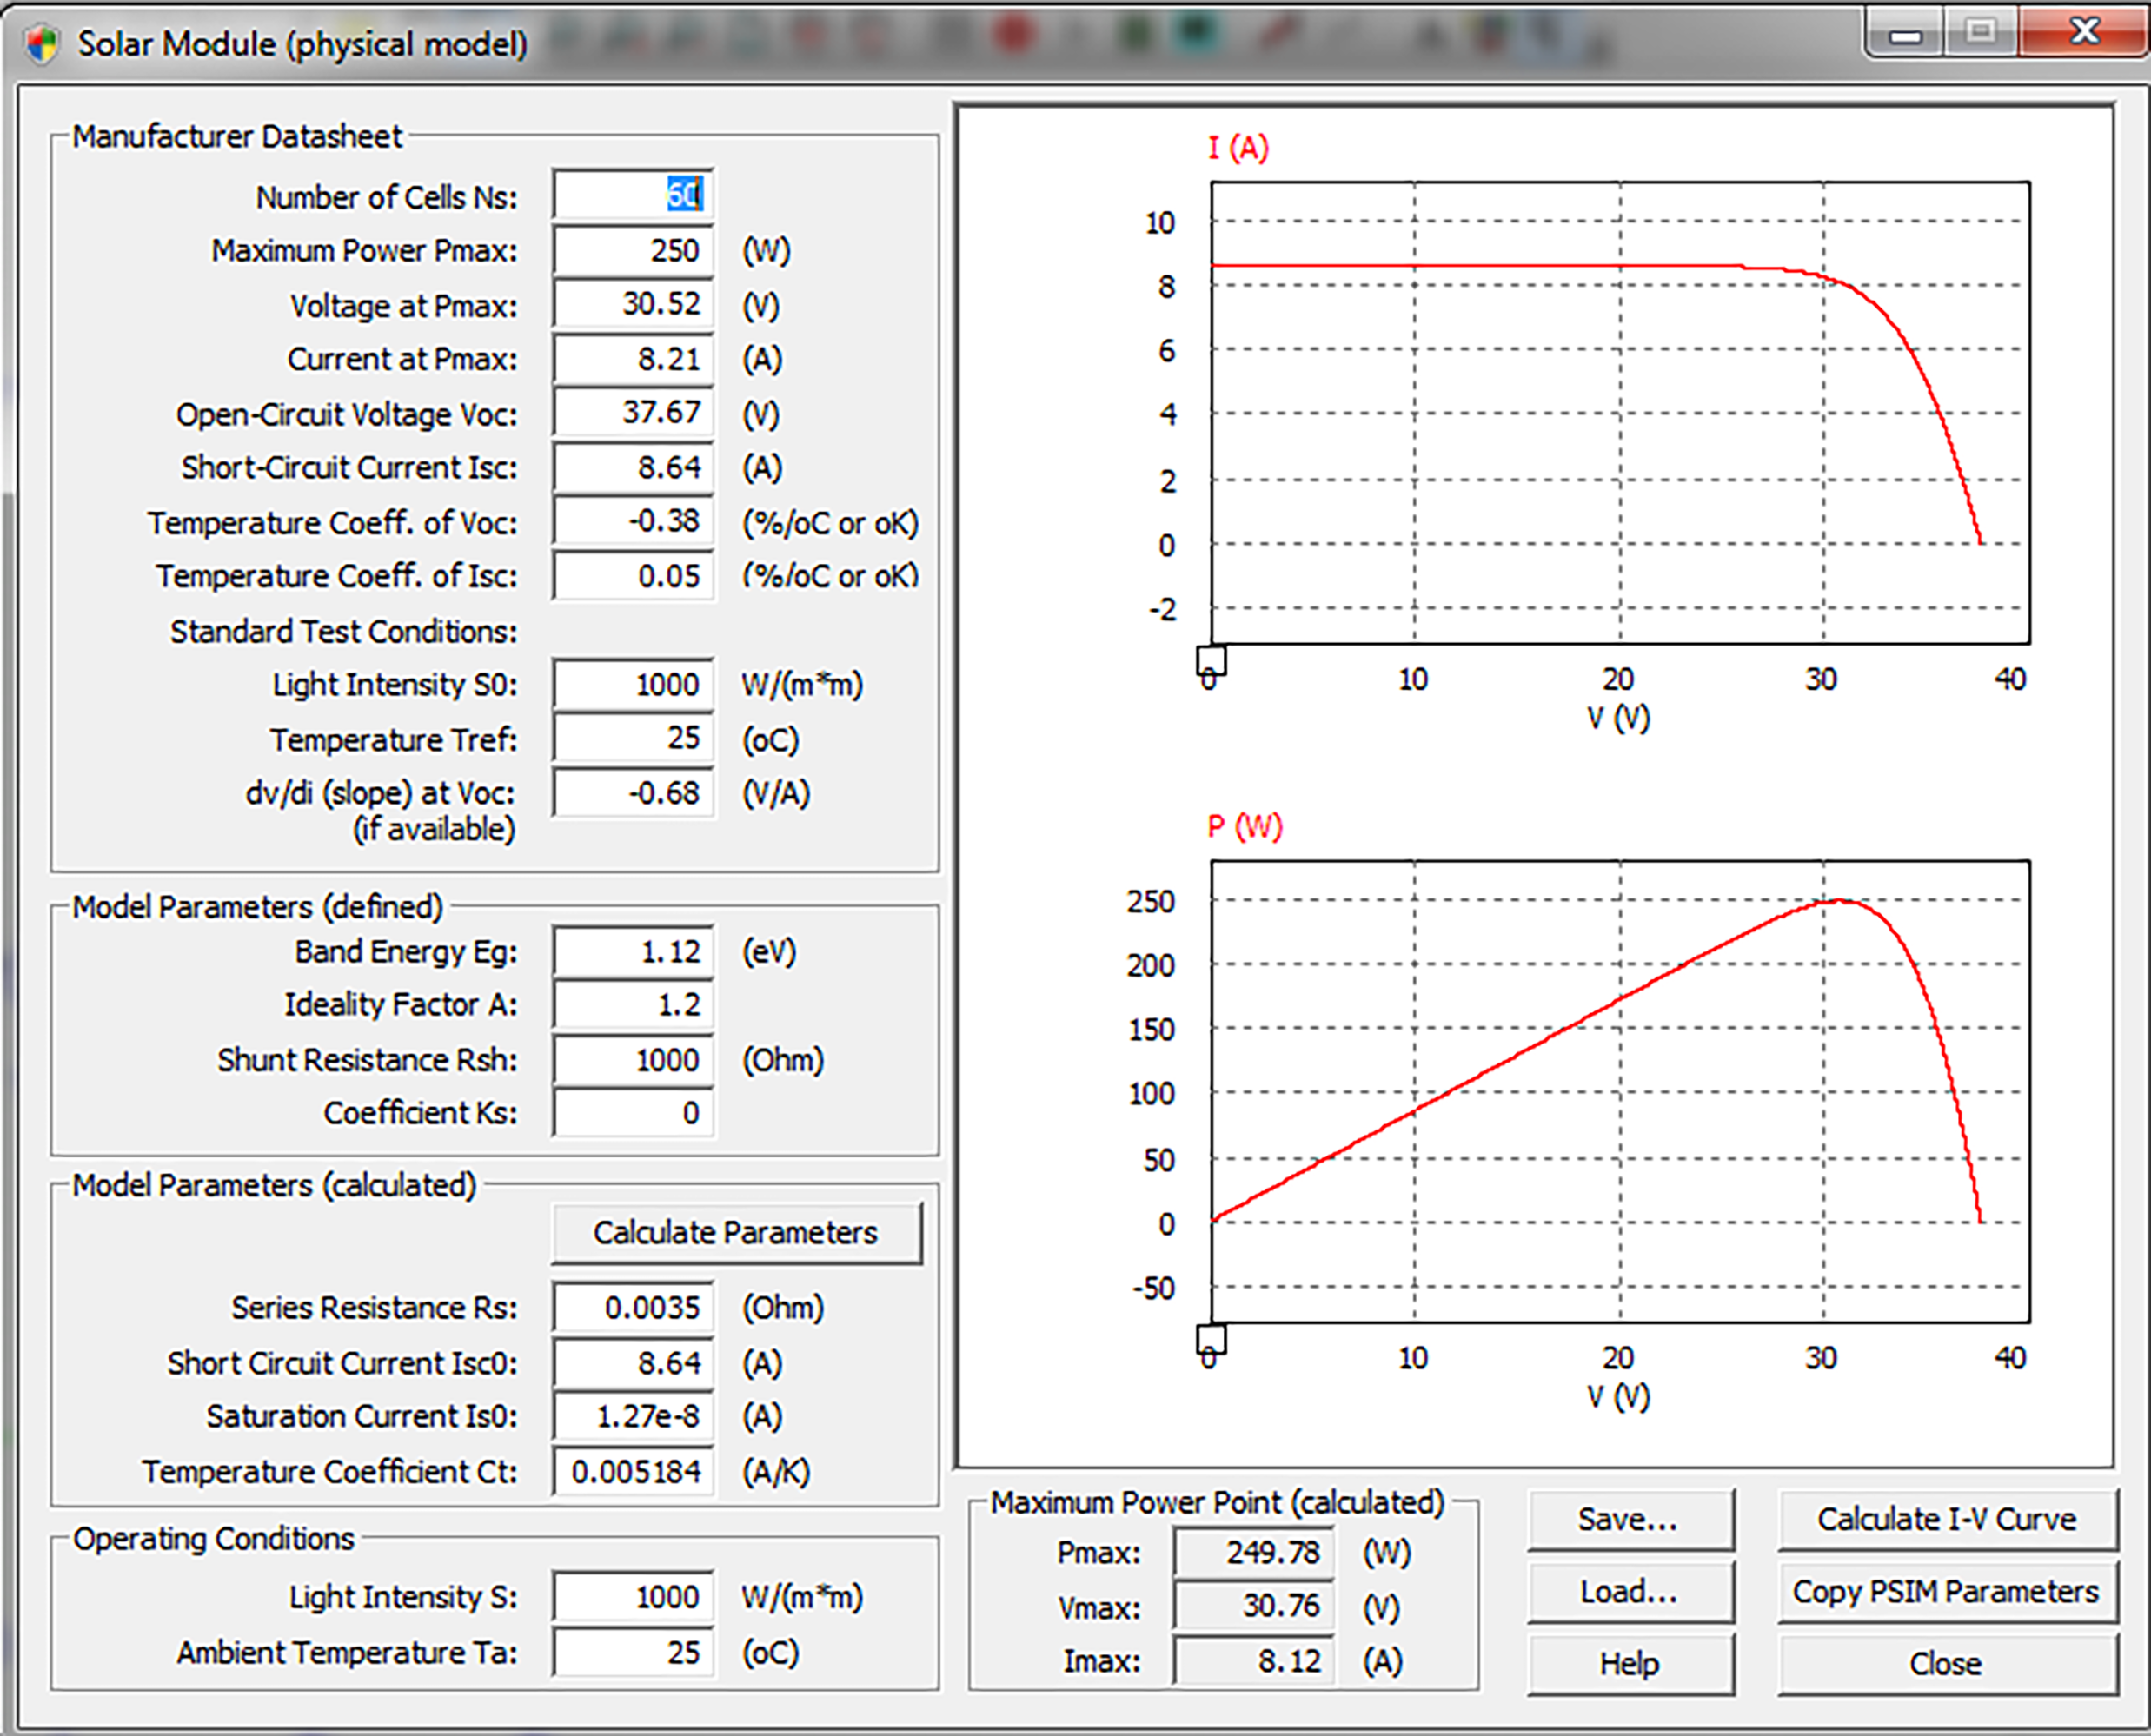
Figure 2: The physical model of the PV panel in PSIM [18]
2.2 Modeling of Series Resistance and Partial ShadingFaults
PV arrays are prone to a wide range of failures due to improper usage and lack of maintenance. Among these, shading is one of the most frequent and damaging faults, significantly degrading PV system performance. As demonstrated in the literature [31], partial shading can lead to an annual power generation loss exceeding 10%–20% in residential applications. Moreover, despite the presence of bypass diodes, localized shading can cause excessive heating of shaded cells. Resulting in thermal power losses, a considerable reduction in PV module lifespan, and potential damage to the affected cells [32]. For PV systems, the breakdown modes are reflected differently in the I-V curve, which has a specific shape under shaded conditions due to the activation of bypass diodes. Under partial shading fault, PV substrings receive irregular irradiation. The series resistance breakdown mode changes the I-V curve in the region close to the
Experimental studies were carried out under various operating modes. Two operating cases were considered as faulty operation modes and healthy operation modes. The first faulty operation mode is three-series resistance degradation (Fault A, Fault B, and Fault D), and the second faulty operation mode is partial shading (Fault C). Operation modes are given in Table 1. In this study, we simulated a PV panel with the same specifications as used in the literature study [17].

Fig. 3 depicts the PSIM simulation circuit utilized for the series resistance degradation mode and the healthy mode. The healthy mode is defined by 1000 W/m2 solar irradiation, 25°C reference temperature and series resistance Rs (0.0035 Ω). Series resistance degradation modes were performed for three different series resistance values, 1.5Rs (0.00525 Ω) for Fault A, 2Rs (0.007 Ω) for Fault Band 3Rs (0.0105 Ω) for Fault D. The faulty modes are represented differently in the I-V curve. Partial shading fault can cause significant problems in PV systems. In PV panels, when the number of shaded cells is less than the number of illuminated cells, the current generated by the illuminated cells exceeds that of the shaded cells. This causes the diodes of the shaded cells to become reverse biased, resulting in power loss within the shaded cells.
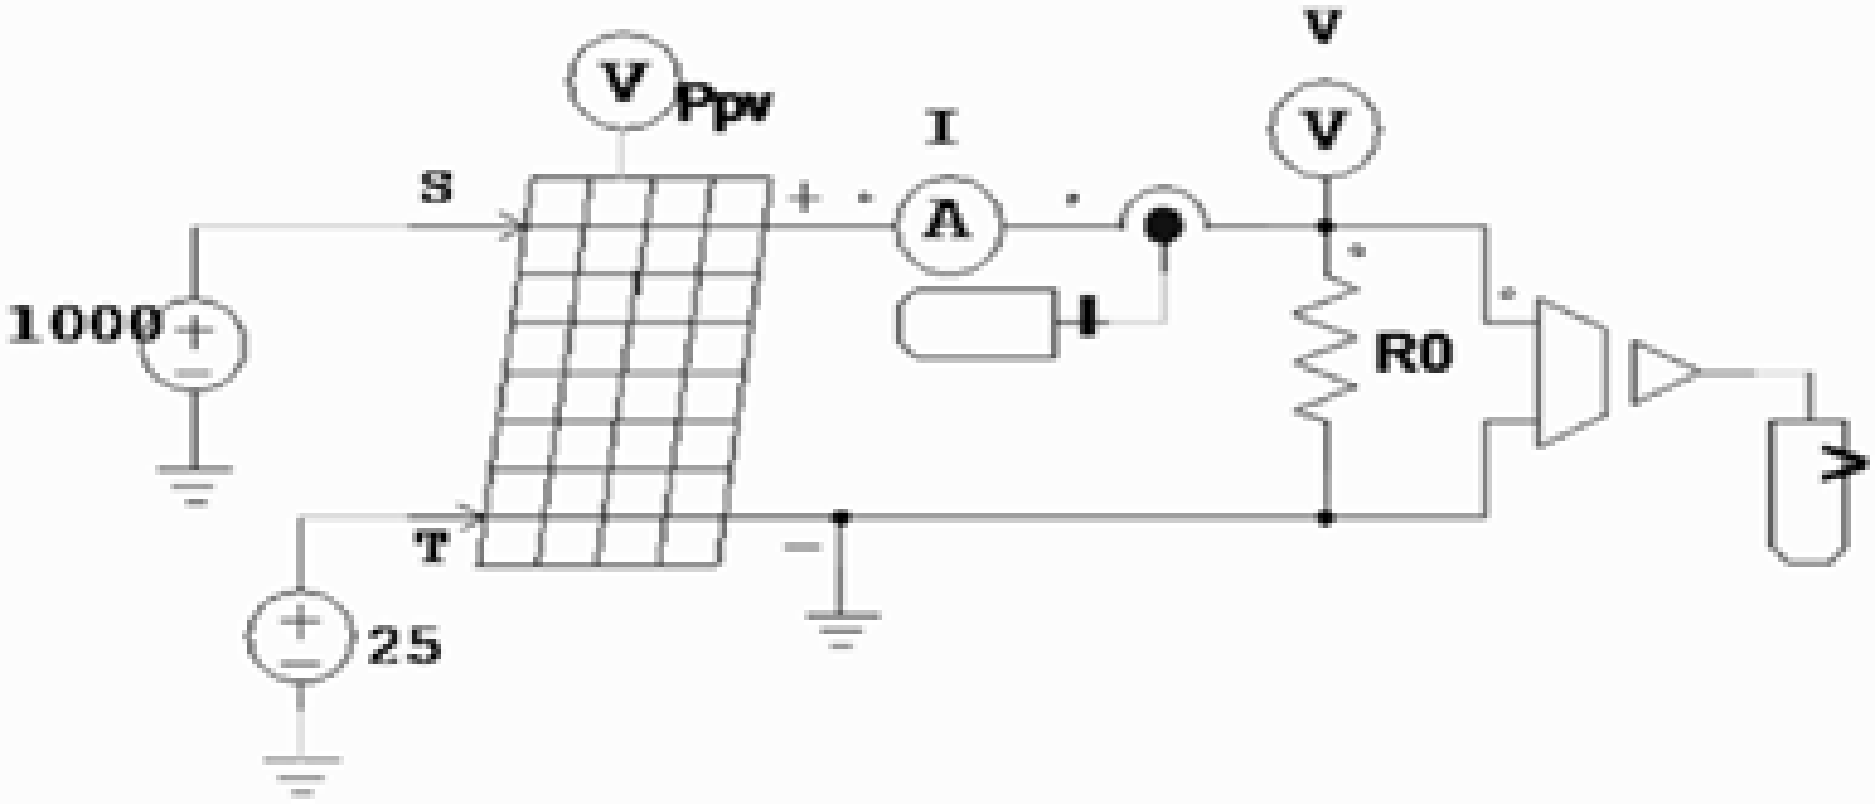
Figure 3: The PSIM simulation circuit used for Healthy, Fault A, Fault B, and Fault D conditions
The I-V curves obtained from the simulation results vary based on the location and number of cells experiencing partial shading on the PV panel. One PV cell in the first sub-string and one PV cell in the third sub-string are shaded. The effect of shaded cells on the output current is clearly illustrated by the three peaks occurring on the I-V curve. Multiple peaks appear in all I-V curves depending on the type of shading applied under shaded conditions. The short circuit current of the PV panel varies according to the solar irradiation. The PV panel produces less current at low solar irradiation [34].
Fig. 4 shows the simulation circuit created in PSIM for partial shading mode. The shading mode is applied to three substrings with irregular irradiation levels. To simulate the effect of shading, the PV panel under study is applied for Fault C with the series resistance value Rs (0.0035Ω) of 60 PV cells connected in series, organized into three sub-strings of 20 PV cells each. The shading mode is applied to three substrings with irregular irradiance levels. These sub-strings are equipped with three bypass diodes, each connected in antiparallel to protect a PV sub-string.
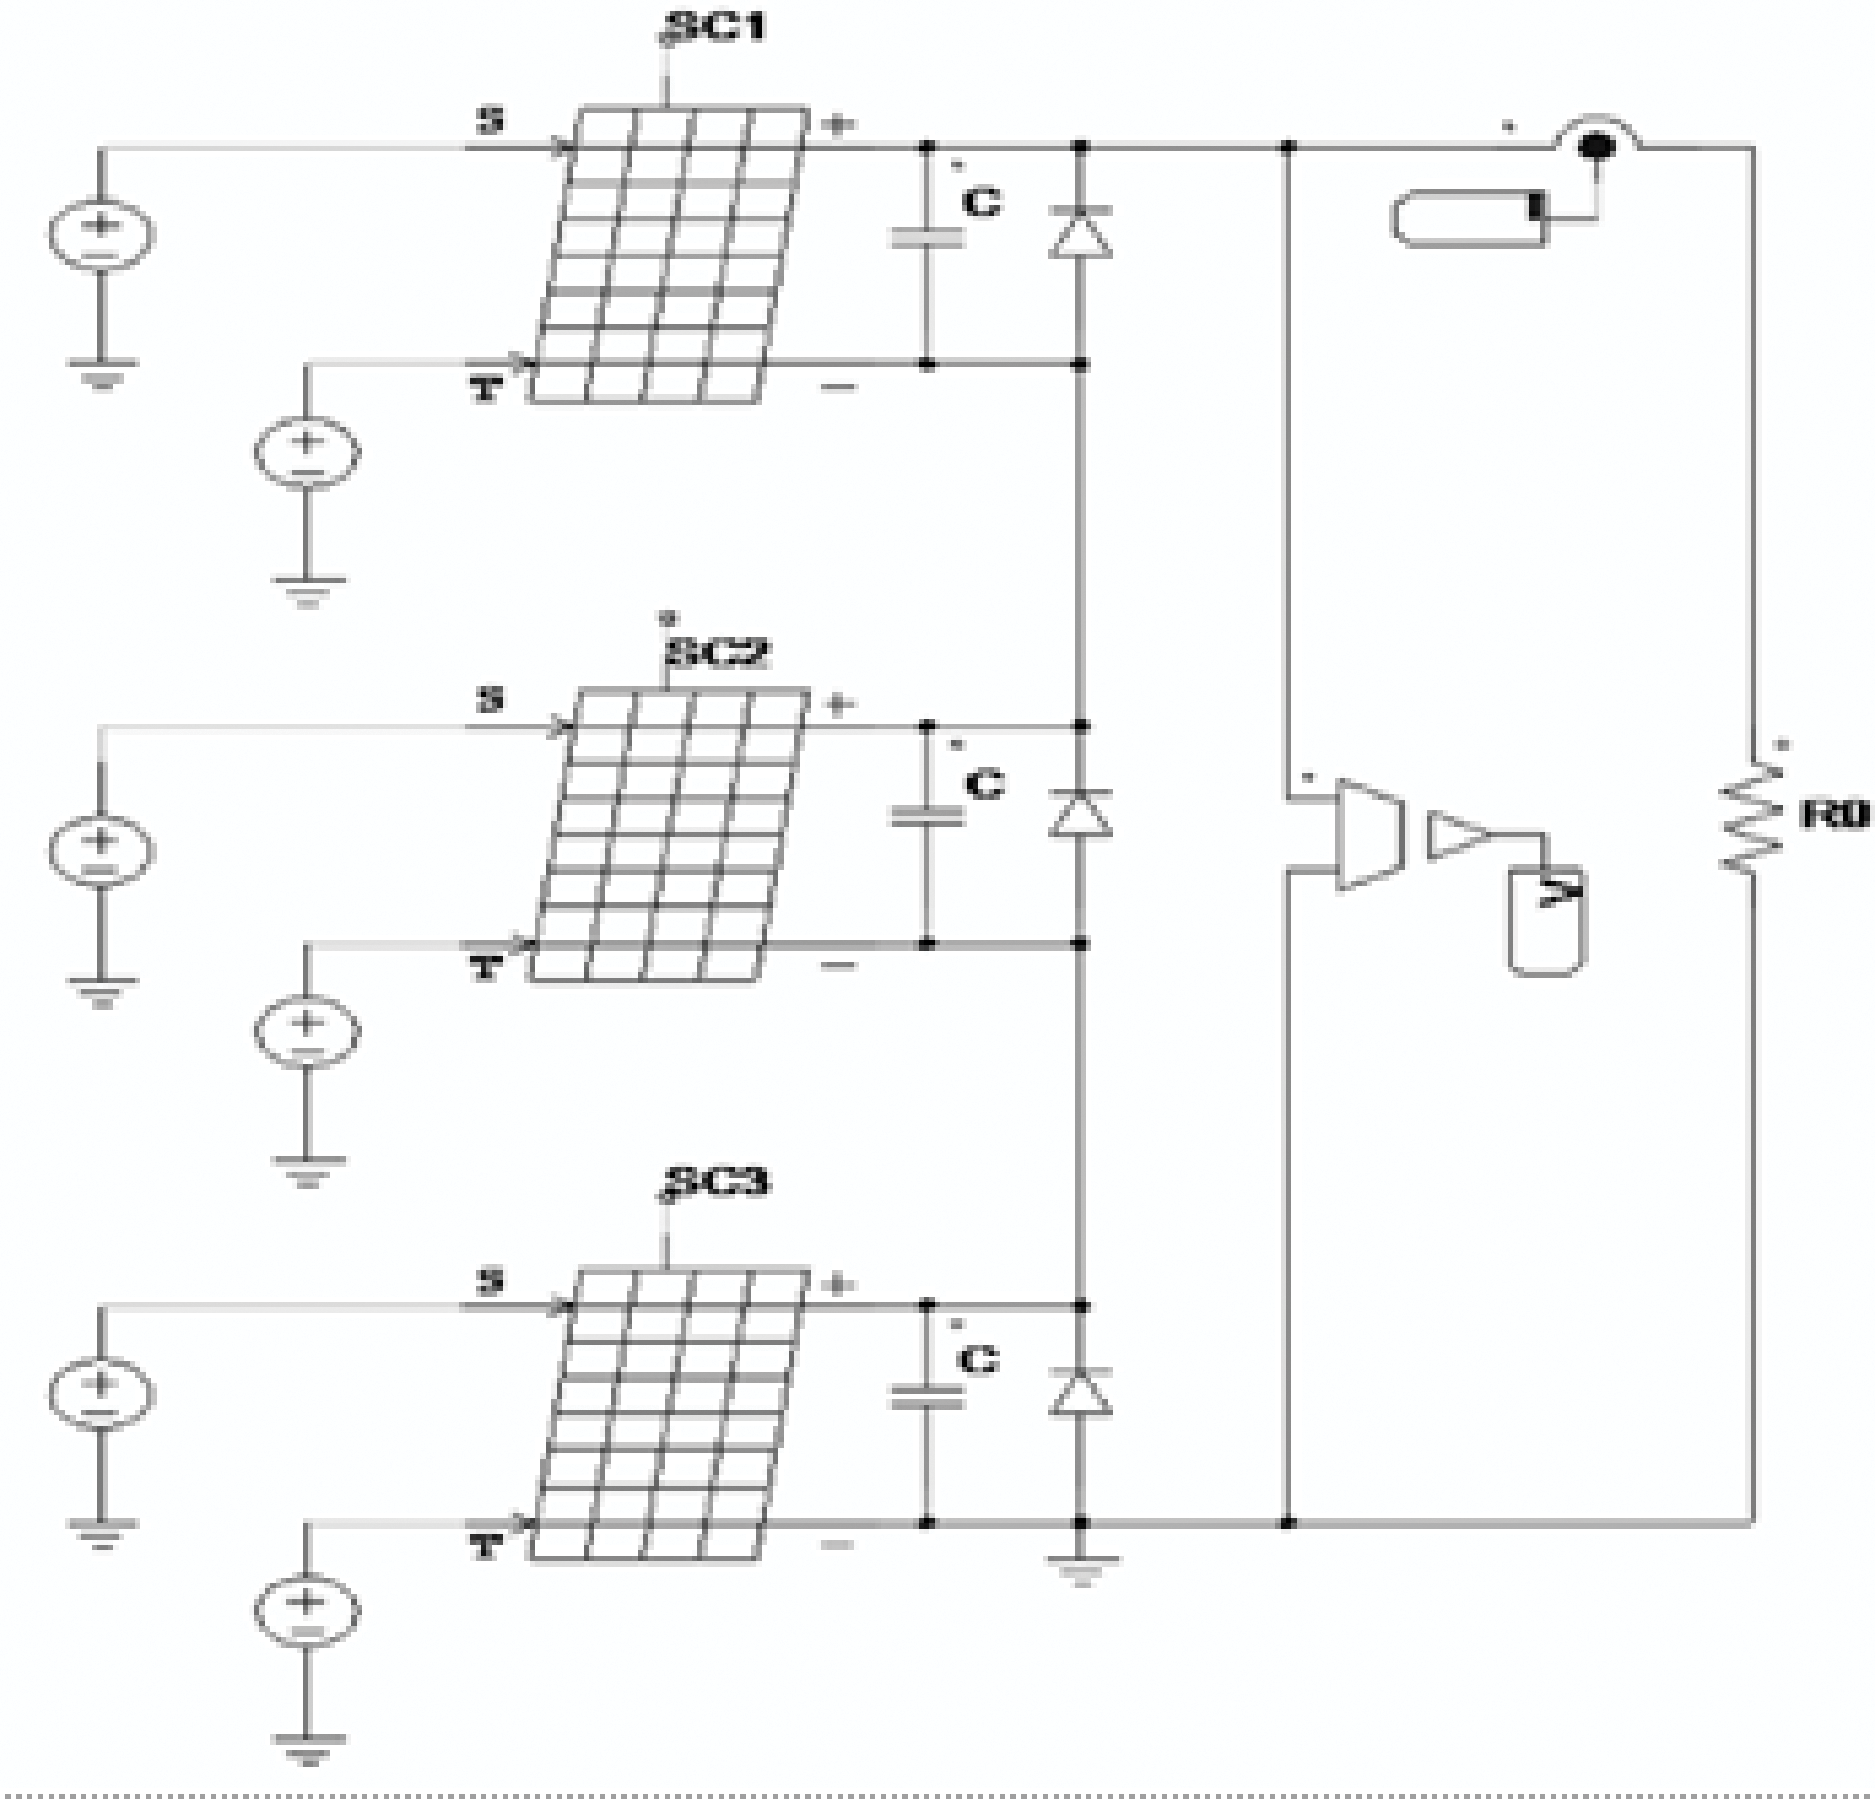
Figure 4: The PSIM simulation circuit used for fault C condition
To illustrate the effects of some PV array faults on the I-V and P-V curves, simulation results obtained under healthy mode, partial shading mode and series resistance degradation modes are presented in Fig. 5. Although the series resistance Rs is considered to be negligible in certain cases due to its minimum magnitude, considering the effect of the series resistance degradation on the output power and open circuit voltage (Voc) of the PV array, it becomes a critical parameter especially in the evaluation of the resistance degradation. From Fig. 5, we can observe that a degradation in the series resistance mainly changes the I-V curve in the region close to the open circuit voltage Voc [20,34]. The increase in the series resistance leads to a decrease in the I-V curve Voc and causes deviations from the maximum power point, negatively affecting the overall efficiency of the panel. The same effect can be observed in the case of potential-induced disturbance [35].
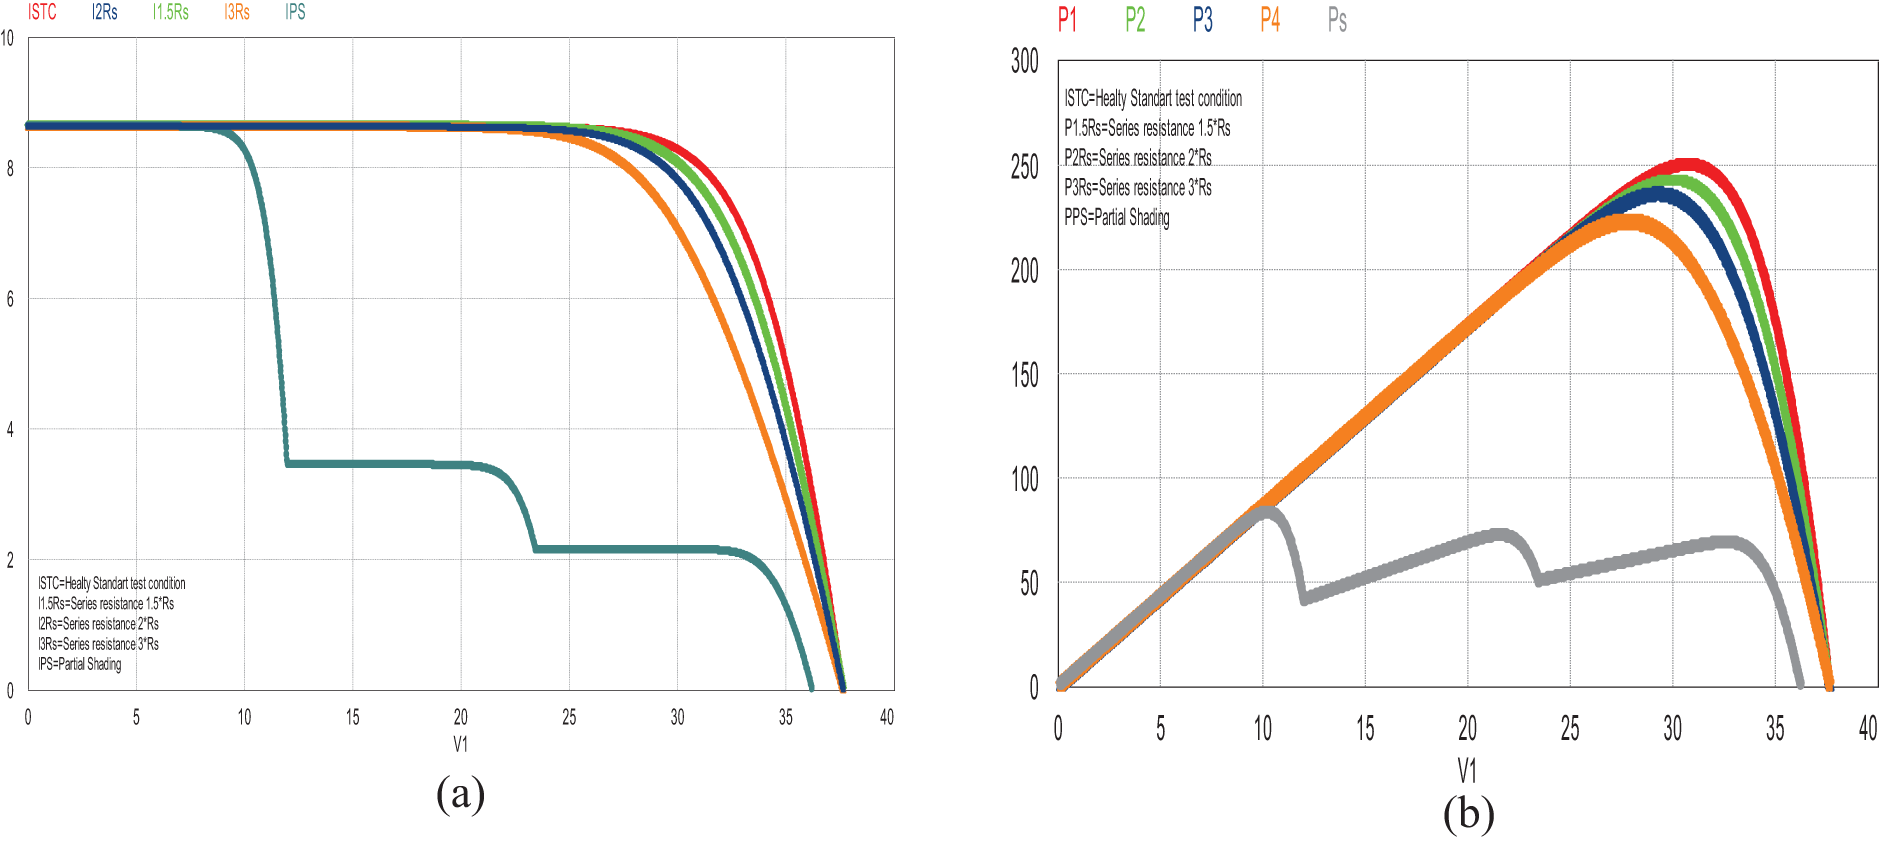
Figure 5: (a) the I-V and (b) the P-V curves obtained under one healthy and four faulty conditions in PSIM
The NCA-CNN model proposed in this study aims to enhance generalization in the analysis of features extracted from I-V curves, enabling the detection of both simulated faults and unforeseen errors that may arise under real-world conditions. To improve the model’s generalization capacity, diverse dataset comprising various faulty and healthy operating scenarios was utilized during the training phase. The proposed approach is applied offline in the case of PV module analysis. By leveraging online I-V trackers integrated into modern PV inverter technologies, the NCA-CNN method can seamlessly operate with any connected PV system, utilizing existing measurements without requiring additional hardware. While NCA identifies discriminative features by maintaining inter-class relationships, CNN leverages DL capabilities to extract meaningful patterns from these features. Consequently, the model is optimized not only for recognizing predefined fault types but also for detecting previously unseen anomalies, ensuring robust real-world applicability. As a result, the model is optimized not only for recognizing predefined fault types, but also for detecting any fault that can be precisely mapped to a real-world situation that was not explicitly introduced during training.
3.1 Neighbourhood Component Analysis, NCA and Its Comparision with PCA
NCA is a supervised dimensionality reduction technique specifically designed to enhance the classification performance of algorithms, particularly k-nearest neighbors (k-NN). This method learns an optimal transformation that maximizes the likelihood of accurately classifying training instances, thereby increasing the separability between distinct classes in the transformed feature space. Unlike PCA which generates a new feature space by creating a transformation matrix that captures the maximum variance across the entire dataset without regard to class labels, NCA’s primary objective is to maximize the distance among different classes. This targeted approach is why NCA often performs better than PCA in classification tasks. The process of the NCA algorithm is illustrated through the pseudocode presented in Fig. 6. This structured overview provides a clearer understanding of the step-by-step methodology employed within the NCA framework.

Figure 6: The pseudocode of NCA algorithm
The graphics in Fig. 7 illustrate a comparison of the efficiency between the PCA and NCA methods. The scatter plots in Fig. 1 display the distribution of the PV data that are the original, as well as the PV data transformed using PCA and NCA. From the analysis of Fig. 7, it is clear that the NCA algorithm outperforms PCA in terms of distinguishing between different fault classes. In the original data distribution (Fig. 7a), only the healthy PV data points can be separable from the faulty ones, while the PV data points that have various fault types remain indistinguishable from each other. When PCA is applied (Fig. 7b), the transformed feature space resembles the original data space, lacking the ability to differentiate between fault types; again, only the healthy data is separable from the faulty instances. In contrast, when the NCA transformation is used (Fig. 7c), a clear distinction emerges between Fault A and Fault C, as well as between these faults and the healthy data. Additionally, Faults B and D can be distinctly identified from Faults A and C, as well as from the healthy data. However, it is seen that Faults B and D are not distinguishable from one another.
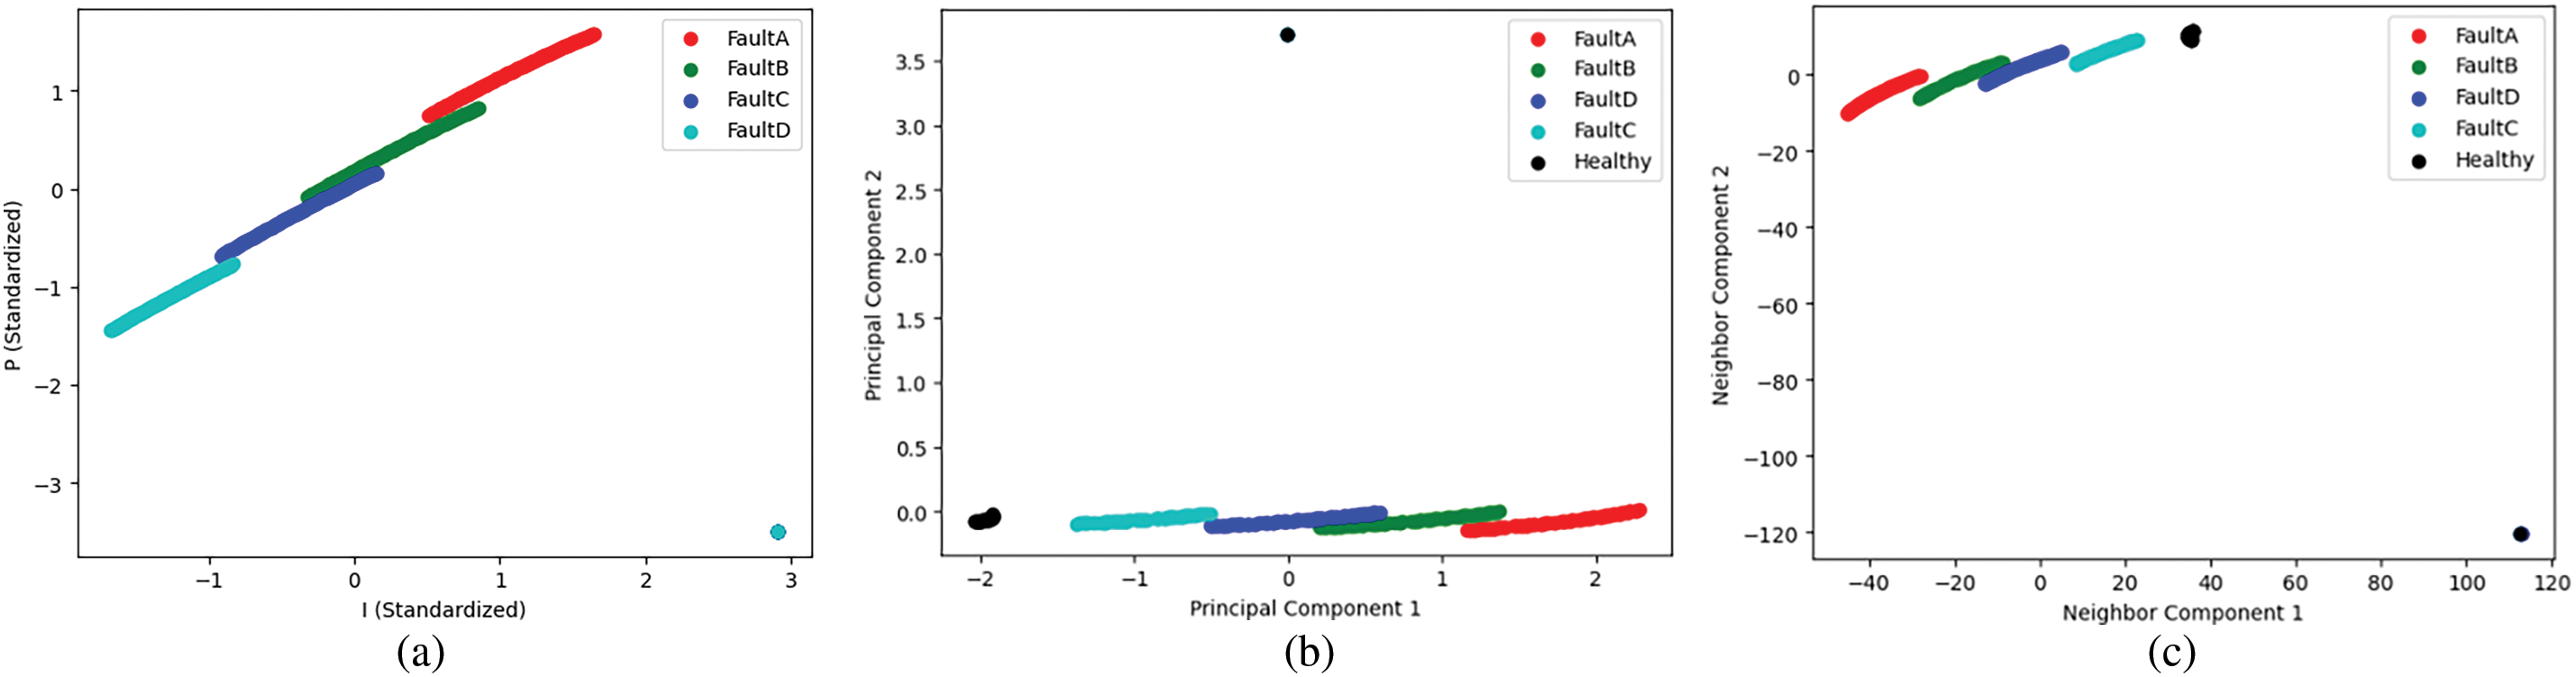
Figure 7: The data scatter plot, (a) Original data space simulated by PSIM and standardized to have a mean of 0 and a standard deviation of 1, (b) the data transformed by PCA, and (c) the data transformed by NCA for feature space
The integration of NCA and CNN provides several advantages over traditional ML models. Firstly, NCA effectively filters out redundant and irrelevant features, reducing computational complexity and mitigating the risk of overfitting. Secondly, CNNs excel at capturing spatial dependencies and local feature patterns, which conventional ML classifiers may struggle to detect [36]. By applying NCA for dimensionality reduction, CNN training becomes more efficient, as the model can focus on learning meaningful feature interactions rather than processing unnecessary data. The Hybrid NCA-CNN approach is particularly valuable for datasets with a high number of features, where only a subset significantly influences classification outcomes. Removing irrelevant and noisy features enhances the model’s ability to generalize, leading to improved performance on unseen data. Additionally, this method is computationally more efficient than training CNNs on the full dataset without prior feature selection, making it a scalable solution for high-dimensional classification tasks.
3.2 Convolutional Neural Networks CNN
CNNs, primarily used for image classification, can also effectively classify tabular data by capturing feature interactions and spatial dependencies. Their ability to apply convolutional filters across feature dimensions enables them to identify patterns and hierarchical relationships that traditional models might overlook. Unlike conventional ANNs, CNNs utilize adjustable weights and biases, applying nonlinear activation functions to enhance feature extraction. This feedforward kernel structure allows CNNs to transform data efficiently through multiple layers. As supervised learning algorithms, CNNs follow a structured process involving definition, training, evaluation, and prediction. Additionally, they require less preprocessing compared to other DL methods, simplifying the workflow [37,38]. The pseudocode outlining the essential steps of the CNN process is illustrated in Fig. 8.

Figure 8: The pseudocode of CNN as a supervised learning algorithm
Despite their advantages, CNNs are prone to overfitting due to a high number of parameters, leading to poor performance on unseen data. Overfitting often results from limited training data, insufficient variability, or excessive training durations [39]. To mitigate this, regularization techniques like dropout are commonly used. Dropout improves generalization by randomly deactivating neurons during training, forcing the model to learn diverse features and enhancing robustness. Additionally, it is often combined with data augmentation and hybrid strategies to improve accuracy and efficiency. In this study, both dropout and early stopping techniques are incorporated into CNN to prevent overfitting [40]. Consequently, dropout has become a standard component in training CNNs, often used alongside strategies like data augmentation and hybrid approaches, further enhancing model accuracy and computational efficiency. In this study to prevent overfitting both dropout and early-stopping techniques are incorporated with CNN.
The architecture of the CNN used in this studyconsists of several key layers. The process begins with an input layer that receives a reduced feature set derived from NCA. The architecture includes three Conv1D layers that extract hierarchical features using 32, 64, and 128 filters, respectively. This is followed by a MaxPooling layer that reduces the dimensionality to (1, 128) and a Dropout layer that helps prevent overfitting while maintaining the same shape. The feature maps are then converted into a 128-dimensional vector through a Flatten layer, followed by fully connected Dense layers with 256 and 512 neurons, which facilitate deep feature learning. Finally, the model concludes with an output layer designed for 4-class classification using the Softmax activation function. The CNN network layer structure used in this study is illustrated in Fig. 9.

Figure 9: Basic CNN architecture
3.3 The Proposed Hybrid NCA-CNN Method
The hybrid NCA-CNN method follows a systematic workflow that combines feature extraction (using NCA) with DL (CNNs) to improve classification performance. The sample data acquisition process in the hybrid method is given in Fig. 10. It includes data collection, data preprocessing, feature extraction, and model training and evaluation steps for fault detection and diagnosis in PV systems. First, simulation-based synthetic data are collected and current, voltage, and power parameters are recorded. Then, missing or erroneous data are cleaned, and the dataset is preprocessed to normalize the numerical features to a standard scale, which improves consistency and facilitates model convergence. Then, the most discriminative features that preserve inter-class relationships are selected using NCA and dimensionality reduction is performed. Then, the processed features are divided into training, validation, and test sets, ready for training the CNN classification model, and fed into the CNN architecture. The last step involves validating the trained model on test data and evaluating its performance. Once the validation is complete, the model can be used to predict labels for new data samples, thus providing an effective and reliable classification system. In the hybrid model evaluation phase, the first experimental run determined whether the new, previously unseen data was due to a faulty PV panel or a faultless PV panel, and the second experimental run determined the specific type of fault present in the PV panel.
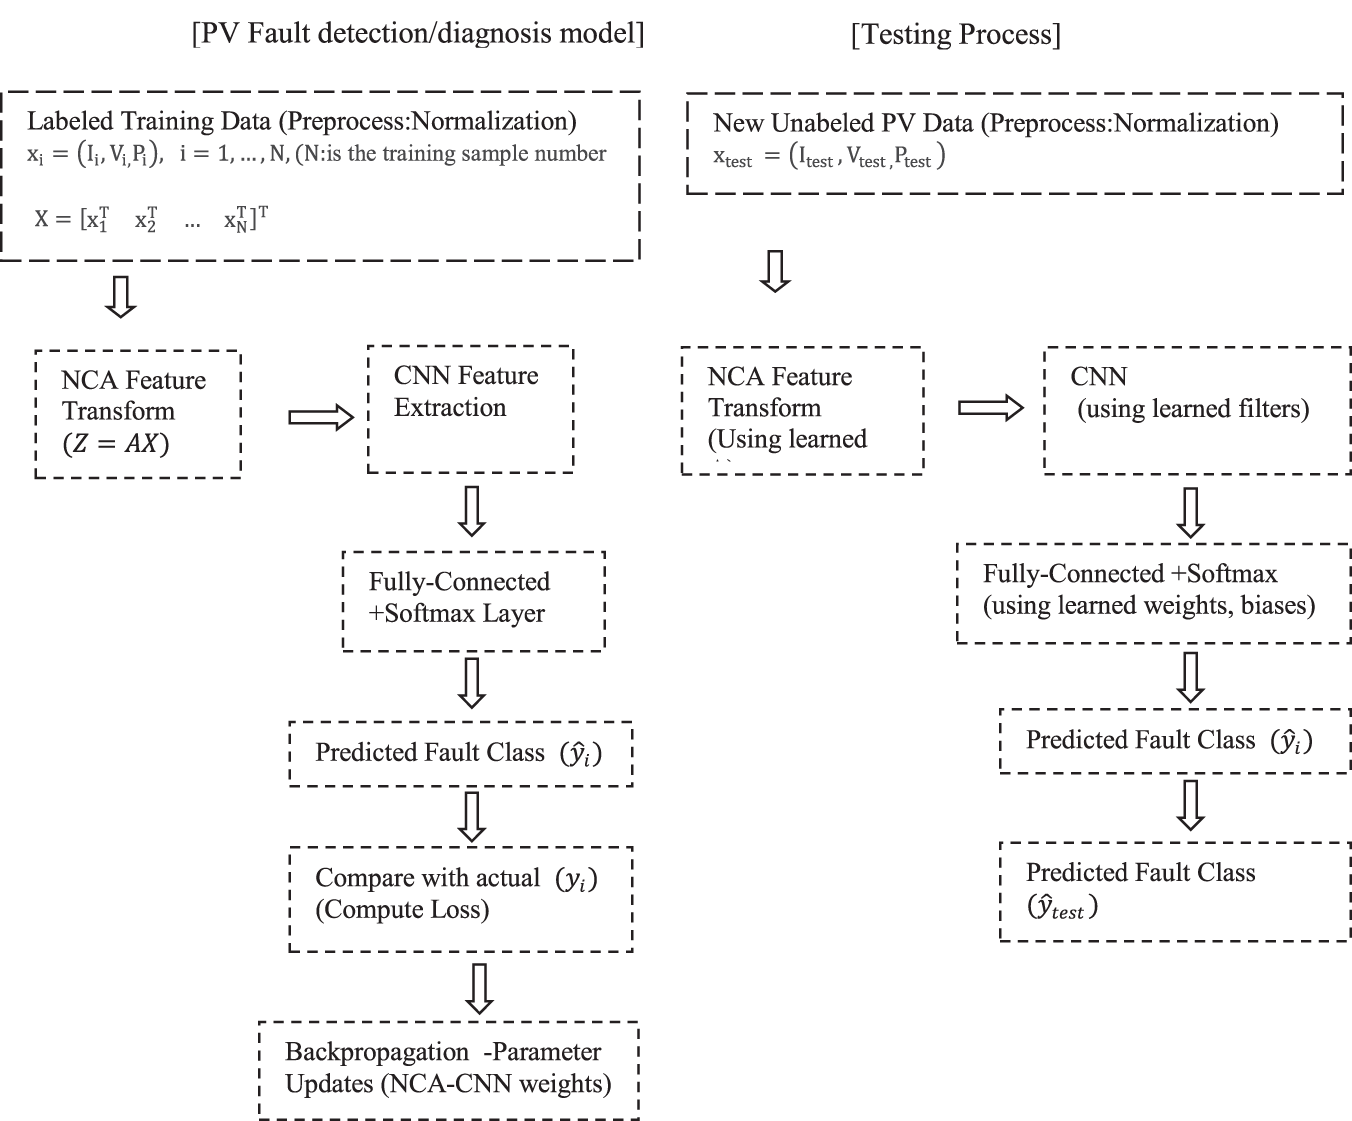
Figure 10: The model construction and testing processes of the proposed NCA-CNN hybrid method for fault detection/diagnosis
The NCA-CNN hybrid method begins with the normalization of the
where
To demonstrate the effectiveness of the proposed NCA-CNN method in capturing the dynamic nature of faults in real PV systems, we also applied our dataset to the LSTM model and also XGBoost model. LSTM networks are a specialized type of Recurrent Neural Network (RNN) designed to effectively handle sequential data and capture long-term dependencies. Traditional RNNs often struggle with the vanishing gradient problem, which makes it difficult for them to learn from long-range dependencies. LSTMs address this issue by introducing gated mechanisms the forget gate, input gate, and output gate. These gates regulate the flow of information and selectively retain important features over time. This unique architecture makes LSTMs particularly effective for tasks that require the memory of past states. Each block given in Fig. 11 represents a key gate or state in the LSTM structure, illustrating the flow of information within the network. The gated structure of LSTMs allows them to dynamically store, forget, and update information. The forget gate determines which past information should be discarded, the input gate updates relevant new information, and the output gate decides the final processed output. The cell state
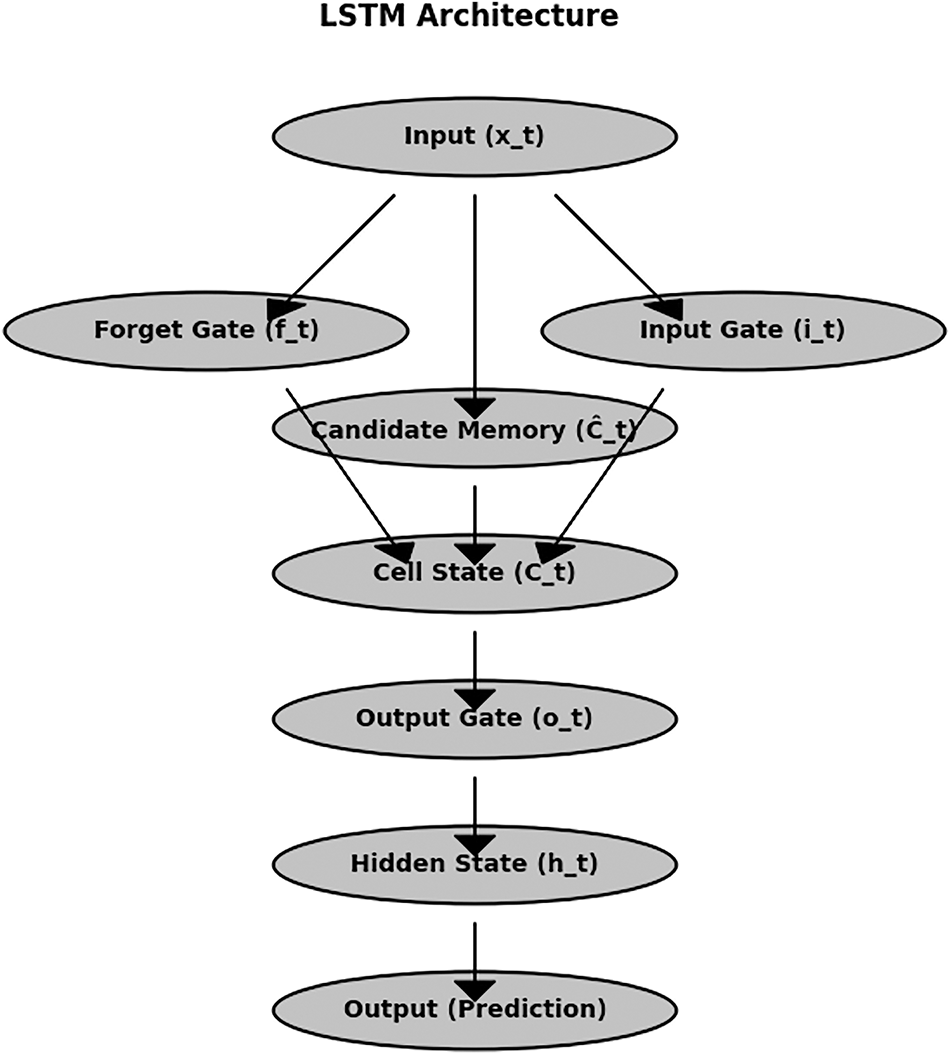
Figure 11: A visual representation of the LSTM architecture that illustrates the flow of information through its gated mechanisms
XGBoost is a powerful, scalable, and highly efficient gradient boosting algorithm widely used for classification, regression, and ranking tasks. It builds an ensemble of decision trees, where each tree corrects the errors of its predecessors, improving predictive accuracy. Known for its speed and computational efficiency, XGBoost offers a fast, accurate, and interpretable alternative to DL methods, making it particularly effective for structured data processing. The algorithm employs an optimized gradient boosting approach that minimizes loss functions while incorporating regularization techniques to prevent overfitting. Additionally, its ability to handle missing values and optimize computational performance makes it an excellent choice for fault classification tasks where structured features are crucial. The visual representation of the XGBoost architecture, shown in Fig. 12, illustrates how input features are processed through multiple boosted decision trees. These trees contribute to weighted predictions, ultimately resulting in a final classification. This diagram highlights the ensemble learning mechanism in XGBoost, where multiple trees collaborate to improve prediction accuracy through gradient boosting.
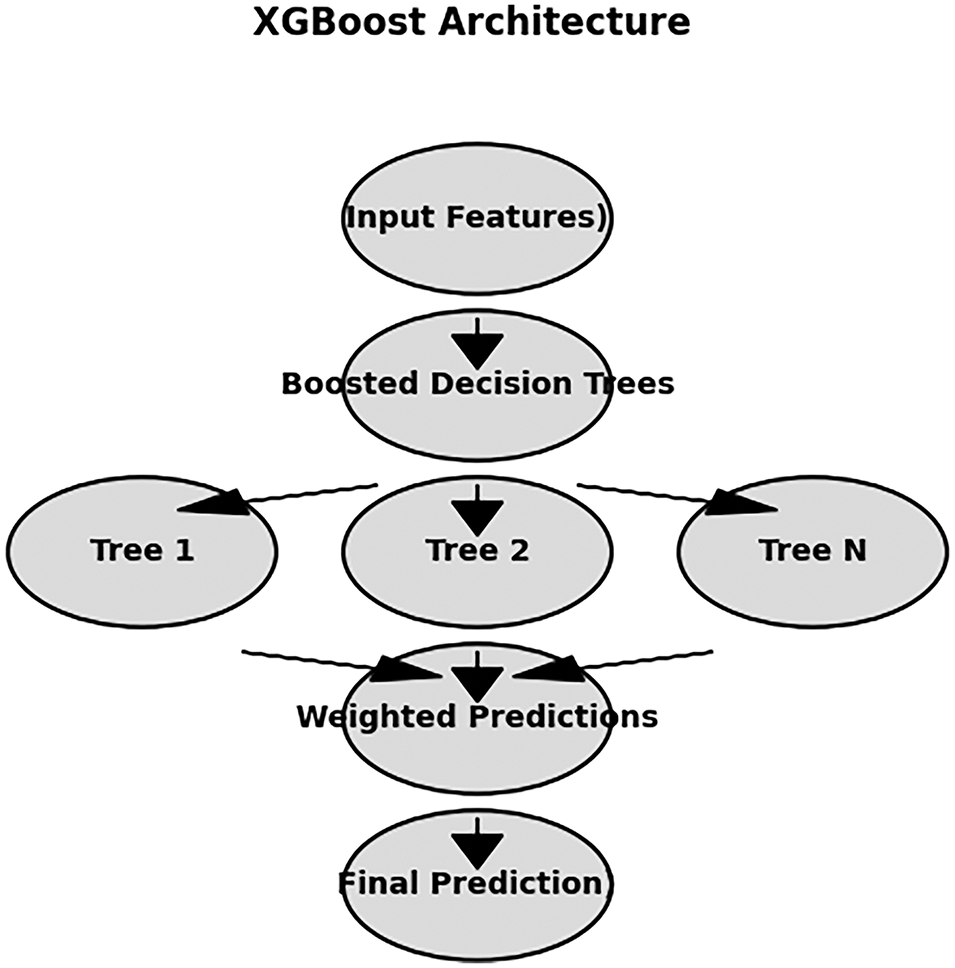
Figure 12: XGBoost architecture: the flow of data through boosted decision trees to the final prediction
4 Experimental Studies, Results and Discussions
4.1 Description of the Data, the Experimental Studies, and the Evaluation Metrics
This study includes two experimental investigations centered on the detection and diagnosis of faults in PV panels. The first investigation focused on distinguishing faulty PV panels from non-faulty ones, while the second investigation aimed to identify the specific types of faults present in the PV panel. Experimental studies are carried out using simulated data with the PSIM software. In the simulated database, the data matrix is constructed as X = [V I P]. The matrix X comprises three attributes: V, I, and P generated by the PV system. The performance of the proposed NCA-CNN method was compared with other well-known traditional methods, such as LR, DT, RF, SVM, and XGBoost, as well as ANN. The comparison also included state-of-the-art models: CNN, PCA-CNN, and LSTM.
While simulated datasets may not fully capture the complexity and variability of real-world PV faults, utilizing PSIM-generated data provides a controlled environment where specific fault types can be systematically analyzed. This approach is crucial for benchmarking and fine-tuning fault classification models before they are applied to real-world conditions. Furthermore, although the NCA-CNN method has been used in previous research, it has not been extensively studied for PV fault detection, particularly in relation to the dynamically evolving characteristics of faults. This research enhances existing methodologies by integrating NCA for optimal feature selection with CNN-based spatial feature extraction, specifically targeting the unique fault signatures found in I-V and P-V curves. Additionally, a comparative evaluation against LSTM networks will provide deeper insights into the effectiveness of the NCA-CNN approach in addressing both spatially distinct and temporally evolving fault patterns. Future work will focus on validating the model using real-world PV datasets to ensure its applicability in practice.
The present study employs a classification process grounded in supervised learning methodologies. The efficacy of the employed classification algorithms is evaluated through a range of metrics derived from the confusion matrix. The confusion matrix serves as a critical tool for assessing the performance of classification algorithms. It provides a visual representation of the model’s ability to differentiate between distinct classes by comparing actual class labels with the predicted class labels produced by the ML model. In the study, the most common performance evaluation metric derived from the confusion matrix Accuracy Eq. (4) was used.
Since 2016, the use of CNN for fault detection in PV systems has increased. Initially, CNN models were developed based on electroluminescence and thermographic images to detect microcracks and cell defects in photovoltaic panels [41]. However, in recent years, CNN models have also been applied to time-series data, such as P-V and I-V curves, enabling the identification of various fault types [42]. Despite this progress, most fault diagnosis studies have implemented CNN architectures originally designed for image recognition without tailoring the architecture specifically for fault detection in PV systems [26]. In most fault detection studies, CNN architectures have been implemented using designs originally intended for image recognition without specific modifications for fault detection. However, each fault has unique characteristics, making both the number of data samples and the CNN architecture problem-specific. In image-based tasks such as pattern recognition, using a large number of samples enhances CNN performance. When faults manifest as localized changes in system output signals, such as I-V and P-V curves in a PV system, a dataset with fewer samples than what is typically found in pattern recognition problems actually improve the performance of CNNs [26].
Unlike, failing to select an appropriate sample range to capture these changes can significantly degrade CNN performance. Training CNN models using data samples from regions where faults cause significant deviations in I-V and P-V graphs compared to normal operating conditions enhances model performance by allowing it to learn fault characteristics more effectively. This analysis highlights the importance of developing a CNN model that prioritizes the physical outputs of the system rather than relying solely on a data-driven approach for fault detection [26]. Therefore, in this study, a comprehensive database was established from simulation results representing both healthy and faulty operational modes of the system. Data samples were taken from regions where faults cause significant deviations in I-V and P-V graphs compared to normal operating conditions.
In this study, a comprehensive database was established from simulation results representing both healthy and faulty operational modes of the system. The faulty mode encompasses three specific degradation scenarios: Fault A, Fault B, and Fault D, as well as partial shading represented by Fault C. Each I-V curve, consisting of 101 sampled data points collected over a one-minute interval, was utilized to capture the complete I-V characteristics effectively. Considering 101 samples is sufficient to scan the I-V curve of the investigated module [17]. The resulting data matrix, denoted as X, has dimensions of 515 × 3, with each row corresponding to a sample and each column representing an attribute such as voltage, current, and power. Within this dataset, 101 data points were designated to the healthy class, while the remaining points were categorized under the faulty class.
Fig. 13 shows the confusion matrix and ROC curve obtained in the PV fault detection process for the proposed NCA-CNN method. For the analysis, a training set comprising 67% of the overall data was generated, along with a test set containing the remaining samples, through random selection from the data matrix. Subsequently, fault detection results were derived from this methodology. This process was performed 10 times, with the mean results being presented in Fig. 13a in the form of a confusion matrix that illustrates the performance of the proposed method. Performing multiple test runs (commonly 10 times) and averaging the results is crucial for ensuring reliability, stability, and generalizability in model performance. This approach minimizes stochastic variability, prevents biased estimates, accounts for data variability, evaluates model robustness, and improves reproducibility. In DL models like CNNs, which exhibit stochastic behavior due to random weight initialization, dropout, and batch sorting, multiple runs smooth out fluctuations and provide a more consistent performance measure. Running the model multiple times reduces biases from dataset splits, ensuring a more comprehensive evaluation. Additionally, it helps detect instability, overfitting, or hyperparameter sensitivity. For fair model comparisons, averaging results prevents misleading conclusions from favorable random conditions. In research and industry, reporting an average performance metric with standard deviation enhances credibility and ensures reliable replication of findings. The ROC curve reaching the top-left corner in Fig. 13b indicates perfect separation between the two of the classes, healthy and faulty PV panel, with an AUC value of 1.0 This means the model achieves perfect classification accuracy, confirming that it can classify instances without any errors. The absence of a diagonal (random guess) region in the curve shows that the model maintains an ideal balance between sensitivity and specificity, with no trade-offs necessary. Overall, this ROC curve highlights the model’s exceptional ability to accurately distinguish between faulty and non-faulty conditions.

Figure 13: (a) Confusion matrix, and (b) ROC curve of PV fault detection process for proposed NCA-CNN method
Fig. 14 presents a comparative analysis of accuracy rates, evaluating the proposed model against well-known and state-of-the-art models. PV fault detection is performed by distinguishing between a healthy PV module and a faulty module, using the dataset obtained from I-V and P-V curves (Fig. 5). The fault signatures of healthy and faulty modules are distinguishable, indicating that the dataset is well-structured and ideal for ML models like CNN and NCA-CNN. This well-defined fault separation contributes to the high classification accuracy observed in Fig. 14, where both traditional ML models (LR, SVM, RF) and DL approaches (CNN, LSTM, PCA-CNN, NCA-CNN) achieved near-perfect classification performance, demonstrating the dataset’s effectiveness in PV fault identification. The paired t-test results confirm that NCA-CNN significantly outperforms traditional models like LR, DT, SVM, RF, and XGBoost, as shown by their extremely low p-values (p < 0.05) and negative infinity (−∞) t-statistics. While CNN had a slight but statistically significant difference, LSTM performed at the same level as NCA-CNN, showing no significant difference. ANN’s lower accuracy (0.97) confirmed its weaker classification performance. Overall, these results highlight NCA-CNN’s superior feature selection and DL capabilities, making it the best-performing model for PV fault detection.

Figure 14: PV fault detection results in term of accuracy metric
The plots presented in Fig. 15 offer a clear view of the model’s training and validation performance over 40 epochs. The loss function plot indicates a steady decrease in training loss, signifying effective learning. In contrast, the validation loss shows a sharp decline at first before stabilizing with minimal fluctuations. This stability in validation loss suggests that the model generalizes well without overfitting, as the gap between training and validation loss remains consistently small. Similarly, the accuracy curve illustrates a rapid increase in training accuracy during the initial epochs, approaching perfect accuracy. Meanwhile, the validation accuracy also aligns closely and stabilizes at a high level. The close agreement between training and validation metrics demonstrates the model’s robustness and strong generalization capabilities.
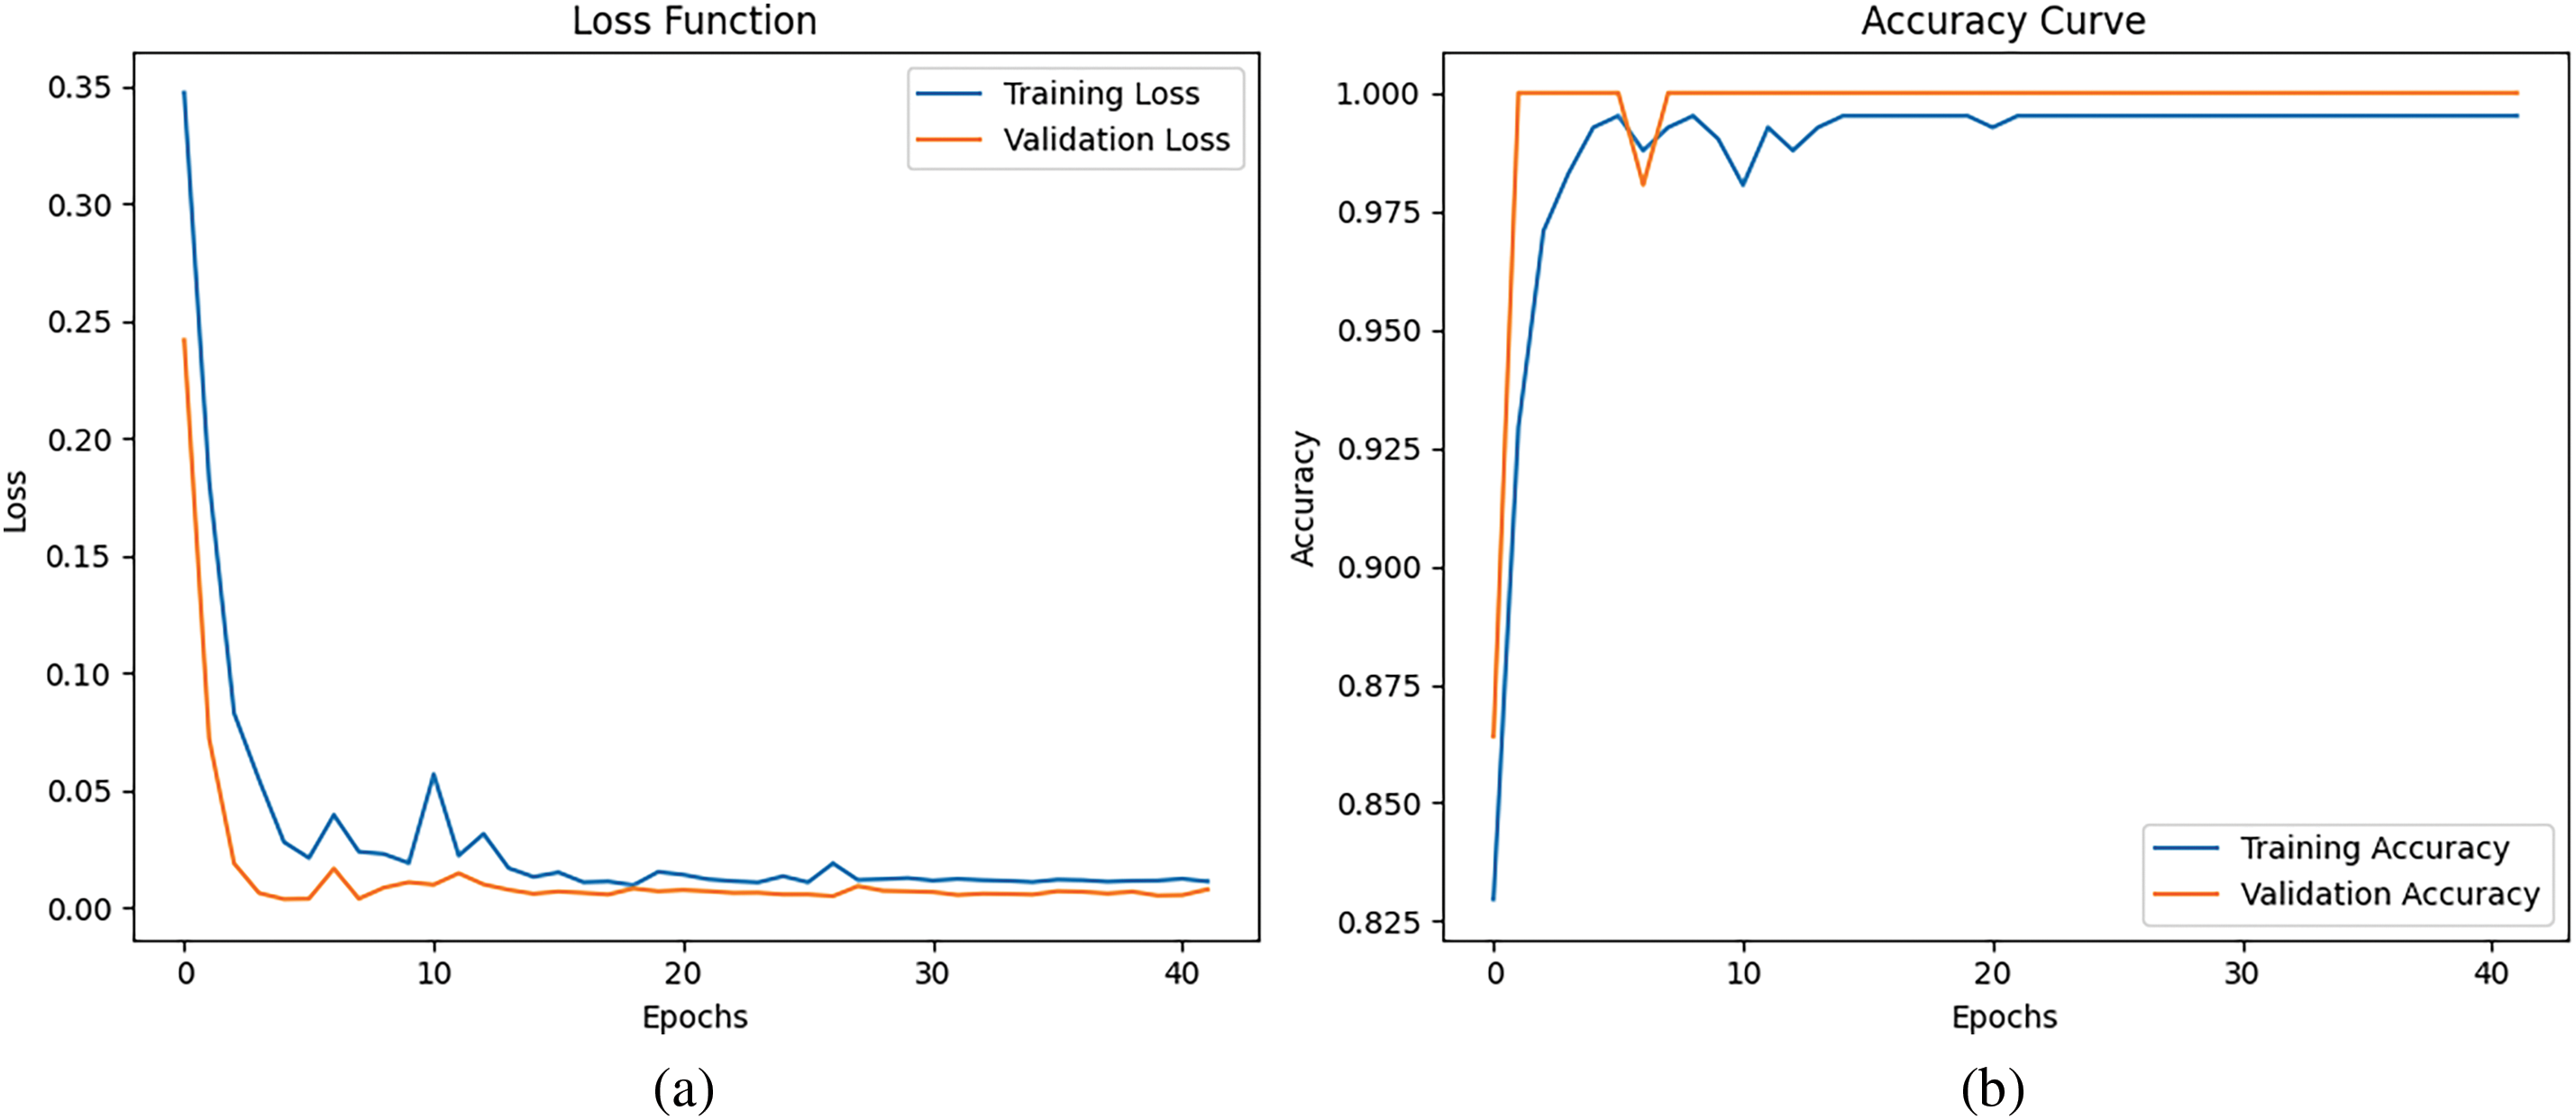
Figure 15: The proposed method’s (a) the loss curves for the training and the validation processes and (b) the accuracy curves for the training and the validation processes
The proposed results for PV fault detection were analyzed statistically alongside other classifiers, emphasizing their performances in terms of accuracy. The histogram of the PV fault detection data given in Fig. 16 and the overlaid density plot display a bell-shaped curve, indicating that the dataset closely follows a normal distribution. The density plot aligns well with the central peak and tails of the histogram, supporting this interpretation and suggesting that the dataset is symmetrical with minimal skewness. Similarly, the Q-Q plot given in Fig. 16, which compares the ordered values of the dataset to the theoretical quantiles of a standard normal distribution, shows that most data points are located close to the diagonal red line. This further confirms the dataset’s near-normal distribution. However, slight deviations at the tails, observed in the Q-Q plot, suggest minor departures from normality, possibly caused by outliers or extreme values. Despite these minor discrepancies, the dataset largely meets the assumptions of normality, making it suitable for statistical analyses utilizing paired t-tests that require such a distribution [43].
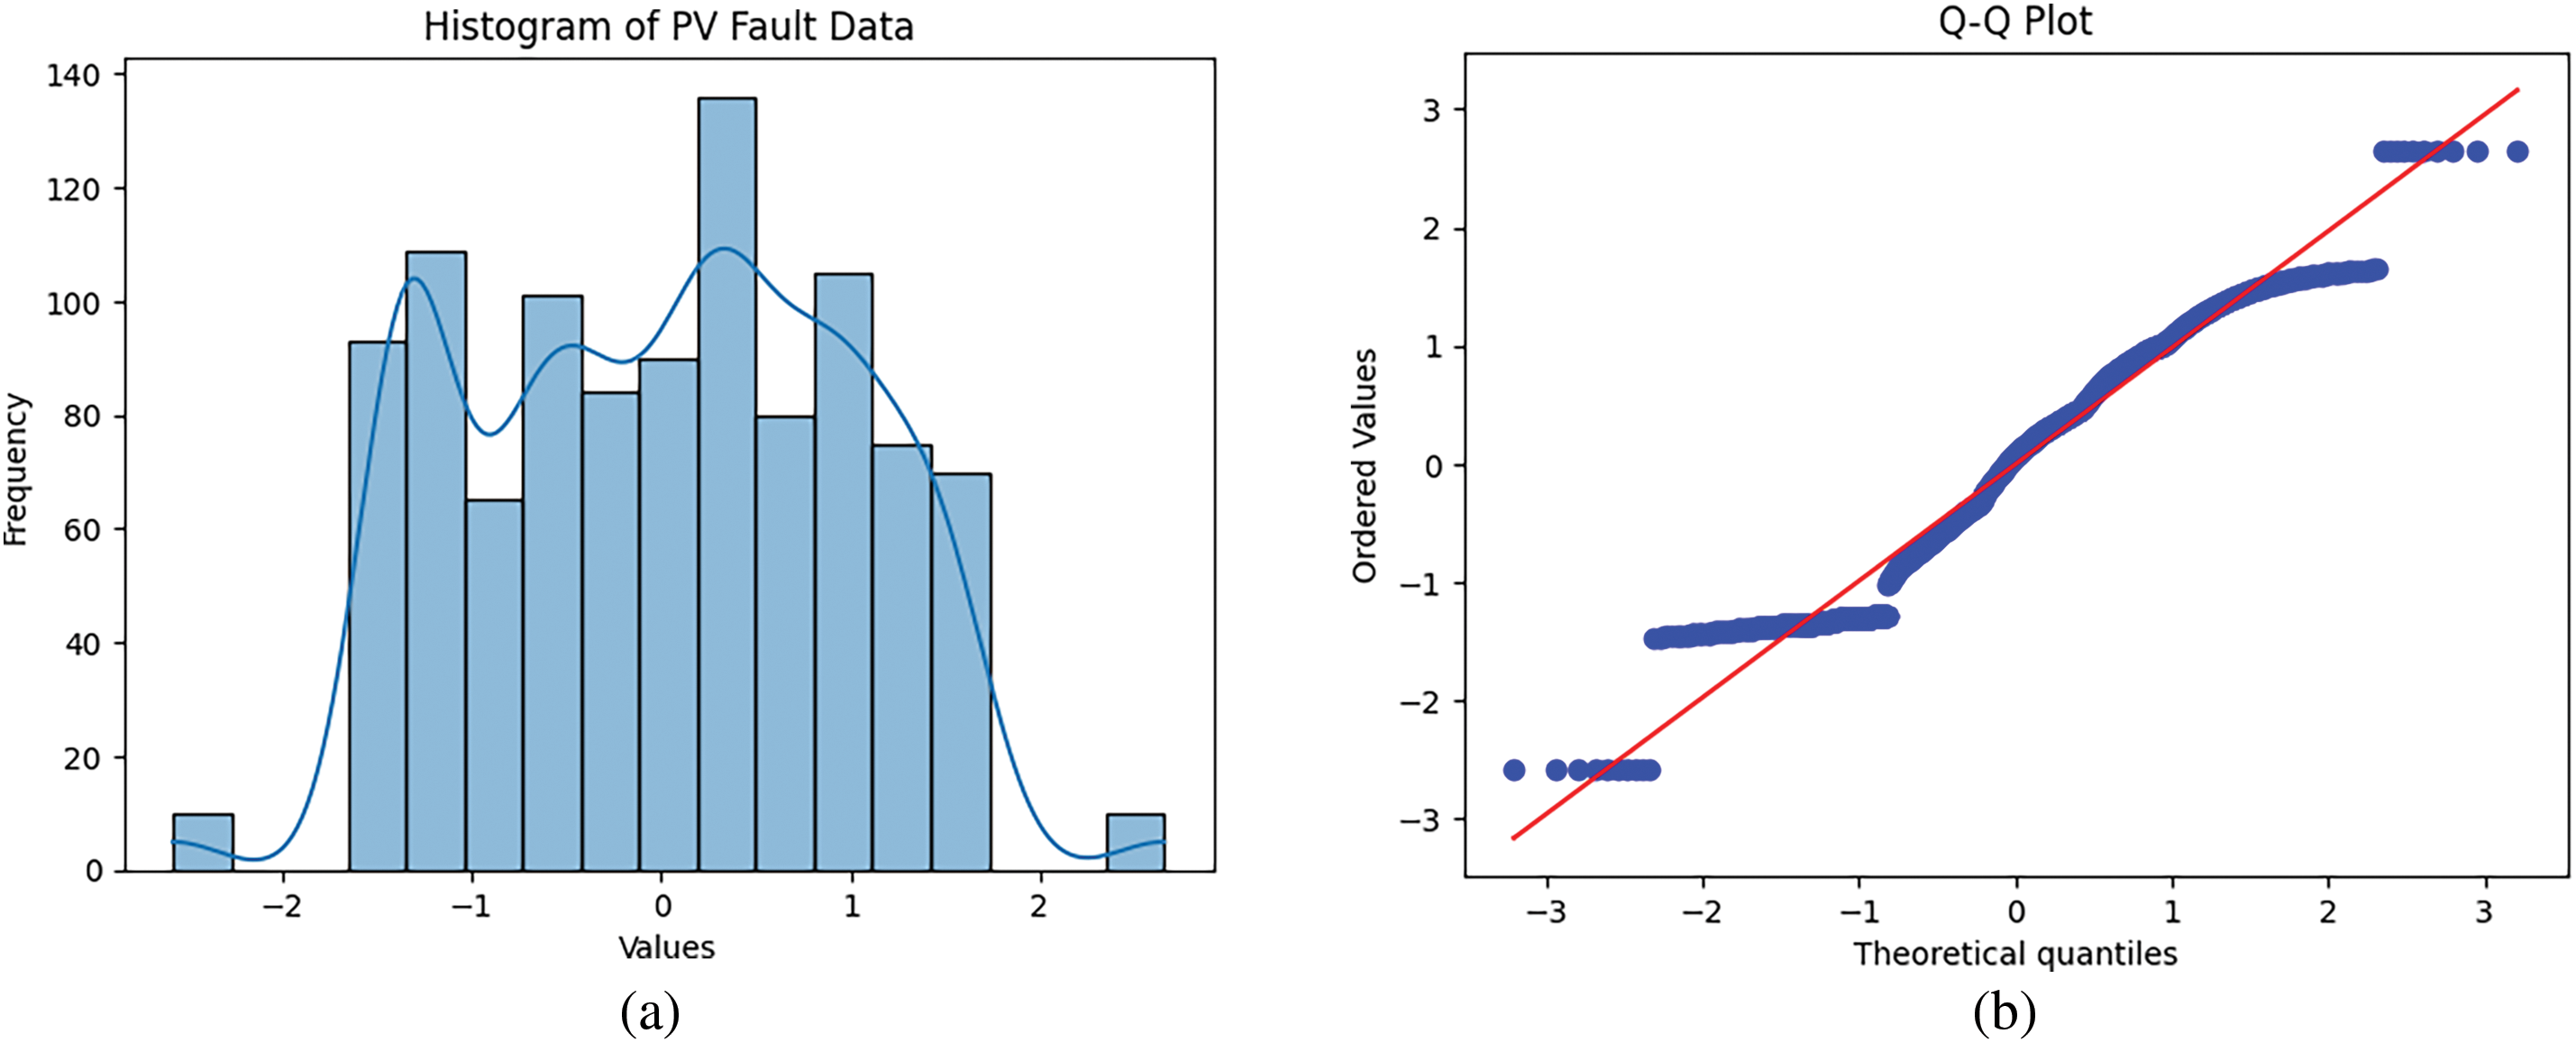
Figure 16: For the proposed method’s PV fault detection experiment, (a) the histogram and (b) the Q-Q plot
Fig. 17 shows the confusion matrix and ROC curve obtained in the PV fault detection process for the proposed NCA-CNN method. In this study, we investigated two distinct types of PV faults: degradation of series resistance and partial shading. Each I-V curve, consisting of 101 sampled data points collected over a one-minute interval, was utilized to capture the complete I-V characteristics effectively [17]. The second experimental setup involved a data matrix, designated as X, with dimensions of 404 × 3. Each fault class (1.5Rs, 2Rs,3Rs, and partial shaded) contained 101 data points, with rows representing various fault scenarios that included a series of degraded resistance and instances of partial shading. The columns corresponded to three attributes: V, I, and P. Consistent with the methodology employed in the first experimental study, we partitioned the dataset into a training set, comprising 67% of the total data, and a test set, representing the remaining portion. This division was accomplished by randomly selecting samples from the data matrix in each iteration. The process yielded fault diagnosis results, which were averaged over 10 repetitions to ensure reliability.

Figure 17: (a) Confusion matrix, and (b) ROC curve of PV fault diagnosis process for proposed NCA-CNN method
The results of the study are given in Fig. 17a in terms of the confusion matrix for the proposed NCA-CNN method. The matrix compares the predicted and actual values for four different fault types. The diagonal cells contain examples that the model correctly classified, with 30 correct classifications for Fault A, 33 for Fault B, 34 for Fault C, and 26 for Fault D. These results show that the proposed model can distinguish faults with high accuracy and performs quite well. Experimental study results obtained for the proposed NCA-CNN method were analyzed utilizing ROC curves. The One-vs-Rest (OvR) approach with ROC curve analysis demonstrated the NCA-CNN model’s exceptional classification performance. Fig. 17b shows perfect classification for FaultB and FaultD (AUC = 1.0) and near-perfect accuracy for FaultA and FaultC (AUC = 0.99). Both micro and macro-average ROC curves also achieved AUC = 0.99, confirming consistent performance across all fault types. The results indicate high sensitivity and specificity, significantly surpassing random guessing (AUC = 0.5), proving the model’s effectiveness in PV fault detection.
Fig. 18 compares the accuracy rates of the proposed model with both traditional ML models, such as LR, DT, RF, SVM, and ANN, and state-of-the-art DL models like XGBoost, LSTM, CNN, and PCA-CNN in PV fault diagnosis. The classification accuracy results indicate that CNN-based models significantly outperform traditional ML models, with NCA-CNN achieving the highest accuracy (0.99). This suggests that NCA effectively enhances CNN performance by selecting the most relevant features and eliminating noise. Other approaches, like XGBoost and CNN (both at 0.97), also demonstrated strong fault detection capabilities. LSTM, which is designed for sequential data, performed lower at 0.90, indicating that spatial feature extraction is more critical than temporal dependencies in this dataset. Meanwhile, PCA-CNN (0.81) underperformed compared to NCA-CNN, highlighting that PCA may discard essential features, whereas NCA optimally selects them. Traditional ML models, including DT and RF (both at 0.96), as well as LR and SVM (both at 0.82), showed moderate performance but failed to match DL models. These findings suggest that CNN-based models, particularly when combined with feature selection techniques like NCA, provide superior classification performance, making them the most effective approach for fault detection in this context.

Figure 18: PV fault diagnosis results in term of accuracy metric
Labeling faults as Fault A, B, or C, etc., with associated data rows in the developed PV fault diagnosis model may fail to capture the dynamic nature of real PV system faults, as these faults evolve due to changes in irradiance, temperature, and operational conditions, requiring models that can analyze both spatial and temporal dependencies. A model that is effective in monitoring fault progression, such as LSTM, may be considered. However, as seen in the results in Fig. 18, LSTM is less capable of detecting distinct spatial fault patterns than detecting spatial and temporal dependencies. In this study, NCA-CNN outperformed LSTM because the dataset benefits more from spatial feature extraction and optimal feature selection rather than sequential pattern recognition. The NCA component enhances CNN performance by retaining only the most relevant fault-related features, reducing dimensionality and noise, thereby allowing CNN to identify distinct spatial hierarchies more effectively. As demonstrated in Fig. 18, NCA-CNN achieves the highest classification accuracy by prioritizing feature selection and spatial analysis, reinforcing that static labeling and time-series-based methods alone are insufficient for capturing the dynamic nature of PV faults. These findings suggest that CNN-based models, particularly when combined with feature selection techniques like NCA, provide superior classification performance, making NCA-CNN the most effective approach for fault detection in this context.
Fig. 19 presents two graphical evaluations of the PV fault detection model: the Loss Function plot (left) and the Accuracy Curve plot (right). The loss function plot shows a steady decline in training loss, indicating effective learning, while validation loss stabilizes around epoch 20, suggesting strong generalization without overfitting. The accuracy curve reveals rapid training accuracy improvement, plateauing at 98%–100%, with validation accuracy following a similar trend. The close alignment of these metrics confirms the model’s robustness, high accuracy, and optimized performance, reinforcing its reliability for real-world applications.

Figure 19: The performance of the proposed method’s (NCA-CNN) for PV fault diagnosis: (a) loss function and (b) accuracy curve
The proposed results for PV fault diagnosing were analyzed statistically alongside other classifiers, emphasizing their performance in terms of accuracy. The histogram of the PV fault data given in Fig. 20 revealed a bell-shaped curve, indicating that the data closely follows a normal distribution. This finding is further supported by the overlaid density plot, which aligns well with the central peak and tails, suggesting symmetry and minimal deviations in skewness and kurtosis. Additionally, the Q-Q plot shows that most data points fall along the red reference line, representing theoretical normality. This conclusion supports the use of parametric statistical methods, such as paired t-tests, for further analysis of the data [43].

Figure 20: For the proposed method’s PV fault diagnosis experiment, (a) the histogram and (b) the Q-Q plot
The paired t-test results given in Table 2 confirm that NCA-CNN significantly outperforms all other models in PV fault detection. The low p-values (p < 0.05) indicate that the performance improvement is statistically significant and not due to random chance. Traditional ML models (LR, DT, SVM, RF, XGBoost) had significantly lower accuracy, with some showing negative infinity (−∞) t-statistics. Even DL models (ANN, CNN, PCA-CNN, LSTM) failed to match NCA-CNN’s accuracy. These results highlight the effectiveness of NCA for feature selection and CNN for deep spatial feature extraction, making NCA-CNN the best-performing model, offering superior accuracy and robustness over all other approaches.

The superior performance of the proposed hybrid approach can be attributed to its innovative combination of NCA and CNNs. This combination utilizes NCA for enhanced feature selection by learning a transformation that optimizes class separation and ensures that only the most relevant and discriminative features are retained for classification. This preprocessing step reduced noise and redundancy in the dataset, allowing the CNN to focus on meaningful patterns rather than irrelevant details. CNNs, on the other hand, excel at hierarchical feature learning and can be modified to extract hierarchical features by recognizing patterns and connections across the dataset such as relationships between single columns (linear correlations or specific thresholds), or non-linear interactions among several columns or patterns within certain data subsets. This gradual approach to feature extraction allowed CNNs to detect complex dependencies and representations in PV fault data that traditional models may struggle to capture. The synergy between these two methods ensured that the model benefits from optimized feature input while leveraging CNN’s powerful learning architecture to generalize well to unseen data.
Further, this hybrid approach incorporated an advanced optimization technique, adaptive optimizers (Adam), and dropout regularization strategy, which stabilize training and prevent overfitting. Early stopping mechanisms were also employed to avoid unnecessary epochs, maintaining model generalization. The alignment between the training and validation accuracy curves, as shown in the figure, highlighted the method’s effectiveness in generalizing while avoiding overfitting; unlike the traditional classifiers like LR or SVM, which do not possess the same level of sophistication in feature extraction and learning. While the proposed methodology, demonstrates promising results, the complexity of the approach and the absence of detailed implementation guidelines may hinder reproducibility and scalability, particularly for large datasets. In future studies, we will focus on enhancing scalability and efficiency for large datasets, improving model explainability, and establishing benchmarks. Key areas of improvement include developing customized CNN architectures for heterogeneous features and missing values, integrating domain knowledge for better interpretability. Addressing these limitations in future research could improve the methodology’s robustness, interpretability, and practicality for tabular data analysis.
The proposed NCA-CNN hybrid method combines NCA and CNN to create an advanced and scalable framework for fault detection and diagnosis in PV systems and significantly increases the reliability and efficiency of the algorithms used. In the hybrid method, NCA is utilized for effective feature selection and dimensionality reduction, allowing the system to identify critical patterns in historical performance data. CNN processes complex nonlinear data and captures complex features from datasets. The combined use of these features increases the early fault detection and comprehensive diagnosis capacity. Two experimental studies were conducted in the study. In the first study, the fault detection performance of the proposed method was evaluated, and it was found that the method detected faults with 100% accuracy. The proposed method outperformed all other methods with 99% accuracy. In this hybrid method, the integration of NCA and CNN not only reduced false positives but also provided precise fault detection and diagnosis. The method addressed the series resistance degradation and partial shading faults, facilitating timely maintenance in the PV system, optimizing system performance, and extending the life of PV installations.
This makes the NCA-CNN method a highly effective and reliable tool for modern PV fault detection and diagnosis. While NCA-CNN demonstrated better performance than LSTM in diagnosing PV faults due to its enhanced ability to extract spatial features and select optimal features, it does have some limitations. CNN is adept at identifying fault patterns in I-V and P-V curves, whereas LSTM’s focus on sequential learning didn’t yield a notable benefit, possibly because the dataset lacks pronounced temporal dependencies. However, NCA-CNN relies on simulated datasets, which may not adequately reflect real-world variability, and it also does not monitor fault progression over time, limiting its effectiveness for progressive or intermittent faults. While the NCA-CNN model offers strong generalization and fault detection capabilities, its practical application may present certain challenges. One significant limitation is the accuracy of measurements obtained from sensors and field equipment, which may not match the precision level provided by the PSIM simulator. Variations in sensor calibration, environmental conditions, and noise in real-world measurements can introduce discrepancies, potentially affecting the model’s reliability. Despite these challenges, the high classification accuracy of NCA-CNN indicates that spatial feature extraction is particularly effective for this dataset. Improvements to the NCA-CNN could enhance its adaptability and effectiveness in detecting faults in real-world PV systems. Integrating LSTM layers into the NCA-CNN can strengthen its ability to analyze spatial and temporal dependencies, making it better suited for detecting faults that develop gradually over time. Additionally, incorporating adaptive feature selection through a dynamic learning mechanism can enable NCA to prioritize relevant features based on the real-time conditions of the PV system. Future studies could investigate hybrid NCA-CNN-LSTM models to combine spatial and temporal learning for improved PV fault diagnosis.
Acknowledgement: Not applicable.
Funding Statement: The authors received no specific funding for this study.
Author Contributions: The authors confirm contribution to the paper as follows: Conceptualization, Umit Cigdem Turhal and Kutalmis Turhal; methodology, Umit Cigdem Turhal and Yasemin Onal; software, Umit Cigdem Turhal, Yasemin Onal and Kutalmis Turhal; investigation, Umit Cigdem Turhal, Yasemin Onal and Kutalmis Turhal; data curation, Yasemin Onal and Kutalmis Turhal; writing—original draft preparation, Yasemin Onal and Kutalmis Turhal; writing—review and editing, Umit Cigdem Turhal; visualization, Yasemin Onal and Kutalmis Turhal; supervision, Umit Cigdem Turhal. All authors reviewed the results and approved the final version of the manuscript.
Availability of Data and Materials: The data that support the findings of this study are available from the corresponding author, Yasemin Onal, upon reasonable request.
Ethics Approval: Not applicable.
Conflicts of Interest: The authors declare no conflicts of interest to report regarding the present study.
Highlights
• This study highlights the importance of accurate fault detection for reliable and efficient photovoltaic systems in sustainable energy. Integrating NCA with CNN enables automatic feature selection, eliminating noise and enhancing PV fault detection accuracy.
• Unlike traditional ML and LSTM models, NCA-CNN excels in capturing spatial dependencies, making it more robust for analyzing distinct PV fault hierarchies.
• The model precisely detects complex PV faults, including series resistance and shading effect issues.
• NCA-CNN achieved the highest accuracy (0.99), outperforming XGBoost, PCA-CNN, and LSTM, as confirmed by statistical analysis.
• NCA reduces dimensionality, boosting efficiency while preserving fault detection performance.
References
1. Kazem HA, Chaichan MT, Al-Waeli AH, Sopian K. A review of dust accumulation and cleaning methods for solar photovoltaic systems. J Clean Prod. 2020;276:123187. doi:10.1016/j.jclepro.2020.123187. [Google Scholar] [CrossRef]
2. Yuan Z, Xiong G, Fu X. Artificial neural network for fault diagnosis of solar photovoltaic systems: a survey. Energies. 2022;15(22):8693. doi:10.3390/en15228693. [Google Scholar] [CrossRef]
3. Mellit A, Tina GM, Kalogirou SA. Fault detection and diagnosis methods for photovoltaic systems: a review. Renew Sustain Energ Rev. 2018;91:1–17. doi:10.1016/j.rser.2018.03.062. [Google Scholar] [CrossRef]
4. Chen Z, Han F, Wu L, Yu J, Cheng S, Lin P, et al. Random forest based intelligent fault diagnosis for PV arrays using array voltage and string currents. Energy Convers Manag. 2018;178(3):250–64. doi:10.1016/j.enconman.2018.10.040. [Google Scholar] [CrossRef]
5. Hong YY, Pula RA. Methods of photovoltaic fault detection and classification: a review. Energy Rep. 2022;8(13):5898–929. doi:10.1016/j.egyr.2022.04.043. [Google Scholar] [CrossRef]
6. Amiri AF, Oudira H, Chouder A, Kichou S. Faults detection and diagnosis of PV systems based on machine learning approach using random forest classifier. Energy Convers Manag. 2024;301:118076. doi:10.1016/j.enconman.2024.118076. [Google Scholar] [CrossRef]
7. Badr MM, Hamad MS, Abdel-Khalik AS, Hamdy RA, Ahmed S, Hamdan E. Fault identification of photovoltaic array based on machine learning classifiers. IEEE Access. 2021;9:159113–32. doi:10.1109/ACCESS.2021.3130889. [Google Scholar] [CrossRef]
8. Adhya D, Chatterjee S, Chakraborty AK. Performance assessment of selective machine learning techniques for improved PV array fault diagnosis. Sustain Energy, Grids Netw. 2022;29:100582. doi:10.1016/j.segan.2021.100582. [Google Scholar] [CrossRef]
9. Dhibi K, Mansouri M, Bouzrara K, Nounou H, Nounou M. Reduced KPCA based ensemble learning approach for fault diagnosis of grid-connected PV systems. In: 19th International Multi-Conference on Systems, Signals & Devices (SSD); 2022; Sétif, Algeria. p. 841–5. doi:10.1109/SSD54932.2022.9955929. [Google Scholar] [CrossRef]
10. Wang J, Gao D, Zhu S, Wang S, Liu H. Fault diagnosis method of photovoltaic array based on support vector machine. Energy Sources, Part A: Recovery, Util Environ Effects. 2023;45(2):5380–95. doi:10.1080/15567036.2019.1671557. [Google Scholar] [CrossRef]
11. Cai X, Wai RJ. Intelligent DC arc-fault detection of solar PV power generation system via optimized VMD-based signal processing and PSO-SVM classifier. IEEE J Photovolt. 2022;12(4):1058–77. doi:10.1109/JPHOTOV.2022.3166919. [Google Scholar] [CrossRef]
12. Khatib T, Direya R, Said A. An improved method for extracting photovoltaic module I-V characteristic curve using hybrid learning machine system. J Sol Energy Eng. 2021;143(5):051006. doi:10.1115/1.4050349. [Google Scholar] [CrossRef]
13. Mandal RK, Anand N, Sahu N, Kale P. PV system fault classification using SVM accelerated by dimension reduction using PCA. In: IEEE 9th Power India International Conference (PIICON); 2020; Sonepat, India. p. 1–6. doi:10.1109/PIICON49524.2020.9112896. [Google Scholar] [CrossRef]
14. Ahmadipour M, Othman MM, Alrifaey M, Bo R, Ang CK. Classification of faults in grid-connected photovoltaic system based on wavelet packet transform and an equilibrium optimization algorithm-extreme learning machine. Measurement. 2022;197:111338. doi:10.1016/j.measurement.2022.111338. [Google Scholar] [CrossRef]
15. Bayoudh K. A survey of multimodal hybrid deep learning for computer vision: architectures, applications, trends, and challenges. Inf Fusion. 2024;105:102217. doi:10.1016/j.inffus.2023.102217. [Google Scholar] [CrossRef]
16. Azevedo BF, Rocha AMA, Pereira AI. Hybrid approaches to optimization and machine learning methods: a systematic literature review. Mach Learn. 2024;113(7):4055–97. doi:10.1007/s10994-023-06467-x. [Google Scholar] [CrossRef]
17. Fadhel S, Delpha C, Diallo D, Bahri I, Migan A, Trabelsi M. PV shading fault detection and classification based on IV curve using principal component analysis: application to isolated PV system. Sol Energy. 2019;179(11):1–10. doi:10.1016/j.solener.2018.12.048. [Google Scholar] [CrossRef]
18. Turhal U, Onal Y. Photovoltaic fault detection and classification using common vector approach based on IV curve. Acta Physica Polonica: A. 2020;137(3):421–9. doi:10.12693/APhysPolA.137.421. [Google Scholar] [CrossRef]
19. Goldberger J, Hinton GE, Roweis S, Salakhutdinov RR. Neighbourhood components analysis. In: Advances in neural information processing systems. Advances in Neural Information Processing Systems 17. NIPS. Cambridge, Massachusetts: MIT Press; 2004. [Internet]. [cited 2025 Mar 26]. Available from: https://proceedings.neurips.cc/paper_files/paper/2004/file/42fe880812925e520249e808937738d2-Paper.pdf. [Google Scholar]
20. Ofori-Ntow Jnr E, Ziggah YY, Rahmani-Andebili M, Rodrigues MJ, Relvas S. A novel three-stage short-term photovoltaic prediction approach based on neighborhood component analysis and ANN optimized with PSO (NCA-PSO-ANN). In: Applications of artificial intelligence in planning and operation of smart grids. Berlin/Heidelberg, Germany: Springer; 2022. p. 75–95. doi:10.1007/978-3-030-94522-0_3. [Google Scholar] [CrossRef]
21. Bayram HY, Bingol H, Alatas B. Hybrid deep model for automated detection of tomato leaf diseases. Traitement Signal. 2022;39(5):1781–7. doi:10.18280/ts.390537. [Google Scholar] [CrossRef]
22. Ding Y. Automatic modulation recognition of communication signal based on wavelet transform combined with singular value and NCA-CNN. In: IEEE 32nd Wireless and Optical Communications Conference (WOCC); 2023; Newark, NJ, USA. p. 1–6. doi:10.1109/WOCC58016.2023.10139354. [Google Scholar] [CrossRef]
23. Mohammad AT, Parchami J. Improving diabetic patients monitoring system using (NCA-CNN) algorithm based on loT. J Tech. 2024;6(2):9–17. doi:10.51173/jt.v6i2.2316. [Google Scholar] [CrossRef]
24. Duranay ZB. Fault detection in solar energy systems: a deep learning approach. Electronics. 2023;12(21):4397. doi:10.3390/electronics12214397. [Google Scholar] [CrossRef]
25. Janssens O, Slavkovikj V, Vervisch B, Stockman K, Loccufier M, Verstockt S, et al. Convolutional neural network based fault detection for rotating machinery. J Sound Vib. 2016;377(6):331–45. doi:10.1016/j.jsv.2016.05.027. [Google Scholar] [CrossRef]
26. Ruan D, Wang J, Yan J, Gühmann C. CNN parameter design based on fault signal analysis and its application in bearing fault diagnosis. Adv Eng Inform. 2023;55:101877. doi:10.1016/j.aei.2023.101877. [Google Scholar] [CrossRef]
27. Villalva MG, Gazoli JR, Ruppert Filho E. Comprehensive approach to modeling and simulation of photovoltaic arrays. IEEE Trans Power Electron. 2009;24(5):1198–208. doi:10.1109/TPEL.2009.2013862. [Google Scholar] [CrossRef]
28. Nacar M, Özer E, Yılmaz AE. A six parameter single diode model for photovoltaic modules. J Sol Energy Eng. 2021;143(1):011012. doi:10.1115/1.4047853. [Google Scholar] [CrossRef]
29. Pindado S, Cubas J. Simple mathematical approach to solar cell/panel behavior based on datasheet information. Renew. Energy. 2017;103:729–38. doi:10.1016/j.renene.2016.11.007. [Google Scholar] [CrossRef]
30. Tutorial PSIM. How to use solar module physical model. Tutorial-Solar-Module-physical-model. [Internet]. [cited 2025 Mar 26]. Available from: https://powersimtech.com/resources/tutorials/. [Google Scholar]
31. Deline C, Marion B, Granata J, Gonzalez S. Performance and economic analysis of distributed power electronics in photovoltaic systems. Technical Report. USA: National Renewable Energy Lab. (NRELGolden; 2011. doi: 10.2172/1004490. [Google Scholar] [CrossRef]
32. Bressan M, El Basri Y, Galeano AG, Alonso C. A shadow fault detection method based on the standard error analysis of IV curves. Renew Energy. 2016;99(3):1181–90. doi:10.1016/j.renene.2016.08.028. [Google Scholar] [CrossRef]
33. Bastidas-Rodríguez JD, Franco E, Petrone G, Ramos-Paja CA, Spagnuolo G. Model-based degradation analysis of photovoltaic modules through series resistance estimation. IEEE Trans Ind Electron. 2015;62(11):7256–65. doi:10.1109/TIE.2015.2459380. [Google Scholar] [CrossRef]
34. Spataru S, Sera D, Kerekes T, Teodorescu R. Diagnostic method for photovoltaic systems based on light I-V measurements. Sol Energy. 2015;119:29–44. doi:10.1016/j.solener.2015.06.020. [Google Scholar] [CrossRef]
35. Fadhel S, Migan A, Delpha C, Diallo D, Bahri I, Trabelsi M. Data-driven approach for isolated PV shading fault diagnosis based on experimental IV curves analysis. In: IEEE International Conference on Industrial Technology (ICIT); 2018; Lyon, France. p. 927–31. doi:10.1109/ICIT.2018.8352302. [Google Scholar] [CrossRef]
36. Han T, Zhang L, Yin Z, Tan AC. Rolling bearing fault diagnosis with combined convolutional neural networks and support vector machine. Measurement. 2021;177(109022):1–13. doi:10.1016/j.measurement.2021.109022. [Google Scholar] [CrossRef]
37. Iqbal MI, Mukta MSH, Hasan AR, Islam S. A dynamic weighted tabular method for convolutional neural networks. IEEE Access. 2022;10(1):134183–98. doi:10.1109/ACCESS.2022.3231102. [Google Scholar] [CrossRef]
38. LeCun Y, Kavukcuoglu K, Farabet C. Convolutional networks and applications in vision. In: Proceedings of International Symposium on Circuits and Systems; 2010; Paris, France. p. 253–6. doi:10.1109/ISCAS.2010.5537907. [Google Scholar] [CrossRef]
39. Santos CFGD, Papa JP. Avoiding overfitting: a survey on regularization methods for convolutional neural networks. ACM Comput Surv. 2022;54(10):1–25. doi:10.1145/3510413. [Google Scholar] [CrossRef]
40. Anam MK, Defit S, Haviluddin H, Efrizoni L, Firdaus MB. Early stopping on CNN-LSTM development to improve classification performance. J Appl Data Sci. 2024;5(3):1175–88. doi:10.47738/jads.v5i3.312. [Google Scholar] [CrossRef]
41. Chen H, Pang Y, Hu Q, Liu K. Solar cell surface defect inspection based on multispectral convolutional neural network. J Intell Manuf. 2020;31(2):453–68. doi:10.1007/s10845-018-1458-z. [Google Scholar] [CrossRef]
42. Ali YM, Ding L, Qin S. An efficient approach for diagnosing faults in photovoltaic array using 1D-CNN and feature selection Techniques. Int J Electr Power & Energy Syst. 2025;166(110526):1–13. doi:10.1016/j.ijepes.2025.110526. [Google Scholar] [CrossRef]
43. Kim TK. T test as a parametric statistic. Korean J Anesthesiol. 2015;68(6):540–6. doi:10.4097/kjae.2015.68.6.540. [Google Scholar] [PubMed] [CrossRef]
Cite This Article
 Copyright © 2025 The Author(s). Published by Tech Science Press.
This work is licensed under a Creative Commons Attribution 4.0 International License , which permits unrestricted use, distribution, and reproduction in any medium, provided the original work is properly cited.
 Downloads
 Citation Tools