
 Submit a Paper
 Propose a Special lssue
 Open Access
ARTICLE

Predicting Short-Term Wind Power Generation at Musalpetti Wind Farm: Model Development and Analysis
1 Department of Civil Engineering, Faculty of Engineering, The University of Tokyo, Bunkyo City, Tokyo, 113-8656, Japan
2 Department of Electronics, Faculty of Applied Sciences, Wayamba University of Sri Lanka, Kuliyapitiya, 60200, Sri Lanka
3 Department of Electrical Engineering, University of Malaya, Kuala Lumpur, 50603, Malaysia
4 Faculty of Engineering and Design, Atlantic Technological University, Sligo, F91 YW50, Ireland
* Corresponding Author: Upaka Rathnayake. Email:
(This article belongs to the Special Issue: Advanced Artificial Intelligence and Machine Learning Methods Applied to Energy Systems)
Computer Modeling in Engineering & Sciences 2025, 143(2), 2287-2305. https://doi.org/10.32604/cmes.2025.064464
Received 17 February 2025; Accepted 09 May 2025; Issue published 30 May 2025
 View Full Text
 Download PDF
Abstract
In this study, a machine learning-based predictive model was developed for the Musa petti Wind Farm in Sri Lanka to address the need for localized forecasting solutions. Using data on wind speed, air temperature, nacelle position, and actual power, lagged features were generated to capture temporal dependencies. Among 24 evaluated models, the ensemble bagging approach achieved the best performance, with R2 values of 0.89 at 0 min and 0.75 at 60 min. Shapley Additive exPlanations (SHAP) analysis revealed that while wind speed is the primary driver for short-term predictions, air temperature and nacelle position become more influential at longer forecasting horizons. These findings underscore the reliability of short-term predictions and the potential benefits of integrating hybrid AI and probabilistic models for extended forecasts. Our work contributes a robust and explainable framework to support Sri Lanka’s renewable energy transition, and future research will focus on real-time deployment and uncertainty quantification.Keywords
Supplementary Material
Supplementary Material FileAs nations transition toward sustainable energy solutions, wind power has emerged as a crucial renewable resource, offering a cleaner alternative to fossil fuels. In Sri Lanka, where energy demand continues to rise, harnessing wind energy presents a viable opportunity to enhance energy security while promoting environmental sustainability [1–3]. However, effective integration into the national grid requires accurate forecasting models to predict wind generation patterns. By anticipating wind resource availability, energy producers can optimize production schedules, reducing fuel consumption, emissions, and operational costs. Moreover, reliable forecasting enhances grid stability [4], minimizes fluctuations [5] and improves overall power system efficiency [6].
Wind power is a key renewable energy source that reduces fossil fuel dependence and combats climate change [7–9]. Accurate forecasting is vital for grid stability and economic efficiency. Various global methods using advanced statistical techniques [10], machine learning (ML) [11], and deep learning models [12] enhance predictive accuracy. Recent studies highlight the importance of deterministic and probabilistic approaches to manage uncertainties in wind generation [13]. Forecasting methodologies fall into three main categories: physical, statistical, and artificial intelligence (AI)-driven models. Physical models use numerical weather predictions (NWP), while statistical models like autoregressive integrated moving average (ARIMA) analyze historical data patterns [14]. Recently, AI techniques, such as long short-term memory (LSTM) networks and hybrid ensemble methods, have improved accuracy [15–17]. A significant challenge is capturing wind variability over various time frames, from minutes to months [18].
The following section reviews wind power forecasting research across regions, noting methodological advancements and their applicability to different climates. Europe leads in wind power forecasting, driven by its reliance on wind energy and grid stability needs. Countries like Denmark [19], Germany [20], Ireland [21] and the UK [22] have developed advanced forecasting models using hybrid methods. A key challenge is managing offshore wind farms, which face more significant wind variability than onshore locations [14]. Research has focused on AI-driven methods to improve short-and long-term predictions. Mishra et al. [17] compared deep learning models, including recurrent neural networks (RNNs) and convolutional neural networks (CNNs), finding attention-based models and deep convolutional networks, which are most effective with wavelet and fast Fourier transformation (FFT) signal transformations. Hanifi et al. [14] reviewed forecasting methods, noting the rise of hybrid models that combine physical methods with AI, highlighting challenges in uncertainty quantification and computational efficiency for real-time operations. Germany excels in hybrid models, whereas Bazionis and Georgilakis [13] demonstrated that merging numerical weather prediction (NWP) with deep learning yields superior accuracy. In addition, Dolatabadi et al. [18] proposed a bidirectional long short-term memory (BLSTM) model for wind speed forecasting, showing improved performance with discrete wavelet packet transformation (DWPT) for data preprocessing. Furthermore, the UK has explored probabilistic techniques to enhance grid stability and optimize energy dispatch. Zhang et al. [23] assessed various probabilistic models across European wind farms, stressing the importance of uncertainty quantification for short-term trading. Overall, AI-enhanced hybrid models have showcased improvement forecasting accuracy for many prediction models.
Wind power forecasting in Asia, especially China and India, has progressed significantly [24–27]. Large wind farms in these countries contribute considerably to energy grids but face unique challenges due to diverse climates and geography. Recent studies highlight the integration of ML and deep learning models with NWP data to enhance forecasting accuracy and grid stability [13]. In China, researchers have developed sophisticated hybrid forecasting models. Zhang et al. [23] emphasized ensemble methods for improving prediction reliability. Sherman et al. [28] analyzed climate model projections for wind power, noting that climate change affects future wind potential. Improved models that combine climate and meteorological data can help mitigate forecasting uncertainty. AI-driven models are extensively tested in China, with Alkesaiberi et al. [29] comparing various ML models and finding optimized Gaussian Process Regression (GPR) superior to traditional methods. Hanifi et al. [14] noted the rise of hybrid AI models integrating deep learning like LSTM with conventional models. In India, the renewable energy sector drives advancements in forecasting. Wang et al. [30] studied hybrid AI models using LSTM and found better accuracy than traditional methods. Dolatabadi et al. [18] introduced a BLSTM for wind speed forecasting. Ponkumar et al. evaluated advanced ML methods like LightGBM, CatBoost, and XGBoost for very short-term forecasting, where CatBoost excelled. Lipu et al. [31] analyzed hybrid forecasting approaches combining deep learning with fuzzy logic to improve performance in Indian wind farms. Despite the success, forecasting models in both countries still face challenges like data availability and computational efficiency [32]. Future research should focus on optimizing AI models, integrating high-resolution data, and expanding techniques for offshore wind farms.
North America, especially the USA and Canada, is another region who leads in wind power forecasting, which is essential for integrating large-scale wind energy into grids while maintaining stability [33,34]. Significant advancements in deterministic and probabilistic models have emerged from deep learning, hybrid AI techniques, and enhanced meteorological data [13]. The USA extensively researches AI-driven forecasting to optimize wind energy dispatch. Dolatabadi et al. [18] introduced a hybrid deep learning model combining discrete wavelet packet transformation (DWPT) and BLSTM networks, boosting forecasting accuracy for wind speed. Using datasets from the National Renewable Energy Laboratory (NREL) in Colorado, this study underscored the need to capture temporal dependencies in wind data. Moreover, Mishra et al. [17] compared various deep learning models, finding that CNNs and attention models excelled with frequency transformations like FFT and wavelet decomposition, showcasing signal processing’s importance in wind power predictions. In Canada, researchers have also worked on meteorological and AI-based models to enhance forecasting. Dolatabadi et al. [18] applied their BLSTM model to Edmonton datasets, finding that real-time weather data and Takens’ embedding theorem significantly improved forecast reliability. Additionally, Alkesaiberi et al. [29] assessed machine learning models, including GPR and Support Vector Regression (SVR), concluding that optimized GPR models surpassed other techniques in addressing short-term wind fluctuations. Zhang et al. [23] reviewed probabilistic forecasting, highlighting quantile regression and kernel density estimation (KDE) in managing uncertainty in wind predictions. The USA has increased the use of probabilistic techniques to enhance market operations. Wang et al. [30] demonstrated integrating uncertainty quantification improves decision-making in wind energy dispatch. Hanifi et al. [14] noted the trend of combining NWP data with AI-driven techniques, enhancing prediction accuracy across multiple timeframes. Overall, wind power forecasting in North America showcases the effectiveness of hybrid AI models, deep learning architectures, and probabilistic methods in improving accuracy.
While research on wind power forecasting is extensive, gaps persist in model generalizability, real-time deployment, and uncertainty quantification. Hybrid AI-driven models consistently outperform traditional methods across Europe, North America, and Asia, especially in short-term forecasting [13]. However, regional variations due to climate, topography, and data availability hinder forecasting performance. In the USA and Canada, models like BLSTM enhance accuracy by capturing temporal dependencies. Similarly, in China and India, XGBoost and CatBoost demonstrate competitive performance in very short-term forecasts [33]. Studies in Europe highlight the effectiveness of hybrid AI and NWP models, particularly in Germany and Denmark. Research from North America and Europe emphasizes probabilistic methods, such as quantile regression [23] Kernel density estimation (KDE) is commonly used in studies in Asia, often relying on deterministic models, which highlights a significant gap in uncertainty quantification. Techniques like FFT and DWPT improve model performance but are less commonly utilized in Asia and emerging markets.
While Europe, North America, and China have pioneered AI-driven wind power forecasting, emerging markets like Sri Lanka remain underrepresented in existing studies, highlighting the need for tailored modeling efforts. Probabilistic models, widely adopted in the USA and Europe, are still underutilized in most of the other countries [14], underscoring the importance of incorporating uncertainty-aware models to enhance wind power reliability. Adaptive hybrid models, which integrate AI with physical methods, are crucial for geographically diverse wind farms in Asia and Latin America but have seen limited implementation [14]. Additionally, the high computational demands of many AI-based forecasting techniques restrict their deployment in resource-constrained regions, necessitating research into lightweight neural networks and edge AI solutions.
Improving access to high-resolution wind power data in developing markets is also critical. Future research should prioritize data-sharing frameworks and transfer learning techniques to enhance model adaptability across diverse environments [35]. Addressing these gaps will refine forecasting methodologies, strengthen wind power integration into national grids, and optimize energy dispatch strategies, particularly for regions like Sri Lanka. To bridge this research gap, we propose developing a Short-Term Wind Power Generation Prediction System for the Musalpetti Wind Farm, focusing on model development and analysis tailored to local wind conditions. These insights presented in other countries benefit Sri Lanka Musalpetti Wind Farm, where similar techniques can enhance integration and grid stability. Future research should target real-time model deployment, uncertainty quantification, and expanding models to offshore wind farms.
In the Sri Lankan context, research studies developed wind energy prediction models for Nala Danavi and Pawan Danavi Wind Farm, utilizing both machine learning and statistical techniques [36]. No prior wind power prediction model research has been conducted for the Musalpetti Wind Farm, making this research uniquely valuable. Accurate wind power forecasting in this plant could greatly enhance electricity supply planning, helping to reduce reliance on coal, crude oil, and natural gas while paving the way for more sustainable energy practices. Therefore, the integration of deep learning, feature engineering, and probabilistic methods offers reliable solutions applicable to Sri Lanka’s Musalpetti Wind Farm for local forecasting enhancement.
In this research, predictive models tailored to Sri Lanka’s specific climatic and geographic conditions for Musalpetti Wind farm are developed and evaluated to forecast wind energy production accurately. The research objective is to determine the potential of wind power to offset fossil fuel generation during specific dates and times, helping to reduce dependency on non-renewable sources.
2 Study Area and Wind Farm Data
This study analyzes wind power generation at the Musalpetti Wind Farm, located in Kalpitiya, in Sri Lanka’s North-Western Province (Latitude: 8°13′44.6″, Longitude: 79°45′14.1″). Recognized as one of the most suitable locations for wind energy development in the country, Musalpetti was selected to establish a wind farm, which was connected to the national electricity grid in 2015. The onshore facility has a nameplate capacity of 10 MW and operates with five Gamesa G97 wind turbines (Siemens Gamesa, Zamudio, Spain). Power generation data, wind speed data, and temperature data from April 2019 to August 2024 were obtained from Musalpetti Wind Power (Pvt) Ltd., Sri Lanka. More details of the power plant can be found in https://www.senoksl.com/renewable-energy/wind-power-generation.html (accessed on 10 February 2025).
The Gamesa G97 wind turbine optimizes wind energy conversion efficiency through a combination of advanced technical parameters designed for maximum power generation, efficiency, and durability. Its 97 m rotor diameter provides a large swept area of approximately 7395 m2, allowing it to capture more wind energy, particularly at lower wind speeds. The turbine operates at rotational speeds between 9.6 and 17.8 rpm, adjusting dynamically to optimize energy capture under varying wind conditions. The three 47.5-m-long blades, made from pre-impregnated epoxy glass fiber and carbon fiber, enhance both durability and aerodynamic performance, utilizing advanced Gamesa Airfoils to reduce drag and improve lift. The variable-speed control system enables the rotor to adjust its speed based on wind conditions, optimizing power output while minimizing mechanical stress. The turbine begins generating power at a cut-in wind speed of around 3 m/s and reaches rated power at approximately 12–13 m/s, ensuring efficient operation even in moderate wind conditions. Additionally, Active Pitch Control continuously adjusts the blade angles to optimize energy capture at different wind speeds while preventing excessive loads in high winds. To further enhance performance, the modular tower, standing up to 100 m, provides access to stronger, more consistent winds, thereby increasing overall energy yield. Power transmission is managed through a high-performance gearbox with a one-planetary and two-parallel stage configuration, offering transmission ratios of 1:106.8 for 50 Hz systems and 1:127.1 for 60 Hz systems. The turbine operates with a 2.0 MW doubly-fed generator, running at 690 V AC and adaptable to both 50 and 60 Hz frequencies, ensuring high efficiency and grid compatibility. With a power factor range of 0.95 capacitive to 0.95 inductive, the generator ensures stable and efficient power conversion.
The data used in this study was collected from the Musalpetti Wind Farm from 01 April 2019, at 00:00 to 31 March 2024, at 23:50. The dataset consists of measurements recorded at 10-min intervals, providing a comprehensive time series representation of key parameters essential for wind power prediction. The primary variables collected include the following.
• Air Temperature (AT): Measured at a height of 10 m above ground level, recorded in degrees Celsius (°C). This parameter influences air density and, consequently, the efficiency of wind turbines.
• Nacelle Position (NP): The orientation of the nacelle, measured in degrees (°), determines the turbine’s alignment with respect to wind direction.
• Wind Speed (WS): Recorded at a height of 10 m in meters per second (m/s), representing the primary driving force behind wind power generation.
• Actual Power (AP): The wind turbine’s power output, recorded in kilowatts (kW), serves as the dependent variable for predictive modeling.
The collected data encompasses various operational conditions and seasonal variations, ensuring a robust dataset for short-term wind power prediction modeling. The dataset has been sourced directly from the wind farm’s monitoring systems, providing high accuracy and reliability. The comprehensive time span of five years allows for capturing long-term patterns and trends, which are crucial for developing effective predictive models.
Fig. 1 provides an overview of the methodology used in this study for short-term wind power prediction. The process begins with data collection from the Musalpetti Wind Farm, followed by data preprocessing steps such as handling missing values and creating lagged datasets. Machine learning models are then selected and trained, and their performance is evaluated using multiple metrics. Explainability techniques, specifically SHAP analysis, are employed to interpret model predictions and identify key influencing factors. Finally, insights are drawn from the results to optimize wind power forecasting.
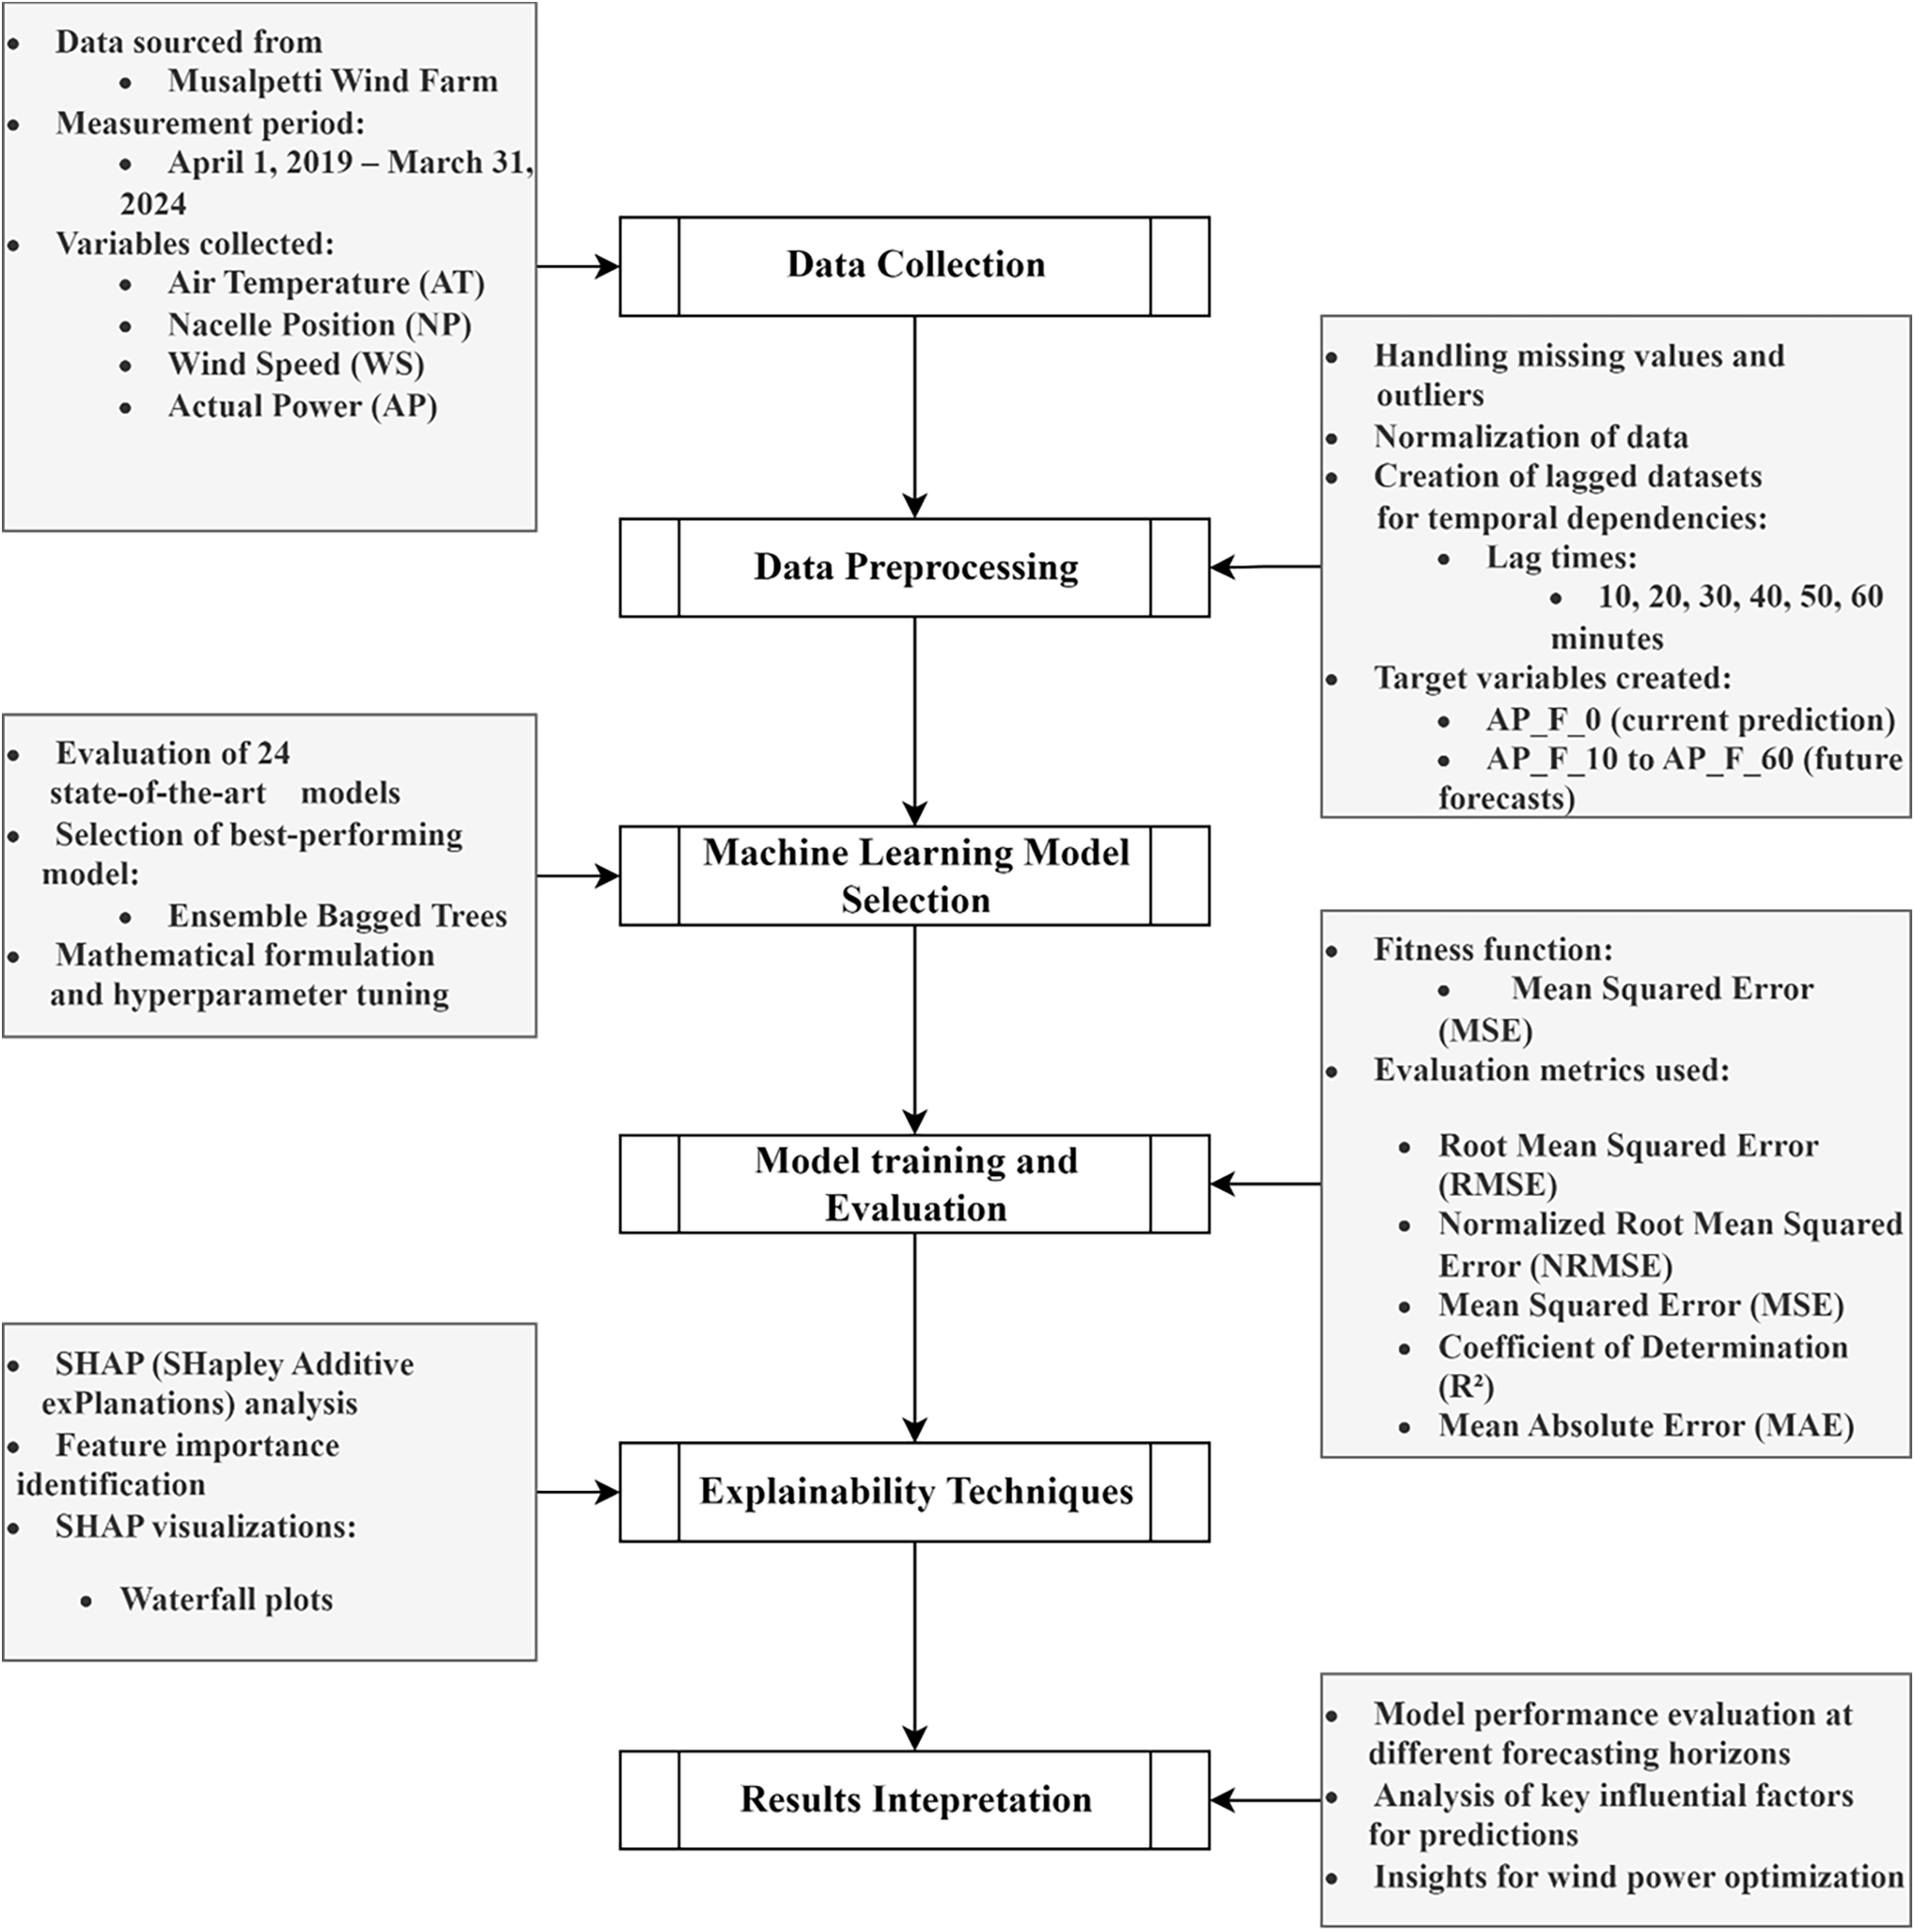
Figure 1: Flowchart of the methodology for wind power prediction at Musalpetti Wind Farm
The collected data underwent a series of standard preprocessing steps to ensure its quality and suitability for analysis. First, missing values were addressed using a two-step approach. For variables with less than 5% missing entries, median imputation was applied to maintain the central tendency of the data; for instances with more significant gaps, linear interpolation was employed to estimate the missing values based on adjacent observations. Next, outlier detection was conducted using the interquartile range (IQR) method. For each variable, values falling below Q1−1.5 × IQR or above Q3 + 1.5 × IQR were flagged as outliers and removed from the dataset to minimize their impact on model training.
Subsequently, data normalization was performed using min-max scaling, transforming each variable to a range of [0, 1]. This step ensured that all features contributed equally during model training and prevented any variable with larger numerical ranges from dominating the learning process.
To address potential overfitting, especially given that our dataset spans multiple years with varying seasonal patterns, we have implemented several strategies during data preprocessing and model training. First, we ensure robust data cleaning by handling missing values, removing outliers, and applying normalization to minimize noise that can lead to overfitting. Additionally, we employ time-series cross-validation techniques, which maintain the temporal order of data, ensuring that seasonal variations are appropriately captured, and the model is validated on genuinely unseen data. Finally, the use of ensemble methods like bagging further mitigates overfitting by aggregating the predictions of multiple models trained on different subsets of the data, thereby reducing variance and enhancing generalization across diverse seasonal conditions.
A preliminary analysis of the dataset showed a strong positive correlation of 0.96 between wind speed and power generation (refer to Table 1), while ambient temperature exhibited a positive relationship of 0.18 (refer to Fig. 2). These findings guided the selection of key variables for developing predictive models.


Figure 2: Daily generated power (GW) over the daily average wind speed (m/s) and daily average ambient temperature
Following initial preprocessing, the dataset was transformed by creating seven new datasets with lagged features. Specifically, lag times of 10, 20, 30, 40, 50, and 60 min were applied. These lag characteristics enhance the predictive power of the model by capturing the temporal dependencies of wind power generation. Incorporating lag features allows the model to exploit autocorrelation in variables such as wind speed and actual power, smooth out random fluctuations, and detect short-term cycles and trends. This enriched feature space provides a more comprehensive representation of the underlying dynamics, thereby improving forecasting accuracy across varying time horizons.
• AP_F_0: Represents the current power generation prediction (“NOW” forecast).
• AP_F_10: Predicts power generation 10 min into the future.
• AP_F_20: Predicts power generation 20 min into the future.
• AP_F_30: Predicts power generation 30 min into the future.
• AP_F_40: Predicts power generation 40 min into the future.
• AP_F_50: Predicts power generation 50 min into the future.
• AP_F_60: Predicts power generation 60 min into the future.
As a result, seven distinct datasets were created, each targeting a different forecasting horizon. This approach enables a comprehensive evaluation of the model’s predictive capabilities across varying time intervals.
3.3 Application of Machine Learning Models
In this study, 24 state-of-the-art machine learning models were evaluated to predict actual power (AP) using the preprocessed dataset (see Supplementary Material Table S1 for full evaluations). The ensemble Bagging model was selected as the best-performing model due to several key advantages. First, bagging reduces variance by aggregating multiple decision trees, each trained on different bootstrapped subsets of the data, which helps to prevent overfitting. Second, by averaging the predictions of these trees, the model becomes more robust to noise and outliers, smoothing out any individual errors. Third, this ensemble approach improves the model’s stability and reliability, capturing complex, non-linear relationships inherent in wind power generation data. Finally, the method is computationally efficient and scalable, making it ideal for handling the diverse and large-scale dataset from the Musalpetti Wind Farm. The following sections provide a detailed explanation of the ensemble Bagging model, its mathematical formulation, and a summary of its hyperparameters (refer to Table 2). Bagged trees combine predictions from multiple decision trees trained on bootstrapped datasets. Eq. (1) represents its mathematical formula [37].
where

Several evaluation metrics were used to assess the performance of the machine learning models in predicting wind power [38,39]. These metrics provide a comprehensive understanding of the model accuracy, reliability, and ability to generalize unseen data. The following metrics were employed for both validation and test datasets.
3.4.1 Root Mean Squared Error (RMSE)
The RMSE quantifies the average magnitude of the error between the predicted
where
3.4.2 Normalized Root Mean Squared Error (NRMSE)
The NRMSE is a performance metric that quantifies the prediction error relative to the range of observed values [40]. It provides a dimensionless evaluation of model accuracy, making it easier to compare errors across different datasets. NRMSE is particularly useful in assessing the consistency of model performance across varying scales. It is defined as in Eq. (3).
where
3.4.3 Mean Squared Error (MSE)
The MSE measures the average squared difference between predicted and actual values [41]. It penalizes more significant errors more heavily than RMSE, making it practical for identifying outliers. MSE is calculated as in Eq. (4).
3.4.4 Coefficient of Determination (
The
where
3.4.5 Mean Absolute Error (MAE)
The MAE represents the average absolute difference between predicted and actual values [42]. Unlike RMSE and MSE, MAE does not square the errors, making it less sensitive to outliers. MAE is expressed as in Eq. (6).
RMSE (validation), MSE (validation),
3.5 Explainability of the Developed Model
Understanding the inner workings of machine learning models is crucial for ensuring trust and interpretability [43], particularly when deploying models for critical applications like wind power prediction. This study employs SHAP to analyze feature importance, providing a transparent and interpretable framework for understanding the contributions of individual features. SHAP is an explainability technique based on cooperative game theory that assigns each feature a Shapley value, representing its contribution to the model’s prediction [44,45]. Shapley values offer a mathematically consistent way to distribute the prediction among the input features by considering all possible feature combinations. This ensures that the importance assigned to a feature is both fair and grounded in theoretical principles. The SHAP framework computes the contribution of each feature
where
This equation ensures that each feature’s contribution is computed by averaging its marginal impact across all possible feature subsets. Due to their complexity, machine learning models like Exponential GPR and neural networks are often treated as “black boxes” SHAP provides a means to unpack this complexity, assigning clear importance values to individual features. By quantifying the impact of each feature on the model’s predictions, SHAP helps identify the most critical factors driving AP predictions. This is particularly valuable for stakeholders in renewable energy systems, where understanding the influence of lagged variables like AT and WS is crucial for decision-making.
The consistent and theoretically sound framework of SHAP ensures that the explanations are unbiased and reliable, promoting trust in the model’s predictions, mainly when applied to high-stakes domains. SHAP offers intuitive visualizations, such as summary plots and dependence plots, which make it easier to communicate the results of feature importance analyses to non-technical stakeholders. By employing SHAP, this study enhances the interpretability of its models, aligning with the growing emphasis on explainability in machine learning applications. This approach not only improves the understanding of the model’s behavior but also provides actionable insights for optimizing wind energy systems.
Fig. 3 presents the correlation matrix of the relationships between input variables and target power outputs at various forecasting horizons (from AP_F_0 to AP_F_60) for the Musalpetti Wind Farm dataset. The color intensity indicates the strength and direction of the correlation, with red representing strong positive correlations and blue indicating weak or negative correlations.

Figure 3: Correlation matrix of input variables with target variables across different forecasting horizons for Musalpetti Wind Farm data
The variables analyzed include air temperature (AT), nacelle position (NP), wind speed (WS), and actual power (AP) at different lag times ranging from 10 to 60 min. As expected, WS and AP exhibit strong positive correlations with future power outputs across all forecasting horizons, indicating their critical role in wind power prediction. Conversely, AT and NP show relatively weaker correlations, suggesting a less direct impact on short-term power forecasting. The correlation values gradually decrease with increasing forecast horizons, reflecting the challenge of predicting power output further into the future. This exploratory analysis provides valuable insights into the importance of features and helps select relevant input variables for predictive modeling.
Fig. 3 presents the correlation matrix of the relationships between input variables and target power outputs at various forecasting horizons (from AP_F_0 to AP_F_60) for the Musalpetti Wind Farm dataset. The color intensity indicates the strength and direction of the correlation, with red representing strong positive correlations and blue indicating weak or negative correlations.
Fig. 4 presents a radar plot that visualizes the correlation between key input variables—Air Temperature (ATC), Nacelle Position (NPO), Wind Speed (WSP), and Actual Power (APW) with power output targets across different lag times (10 to 60 min). The plot provides a comprehensive view of how the influence of each input variable evolves over increasing lag periods. The APW and WSP variables exhibit consistently strong correlations across all lag times, reinforcing their importance in short-term wind power forecasting. In contrast, ATC and NPO show relatively weaker correlations, indicating their less direct impact on predicting future power output. This visualization helps in understanding the relative importance of each feature over time and aids in feature selection for predictive modeling.

Figure 4: Radar plot depicting the correlation of input variables with target power outputs across different lag times
4.2 Model Performance Evaluation
Table 3 presents the performance evaluation metrics for the wind power forecasting model at various future time intervals, ranging from 0 to 60 min. The evaluation metrics include RMSE, NRMSE, R2, MAE, and MSE, providing a comprehensive assessment of the model’s predictive accuracy.

The results indicate a clear trend: as the forecasting horizon increases, the prediction accuracy gradually declines. Specifically, the RMSE and MSE values consistently increase with more extended forecasting periods, reflecting a growing deviation between the predicted and actual values. For example, the RMSE increases from 0.192 at 0 min to 0.296 at 60 min, while the MSE nearly doubles over the same period. This trend highlights the increased uncertainty and difficulty associated with predicting wind power generation further into the future. Similarly, the NRMSE follows a rising trend, increasing from 0.0918 at 0 min to 0.1419 at 60 min, emphasizing a relative increase in error with respect to the actual power output.
The R2 value, a measure of the proportion of variance explained by the model, decreases from 0.8927 at 0 min to 0.7465 at 60 min. This decline can be attributed to several factors. Firstly, as the forecasting horizon extends, the direct influence of current wind conditions and power output on future values diminishes, weakening the temporal correlation. Secondly, longer forecast intervals inherently involve increased variability and uncertainty due to dynamic and non-linear atmospheric conditions, which lead to error propagation over time. Additionally, external factors, such as unexpected weather fluctuations or operational changes, may influence power generation more at longer horizons. Finally, while the inclusion of lagged features significantly improves short-term predictions, their effectiveness decreases over extended intervals, contributing to the lower explanatory power observed at 60 min.
The MAE also exhibits an increasing pattern, rising from 0.118 to 0.203, indicating higher absolute deviations between predictions and actual values with longer lead times. This suggests that short-term predictions are more reliable and precise, while longer-term forecasts are more prone to errors due to the inherent variability and unpredictability of wind patterns.
In summary, the model demonstrates high accuracy for short-term predictions but encounters increasing challenges as the forecasting horizon extends. These findings highlight the need for incorporating additional predictive techniques, such as feature engineering and advanced machine learning models, to mitigate forecast degradation over longer intervals.
Fig. 5 presents scatter plots illustrating the relationship between predicted and actual wind power values across various forecasting horizons, ranging from the current time (f_0) to 60 min into the future (f_60). Each subplot (a) to (g) represents the model’s performance at different forecasting intervals, highlighting the agreement between predicted and actual values.

Figure 5: Scatter plots comparing predicted and actual wind power values across different forecasting horizons for future times: (a) 0 min; (b) 10 min; (c) 20 min; (d) 30 min; (e) 40 min; (f) 50 min; (g) 60 min
As observed from the scatter plots, the model demonstrates substantial predictive accuracy for shorter forecasting horizons (f_0 and f_10), with data points closely clustering around the diagonal line, indicating a high correlation between predicted and actual values. However, as the forecasting horizon increases, the dispersion of data points increases, reflecting a decline in prediction accuracy. This trend suggests that short-term predictions are more reliable, whereas longer-term forecasts introduce more significant variability and uncertainty.
In the longer forecasting horizons (f_50 and f_60), the scatter plots show a noticeable spread, with more points deviating from the ideal prediction line. This pattern aligns with the performance evaluation metrics, where error measures such as RMSE and MAE increase over time, and the R2 value declines, indicating a reduced ability of the model to capture wind power fluctuations accurately. Overall, these scatter plots visually reinforce the quantitative findings, emphasizing that while the model performs well in short-term forecasting, predictive accuracy deteriorates as the forecast horizon extends. These insights can guide further improvements, such as incorporating additional features or leveraging advanced predictive algorithms to enhance long-term forecasting reliability.
Fig. 6 presents SHAP waterfall plots that visualize the contributions of individual input features to the predicted actual power (AP) at various forecasting horizons, ranging from immediate prediction (f_0) to 60 min into the future (f_60). For shorter forecast horizons (f_0 and f_10), wind speed (WS) emerges as the most dominant feature, providing significant positive contributions. This observation is consistent with the well-established physical principle that wind speed is the primary driver of wind energy conversion, with immediate effects on power output. The persistence of actual power (AP) from previous intervals further supports the continuity observed in short-term trends.

Figure 6: SHAP waterfall plots of the contributions of individual features to the predicted actual power (AP) across different forecasting horizons (f_0 to f_60) for: (a) 0 min; (b) 10 min; (c) 20 min; (d) 30 min; (e) 40 min; (f) 50 min; (g) 60 min
As the forecast horizon extends (f_20 to f_40), although WS continues to have a strong influence, the contributions of air temperature (AT) and nacelle position (NP) become more pronounced. Physically, AT affects the density of air, which in turn influences turbine efficiency; the lower the air density, the less efficient the energy conversion. Therefore, AT’s increasing contribution reflects the model’s need to account for variations in turbine performance over more extended periods. Additionally, NP indicates the turbine’s operational alignment with the wind direction. Over extended forecast horizons, adjustments in turbine orientation, whether due to mechanical recalibration or natural wind direction, change significantly impact performance, which explains the heightened importance of NP.
For longer forecasting horizons (f_50 and f_60), the model further shifts its reliance toward AT and NP, while the relative influence of WS diminishes. This shift suggests that, in the longer term, the cumulative effects of environmental variability (as captured by AT) and operational adjustments (reflected in NP) become critical in accurately predicting wind power generation. Essentially, while immediate power output is driven by current wind conditions, longer-term predictions benefit from a broader contextual understanding that integrates atmospheric and operational dynamics.
Overall, the SHAP analysis not only quantifies feature importance but also provides insights into the underlying physical and operational mechanisms of wind power generation. These insights facilitate targeted strategies for feature selection and model enhancement, ultimately contributing to more robust and accurate forecasting across different time horizons.
Affordable and clean energy is the 7th Sustainable Development Goal of the United Nations. Even though wind power generation has some initial higher costs in development, the energy generation is relatively less expensive compared to other energy sources. Therefore, wind power has greater potential as it was discussed in the introduction. However, prediction is highly important in the face of changing climatic conditions. Sri Lanka follows a complex electricity distribution system that has limited flexibility in balancing the temporal variability of the power demand. Therefore, preplanning is highly essential in securing a better balance between power demand and generation sources while providing the whole country with 24-h electricity. The country has gone through a 100% blackout in recent years due to unbalanced situations in the distribution network due to lower (higher) demands and uncertainty in generating sources, especially from solar power. Therefore, this verifies the requirement of short-term prediction in power generation. In addition, future research is needed in optimizing the distribution network for better public service. AI enhanced hybrid models while incorporating multi-objective optimization would be essential for better solutions [46,47].
The integration of wind energy into national grids necessitates accurate forecasting models to enhance energy planning and ensure grid stability. This study addressed the lack of wind power forecasting models for Musalpetti Wind Farm, developing a machine learning-based short-term predictive model that effectively captures wind power fluctuations. The ensemble bagging model demonstrated superior performance among 24 evaluated models, exhibiting high accuracy for short-term predictions but a gradual decline in predictive capability as the forecasting horizon extended.
Key findings revealed that wind speed remains the most influential predictor for all time horizons, but as the forecast period extends beyond 30 min, factors such as air temperature and nacelle position become increasingly significant. This shift underscores the dynamic nature of wind power generation, where short-term variability is governed by wind speed, while environmental and operational conditions influence long-term trends. The model’s effectiveness was validated using RMSE, NRMSE, R2, and MAE, confirming its reliability for short-term predictions.
Despite the model’s success, several challenges persist. Prediction accuracy declines over more extended time frames, emphasizing the need for hybrid AI techniques, probabilistic models, and uncertainty quantification to enhance long-term forecasting. Additionally, real-time deployment and computational efficiency must be addressed, particularly for resource-constrained regions. The study highlights the importance of explainability in machine learning applications, employing SHAP analysis to ensure transparency and interpretability of the predictive framework.
The implications of this research extend beyond Sri Lanka, offering insights for developing nations seeking to optimize renewable energy forecasting. Future research should focus on adaptive hybrid models, real-time forecasting systems, and enhanced data integration from meteorological sources to refine predictive accuracy further. In this regard, we plan to develop hybrid models by integrating our ensemble bagging approach with probabilistic models and deep learning techniques to better capture long-term trends and uncertainties. Additionally, advanced feature engineering methods, such as incorporating rolling window statistics, derivative-based features, and dynamic time warping, will be pursued to more effectively capture sudden weather changes and transient patterns. Furthermore, integrating supplementary data from nearby wind farms and weather stations is expected to provide a more comprehensive regional context, enhancing model adaptability and performance under varying environmental conditions. Ultimately, advancing wind power forecasting capabilities will play a crucial role in supporting sustainable energy transitions, reducing fossil fuel reliance, and fostering energy security in emerging economies.
Acknowledgement: The authors sincerely express their gratitude to Musalpetti Wind Power (Pvt) Ltd., Sri Lanka for generously providing the data that made this research possible. In addition, authors have used Grammarly.com to check the language of the manuscript.
Funding Statement: The authors received no specific funding for this study.
Author Contributions: The authors confirm contribution to the paper as follows: Namal Rathnayake—methodology, software, formal analysis, investigation, writing—original draft preparation; Rashmi Semasinghe—resources, data curation, visualization; Jeevani Jayasinghe—conceptualization, writing—review and editing, supervision; Upaka Rathnayake—conceptualization, writing—review and editing, supervision, project administration. All authors reviewed the results and approved the final version of the manuscript.
Availability of Data and Materials: Data not available due to legal restrictions.
Ethics Approval: Not applicable.
Conflicts of Interest: The authors declare no conflicts of interest to report regarding the present study.
Supplementary Materials: The supplementary material is available online at https://www.techscience.com/doi/10.32604/cmes.2025.064464/s1.
References
1. Kahatapitiya C, Jayasooriya VM, Muthukumaran S. GIS-based weighted overlay model for wind and solar farm locating in Sri Lanka. Environ Sci Pollut Res. 2022;30(44):98947–65. doi:10.1007/s11356-022-24595-0. [Google Scholar] [PubMed] [CrossRef]
2. Yasmeen R, Zhang X, Sharif A, Shah WUH, Dincă MS. The role of wind energy towards sustainable development in top-16 wind energy consumer countries: evidence from STIRPAT model. Gondwana Res. 2023;121:56–71. doi:10.1016/j.gr.2023.02.024. [Google Scholar] [CrossRef]
3. Amarasinghe AG, Perera ENC. Modeling predictive suitability to determine potential areas for establishing wind power plants in Sri Lanka. Model Earth Syst Environ. 2021;7(1):443–54. doi:10.1007/s40808-020-00868-w. [Google Scholar] [CrossRef]
4. Habbak H, Mahmoud M, Metwally K, Fouda MM, Ibrahem MI. Load forecasting techniques and their applications in smart grids. Energies. 2023;16(3):1480. doi:10.3390/en16031480. [Google Scholar] [CrossRef]
5. Shao B, Yao Z, Qiang Y. Point-interval forecasting for electricity load based on regular fluctuation component extraction. Energies. 2023;16(4):1988. doi:10.3390/en16041988. [Google Scholar] [CrossRef]
6. Herath D, Jayasinghe J, Rathnayake U. Forecasting electricity power generation of Pawan Danavi Wind Farm, Sri Lanka, using gene expression programming. Appl Comput Intell Soft Comput. 2022;2022(2):1–11. doi:10.1155/2022/7081444. [Google Scholar] [CrossRef]
7. Gan KE, Taikan O, Gan TY, Weis T, Yamazaki D, Schüttrumpf H. Enhancing renewable energy systems, contributing to sustainable development goals of United Nation and building resilience against climate change impacts. Energy Technol. 2023;11(11):1–19. doi:10.1002/ente.202300275. [Google Scholar] [CrossRef]
8. Shamoon A, Haleem A, Bahl S, Javaid M, Bala Garg S. Role of energy technologies in response to climate change. Mater Today Proc. 2022;62(2):63–9. doi:10.1016/j.matpr.2022.02.025. [Google Scholar] [CrossRef]
9. Kara T, Şahin AD. Implications of climate change on wind energy potential. Sustainability. 2023;15(20):14822. doi:10.3390/su152014822. [Google Scholar] [CrossRef]
10. Kumar K, Prabhakar P, Verma A, Saroha S, Singh K. Advancements in wind power forecasting: a comprehensive review of artificial intelligence-based approaches. Multimed Tools Appl. 2025;84(10):8331–60. doi:10.1007/s11042-024-18916-3. [Google Scholar] [CrossRef]
11. Sasser C, Yu M, Delgado R. Improvement of wind power prediction from meteorological characterization with machine learning models. Renew Energy. 2022;183(4):491–501. doi:10.1016/j.renene.2021.10.034. [Google Scholar] [CrossRef]
12. Karaman ÖA. Prediction of wind power with machine learning models. Appl Sci. 2023;13(20):11455. doi:10.3390/app132011455. [Google Scholar] [CrossRef]
13. Bazionis IK, Georgilakis PS. Review of deterministic and probabilistic wind power forecasting: models, methods, and future research. Electricity. 2021;2(1):13–47. doi:10.3390/electricity2010002. [Google Scholar] [CrossRef]
14. Hanifi S, Liu X, Lin Z, Lotfian S. A critical review of wind power forecasting methods—past, present and future. Energies. 2020;13(15):3764. doi:10.3390/en13153764. [Google Scholar] [CrossRef]
15. Wang WC, Du YJ, Chau KW, Xu DM, Liu CJ, Ma Q. An ensemble hybrid forecasting model for annual runoff based on sample entropy, secondary decomposition, and long short-term memory neural network. Wat Res Manag. 2021;35(14):4695–726. doi:10.21203/rs.3.rs-269127/v1. [Google Scholar] [CrossRef]
16. Sun Z, Zhao M, Zhao G. Hybrid model based on VMD decomposition, clustering analysis, long short memory network, ensemble learning and error complementation for short-term wind speed forecasting assisted by Flink platform. Energy. 2022;261(11):125248. doi:10.1016/j.energy.2022.125248. [Google Scholar] [CrossRef]
17. Mishra S, Bordin C, Taharaguchi K, Palu I. Comparison of deep learning models for multivariate prediction of time series wind power generation and temperature. Energy Rep. 2020;6:273–86. doi:10.1016/j.egyr.2019.11.009. [Google Scholar] [CrossRef]
18. Dolatabadi A, Abdeltawab H, Mohamed YARI. Hybrid deep learning-based model for wind speed forecasting based on DWPT and bidirectional LSTM network. IEEE Access. 2020;8:229219–32. doi:10.1109/access.2020.3047077. [Google Scholar] [CrossRef]
19. Sørensen ML, Nystrup P, Bjerregård MB, Møller JK, Bacher P, Madsen H. Recent developments in multivariate wind and solar power forecasting. Wiley Interdiscip Rev Energy Environ. 2023;12(2):1–20. doi:10.1002/wene.465. [Google Scholar] [CrossRef]
20. Farah S, David AW, Humaira N, Aneela Z, Steffen E. Short-term multi-hour ahead country-wide wind power prediction for Germany using gated recurrent unit deep learning. Renew Sustain Energy Rev. 2022;167(2):112700. doi:10.1016/j.rser.2022.112700. [Google Scholar] [CrossRef]
21. González-Sopeña JM, Pakrashi V, Ghosh B. An overview of performance evaluation metrics for short-term statistical wind power forecasting. Renew Sustain Energy Rev. 2021;138(3):110515. doi:10.1016/j.rser.2020.110515. [Google Scholar] [CrossRef]
22. Tawn R, Browell J. A review of very short-term wind and solar power forecasting. Renew Sustain Energy Rev. 2022;153(10):111758. doi:10.1016/j.rser.2021.111758. [Google Scholar] [CrossRef]
23. Zhang Y, Wang J, Wang X. Review on probabilistic forecasting of wind power generation. Renew Sustain Energy Rev. 2014;32:255–70. doi:10.1016/j.rser.2014.01.033. [Google Scholar] [CrossRef]
24. Kumar S, Singh P, Gupta A, Ashrit R, Kumar Mishra A, Rai S. Wind power forecasting over India: value-addition to a coupled model seasonal forecasts. Clean Energy. 2025;9(2):37–51. doi:10.1093/ce/zkae094. [Google Scholar] [CrossRef]
25. Mahata S, Harsh P, Shekher V. Comparative study of time-series forecasting models for wind power generation in Gujarat, India. E-Prime-Adv Electr Eng Electron Energy. 2024;8(2):100511. doi:10.1016/j.prime.2024.100511. [Google Scholar] [CrossRef]
26. Luo X, Zeng B, Li H, Zhou W. Forecasting Chinese wind power installed capacity using a novel grey model with parameters combination optimization. J Math. 2021;2021(1):9200560. doi:10.1155/2021/9200560. [Google Scholar] [CrossRef]
27. Zhang Z, Lin L, Gao S, Wang J, Zhao H. Wind speed prediction in China with fully-convolutional deep neural network. Renew Sustain Energy Rev. 2024;201(1):114623. doi:10.1016/j.rser.2024.114623. [Google Scholar] [CrossRef]
28. Sherman P, Song S, Chen X, McElroy M. Projected changes in wind power potential over China and India in high resolution climate models. Environ Res Lett. 2021;16(3):034057. doi:10.1088/1748-9326/abe57c. [Google Scholar] [CrossRef]
29. Alkesaiberi A, Harrou F, Sun Y. Efficient wind power prediction using machine learning methods: a comparative study. Energies. 2022;15(7):2327. doi:10.3390/en15072327. [Google Scholar] [CrossRef]
30. Wang HK, Song K, Cheng Y. A hybrid forecasting model based on CNN and informer for short-term wind power. Front Energy Res. 2022;9:788320. doi:10.3389/fenrg.2021.788320. [Google Scholar] [CrossRef]
31. Lipu MSH, Miah MS, Hannan MA, Hussain A, Sarker MR, Ayob A, et al. Artificial intelligence based hybrid forecasting approaches for wind power generation: progress, challenges and prospects. IEEE Access. 2021;9:102460–89. doi:10.1109/access.2021.3097102. [Google Scholar] [CrossRef]
32. Azad HB, Mekhilef S, Ganapathy VG. Long-term wind speed forecasting and general pattern recognition using neural networks. IEEE Trans Sustain Energy. 2014;5(2):546–53. doi:10.1109/tste.2014.2300150. [Google Scholar] [CrossRef]
33. Yang X, Delworth TL, Jia L, Johnson NC, Lu F, McHugh C. Skillful seasonal prediction of wind energy resources in the contiguous United States. Commun Earth Environ. 2024;5(1):313. doi:10.1038/s43247-024-01457-w. [Google Scholar] [CrossRef]
34. Ma X, Li Y, Li Z. The projection of Canadian wind energy potential in future scenarios using a convection-permitting regional climate model. Energy Rep. 2022;8(D12):7176–87. doi:10.1016/j.egyr.2022.05.122. [Google Scholar] [CrossRef]
35. Ponkumar G, Jayaprakash S, Kanagarathinam K. Advanced machine learning techniques for accurate very-short-term wind power forecasting in wind energy systems using historical data analysis. Energies. 2023;16(14):5459. doi:10.3390/en16145459. [Google Scholar] [CrossRef]
36. Peiris AT, Jayasinghe J, Rathnayake U. Forecasting wind power generation using artificial neural network: “Pawan Danawi”—a case study from Sri Lanka. J Electr Comput Eng. 2021;2021(5):5577547. doi:10.1155/2021/5577547. [Google Scholar] [CrossRef]
37. Altman N, Krzywinski M. Ensemble methods: bagging and random forests. Nat Methods. 2017;14(10):933–4. doi:10.1038/nmeth.4438. [Google Scholar] [CrossRef]
38. Elmousalami H, Elmesalami HH, Maxi M, Farid AAKM, Elshaboury N. A comprehensive evaluation of machine learning and deep learning algorithms for wind speed and power prediction. Decis Anal. 2024;13:100527. doi:10.1016/j.dajour.2024.100527. [Google Scholar] [CrossRef]
39. Ayene SM, Yibre AM. Wind power prediction based on deep learning models: the case of Adama wind farm. Heliyon. 2024;10(21):e39579. doi:10.1016/j.heliyon.2024.e39579. [Google Scholar] [PubMed] [CrossRef]
40. Rathnayake N, Rathnayake U, Chathuranika I, Dang TL, Hoshino Y. Cascaded-ANFIS to simulate nonlinear rainfall-runoff relationship. Appl Soft Comput. 2023;147(5):110722. doi:10.1016/j.asoc.2023.110722. [Google Scholar] [CrossRef]
41. Mampitiya L, Rathnayake N, Hoshino Y, Rathnayake U. Forecasting PM10 levels in Sri Lanka: a comparative analysis of machine learning models PM10. J Hazard Mat Adv. 2024;13(2):100395. doi:10.1016/j.hazadv.2023.100395. [Google Scholar] [CrossRef]
42. Rathnayake N, Dang TL, Hoshino Y. A novel optimization algorithm: cascaded adaptive neuro-fuzzy inference system. Int J Fuzzy Syst. 2021;23(7):1955–71. doi:10.1007/s40815-021-01076-z. [Google Scholar] [CrossRef]
43. Makumbura RK, Mampitiya L, Rathnayake N, Meddage DPP, Henna S, Dang TL, et al. Advancing water quality assessment and prediction using machine learning models, coupled with explainable artificial intelligence (XAI) techniques like Shapley additive explanations (SHAP) for interpreting the black-box nature. Res Eng. 2024;23(2):102831. doi:10.1016/j.rineng.2024.102831. [Google Scholar] [CrossRef]
44. Liao W, Fang J, Ye L, Bak-Jensen B, Yang Z, Porte-Agel F. Can we trust explainable artificial intelligence in wind power forecasting? Appl Energy. 2024;376(2):124273. doi:10.1016/j.apenergy.2024.124273. [Google Scholar] [CrossRef]
45. Cakiroglu C, Demir S, Hakan Ozdemir M, Latif Aylak B, Sariisik G, Abualigah L. Data-driven interpretable ensemble learning methods for the prediction of wind turbine power incorporating SHAP analysis. Expert Syst Appl. 2024;237(7):121464. doi:10.1016/j.eswa.2023.121464. [Google Scholar] [CrossRef]
46. Li L, Ji B, Lim MK, Tseng M. Active distribution network operational optimization problem: a multi-objective tuna swarm optimization model. Appl Soft Comput. 2023;150(1):111087. doi:10.1016/j.asoc.2023.111087. [Google Scholar] [CrossRef]
47. Ji B, Liu H, Cheng P, Ren X, Pi H, Li L. Phased optimization of active distribution networks incorporating distributed photovoltaic storage system: a multi-objective coati optimization algorithm. J Energy Storage. 2024;91(1):112093. doi:10.1016/j.est.2024.112093. [Google Scholar] [CrossRef]
Cite This Article
 Copyright © 2025 The Author(s). Published by Tech Science Press.
This work is licensed under a Creative Commons Attribution 4.0 International License , which permits unrestricted use, distribution, and reproduction in any medium, provided the original work is properly cited.
 Downloads
 Citation Tools