
 Submit a Paper
 Propose a Special lssue
 Open Access
ARTICLE
Fatigue Life Prediction Using Finite Element Hot-Spot and Notch Approaches: Strain-Based FAT Curves Proposal for Ti6Al4V Joints
Department of Engineering, University of Messina, Contrada di Dio, Sant’Agata, Messina, 98166, Italy
* Corresponding Author: Pasqualino Corigliano. Email:
Computer Modeling in Engineering & Sciences 2025, 144(2), 1935-1955. https://doi.org/10.32604/cmes.2025.067094
Received 25 April 2025; Accepted 05 August 2025; Issue published 31 August 2025
 View Full Text
 Download PDF
Abstract
Experimental tests are essential for evaluating S-N curves and assessing the fatigue life of welded joints. However, in the case of complex geometries, experimental tests often cannot provide the necessary stress-strain data for specific materials and welded joints. Therefore, finite element (FE) analyses are frequently utilized to assess fatigue behavior in complex geometries and address the discontinuities induced by welding processes. In this study, the fatigue properties of titanium welded joints, produced using an innovative laser source and welded without the use of filler materials, were analyzed through numerical methods. Two different FE methods were applied to T-specimens fabricated from Ti6Al4V sheets: the hot-spot stress and notch-stress approach. The FE fatigue life predictions were validated using experimental fatigue test results. The Hot-Spot Stress method yielded a fatigue limit slightly below 100 MPa, demonstrating a consistent slope in the S-N response. Conversely, the Notch Stress method, using a 1 mm fictitious notch radius, indicated a higher fatigue strength corresponding to a range between 225 and 250 MPa, providing a more conservative and localized fatigue estimate. Fatigue resistance in welded joints of steel and aluminum is commonly assessed using specific fatigue classes called “Fatigue Strength Classes (FAT) curves” and their associated S-N curves as recommended by the International Institute of Welding (IIW). However, no such FAT class assignments currently exist for titanium alloys. To address this gap, strain-based FAT curves were proposed by normalizing steel FAT curves using titanium’s elastic properties. This strain-based framework enables direct comparison across materials and provides a foundation for fatigue evaluation of titanium weldments. The author proposed a procedure to normalize steel FAT curves considering the different elastic material properties, enabling a comparison with Ti6Al4V data in terms of hot spot strain or notch strain. This approach facilitates the development of a universal framework for strain-based fatigue evaluation across different materials.Keywords
Titanium is widely used in many sectors as aerospace, automotive, medical and marine industries, where is attracting the attention of stakeholders and engineers as a result of its lightweight properties combined with high-level mechanical performances and durability [1]. Nonetheless, marine applications of titanium components and, more specifically of titanium welded joints, still pose some questions, especially when focusing on the complex phenomena triggered both by cycling loading conditions [2] and an aggressive environment, typical of a marine context [3], leading to corrosion fatigue [4]
Offshore structures and sub-sea pipelines are continuously exposed to cyclic mechanical loading, which over time can lead to the initiation and propagation of fatigue cracks. Multiple studies have underscored the critical role of fatigue in the design of offshore components, with emphasis on the unique behavior under ocean-induced load spectrums, such as wave-induced vibrations and current interactions [3,5–8].
Corrosion-fatigue, especially in marine atmospheres, further intensifies this phenomenon, as reported in Refs. [4,9]. A consolidated review of fatigue mechanisms in marine structures, including corrosion fatigue in harsh sea environments, can be found in Refs. [9–12].
Emerging structural materials like titanium have garnered attention for their performance in subsea systems, including applications in risers, pressure housings, and subsea wellheads [13,14]. For instance, the implementation of Tapered Stress Joints (TSJs) using titanium marked a turning point for fatigue-prone riser systems operating under deepwater cyclic loading [15]. With regards to weldability, titanium alloys should be treated carefully, considering their well-known high reactivity with atmospheric gases at high temperature and their susceptibility to columnar grain formation when exposed to gas tungsten arc welding [16]. Therefore, more advanced welding technologies, such as laser welding [16,17] or friction stir welding [18], which avoid the above-mentioned problems, have proved to be a reliable solution to weld titanium alloys. The titanium alloy Ti-6Al-4V (Grade 5) is notable for its excellent yield strength (~827 MPa), low elastic modulus and superior resistance to erosion and corrosion in the presence of drill muds and saline fluids, toughness, good thermal stability [16,18]. However, its fatigue resistance, as well as that of other titanium alloys, is highly sensitive to weld quality and countless other factors. For instance, as observed also with the support of numerical analysis in Refs. [19,20] welding residual stress affects the fatigue life of titanium welded joints, especially when exposed to harsh conditions, such as creep or a hydrogen environment. The composition of the welded joint is also crucial, as suggested by Long et al. [21] who observed an improvement in fatigue strength after incorporating a titanium foil in laser-welded joints. Other key factors influencing fatigue behavior include weld profile, method, filler material selection (or lack thereof), and post-weld treatments [22–25].
Experimental programs have recently examined hybrid tubular joints and dissimilar material welds used in offshore wind turbines and marine structures [26]. In one study, an explosively clad Al/Ti/Fe transition joint composed of four layers (AA5083, AA1050, Titanium Grade 1, and Steel Grade D) was tested under stochastic sea state simulations based on the Pierson-Moskowitz spectrum [27] and frequency-domain fatigue life predictions aligned closely with empirical findings.
Several methods can be applied for fatigue life prediction of welded joints, which were thoroughly reviewed in recent years by several authors [28–30]. For what concerns numerical methodologies for welded joints fatigue assessment, they are often categorised into global and local approaches, which include: the nominal stress approach [31,32]; the structural stress [33] and strain approaches [34–36]; the notch stress intensity factor (N-SIF) approach [37,38], the notch strain approach [39,40], the peak stress methods [41–43]; the fracture mechanics approaches [44,45], the Equivalent Strain Energy Density (ESED) approach, the averaged strain energy density (SED) approach [46,47], the critical distance methods (CDMs) [48,49]. Some of them were improved when a multiaxial stress state occurs [44,50–53]. Numerical approaches are also useful to investigate failure phenomena both on a macroscopic [54] and microscopic level [55].
Among the above-mentioned approaches, the nominal stress method [31,32] assumes full elasticity and applies S–N (stress-life) curves with uniform slopes for various joint geometries. Despite its broad adoption in international codes (e.g., Eurocode, IIW, DNV-GL), this method overlooks micro-geometric features and localized stress concentration near weld toes [56]. Conversely, the structural stress (hot-spot) approach defines stresses near geometric discontinuities either through extrapolation or the Stress Concentration Factor (SCF) [28]. While more accurate, it is mesh-sensitive and heavily reliant on precise finite element models [35,57]. The notch stress approach [28,58] captures the non-linear stress rise at weld toes and requires fine meshing (1/4–1/6 of the notch radius) or the introduction of fictitious radii to maintain modeling efficiency [32,37,38]. These techniques are especially relevant for welded joints with a thickness ≤5 mm and failure localizing at toes or roots [32].
Steel and aluminum welds are typically assigned fatigue classes (FAT) for fatigue design, on which hot-spot stress and notch stress approaches are generally based. Titanium lacks such classification, presenting a challenge for high-fidelity fatigue predictions [31,32]. As a result, previous work [59] is considered to evaluate the steel FAT classes for titanium weldments, modifying the stress values to account for differences in elastic modulus. This workaround is useful for initial design, though more empirical studies are required to validate it.
More recently, structural strain methods have been introduced to bridge the limitations of both nominal and structural stress approaches. Pioneered by Dong [57,60] and later expanded by Pei et al. [61,62], this method provides mesh-insensitive fatigue prediction by analyzing strain energy distributions across the weld zone. The structural strain concept also incorporates material plasticity and nonlinear hardening, which makes it suitable for both High-Cycle Fatigue (HCF) and Low-Cycle Fatigue (LCF) conditions.
The main goal of the present research activities is to achieve the most suitable FE approach for predicting the fatigue life of Ti6Al4V T-welded joints by means of a laser power source, in the absence of filler materials. This is due to the fact that only experimental values of the maximum load vs. the number of cycles to failure are given in [59]. A key goal in fatigue assessment of titanium weldments is to define suitable methodologies, such as the Finite Element (FE) approach, for predicting fatigue life. This objective stems from the limited availability of experimental data, which, while valuable, are insufficient for reliably predicting fatigue behavior in welded titanium structures with complex geometries. Indeed, Experimental fatigue tests on titanium welds with complex geometries are challenging due to the difficulty of instrumenting and capturing local stress/strain states accurately at critical locations (e.g., weld toes, roots), as well as the high cost and limited availability of titanium material and specimens for extensive testing. By applying hot-spot and notch stress methodologies within refined 2D/3D FE frameworks, this research extends fatigue modeling to titanium joints under conditions where conventional methods may falter. Existing studies have primarily focused on the mechanical performance of Ti-6Al-4V welded joints using various joining techniques, however, few have addressed the integration of FE analysis for fatigue prediction in the absence of filler material, which is increasingly relevant due to the advancement of laser-based welding techniques in offshore applications.
A potential avenue for future research could involve integrating available experimental data on titanium welds from existing studies, particularly in terms of nominal stress. This would entail reevaluating the data in the context of hot-spot or local stress, incorporating regression analysis and confidence bands. However, such investigations would require many dedicated studies, beginning with a focus on more conventional welds. Moreover, while FAT class have been well established for steel and aluminum joints, titanium welds still lack standardized FAT curves, making fatigue evaluation more challenging. Giving the absence of FAT curves for titanium, fatigue evaluations rely on conservative assumptions or data from other materials, which may not reflect the true fatigue behavior of titanium welds. This can lead to over or under design and impact reliability, safety, and cost-effectiveness in critical applications. To bridge this gap, the present work proposes a preliminary solution by adapting existing FAT classes for steel welded joints, normalized via the elasticity modulus of titanium to transition from stress-based to strain-based criteria. Hence, provided that the S-N curve slope is approximately 3, which is typical in the high-cycle fatigue regime, the proposed method lays the foundation for applying a unified strain-based fatigue assessment across different materials. The study promotes the use of strain-transformed steel-based FAT curves for preliminary assessment of titanium welded joints and to evaluate their predictive capacity against experimental fatigue data.
The investigated Ti-6Al-4V alloy belongs to the α + β type, and its chemical composition is detailed in [59]. Notably, the composition reveals the presence of aluminum, which acts as an alpha stabilizer, and vanadium, which functions as a beta stabilizer. The material properties of Ti6Al4V are: Young’s modulus (110 GPa), Poisson’s ratio (0.3), yield strength (827 MPa), tensile strength (1100 MPa).
The T-joints were fabricated from titanium sheets, with thicknesses of 3 and 5 mm. These joints were welded using a YB: YAG laser source with a maximum power output of 10 kW and in the absence of filler material. The nominal geometry of the T-welded specimens is given in Fig. 1.

Figure 1: Geometry of the investigated T-welded specimens
The welding process involves two passes, ensuring that the fusion zones in the cross-section intersect in the direction of the beam’s advancement, thereby maintaining material continuity, as depicted in Fig. 2. To assemble these joints, it is essential to incline the laser beam at an appropriate angle α, as illustrated in Fig. 2. It is important to note that, due to the laser welding process without filler material, the precise weld bead geometry varied slightly from specimen to specimen.
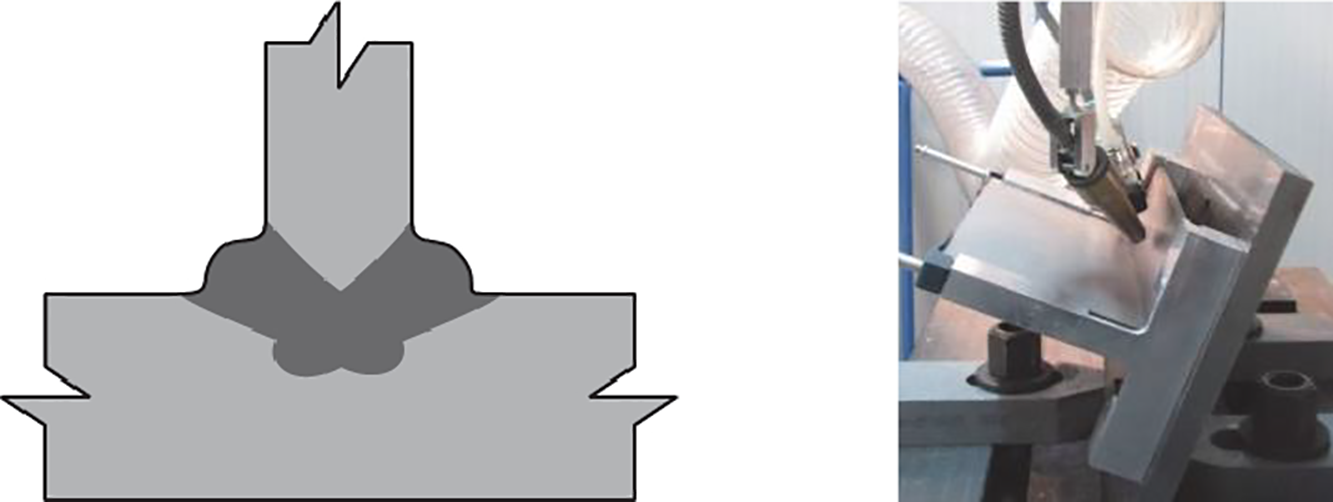
Figure 2: Scheme and tilt angle of the welding process [59]
Drawing from prior experience with butt welds on titanium sheets and from an experimental campaign focusing on T-welded joints, the ideal set of process parameters has been identified, using a Power of 6 kW, a speed of 80 mm/s, and an entry angle alpha of 20 degrees [59].
To ensure that the stress is applied specifically to the weld bead, a dedicated loading system was designed and constructed, as shown in Fig. 3.

Figure 3: (a) Gripping system of the testing machine [59]; (b) loaded specimen scheme; (c) Infrared images of the specimen during a fatigue test [59]
During each test, one side of the specimens was utilized for monitoring temperature changes in the vicinity of the welded area through Infrared Thermography. Conversely, the opposite side was used for tracking displacements and relative strains using the optical method of Digital Image Correlation.
To facilitate accurate temperature monitoring, one side of the specimens was painted black to ensure a high surface emissivity (ε = 0.92). Throughout the test, a series of images was captured at a frequency of 0.2 Hz to trace the temperature changes during the cyclic application of loads. All images were captured using a thermal camera (FLIR, A40) with a resolution of 320 × 256 pixels. The results were analyzed with the assistance of commercial software (Flir ThermaCAM™ Researcher).
The fatigue tests were conducted with a load ratio (R), set at 0.1 (calculated as Pmin/Pmax), taking into account the run-out point at 107 cycles and employing a frequency of the test equal to 5 Hz.
2.1 Preliminary Experimental Data
The results clearly indicated a fatigue strength between 8 and 9 kN, corresponding to a nominal stress range of approximately 80 MPa. Table 1 reports the obtained results in [59] and Fig. 4 shows the Pmax/N curve.
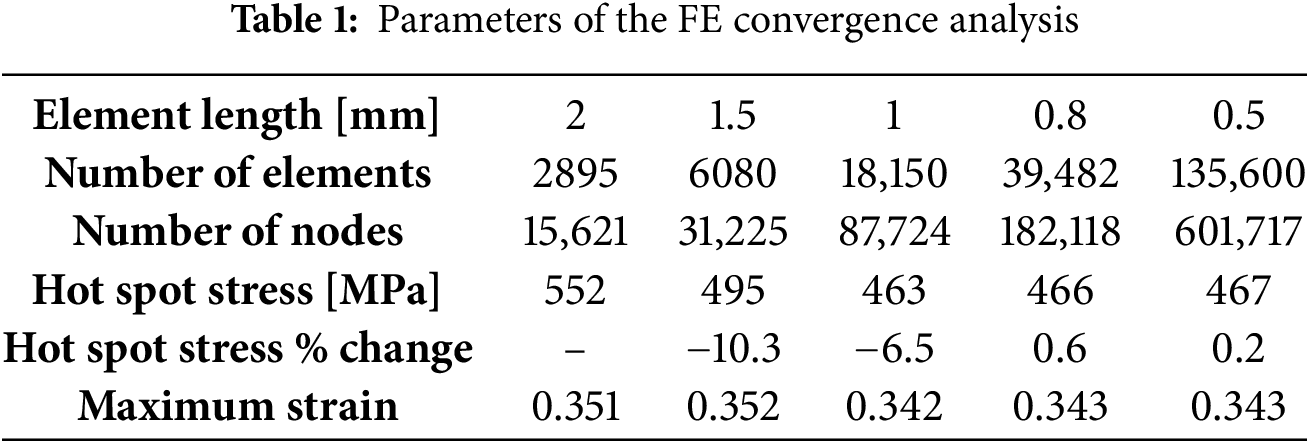

Figure 4: Pmax/N curve results in [59]
The infrared thermography highlighted only slight temperature increases as a consequence of the stress in the monitored area, but no significant temperature variations that would affect fatigue life occurred during fatigue testing.
2.2 Numerical Model Definition
The software used for the FE model and its analyses is Ansys Mechanical APDL. Although the use of a 2D FE model could have been sufficient for this type of analysis, as proposed by the IIW [58], the use of a 3D FE model would become essential when analyzing complex geometries and does not subtract any information with respect to the 2D model. For this reason, a comparison between two FE analysis types was performed: a FE analysis of a 2D model as using eight-node elements named “PLANE183” as suggested by the IIW [58], and a 3D solid FE model using 20-node parametric solid elements, known as SOLID186, which offer six degrees of freedom.
The finite element analyses presented in this study were conducted assuming linear elastic material behavior, characterized by Hooke’s law (σ = Eε); where σ represents the stress tensor, ε is the strain tensor, and E the elastic stiffness tensor defined by the isotropic mechanical properties of the Ti6Al4V alloy. Specifically, the Young’s modulus and Poisson’s ratio were set according to standard values for Ti6Al4V, respectively equal to 110 GPa and 0.3. Due to the use of a linear-elastic material model, there was no need to assign different Young’s modulus values to the various regions, such as the heat-affected zone (HAZ) or the welded zone (WZ), compared to the base material (BM). However, despite the linear elasticity assumption for the material model, geometric nonlinearities were explicitly considered in the FE analyses. This was achieved by activating the nonlinear geometry option (large deformation effects) available within ANSYS Mechanical APDL software. This approach allows capturing large displacement and deformation effects under cyclic loading, particularly where deformations could influence stress redistributions. This approach provides more realistic deformation patterns, especially for high stress levels, without introducing material nonlinearity. The numerical analysis used 20-node SOLID186 elements for the 3D models, while the 2D models used 8-node PLANE183 elements.
Mesh convergence studies were conducted to determine optimal element sizes, ensuring accuracy in calculating hot-spot stresses and an appropriate mesh size was chosen for the notch stresses according to IIW [32], ensuring at least six elements along the notch radius, while boundary conditions and loading scenarios closely replicated the experimental setups.
When the welded joint model includes the weld, as in this case, the extrapolation points are measured from the toe of the weld. The four calculation methods are divided into coarser mesh (the most approximative) and finer meshes (less approximative) as shown in Fig. 5. Since a convergence analysis was carried out in the present study, only the fine mesh methods should be used. In addition, due to the load and geometry of the analysed specimen, the formula concerning “Hot-spot type a” are more appropriate to be considered. The welded joint under investigation follows the “type A” classification, as confirmed by experimental tests. The stress analysis process will focus on this type.

Figure 5: Linear extrapolation of the hot-spot stress as a function of the mesh size. Hot-spot type a: Relatively fine mesh (a), Relatively coarse mesh (b). Hot-spot type b: Relatively fine mesh (c), Relatively coarse mesh (d) [58]
In most practical cases, the principal stress is perpendicular to the weld, and from this, the hot spot stress can be determined. Specifically, the maximum principal stress is considered, as long as the difference in the direction of the nominal stress and the weld bead does not exceed 60°. If this condition is not met, the normal component is considered instead. For the specific case, the second option will be directly used.
The stresses are calculated at the nodes of the elements, as illustrated in Fig. 5, and extrapolated linearly using Eq. (1):
Given the symmetry of the boundary and loading conditions of the specimen, only half of the specimen was modelled in the 2D FE analysis, as shown in Fig. 6a. The 3D FE analysis was modelled reflecting as much as possible the boundary and loading conditions of the experimental tests, displayed in Fig. 6b.

Figure 6: Boundary and loading conditions of the Finite Element Analyses (FEA): (a) 2D FE model; (b) 3D FE model
All the displacements were blocked in the lower plate for the elements no closer than 10 mm to the weld toe. A vertical load is applied to the upper plate as shown in Figs. 3b and 6.
According to the FE model described above, Preliminary FE analyses were carried out to determine the appropriate mesh size in order to carry out a convergence test.
The results are recorded in Table 1, which lists stress values based on mesh sizes and percentage change in hot-spot stress between successive mesh refinements. This is done to later illustrate, through graphs, the significance of a proper discretization of the model. In all tests, a tensile load of 40 kN was applied. After confirming the use of a fine mesh that adheres to the guidelines [31,32], the evaluation of stress at the extrapolation points is conducted.
It is evident that a fine mesh with 0.5 mm elements yields more accurate results compared to the others. However, the hot spot stress does not vary significantly between the model discretized with 1 mm elements and the one with 0.50 mm elements, as observed in the comparison shown in Fig. 7. The figure demonstrates the variation of hot spot stress extrapolated as a function of the number of elements or, in other words, as a function of mesh size. There is a percentage error of 0.84% between the value calculated with 0.5 mm elements and that calculated with 1 mm elements.

Figure 7: Hot-spot stress as a function of element dimension
A comparison between the experimental Digital Image Correlation (DIC) x-strains and the FE x-strain was made, as shown Fig. 8, using the same scale (as the results with symmetry applied closely match those of the full model, as illustrated in Fig. 6b, the latter is adopted to minimize computational effort).
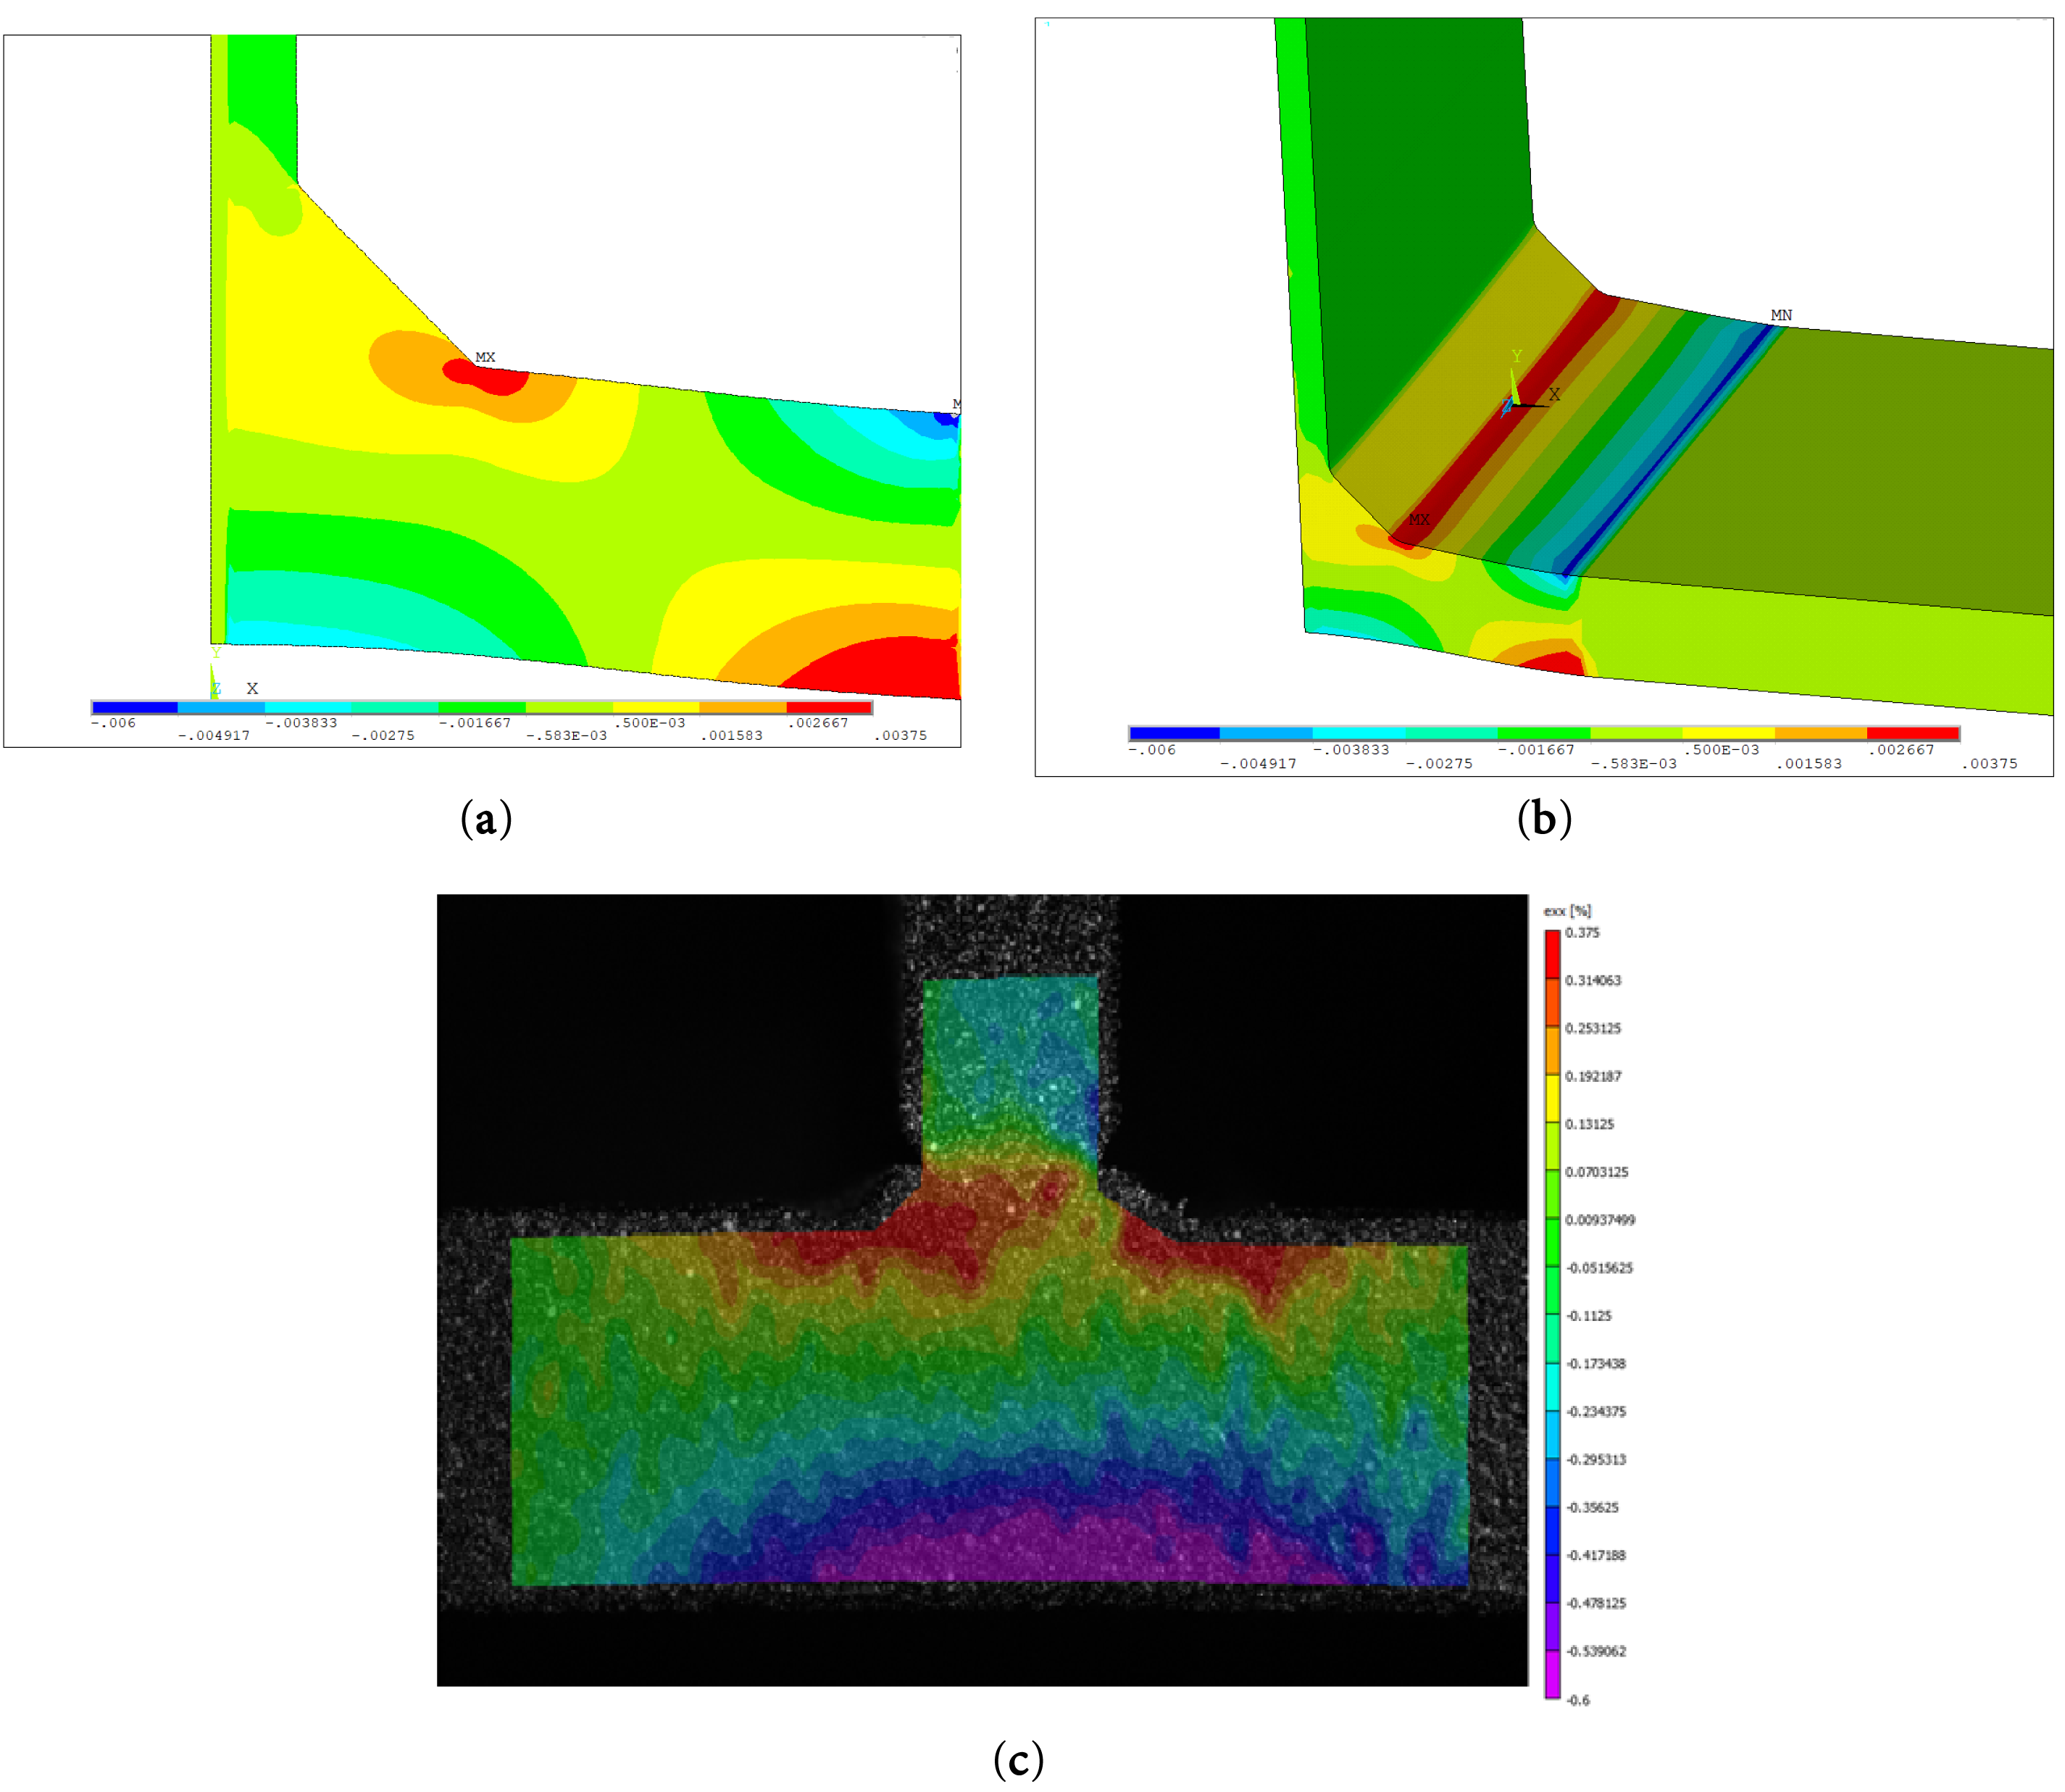
Figure 8: (a) 2D FE x-strain; (b) 3D FE x-strain; (c) experimental DIC x-strains [59]. Comparison using the same scale. Size of elements 0.1 mm
Fig. 8 shows that the 2D and 3D FE model gives very similar results. Both FEA give reasonable results with respect to the DIC analysis, far from high stress concentration areas, but major differences were detected in these zones where a linear-elastic FE model cannot detect realistic stress-strain values. This means that, as expected, linear elastic stresses can be assumed far from discontinuity areas, i.e., far from the notch tip and weld root. However, since the hot-spot stress approach, according to the IIW standards, requires linear elastic calculations at certain distances from the weld toe (and it is not suitable for weld root failure,) the FE models resulted in sufficiently validated. The comparison reported in Fig. 8 also shows a perfect symmetry of the welded areas in terms of strains calculated by FEA, as expected, while an asymmetry is experimentally detected. This is explained by the residual stresses and the repeated heating during the weld passes during the welding process.
In addition, thanks to the above-mentioned linear fitting, it was possible to plot the stress distribution as a function of the distance from the weld toe. The hot spot stress range Δσhs, defined by the Eq. (2), has almost identical values if calculated by a linear fitting as shown in Fig. 9. This figure reports the linear and nonlinear stress effects due to the local weld toe. The joint undergoes fatigue cycles with loads that oscillate around a positive mean value, where σmin always assumes positive values. Fig. 9 will pertain to the maximum load of 40 kN and the minimum load of 4 kN. The hot-spot stresses values (
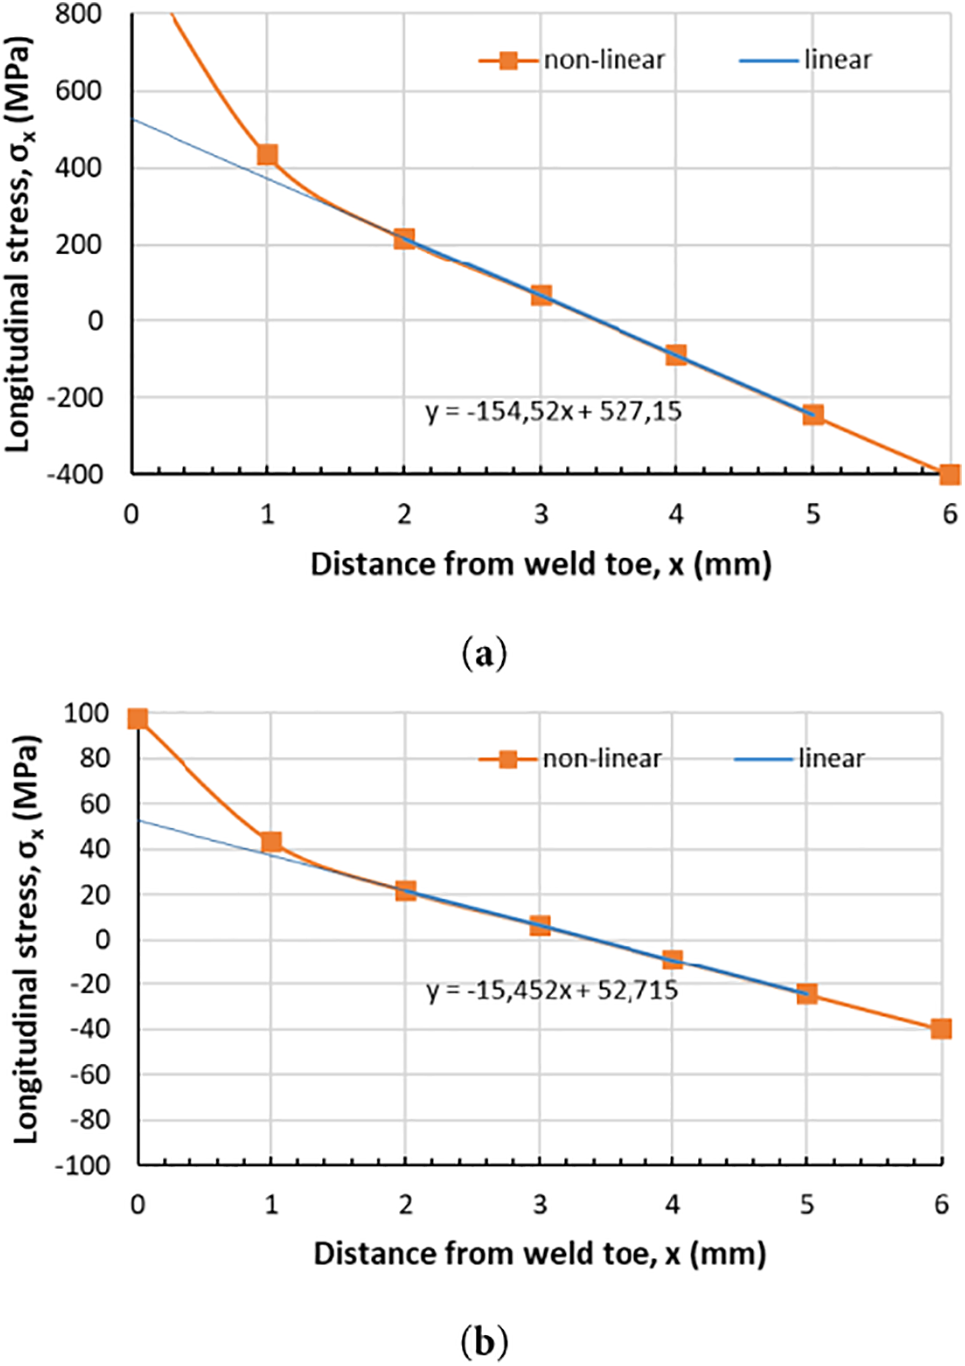
Figure 9: Hot-spot stresses of the test performed at Pmax 40 kN; maximum load (a) and minimum load (b)
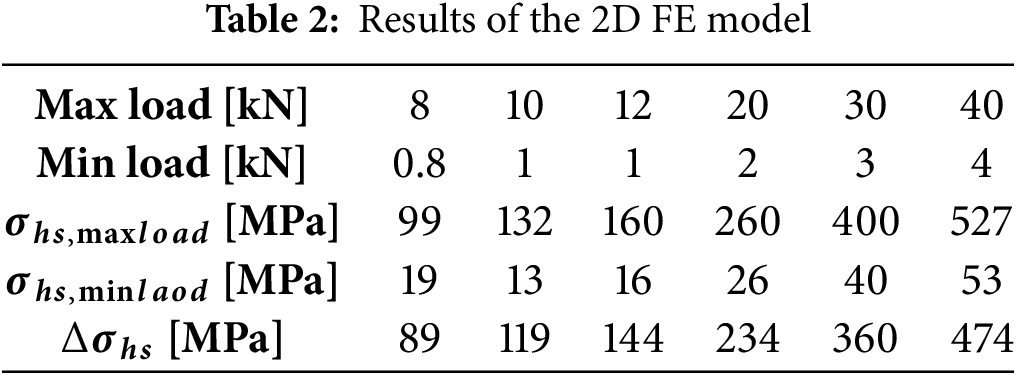
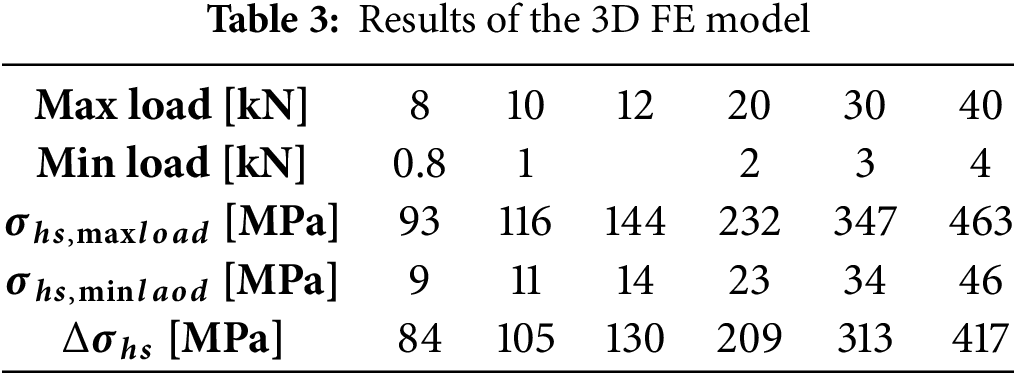
As expected, the stress at the weld bead has a higher value than that calculated hot spot stress. Once the hot-spot stresses are calculated, the corresponding number of cycles to failure is considered from [59].
The comparison between the experimental maximum loads—number of cycles to failure curve and the one obtained from FEA is shown in Fig. 10. The red dots describe the hot-spot stress ranges, while the black dots describe the applied maximum loads. The hot spot stress related to the fatigue limit is slightly lower than 100 MPa for this type of T-welded joints. In addition, the results in terms of hot-spot stresses showed the same slope of the load-number of cycles curve. Additional comparisons with other literature data were not possible since, to the best of authors’ knowledge, no published data is currently available regarding titanium welded joints assessed using the hot-spot stress approach.

Figure 10: Experimental maximum load—number of cycles to failure curve [59] and hot-spot stress results correlation
3.3 Comparison of Hot Spot Method and Normalized FAT Curves
The typical equation of the S/N curve on a double logarithmic scale, according to Basquin, can be articulated through Eq. (3).
A and m are the coefficients of the curve (m is about 2.9 and A′ is about 26). Since the same slope of the S-N curve is proved, the IIW would require comparing the obtained data to a FAT curve (generally FAT 70 for this kind of geometry and loading if the joints were made of steel).
However, FAT curves for steel are based on stress range (Δσ) and are inherently specific to the behavior of steel under cyclic loading, which depends on steel’s high Young’s modulus and its characteristic fatigue properties. Thus, these curves cannot be directly applied to titanium alloys such as Ti-6-4 due to their markedly lower Young’s modulus different mechanical responses to loading, such as greater strain under similar stress levels. To adapt the existing FAT curves for steel for application to materials like Ti-6Al-4V a thoughtful approach is necessary, given the significant differences in the elastic and mechanical properties of steel and titanium alloys.
To make a meaningful comparison or adaptation, the FAT curves for steel can be normalized by their elastic properties. The normalization procedure converts stress-based FAT curves for steel into strain-based FAT curves by dividing the stress range by the material’s Young’s modulus, i.e., Δε = Δσ/E. This enables comparison across materials by accounting for their elastic stiffness differences. The method applies to other materials, provided that the slope of the S-N curve remains comparable, as the normalization assumes similar fatigue damage mechanisms govern fatigue life in the high-cycle region, i.e., that in the high-cycle fatigue regime, fatigue life is primarily governed by elastic strain rather than absolute stress. In addition, such conversion enables a representation in terms of hot spot strain rather than stress. Hot spot strain accounts for localized strain concentrations at critical points, providing a consistent metric to compare fatigue performance across materials with varying stiffness. The converted FAT curves are shown in Fig. 11.

Figure 11: Strain-based normalized FAT curves for fatigue assessment
Each curve of Fig. 11 corresponds to different FAT classes (FAT 50, FAT 100, FAT 150, FAT 200, and FAT 250), representing different fatigue thresholds. The strain-based framework bridges the mechanical property differences, offering a consistent metric (hot spot strain) to evaluate fatigue behavior under equivalent conditions, thus facilitating the adaptation of steel-based FAT curves for other materials.
Once normalized, the steel FAT curves can be plotted alongside strain-based fatigue data for Ti-6-4, such as the data previously shown in Fig. 4. Fig. 12 shows the comparison in terms of hot spot strain values against the number of cycles to failure and FAT curves normalized in terms of strain which serves as a reference for fatigue performance. The data includes two distinct analyses of hot spot strain: one using a 2D and a 3D approach. It can clearly be seen that the points are slightly lower than the FAT 100 curve, thus a FAT 90 or FAT 80 could be used.

Figure 12: Fatigue life comparison between 2D and 3D Hot Spot methods and normalized steel FAT curves [58]
The data points closely align for most of the fatigue life range, indicating a level of consistency between the 2D and 3D strain calculations. The FAT curve that provides a conservative guideline would be the FAT 80. This comparison is especially significant when dealing with materials like titanium alloys, where elastic properties differ significantly from steel, as the strain-based approach normalizes such discrepancies, enabling a more universal assessment of fatigue performance.
4.1 Model Description and Results
Modern software instruments significantly enhance structural analysis and finite element modeling. In addition, automated submodeling can streamline local modeling and combine the effective notch stress approach with hierarchical strategies like global shell and local continuum-based modeling [63,64]. Using the structural stress approach to identify critical regions globally, followed by detailed local analysis with the effective notch stress approach, could improve the accuracy of fatigue behavior predictions. Many commercial fatigue codes have incorporated this approach, often with their modifications. As reported in [64], FAT 225 should be used for steel welded joints when using reference radii of 1 mm, while FAT 300 for 0.3 mm and FAT 500 for 0.05 mm respectively for applications using maximum principal stress ranges. Assessment of effective notch stresses using FAT 225 (rref = 1 mm) bring in a minimum stress concentration KW,min equal to 1.6 [63]. Since no information is available for titanium, the need to perform relative analyses is evident.
The joint was modelled according to the IIW standards which requires 5 number of elements, when using 8 nodes elements, and 3 number of elements when using higher-order elements [32] in 3D analyses. Symmetry properties were used to minimize the number of elements.
Following as mentioned in previous chapters, 2D and 3D analyses were performed and relative differences were analyzed.
The mesh is shown in Fig. 13, elements having 8 nodes were used for the 2D FE analyses, while 20 nodes elements were employed for the 3D FEA; at least 6 elements were modelled in the notch radius. The IIW recommendation for fatigue design of welded joints and components presents an approach based on the maximum principal stress to be used as notch stress parameter, while the use of the von Mises stress was proposed in [65] as an alternative. The comparison was made but similar values were obtained in the present research activity, thus only the first principal stress results are discussed.

Figure 13: (a) 2D and (b) 3D FE mesh around the weld toe for the notch stress analysis
Fig. 14a,b shows the comparison between 2D and 3D results in terms of first principal stress, underlining no significant differences.
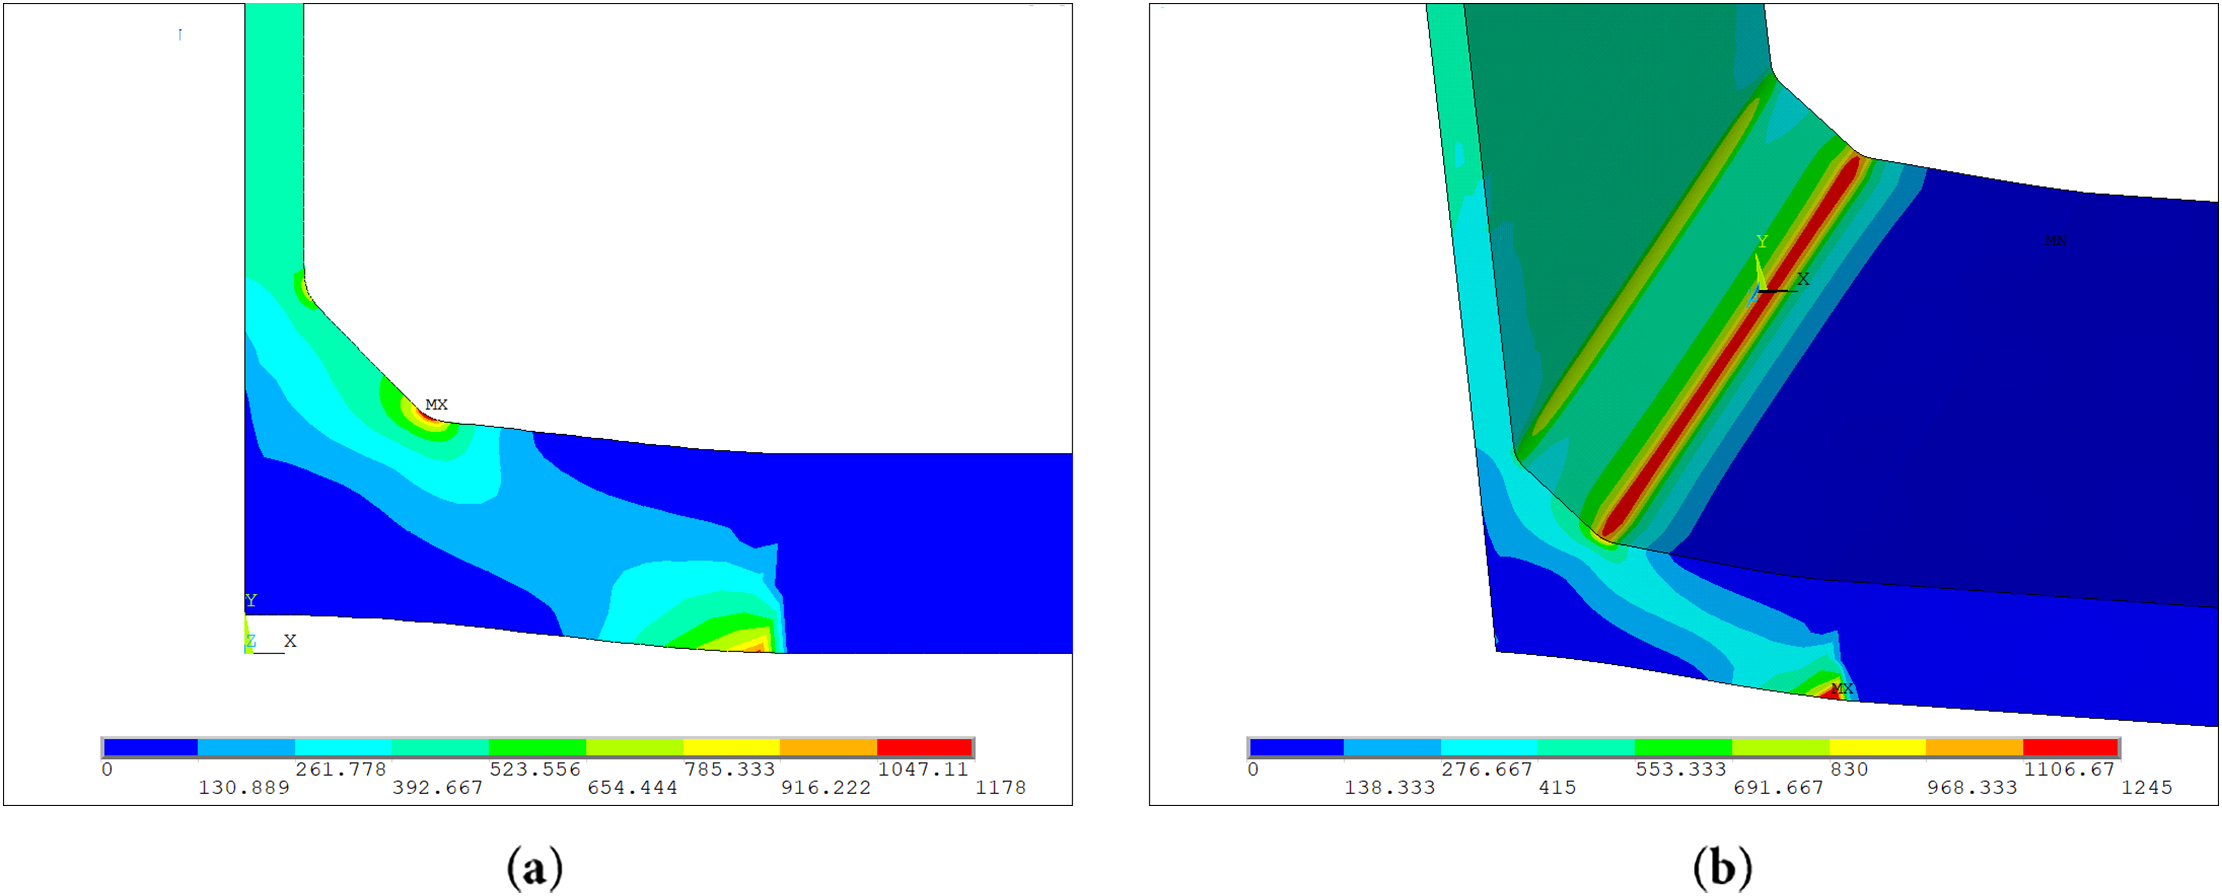
Figure 14: (a) 2D and (b) 3D FE comparison in terms of first principal stress with a notch radius of 1 mm (40 kN)
Fig. 15 reports the von Mises stress results and no significant differences are detected also in this case.

Figure 15: (a) 2D and (b) 3D FE comparison in terms of von Mises stress results (40 kN)
Table 4 reports the numerical results, and the percentage error that is made using a 2D FE model compared to a 3D FE model. The difference is generally less than 5.5%, thus it can be concluded that a 2D model can be reliably used for notch stress considerations in simple geometries.
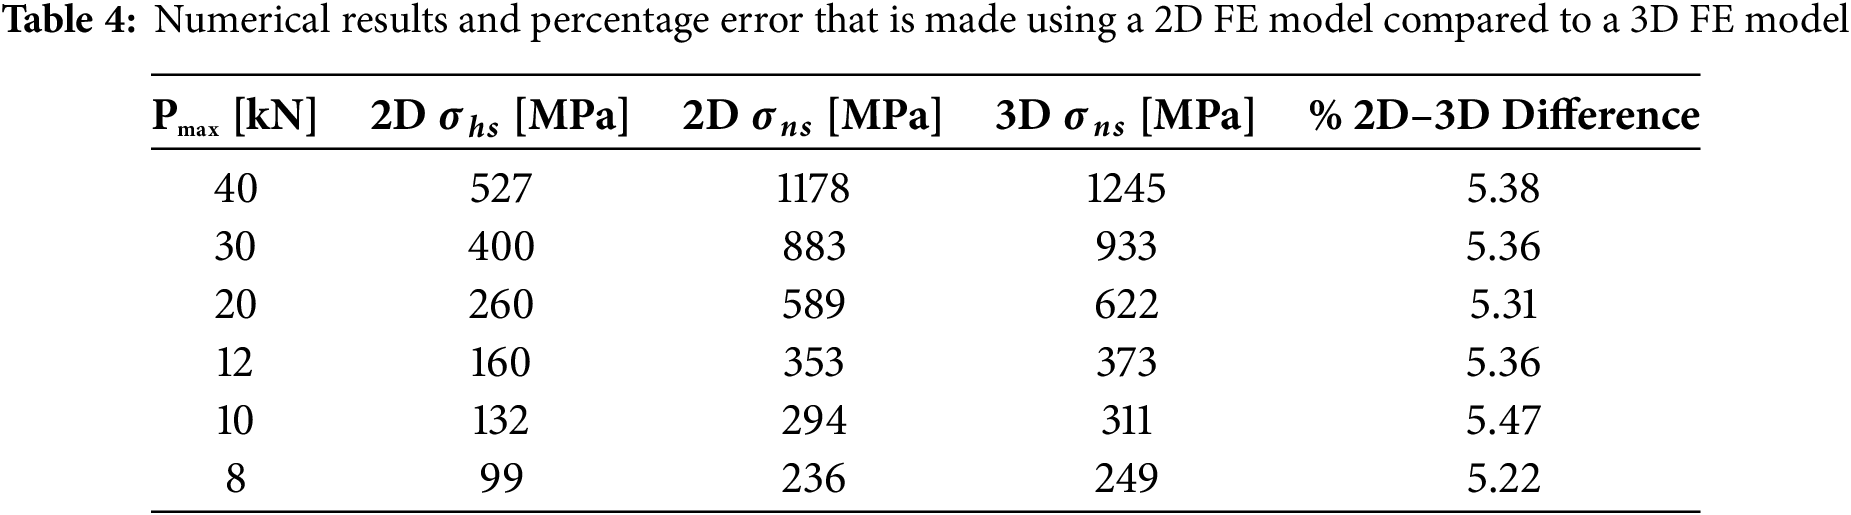
The difference is almost not perceivable in Fig. 16 which reports the calculated notch-stress values vs. the number of cycles curve. However, if complex geometries are analyzed a 3D model would be indispensable.

Figure 16: 2D and 3D calculated notch-stress values vs. the number of cycles curve
Considering the typical equation of the S/N curve, according to Basquin, assuming a standard value of m = 3 (the calculated value is 2.9) as proposed by the IIW [58], it is possible to compare the results.
4.2 Comparison of Notch-Stress Approach and Normalized FAT Curves
Fig. 17 presents the notch stress results in terms of strain as a function of the number of cycles to failure, compared to the normalized reference curves. The data points include both 2D analysis results (represented by diamonds) and 3D analysis results (squares) that are almost superimposed. The figure presents a comparison of fatigue results derived from 2D and 3D notch stress analysis methods against multiple normalized FAT curves (FAT 50, FAT 100, FAT 150, FAT 200, and FAT 250). The strain range (Δε%) is plotted on a logarithmic scale against the number of cycles to failure, also on a logarithmic scale.
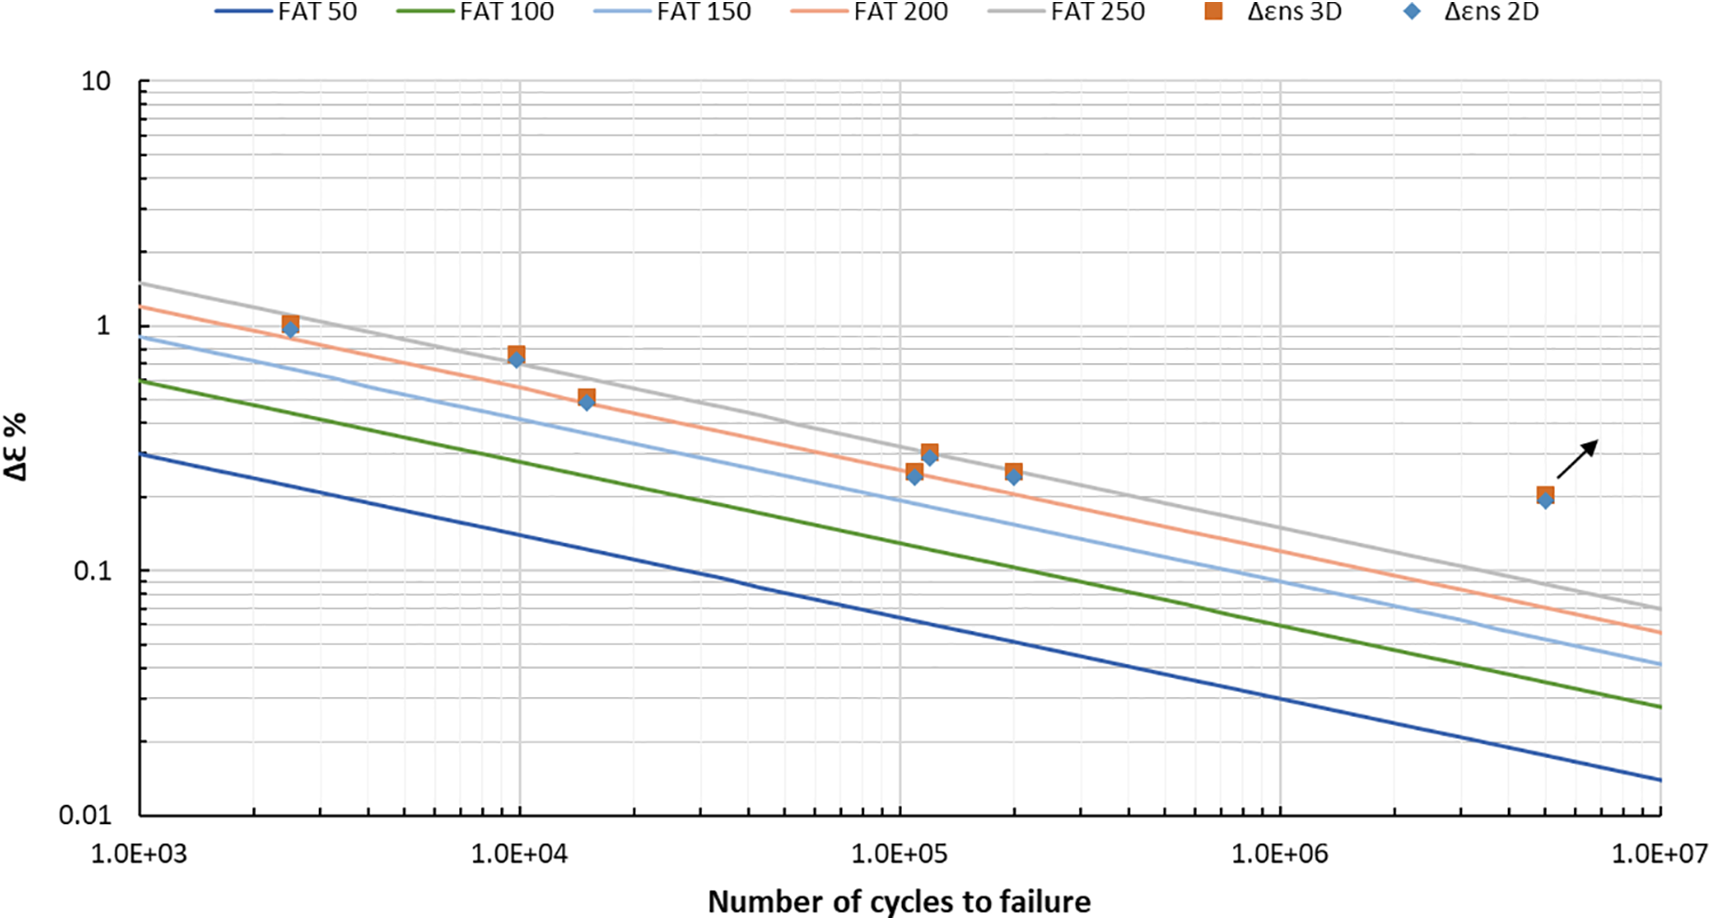
Figure 17: Notch stress results in terms of strain as a function of the number of cycles to failure compared to the normalized FAT reference curves
The figure highlights how the calculated notch strain values align slightly lower than FAT 250 curve across a range of fatigue lives, thus the FAT 225 curve could be taken as the best reference curve. Most results closely follow the FAT 225 reference line, demonstrating consistency with the expected fatigue behavior. The arrow in the high-cycle fatigue region indicates a runout test.
At the end the value of the stress concentration, according to [63], can be evaluated as follows, in Eq. (4), and confirms the reliability of the adopted FE model:
Fatigue behaviour of Ti-6Al-4V laser-welded joints was examined through two complementary finite-element (FE) routes: hot-spot stress and notch-stress analysis; each carried out in both two and three dimensions.
Hot-spot strain procedure
• Two- and three-dimensional FE meshes were generated, with element size progressively refined in the weld-toe region to resolve steep stress gradients.
• A linear-elastic material model was adopted, while geometric non-linearity was activated to capture the large displacements that arise under cyclic loading.
• Boundary and loading conditions reproduced the experimental set-up.
• Surface stresses were sampled at 0.4 t and 1 t from the weld toe, following IIW guidance.
• A straight-line extrapolation through these two points yielded the hot-spot stress.
• The resulting stress ranges were converted into strain ranges and checked against the strain-normalised FAT curves.
Notch-strain procedure
• High-resolution local FE models—again in both 2D and 3D—were built with a 1 mm fictitious notch radius at the weld toe.
• The same linear-elastic material law and geometric non-linearity settings were retained.
• Laboratory boundary conditions and loads were applied.
• The peak principal stress at the notch root was extracted.
• Peak stresses were converted to strain and evaluated against the normalised FAT curves.
The notch-stress method, with its fine local mesh, reports higher local stresses and therefore shorter predicted lives—advantageous when the weld toe is the critical feature. The cost is heavier computation, especially for large structures.
The hot-spot route, by contrast, is lighter and less sensitive to mesh density, offering a reliable global picture while inevitably smoothing some local peaks. For the simple T-joint studied here, differences between 2D and 3D results were small; however, 3D modelling remains essential when joint geometry or loading becomes more complex.
Expressing results in terms of strain rather than stress allows direct comparison with other structural metals. Provided the S-N slope is close to 3, a typical value in high-cycle fatigue, the strain-based FAT curves offer a first step toward a unified, material-agnostic fatigue framework. The present models do not include residual stresses, microstructural variations or weld-bead imperfections.
The study investigated the fatigue characteristics of titanium welded joints produced by laser welding without filler material. While experimental S-N curves based on maximum load and cycles to failure were established, finite element (FE) analysis was essential for evaluating complex geometries and weld-induced inhomogeneities. Two fatigue assessment approaches were applied: hot-spot stress and notch stress. Results indicated that the hot-spot stress method produced S-N curves with the same slope for load vs. the number of cycles, with a fatigue limit for hot-spot stress slightly below 100 MPa for the investigated T-welded joint. Such an approach proved to be easily applicable and suitable for global assessments but may not capture very local effects. The notch stress approach, on the other hand, predicted higher stress concentrations at the notch, yielding more accurate results but requiring significantly finer mesh refinement, leading to high computational costs and memory requirements, which can be challenging for real-world applications involving large-scale structures. In similar cases, submodelling techniques are recommended if large structures are investigated. Each method’s applicability depends on the level of detail required: hot-spot stress is suitable for fatigue design in the presence of welds but it does not capture the weld geometry details, while notch stress is better for assessing critical local features. Due to the absence of titanium-specific FAT classes, the study introduced a strain-normalized adaptation of steel-based FAT data, using Young’s modulus scaling to enable comparison in terms of strain. The normalized strain-based FAT curves offer a reliable framework for engineers during the design phase, providing a means to compare FE analyses of titanium welded joints with strain-based FAT curves. The proposed normalization approach provides a preliminary solution for unifying fatigue assessment across different materials (e.g., steel, aluminum, titanium) in terms of strain rather than stress. This enables meaningful comparisons and evaluations as long as the slope of the S-N curve is around 3, which is typical in the high-cycle fatigue regime for many structural metals. By converting stress-based data into a strain-based format, this method helps bridge differences due to elastic modulus variations and supports the development of universal fatigue design approaches. At the same time, this work highlights the urgent need to establish titanium-specific FAT classes through additional FE analyses on other types of titanium welded joints or dedicated experimental studies.
Future developments to both experimental and numerical investigations on fatigue life of laser-welded Ti6Al4V joints could focus on the presence and the potential influence of residual stress, which can alter local stress distributions and affect crack initiation and propagation. Hence, residual stress measurements (e.g., using X-ray diffraction or hole-drilling methods) and their integration in numerical analysis could be considered to enhance the accuracy of fatigue assessments for titanium welded joints. Moreover, more extended experimental campaigns on different weld geometries, different welding techniques, as well as refinement of strain-based FAT classes specific to titanium alloys could provide more extended and detailed knowledge on the topic.
In conclusion nominal, hot-spot, and notch stress methods each offer valuable insights into the fatigue behavior of titanium weldments. However, they are constrained by the absence of titanium-specific FAT data. Indeed, titanium dedicated FAT classes, to account for their specific fatigue behavior, which can be influenced by factors beyond elastic properties, such as microstructure, weld quality, and residual stress patterns would be essential to support consistent and reliable design in marine, aerospace, and other demanding applications where titanium alloys are increasingly used. This work represents a foundational step toward standardized fatigue evaluation for titanium welded joints, marking the first attempt, to the authors’ knowledge, to address a critical gap in current fatigue design practices.
Acknowledgement: The author is thankful to Prof. Pingsha Dong from the University of Michigan for the precious advices on how to treat data and the newly proposed FAT curves.
Funding Statement: This study has been supported by the project PRIN_2022PNRR_P2022Y3PBY_001 “MADLEINE, CUP: J53D23015830001. Project funded under the National Recovery and Resilience Plan (NRRP), Mission 4 Component C2 Investment 1.1 by the European Union—NextGenerationEU.
Author Contributions: The authors confirm contribution to the paper as follows: Conceptualization, Pasqualino Corigliano; methodology Pasqualino Corigliano; software, Pasqualino Corigliano; validation, Pasqualino Corigliano, Giulia Palomba; formal analysis, Pasqualino Corigliano; investigation, Pasqualino Corigliano; resources, Pasqualino Corigliano, Giulia Palomba; data curation, Pasqualino Corigliano; writing—original draft preparation, Pasqualino Corigliano; writing—review and editing, Pasqualino Corigliano, Giulia Palomba; visualization, Pasqualino Corigliano, Giulia Palomba; supervision, Pasqualino Corigliano; project administration, Pasqualino Corigliano; funding acquisition, Pasqualino Corigliano. All authors reviewed the results and approved the final version of the manuscript.
Availability of Data and Materials: The data that support the findings of this study are available from the Corresponding Author, Pasqualino Corigliano, upon reasonable request.
Ethics Approval: Not applicable.
Conflicts of Interest: The authors declare no conflicts of interest to report regarding the present study.
References
1. Liu R, Liu Y, Zhang D. Multiscale characterization of erosion of TA2 titanium alloy welded joints. Front Mater. 2022;9:910319. doi:10.3389/fmats.2022.910319. [Google Scholar] [CrossRef]
2. Kowalski M, Böhm M, Rozumek D, Kurek A, Correia J. Fatigue strength of new explosively welded steel-aluminum transition joint used in ships. Ocean Eng. 2023;288:115990. doi:10.1016/j.oceaneng.2023.115990. [Google Scholar] [CrossRef]
3. Hirdaris SE, Bai W, Dessi D, Ergin A, Gu X, Hermundstad OA, et al. Loads for use in the design of ships and offshore structures. Ocean Eng. 2014;78:131–74. doi:10.1016/j.oceaneng.2013.09.012. [Google Scholar] [CrossRef]
4. Ryan H, Mehmanparast A. Development of a new approach for corrosion-fatigue analysis of offshore steel structures. Mech Mater. 2023;176:104526. doi:10.1016/j.mechmat.2022.104526. [Google Scholar] [CrossRef]
5. Mei X, Xiong M. Effects of second-order hydrodynamics on the dynamic responses and fatigue damage of a 15 MW floating offshore wind turbine. J Mar Sci Eng. 2021;9(11):1232. doi:10.3390/jmse9111232. [Google Scholar] [CrossRef]
6. Syed Ahmad SZA, Abu Husain MK, Mohd Zaki NI, Mukhlas NA, Mat Soom E, Azman NU, et al. Offshore structural reliability assessment by probabilistic procedures—a review. J Mar Sci Eng. 2021;9(9):998. doi:10.3390/jmse9090998. [Google Scholar] [CrossRef]
7. Jimenez-Martinez M. Fatigue of offshore structures: a review of statistical fatigue damage assessment for stochastic loadings. Int J Fatigue. 2020;132:105327. doi:10.1016/j.ijfatigue.2019.105327. [Google Scholar] [CrossRef]
8. de C Pinheiro B, Pasqualino IP. Fatigue analysis of damaged steel pipelines under cyclic internal pressure. Int J Fatigue. 2009;31(5):962–73. doi:10.1016/j.ijfatigue.2008.09.006. [Google Scholar] [CrossRef]
9. Adedipe O, Brennan F, Kolios A. Review of corrosion fatigue in offshore structures: present status and challenges in the offshore wind sector. Renew Sustain Energy Rev. 2016;61:141–54. doi:10.1016/j.rser.2016.02.017. [Google Scholar] [CrossRef]
10. Dong Y, Garbatov Y, Guedes Soares C. Review on uncertainties in fatigue loads and fatigue life of ships and offshore structures. Ocean Eng. 2022;264:112514. doi:10.1016/j.oceaneng.2022.112514. [Google Scholar] [CrossRef]
11. Dong Y, Garbatov Y, Soares CG. Recent developments in fatigue assessment of ships and offshore structures. J Mar Sci Appl. 2022;21:3–25. doi:10.1007/s11804-022-00301-x. [Google Scholar] [CrossRef]
12. Corigliano P, Frisone F, Chianese C, Altosole M, Piscopo V, Scamardella A. Fatigue overview of ship structures under induced wave loads. J Mar Sci Eng. 2024;12(9):1608. doi:10.3390/jmse12091608. [Google Scholar] [CrossRef]
13. Schutz RW. Effective utilization of titanium alloys in offshore systems. In: The Offshore Technology Conference; 1992 May 4–7; Houston, TX, USA. doi:10.4043/6909-ms. [Google Scholar] [CrossRef]
14. Salama MM. Fatigue crack growth behavior of titanium alloy Ti-6Al-4V and weldment. J Offshore Mech Arct Eng. 2001;123(3):141–6. doi:10.1115/1.1371233. [Google Scholar] [CrossRef]
15. Rombado G, Baker DA, Haldorsen LM, Craidy P, Feiger JH, Hudak SJJr. Corrosion-fatigue crack growth performance of titanium grade 29 welds in tapered stress joints. In: Proceedings of the Pipelines, Risers, and Subsea Systems; 2019 Jun 9–14; Glasgow, Scotland, UK. doi:10.1115/omae2019-95175. [Google Scholar] [CrossRef]
16. Balasubramanian TS, Balakrishnan M, Balasubramanian V, Muthu Manickam MA. Influence of welding processes on microstructure, tensile and impact properties of Ti-6Al-4V alloy joints. Trans Nonferrous Met Soc China. 2011;21(6):1253–62. doi:10.1016/s1003-6326(11)60850-9. [Google Scholar] [CrossRef]
17. Zhao S, Yu G, He X, Hu Y. Microstructural and mechanical characteristics of laser welding of Ti6Al4V and lead metal. J Mater Process Technol. 2012;212(7):1520–7. doi:10.1016/j.jmatprotec.2012.02.014. [Google Scholar] [CrossRef]
18. Mironov S, Sato YS, Kokawa H. Friction-stir welding and processing of Ti-6Al-4V titanium alloy: a review. J Mater Sci Technol. 2018;34:58–72. doi:10.1016/j.jmst.2017.10.018. [Google Scholar] [CrossRef]
19. Guo Y, Teng Y, Liu G, Jiao T. Numerical study on creep-fatigue damage of titanium alloy pressure shell considering the effect of welding residual stresses. Thin Walled Struct. 2025;209:112953. doi:10.1016/j.tws.2025.112953. [Google Scholar] [CrossRef]
20. Jiang J, Wang L, Shi Z, Li L. Residual stress in thick titanium-alloy butt-welded plates and effect of hydrogen on fatigue crack propagation. Appl Ocean Res. 2025;158:104543. doi:10.1016/j.apor.2025.104543. [Google Scholar] [CrossRef]
21. Long J, Zhang LJ, Xie MX, Liu YQ. Dealloying significantly improves the fatigue property of laser-welded joints of TC4 titanium alloy. Eng Fail Anal. 2025;171:109390. doi:10.1016/j.engfailanal.2025.109390. [Google Scholar] [CrossRef]
22. Corigliano P, Crupi V, Epasto G, Guglielmino E, Risitano G. Fatigue assessment by thermal analysis during tensile tests on steel. Procedia Eng. 2015;109:210–8. doi:10.1016/j.proeng.2015.06.215. [Google Scholar] [CrossRef]
23. Corigliano P, Cucinotta F, Guglielmino E, Risitano G, Santonocito D. Thermographic analysis during tensile tests and fatigue assessment of S355 steel. Procedia Struct Integr. 2019;18:280–86. doi:10.1016/j.prostr.2019.08.165. [Google Scholar] [CrossRef]
24. Corigliano P. On the compression instability during static and low-cycle fatigue loadings of AA 5083 welded joints: full-field and numerical analyses. J Mar Sci Eng. 2022;10(2):212. doi:10.3390/jmse10020212. [Google Scholar] [CrossRef]
25. Gao XL, Liu J, Zhang LJ. Dissimilar metal welding of Ti6Al4V and Inconel 718 through pulsed laser welding-induced eutectic reaction technology. Int J Adv Manuf Technol. 2018;96(1):1061–71. doi:10.1007/s00170-018-1633-6. [Google Scholar] [CrossRef]
26. Albiez M, Damm J, Ummenhofer T, Ehard H, Schuler C, Kaufmann M, et al. Hybrid joining of jacket structures for offshore wind turbines-Validation under static and dynamic loading at medium and large scale. Eng Struct. 2022;252:113595. doi:10.1016/j.engstruct.2021.113595. [Google Scholar] [CrossRef]
27. Böhm M, Kowalski M. Fatigue life estimation of explosive cladded transition joints with the use of the spectral method for the case of a random sea state. Mar Struct. 2020;71:102739. doi:10.1016/j.marstruc.2020.102739. [Google Scholar] [CrossRef]
28. Fricke W. Recent developments and future challenges in fatigue strength assessment of welded joints. Proc Inst Mech Eng Part C J Mech Eng Sci. 2015;229(7):1224–39. doi:10.1177/0954406214550015. [Google Scholar] [CrossRef]
29. Baumgartner J. Review and considerations on the fatigue assessment of welded joints using reference radii. Int J Fatigue. 2017;101:459–68. doi:10.1016/j.ijfatigue.2017.01.013. [Google Scholar] [CrossRef]
30. Braun M, Ehlers S. Review of methods for the high-cycle fatigue strength assessment of steel structures subjected to sub-zero temperature. Mar Struct. 2022;82:103153. doi:10.1016/j.marstruc.2021.103153. [Google Scholar] [CrossRef]
31. Hobbacher A. Fatigue design of welded joints and components. Oxford, UK: Woodhead Publishing Limited; 1996. doi:10.1533/9780857093189. [Google Scholar] [CrossRef]
32. Hobbacher A. Recommendations for fatigue design of welded joints and components. Berlin/Heidelberg, Germany: Springer; 2024. [Google Scholar]
33. Radaj D, Sonsino C, Fricke W. Recent developments in local concepts of fatigue assessment of welded joints. Int J Fatigue. 2009;31(1):2–11. doi:10.1016/j.ijfatigue.2008.05.019. [Google Scholar] [CrossRef]
34. Dong P, Pei X, Xing S, Kim MH. A structural strain method for low-cycle fatigue evaluation of welded components. Int J Press Vessels Pip. 2014;119:39–51. doi:10.1016/j.ijpvp.2014.03.003. [Google Scholar] [CrossRef]
35. Pei X, Dong P. An analytically formulated structural strain method for fatigue evaluation of welded components incorporating nonlinear hardening effects. Fatigue Fract Eng Mater Struct. 2019;42(1):239–55. doi:10.1111/ffe.12900. [Google Scholar] [CrossRef]
36. Han Q, Wang P, Lu Y. Path-dependent multiaxial fatigue prediction of welded joints using structural strain method. Fatigue Fract Eng Mater Struct. 2021;44(10):2800–26. doi:10.1111/ffe.13550. [Google Scholar] [CrossRef]
37. Lazzarin P, Tovo R. A Notch intensity factor approach to the stress analysis of welds. Fatigue Fract Eng Mater Struct. 1998;21(9):1089–103. doi:10.1046/j.1460-2695.1998.00097.x. [Google Scholar] [CrossRef]
38. Atzori B, Lazzarin P, Meneghetti G, Ricotta M. Fatigue design of complex welded structures. Int J Fatigue. 2009;31(1):59–69. doi:10.1016/j.ijfatigue.2008.02.013. [Google Scholar] [CrossRef]
39. Saiprasertkit K. Fatigue strength assessment of load-carrying cruciform joints in low- and high-cycle fatigue region based on effective Notch strain concept. Weld World. 2014;58(4):455–67. doi:10.1007/s40194-014-0129-8. [Google Scholar] [CrossRef]
40. Saiprasertkit K, Hanji T, Miki C. Local strain estimation method for low- and high-cycle fatigue strength evaluation. Int J Fatigue. 2012;40:1–6. doi:10.1016/j.ijfatigue.2012.01.021. [Google Scholar] [CrossRef]
41. Meneghetti G. The peak stress method applied to fatigue strength assessments of load carrying transverse fillet welds with toe or root failures. SDHM. 2012;8:111–30. doi:10.3970/sdhm.2012.008.111. [Google Scholar] [CrossRef]
42. Meneghetti G, Lazzarin P. Significance of the elastic peak stress evaluated by FE analyses at the point of singularity of sharp V-notched components. Fatigue Fract Eng Mater Struct. 2007;30(2):95–106. doi:10.1111/j.1460-2695.2006.01084.x. [Google Scholar] [CrossRef]
43. Meneghetti G, Guzzella C. The peak stress method to estimate the mode I Notch stress intensity factor in welded joints using three-dimensional finite element models. Eng Fract Mech. 2014;115:154–71. doi:10.1016/j.engfracmech.2013.11.002. [Google Scholar] [CrossRef]
44. Chapetti MD, Jaureguizahar LF. Fatigue behavior prediction of welded joints by using an integrated fracture mechanics approach. Int J Fatigue. 2012;43:43–53. doi:10.1016/j.ijfatigue.2012.02.004. [Google Scholar] [CrossRef]
45. Zerbst U, Madia M. Fracture mechanics based assessment of the fatigue strength: approach for the determination of the initial crack size. Fatigue Fract Eng Mater Struct. 2015;38(9):1066–75. doi:10.1111/ffe.12288. [Google Scholar] [CrossRef]
46. Lazzarin P, Zambardi R. A finite-volume-energy based approach to predict the static and fatigue behavior of components with sharp V-shaped notches. Int J Fract. 2001;112(3):275–98. doi:10.1023/A:1013595930617. [Google Scholar] [CrossRef]
47. Livieri P, Lazzarin P. Fatigue strength of steel and aluminium welded joints based on generalised stress intensity factors and local strain energy values. Int J Fract. 2005;133(3):247–76. doi:10.1007/s10704-005-4043-3. [Google Scholar] [CrossRef]
48. Taylor D. Some new methods for predicting fatigue in welded joints. Int J Fatigue. 2002;24(5):509–18. doi:10.1016/s0142-1123(01)00174-8. [Google Scholar] [CrossRef]
49. Taylor D. The theory of critical distances: a new perspective in fracture mechanics. Amsterdam, The Netherlands: Elsevier; 2007. [Google Scholar]
50. Al Zamzami I, Davison B, Susmel L. Nominal and local stress quantities to design aluminium-to-steel thin welded joints against fatigue. Int J Fatigue. 2019;123:279–95. doi:10.1016/j.ijfatigue.2019.02.018. [Google Scholar] [CrossRef]
51. Sonsino C. Fatigue assessment of welded joints in AlMg 4.5Mn aluminium alloy (AA 5083) by local approaches. Int J Fatigue. 1999;21(9):985–99. doi:10.1016/s0142-1123(99)00049-3. [Google Scholar] [CrossRef]
52. Susmel L. Multiaxial notch fatigue. Aircr Eng Aerosp Technol. 2009;81(4). doi:10.1108/aeat.2009.12781dae.001. [Google Scholar] [CrossRef]
53. Al Zamzami I, Susmel L. On the use of hot-spot stresses, effective notch stresses and the point method to estimate lifetime of inclined welds subjected to uniaxial fatigue loading. Int J Fatigue. 2018;117:432–49. doi:10.1016/j.ijfatigue.2018.08.032. [Google Scholar] [CrossRef]
54. Zhang Y, Liao C, Wang T, Xu C, Peng J, Lu Y, et al. Fatigue fracture mechanism and life prediction of TA1 titanium alloy clinched joints. Fatigue Fract Eng Mater Struct. 2025;48(1):132–44. doi:10.1111/ffe.14464. [Google Scholar] [CrossRef]
55. Xilong Z, Jianxun Z, Hongyuan C, Xu S. Fracture behavior of heat affected zone of laser-welded joint for Ti-6Al-4V titanium alloy: experimental and computational study. Comput Model Eng Sci. 2013;92:557–71. [Google Scholar]
56. van Lieshout PS, den Besten JH, Kaminski ML. Comparative study of multiaxial fatigue methods applied to welded joints in marine structures. Frat Ed Integrità Strutturale. 2016;10(37):173–92. doi:10.3221/igf-esis.37.24. [Google Scholar] [CrossRef]
57. Dong P. A structural stress definition and numerical implementation for fatigue analysis of welded joints. Int J Fatigue. 2001;23(10):865–76. doi:10.1016/s0142-1123(01)00055-x. [Google Scholar] [CrossRef]
58. Hobbacher A. The new IIW recommendations for fatigue assessment of welded joints and components—a comprehensive code recently updated. Int J Fatigue. 2009;31(1):50–8. doi:10.1016/j.ijfatigue.2008.04.002. [Google Scholar] [CrossRef]
59. Corigliano P, Crupi V, Guglielmino E, Maletta C, Sgambitterra E, Barbieri G, et al. Fatigue assessment of Ti-6Al-4V titanium alloy laser welded joints in absence of filler material by means of full-field techniques. Frat Ed Integrità Strutturale. 2018;12(43):171–81. doi:10.3221/igf-esis.43.13. [Google Scholar] [CrossRef]
60. Wang P, Pei X, Dong P, Song S. Traction structural stress analysis of fatigue behaviors of rib-to-deck joints in orthotropic bridge deck. Int J Fatigue. 2019;125:11–22. doi:10.1016/j.ijfatigue.2019.03.038. [Google Scholar] [CrossRef]
61. Pei X, Dong P, Kim MH. A simplified structural strain method for low-cycle fatigue evaluation of girth-welded pipe components. Int J Fatigue. 2020;139:105732. doi:10.1016/j.ijfatigue.2020.105732. [Google Scholar] [CrossRef]
62. Pei X, Dong P, Xing S. A structural strain parameter for a unified treatment of fatigue behaviors of welded components. Int J Fatigue. 2019;124:444–60. doi:10.1016/j.ijfatigue.2019.03.010. [Google Scholar] [CrossRef]
63. Rother K, Fricke W. Effective Notch stress approach for welds having low stress concentration. Int J Press Vessels Pip. 2016;147:12–20. doi:10.1016/j.ijpvp.2016.09.008. [Google Scholar] [CrossRef]
64. Rother K, Rudolph J. Fatigue assessment of welded structures: practical aspects for stress analysis and fatigue assessment. Fatigue Fract Eng Mater Struct. 2011;34(3):177–204. doi:10.1111/j.1460-2695.2010.01506.x. [Google Scholar] [CrossRef]
65. Fass M, Hecht M, Baumgartner J, Bauer N. Evaluation of the approach based on the maximum principal stress from the IIW-Recommendation for welded joints under proportional, multiaxial stress states. Weld World. 2023;67(10):2323–32. doi:10.1007/s40194-023-01571-x. [Google Scholar] [CrossRef]
Cite This Article
 Copyright © 2025 The Author(s). Published by Tech Science Press.
This work is licensed under a Creative Commons Attribution 4.0 International License , which permits unrestricted use, distribution, and reproduction in any medium, provided the original work is properly cited.
 Downloads
 Citation Tools