
 Submit a Paper
 Propose a Special lssue
 Open Access
ARTICLE
An Improved Animated Oat Optimization Algorithm with Particle Swarm Optimization for Dry Eye Disease Classification
1 Faculty of Computers and Information, Minia University, Minia, 61519, Egypt
2 Department of Information Technology, College of Computer and Information Sciences, Princess Nourah bint Abdulrahman University, Riyadh, 11671, Saudi Arabia
* Corresponding Author: Essam H. Houssein. Email:
(This article belongs to the Special Issue: Advanced Computational Intelligence Techniques, Uncertain Knowledge Processing and Multi-Attribute Group Decision-Making Methods Applied in Modeling of Medical Diagnosis and Prognosis)
Computer Modeling in Engineering & Sciences 2025, 144(2), 2445-2480. https://doi.org/10.32604/cmes.2025.069184
Received 17 June 2025; Accepted 13 August 2025; Issue published 31 August 2025
 View Full Text
 Download PDF
Abstract
The diagnosis of Dry Eye Disease (DED), however, usually depends on clinical information and complex, high-dimensional datasets. To improve the performance of classification models, this paper proposes a Computer Aided Design (CAD) system that presents a new method for DED classification called (IAOO-PSO), which is a powerful Feature Selection technique (FS) that integrates with Opposition-Based Learning (OBL) and Particle Swarm Optimization (PSO). We improve the speed of convergence with the PSO algorithm and the exploration with the IAOO algorithm. The IAOO is demonstrated to possess superior global optimization capabilities, as validated on the IEEE Congress on Evolutionary Computation 2022 (CEC’22) benchmark suite and compared with seven Metaheuristic (MH) algorithms. Additionally, an IAOO-PSO model based on Support Vector Machines (SVMs) classifier is proposed for FS and classification, where the IAOO-PSO is used to identify the most relevant features. This model was applied to the DED dataset comprising 20,000 cases and 26 features, achieving a high classification accuracy of 99.8%, which significantly outperforms other optimization algorithms. The experimental results demonstrate the reliability, success, and efficiency of the IAOO-PSO technique for both FS and classification in the detection of DED.Keywords
A common disease known as Dry Eye Disease (DED) occurs when your tears are unable to adequately lubricate your eyes. Tears can be insufficient and erratic for various reasons [1]. DED has been shown to successfully prevent the transmission of the COVID-19 virus, which has been linked in clinics [2,3]. There are notable differences in the severity of DED [4]. Wearing masks has been shown to successfully prevent the transmission of the COVID-19 virus, which has been linked to an increase in symptoms of DED [5]. DED is a long-term condition that develops gradually over time. High-risk individuals with DED include those who use video terminals, wear makeup and contact lenses daily, use eye drops over time, stay up late, use their eyes for extended periods, and/or are older than 30 years. Irritation, dryness, burning, photophobia, eye weariness, increased secretions, redness, feeling like a foreign thing, and ocular pain are the early symptoms of DED [6]. In the latter stages of DED, corneal ulcers and even perforations may develop, ultimately resulting in blindness. Early detection and diagnosis of DED are clinically significant for eye care professionals to develop a thorough and precise treatment plan, which is significant for society and the economy to maintain people’s normal lives and stabilize the social economy and development.
To enable early detection, this demonstrates the necessity of a computer-aided diagnosis (CAD) system. By increasing diagnostic accuracy, these systems can facilitate earlier intervention and more successful treatment [7]. AI-driven technologies can greatly improve the capabilities of CAD systems, increasing the accuracy and accessibility of early detection of DED [8].
The diagnosis of DED often relies on complex and high-dimensional datasets that include clinical parameters and ocular biomarkers. Although big datasets provide useful information, noise and extraneous features introduced by their high dimensionality can impair ML models’ performance. To address these problems, FS is crucial for locating important biomarkers and simplifying data, which helps ML models classify patients with DED more precisely, improving clinical results and diagnostic precision.
The two main categories of FS techniques are the wrapper and filter approaches [9]. Regardless of the particular ML model, filter methods assess the significance of features. These techniques are computationally efficient, but could miss crucial feature interactions that are necessary for some learning tasks. Wrapper techniques, on the other hand, iteratively evaluate feature subsets, applying the performance of a particular ML algorithm to identify the optimal subset [10,11]. The high computational cost of these approaches is a major drawback, although they are excellent at identifying complicated feature connections. This is because they need to repeatedly train the model and evaluate it across various feature subsets to determine the best combination. Researchers are increasingly using Metaheuristic (MH) algorithms for more efficient FS because of the high processing costs of exhaustive search methods and the inefficiency of random search approaches. These algorithms are commonly used in wrapper-based approaches, where the selected ML classifier and the MH technique have a significant impact on classification performance [12].
Several MH algorithms have been adapted for FS and have received recognition for their promising results in numerous research studies. These include Evolutionary Algorithms (EAs) [13], Ant Colony Optimization (ACO) [14], Genetic Algorithm (GA) [15], and Artificial Bee Colony (ABC) [16]. Even while these algorithms show excellent search capabilities and frequently produce results that are close to optimal, their generalizability across different datasets is still restricted. Additionally, as the dimensionality of the data increases, FS’s accuracy tends to decrease. Therefore, there is still much room to improve these approaches to better handle these difficulties.
The Animated Oat Optimization Algorithm (AOO) [17] introduces a novel bio-inspired approach by emulating the natural behaviors of animated oats, thereby contributing significantly to the development of optimization techniques. AOO models three core biological behaviors: (i) Seed dispersal by natural forces like wind, water, and animals; (ii) hygroscopic motion, where the primary awn of the seed undergoes deformation and rotation, enabling self-propelled rolling and spatial distribution; and (iii) an energy-storage mechanism activated during rolling, which allows the seed to overcome obstacles and trigger further motion under specific conditions for enhanced dispersion.
Furthermore, Tizhoosh [18] has validated the notion of Opposition-Based Learning (OBL), which holds that the opposite number is closer to the ideal value than a random number and can improve search capabilities and speed up convergence. Numerous scholars used this mathematical technique extensively in various MH algorithms [19–21]. In their paper, Kang et al. [19] presented the OBL strategy as a solution to the issues of limited population diversity and early convergence in conventional PSO. As demonstrated by the experiment results, Zhang et al. [22] used the OBL to enhance the performance of the original gray wolf optimizer. Their suggested algorithm outperformed the original Grey Wolf Optimization (GWO) Algorithm and other MH algorithms in terms of search capability and convergence rate.
The following are this paper’s primary contributions:
• This paper presents the Improved Animated Oat Optimization (IAOO-PSO) algorithm, which integrates the Animated Oat Optimization (AOO) with the Particle Swarm Optimization (PSO) algorithm and the Oppositional-Based Learning (OBL) technique. Through increased exploration capabilities, these improvements overcome the drawbacks of current FS techniques, boosting feature subset selection and overall performance.
• We propose the IAOO-PSO-based eye disease classification model, a novel approach to classify DED. This model illustrates how well IAOO-PSO works for FS when combined with an SVM classifier.
• The IAOO-PSO algorithm outperforms seven other MH algorithms, including (PSO [23], weIghted meaN oF vectOrs (INFO) [24], Whale Optimization Algorithm (WOA) [25], Beluga Whale Optimization (BWO) [26], Sine Cosine Algorithm (SCA) [27], Moth-Flame Optimization (MFO) [28], and the original AOO algorithm) tested on the DED dataset and the CEC’22 test suite, according to extensive studies. The results demonstrate how well IAOO-PSO performs when handling limited optimization problems related to FS and classification.
• This study provides a comprehensive evaluation of the proposed model using multiple performance metrics, including Accuracy (ACC), sensitivity (SE), F1-score (F1), specificity (SP), and positive predictive value (PPV). The detailed analysis highlights the robustness and reliability of the IAOO-PSO algorithm in both FS and classification tasks.
• The DED classification model based on IAOO-PSO-SVM achieved a remarkable classification ACC of 99.8%. The remarkable results suggest that the suggested IAOO-PSO-SVM method has great potential for diagnosing DED, especially in terms of increasing classification accuracy through optimized FS.
The remainder of the paper is structured as follows: Recent studies on two major subjects are reviewed in Section 2: Section 2.1 discusses the creation of CAD systems for DED, while Section 2.2 discusses the use of MH algorithms for FS in eye disease datasets. The suggested approach and methods used are described in full in Section 3. First performance tests utilizing the CEC2022 benchmark functions are shown in Section 4. Moreover, the comprehensive experimental results of the classification model on the DED dataset are shown in Section 5. Section 7 concludes with a summary of the paper’s conclusions.
The growth in DED has led to the development of CAD systems that use ML and optimization techniques to increase the precision of diagnoses, especially through efficient FS and classification systems. After highlighting recent developments in CAD systems for DED classification, this part discusses the expanding use of MH algorithms in medical FS, emphasizing existing techniques and their drawbacks.
2.1 Applications of CAD Systems in DED Classification
In detecting and diagnosing DED, CAD systems are making significant strides. The enhancement of the precision, effectiveness, and applicability of these systems has been the main focus of recent research. The methods, constraints, and results of the most recent CAD systems created for DED classification are thoroughly reviewed in this section. Therefore, DED therapy depends heavily on early identification. Normal DED detection using tear break-up time, meibomian pictures, and other methods is labor-intensive, time-consuming, and inefficient. Artificial intelligence (AI) has been evolving, producing several notable advancements in the medical domain [29]. The critical value of this approach for detecting ocular eye diseases is rising [30]. The diagnosis and prediction of eye diseases, including high myopia [31], diabetic retinopathy [32], and cataracts [33], have made extensive use of it.
Yabusaki et al. [34] developed an ML model to diagnose DED that automatically defines 11 features for Interfering Fringe Color (IFC) images, such as brightness, color saturation, color ratio, and local complexity. This methodology demonstrated better inter-rater agreement (Kappa coefficient = 0.820) with eye-care practitioners and higher F1-scores (0.815, 0.095) when compared to a Bag of Visual Words (BVW) ML model. According to the researchers’ results, ML is a resource-efficient and successful method for detecting DED that reduces diagnostic biases. In a different study, Cartes et al. [35] used ML methods to classify DED patients based on their mean osmolarity records (20 with DED and 20 normal). Because the logistic classifier algorithm achieved an accuracy of 85%, the results indicate that tear osmolarity in DED can be effectively discriminated. According to the research, ML is a successful method for detecting DED utilizing variables related to tear osmolarity [35].
Yang et al. [36] studied using ML models to predict DED in patients who had undergone a vitrectomy. Using a dataset of 217 cases with features such as OSDI, TBUT, osmolarity, interocular difference, ocular surface staining corneal spot number, conjunctival spot number, length and width of lid margin, and demographic data, they used supervised ML models, specifically Logistic Regression (LR) and Artificial Neural Network (ANN). An Area Under the Curve (AUC) of 0.741 for LR and 0.786 for ANN is revealed by the Receiver Operating Characteristic (ROC) curve analysis. The study concludes that ML models are effective in detecting DED, with ANN outperforming LR in this regard [36]. Most of the research has been published in the last few years, particularly after 2014. Table 1 displays their relevant references, datasets used, objectives, algorithms used, and results.

2.2 Feature Selection Using a Metaheuristic in DED Datasets
The success of MH algorithms in addressing issues such as large dimensionality, complexity, and noise has led to their increased prominence in the literature for FS in medical datasets. This section examines the main contributions and uses of these algorithms, highlighting how they can enhance diagnostic precision and prediction performance.
An approach for detecting optic discs has been presented that combines the Ant Colony Optimization algorithm with anisotropic diffusion [50]. Another automated method for the detection of optic discs has been described using the firefly algorithm [51]. Various swarm intelligence-based methods have also been used to detect the optic disc [52]. Using their method, the authors have demonstrated that the firefly algorithm produces the best results. To efficiently detect optic discs, the gravitational law has also been applied [53], but there is still room for improvement in performance. The bat optimization approach [51] has also been used recently for optical disc detection, and the method has improved the disc segmentation results in a relatively short calculation time.
Nam et al. [54] proposed an Explainable Artificial Intelligence EAI-based ML prediction system for the detection of DED and the identification of risk and protective factors. Of the 4391 cases collected for the study, 80% were used for training from the KNHANES dataset. Several packages, such as rpart, psych, glmnet, survey, WeightedROC, ggplot2, weights, and qgraph, were used together with the R programming language (version 3.6.1). To minimize overfitting and improve robust performance, ML models were used for FS and prediction model simplification.
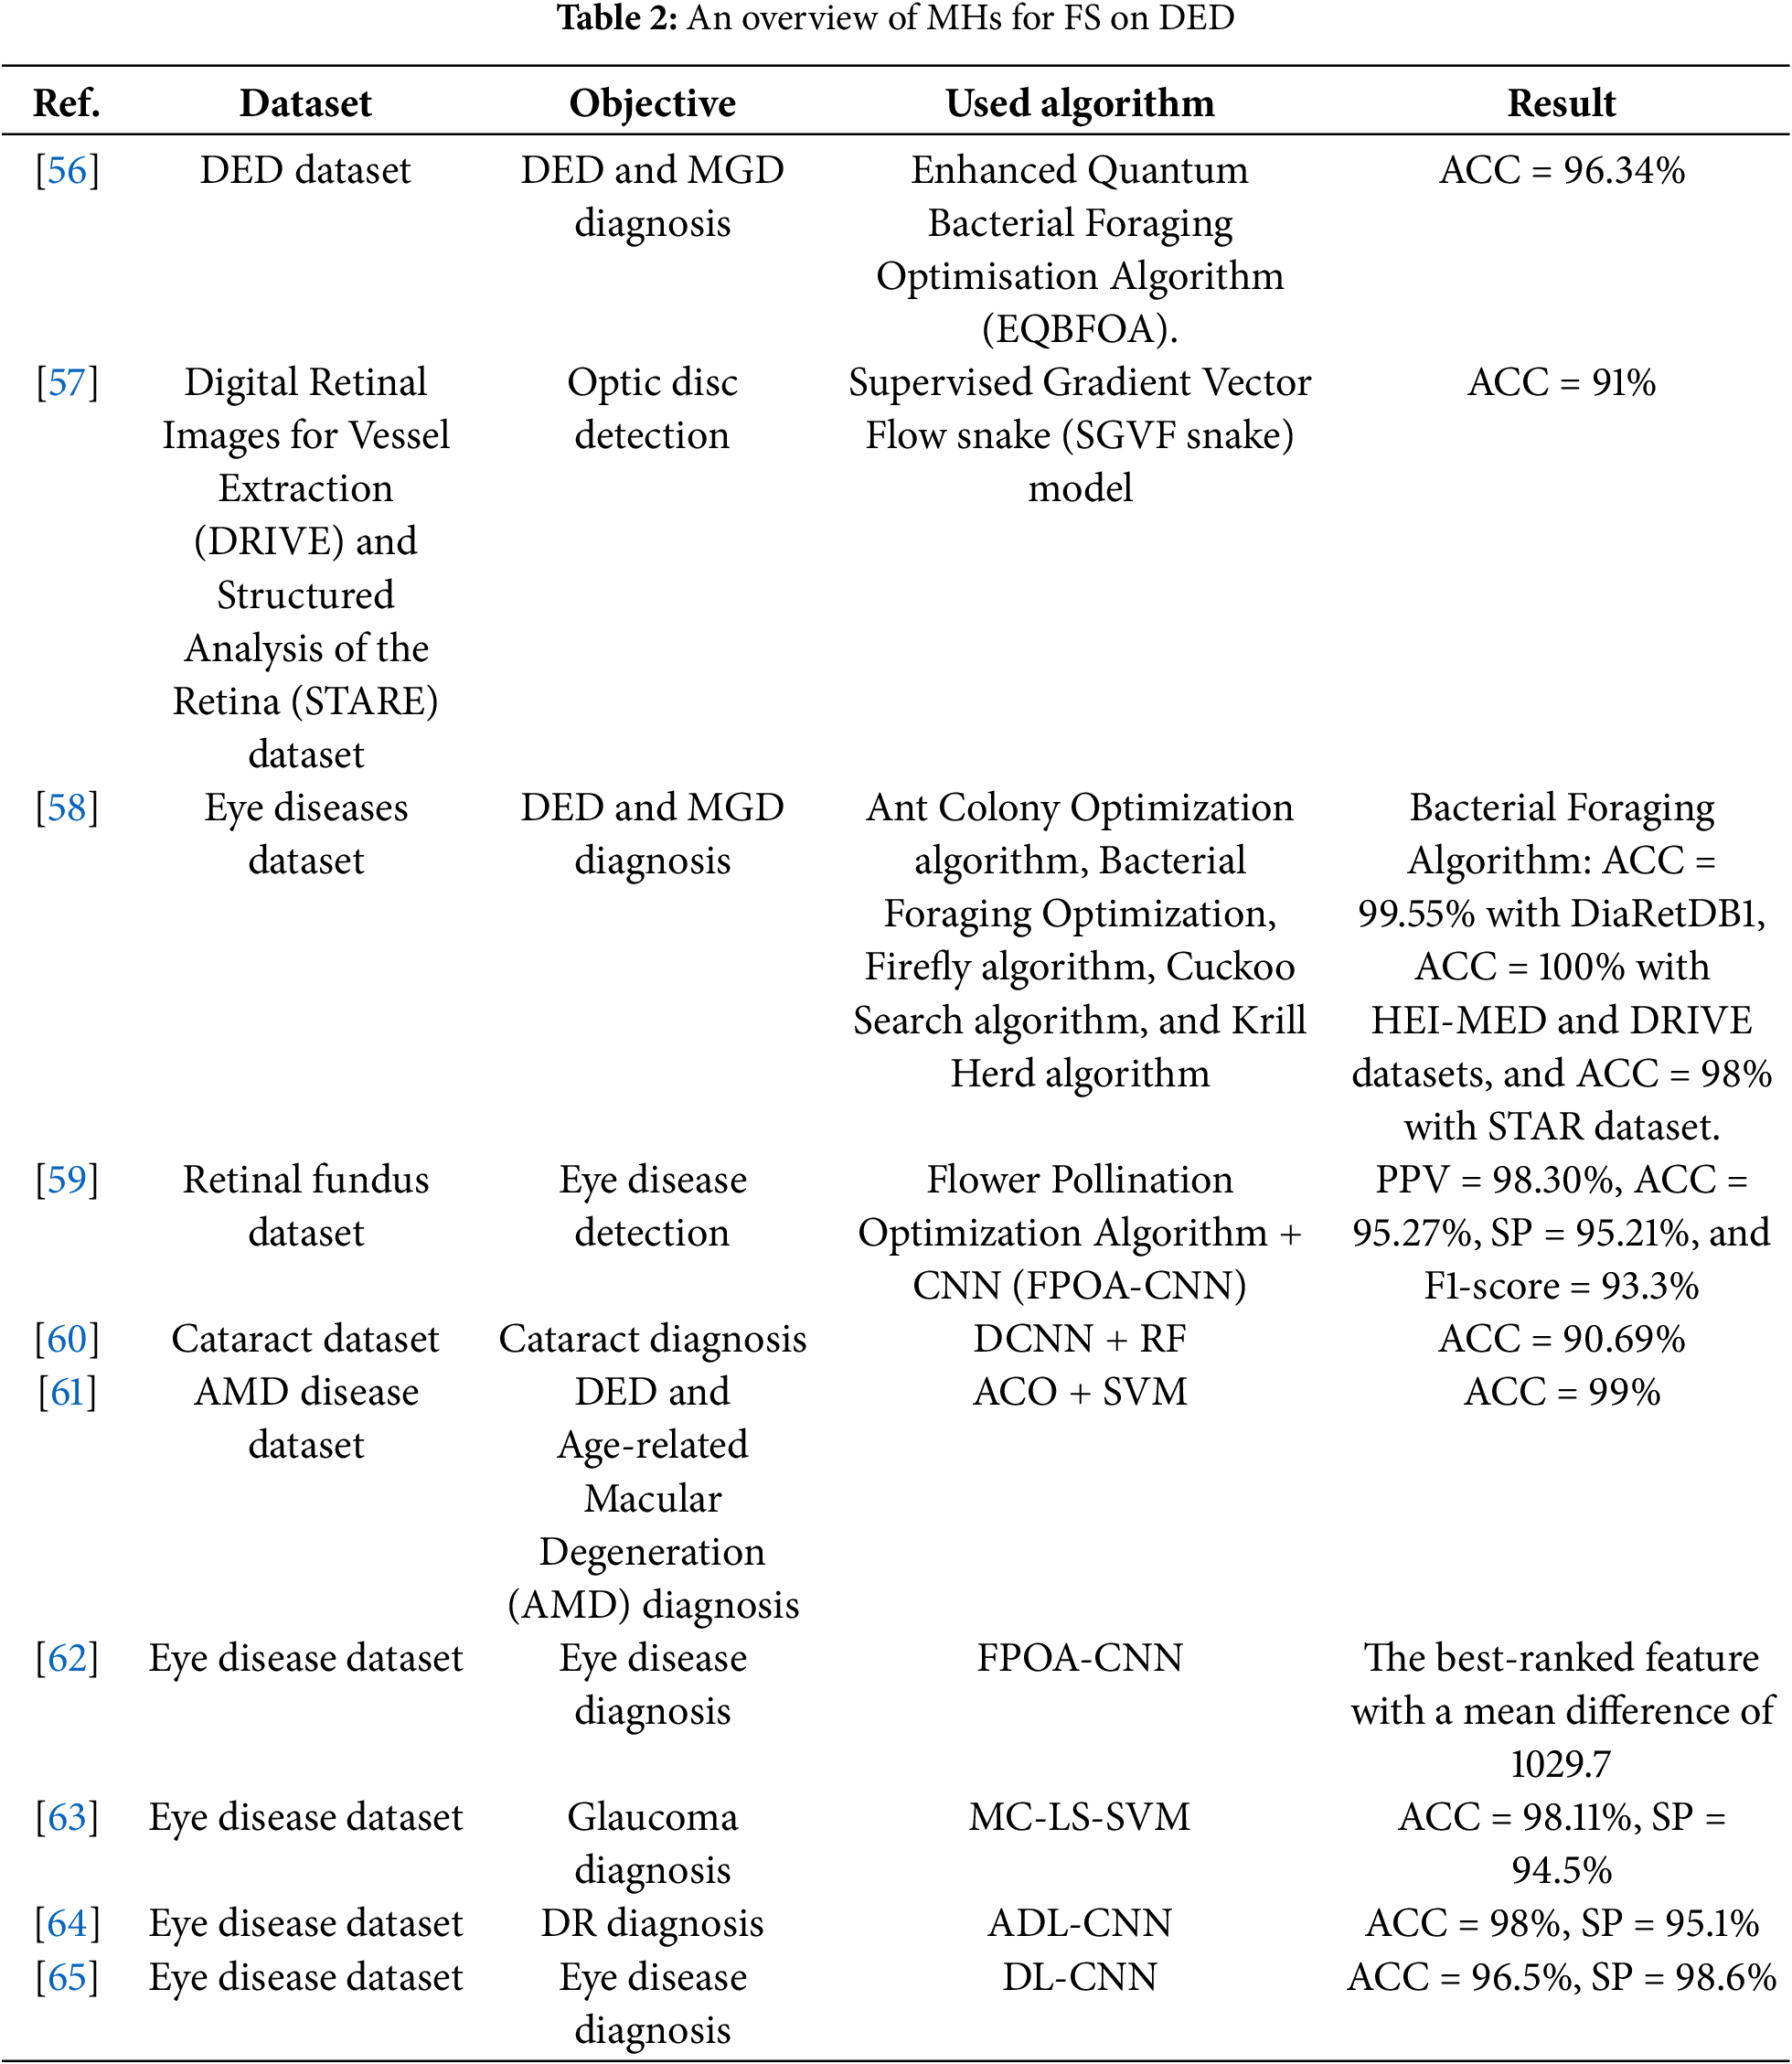
The study found that several important features, such as age, rhinitis, lipid-lowering medicine, sex, cataract surgery, current depression, rhinoplasty, stress and omega-3 fatty acid intake, were associated with DED [54]. Moreover, DED is a serious postoperative consequence and an important factor to take into account while developing a laser surgical strategy. EAI is a useful tool for expert-level knowledge of the criteria utilized in the selection of refractive surgery techniques, according to Yoo et al. [55]. They used ANN ML, SVM, and XGboost models to classify patients into four categories of surgeries according to the features of DED, lifestyle, and financial constraints. Accuracy was assessed using both internal and external datasets and the 10-fold cross-validation approach. Table 2 displays an overview of the MHs of FS on DED and their relevant references, datasets used, objectives, algorithms used, and results.
Although CAD systems and MHs-based FS techniques have advanced, many current methods still have issues with generalization, efficiency, and scalability. Following the no-free-lunch (NFL) [66], which states that no single optimization algorithm excels at solving every optimization problem, this study suggests a CAD system that uses the Improved Animated Oat Optimization Algorithm (IAOO) to improve the classification of DED. Using AOO with OBL and PSO to overcome the drawbacks of the original techniques and enhance the exploration and exploitation capabilities.
This section describes the Improved Animated Oat Optimization (IAOO) algorithm, the PSO algorithm, the original algorithm (AOO), and the combination of IAOO and PSO called (IAOO-PSO). The PSO algorithm speeds up convergence, while IAOO uses Oppositional-Based Learning (OBL) to balance exploration and exploitation. By doing this, the likelihood of results globally optimal solutions will increase, and local optima will be efficiently avoided. The following subsections present the specific enhancements and methodological advancements introduced in the IAOO-PSO algorithm. These sections elaborate on the implementation strategies and analyze the impact of each improvement on the algorithm’s overall performance.
3.1 Animated Oat Optimization Algorithm (AOO)
AOO is a recently released MH algorithm that draws inspiration from the animated oat’s natural behavior in the surroundings [17]. The three distinct behaviors of animated oat are simulated by AOO:
1. Seed dispersal by natural forces like wind, water, and animals.
2. Hygroscopic movement induces deformation and rotation of the primary awn in animated oat seeds, enabling the seed to roll and disperse effectively across the ground.
3. During the rolling propagation phase, energy is accumulated when the seed encounters obstacles, activating a propulsion mechanism under certain conditions to facilitate further dispersal.
As demonstrated by Eq. (1), AOO begins with a collection of random solutions.
The location information associated with each member of the
where
Features of the animated oat seed dispersal process in motion are related to the mass, rolling coefficient of eccentricity, and length of the seed’s main awn. The formula below can be used to compute these:
where
Once some of the animated oat seeds have fallen from the plant, wind, water, or animals are the main factors that disperse them. Because of its high degree of unpredictability, this dispersal method permits investigation of a large solution space. These are the position updates:
where the positions of the
The remaining animated oat seeds will now be divided into two groups according to whether or not they run into problems during dissemination. Furthermore, we assume that the two outcomes have an equal chance. When there are no obstructions, the hygroscopic rolling, driven by moisture-induced stress gradients, causes the seed location to vary. We use crucial curvature for snap buckling to represent this motion, which was motivated by Lindtner et al. [67], who showed that anisotropic swelling is controlled by the orientation of cellulose microfibers. The rolling mechanism can be represented theoretically using torque formulas and eccentric rotation:
where the size of the random matrix
where
3.2 Particle Swarm Optimization Algorithm (PSO)
The PSO [68] requires fewer parameters to adjust and is straightforward to use. The field of swarm intelligence studies computer systems that are motivated by the collective intelligence that emerges from the collaboration of homogeneous agents in the environment, such as fish schools and bird flocks. PSO is modeled after the structured behavior of schools of fish and flocks of birds [69].
PSO is a population-based optimization tool in which an initial population of random particles is used to guide the algorithm’s search for optima through generational updates. Let’s say the colony is made up of M particles and the search space is D-dimensional. With
By monitoring their own best, the swarm will progress towards the top spot globally as the number of iterations increases.
1. Calculate each particle’s fitness within the population by applying the optimized objective function.
2. By comparing the recently assessed fitness with the previous best individual and global fitness, the best fitness and positions can be updated in the appropriate places.
3. Each particle’s position and velocity within the population should be updated. The PSO algorithm’s optimization capability is the result of this updating stage, according to the following equations:
where the learning variables
3.3 Opposition-Based Learning (OBL)
Conventional MH algorithms begin the search with an initial solution consisting of a set of randomly generated numbers. The algorithm’s convergence rate is unstable and typically slow. OBL is implemented to get over these issues, and both randomly produced and reverse solutions are taken into consideration.
In 2005, the field of machine learning was exposed to the main opponent concept [18]. Various OBL techniques have since been effectively added to MH algorithms to boost performance. A thorough analysis of the application and development of OBL techniques may be found in [71]. The interval
3.4 Support Vector Machines (SVMs)
SVM technique, commonly used for regression and classification applications, were used as a classifier in the classification phase. Vapnik was the first to develop SVM in the late 20th century [72]. Since then, it has been used in several fields, including bioinformatics and biometrics. The fundamental idea is to use hyperplanes to divide the data into distinct classes. When the data is linearly separable, SVM performs exceptionally well; when the data is not linearly separable, it struggles. Kernel functions allow for linear separation by mapping the data to a higher-dimensional region. The performance of SVM depends on choosing the right kernel function and parameters [73]. Two important parameters are C and
Eq. (19) computes
where the slack variable
3.5 The Proposed IAOO Algorithm
This section presents the IAOO-PSO, a suggested algorithm that improves on the original AOO by combining the OBL technique and the PSO algorithm. The OBL technique is integrated into the initialization phase to increase the probability of escaping local optima by enhancing population diversity and guiding the search process closer to the global optimum. To produce more useful candidate solutions during exploitation, we also use the PSO method to accelerate convergence. This improves convergence toward the optimal solution while expanding the search in potential areas. The main drawbacks of the original AOO, such as its vulnerability to early convergence, inadequate exploitation in intricate environments, and a poor balance between exploration and exploitation, were intended to be addressed by these changes. To guarantee robustness and convergence stability, effective optimization necessitates resolving these problems, particularly the propensity to become stuck in local minima. The following describes the primary stages of the proposed IAOO-PSO algorithm:
3.5.1 IAOO-PSO Initialization Phase
To create a varied and useful initial population, the initialization step of the AOO algorithm is crucial. Within the search region delineated by the lower and upper limits, LB and UB, each solution is produced at random. The algorithm uses OBL to increase diversity. We integrate the OBL into the fundamental algorithm for AOO. OBL, which Tizhoosh first presented, suggests that opposing numbers have a higher chance of solving arbitrary ones. OBL has been successfully applied to many algorithms and aims to improve the effectiveness of MH algorithms. This study incorporates OBL late in the initial phase to fully explore optimal solutions and avoid local stagnation. The OBL technique is calculated using Eq. (17).
After evaluating the
Two stopping criteria are used to determine when the IAOO-PSO algorithm stops. In particular, the search is stopped when either the maximum number of iterations (
where the best solution
Algorithm 1 shows the pseudo-code of the proposed IAOO-PSO approach.

3.5.3 Time Complexity of IAOO-PSO
Three main stages can be used to evaluate the time complexity of IAOO: initialization, solution updates, and fitness assessments. The time complexity during the initialization phase, which includes determining initial fitness values and setting up population placements, is
When combining these stages, the total time complexity of IAOO-PSO is:
Consequently, the total time complexity of the IAOO-PSO algorithm is
3.6 The Proposed IAOO-PSO-SVM Classification Model
The primary objective of developing an automated diagnostic system using machine learning (ML) techniques is to construct a predictive model that not only fits the training data effectively but also generalizes well to unseen test data—demonstrating high testing accuracy. To improve diagnostic performance, particularly disease classification accuracy, various data mining algorithms are used during the feature preprocessing stage. This preprocessing generally falls into two main categories: feature extraction and FS.
FS aims to identify a subset of features from the original dataset that are most relevant to the target labels, using either statistical or search-based techniques. This process plays a vital role in enhancing model training, controlling overfitting, and promoting generalization. Binary variants of MH algorithms offer an effective approach for exploring the feature space and identifying optimal feature subsets, even in the presence of large-scale feature dimensions. Integrating MHs into FS helps improve both model performance and classification accuracy.
Within FS and ML frameworks, the fitness function in MHs plays a central role by evaluating the quality of each candidate feature subset. Recent research has enhanced these systems by using hybrid MH approaches to reduce search space complexity while improving classification accuracy [74]. In this study, the integration of a novel DED classification method is demonstrated using a publicly available dataset of DEDs. The classification pipeline consists of four main stages: data preprocessing, feature selection using the proposed IAOO-PSO algorithm, classification, and evaluation. The overall framework of the proposed IAOO-PSO-based SVM classification model is illustrated in Fig. 1.

Figure 1: The general structure of the proposed IAOO-PSO-based SVM classification model
3.6.1 Phase 1: Collection and Preprocessing of Datasets
In this study, a structured dataset was used to classify DED based on key features such as screen time, blue light filter usage, eye strain, redness, itching, and sleep duration. This dataset enables researchers and healthcare professionals to explore associations between lifestyle factors and ocular health. The data, comprising individuals aged 18 to 45, was obtained from the Kaggle Machine Learning Repository [75].
The dataset contains information from over 20,000 participants, including teenagers, young adults, and middle-aged individuals of both sexes. It consists of 26 features along with a binary target variable, where a value of 1 indicates the presence of dry eye (65%) and 0 denotes the absence (35%). A detailed description of the features of the dataset is provided in Table 3.

Before analysis, extensive data preprocessing was conducted to ensure accuracy and consistency. This included handling missing values and outliers. Furthermore, normalization techniques were applied to standardize feature scales, reducing the potential bias of variable magnitude and facilitating more effective and reliable model training and evaluation.
Data Cleaning
To ensure that the data used in the research was accurate and pertinent, data cleaning was done for this paper. This process entailed removing superfluous or erroneous data that could impair the performance of algorithms and models. Furthermore, the data cleaning procedure comprised fixing dataset mistakes and minimizing duplicates [76]. Three primary steps comprised the data-cleaning process:
• Removing instances in which more than 80% of the data had missing values.
• Features with more than 80% missing values are eliminated.
• We will use median imputation to fill in the remaining missing data.
Data Normalization
Normalization is a technique used to adjust the scale of raw data while retaining its essential characteristics. By converting the original values to a common scale, normalization helps preserve the relative differences between data points within the dataset [77]. The transformed values typically fall within the range of [(0, 1) or (−1, 1)]. The normalized weight for a specific attribute W and its value
where the mean is represented by
3.6.2 Phase 2: Feature Selection Using the IAOO-PSO Algorithm
To find the most informative subset of features that optimizes classification performance, the IAOO-PSO is used in this phase. By exploring the search space, IAOO-PSO minimizes the size of features that are selected while reducing redundancy, removing features that aren’t relevant, and improving classification accuracy. A population of solutions is initialized at the start of the optimization process, with each agent standing in for a subset of candidate features that are represented as continuous-valued vectors. The transformation rule specified in Eq. (24) is then used to binarize these vectors to signal feature inclusion or exclusion:
Each solution is assessed by training an SVM classifier on the selected subset. The classification error and the length of the subset are used to provide a fitness function that measures the classification performance. In Eq. (25), the fitness function is defined; a lower value denotes a better solution:
In this case, E stands for the classification error, |S| for the number of features that were selected, and |T| for the total number of features. The trade-off between classification performance and compactness of the subset is balanced by the parameter
We overcame these difficulties and improved the classification accuracy by modifying the SVM settings using the recommended IAOO-PSO for FS. Numerous studies and empirical data demonstrate SVM’s higher performance over other classifiers such as DT, kNN, and NB, which is why it was selected. SVM has been widely used as a benchmark in FS research and integrates well with feature selection frameworks. The effect of IAOO-PSO in combination with SVM on handling problems of DED classification and FS is covered in detail in this section. A wrapper algorithm finds the optimum combination of feature subsets to train the SVM, and then uses those subsets to increase performance.
Algorithm 2 explains the precise steps in the IAOO-PSO-SVM model and how to use Eq. (25) to calculate the fitness function, which indicates the optimal solution.

3.6.4 Phase 4: Evaluation of the Classification Model
To evaluate the classification performance of the proposed IAOO-PSO-SVM model, several metrics are used, including Accuracy, F1-score, sensitivity, specificity, and precision. These metrics collectively provide a well-rounded assessment by addressing different facets of prediction quality, such as accuracy, consistency, and the model’s ability to balance FP and FN, as illustrated in Table 4.

4 Experiment 1: Evaluating the Performance of the Proposed IAOO-PSO Algorithm on CEC’22 Benchmark Suite
The proposed IAOO-PSO algorithm is rigorously tested using the CEC’22 benchmark suite [78], which comprises 12 widely adopted optimization functions. These functions are grouped as follows:
To further validate the effectiveness of IAOO-PSO, it is compared against a selection of both classical and recently developed MH algorithms, including Particle Swarm Optimization (PSO), weIghted meaN oF vectOrs (INFO), Whale Optimization Algorithm (WOA), Beluga Whale Optimization (BWO), Sine Cosine Algorithm (SCA), Moth-Flame Optimization (MFO), and the original AOO algorithm. Each algorithm is evaluated using its standard parameter settings as specified in the original literature. A summary of these parameter configurations is provided in Table 5. Standard parameters were used to ensure a consistent, fair, and reproducible experimental setup across all methods. This also allowed us to focus our analysis on the feature selection capabilities of each algorithm, without introducing bias from problem-specific hyperparameter tuning.

A number of performance indicators, such as the mean (
Furthermore, the overall performance ranking of the algorithms was ascertained using the Friedman rank test [79]. Every experiment was conducted using MATLAB R2022a on a system that had an Intel(R) Core(TM) i7-13620H CPU running at 2.40 GHz and 16 GB of Memory.
4.1 Statistical Analysis of CEC’22 Benchmark Functions
In this subsection, the IAOO-PSO algorithm is compared with AOO and six other MH techniques. For 12 benchmark functions with a problem dimension of 10, the mean (

As evidence of its improved performance, IAOO-PSO obtains the mean best fitness value of
The proposed IAOO-PSO consistently outperforms all competing algorithms for the multimodal functions (
The performance of IAOO-PSO is strong when evaluated on hybrid functions (
IAOO-PSO obtains the optimal mean value of
The overall rank and the Friedman mean rank provide additional evidence of the efficacy of IAOO-PSO. IAOO-PSO regularly performs better than the other algorithms in the comparison research, with a Friedman mean rank of 1.00 and the highest overall rank of 1. Together, these results show how well IAOO-PSO performs on a wide range of benchmark functions, indicating its accuracy, resilience, and potential as a competitive optimization method.
Boxplot analysis is a valuable tool for visualizing the distributional characteristics of data. In this study, boxplots were utilized to illustrate the performance distribution of each algorithm, with results corresponding to those presented in Table 6. The whiskers in the boxplots indicate the minimum and maximum values achieved by the algorithms, while the lower and upper bounds of the boxes represent the first (Q1) and third (Q3) quartiles, respectively. A narrower box indicates a more consistent and stable performance.
Fig. 2 displays the boxplots for functions


Figure 2: Boxplot visualization of statistical performance across CEC’22 functions for all compared algorithms
4.3 Convergence Curves Analysis
In comparison to several other optimization algorithms, including PSO, BWO, HHO, INFO, SCA, WOA, MFO, and the original AOO, this subsection provides a thorough examination of the convergence performance of IAOO-PSO. For every method, Fig. 3 shows the convergence graphs on the CEC’2022 benchmark functions (F1 to F12). When it comes to function F1, the IAOO-PSO algorithm outperforms its rivals in terms of early exploration capabilities and rapidly converges to reduced error levels.

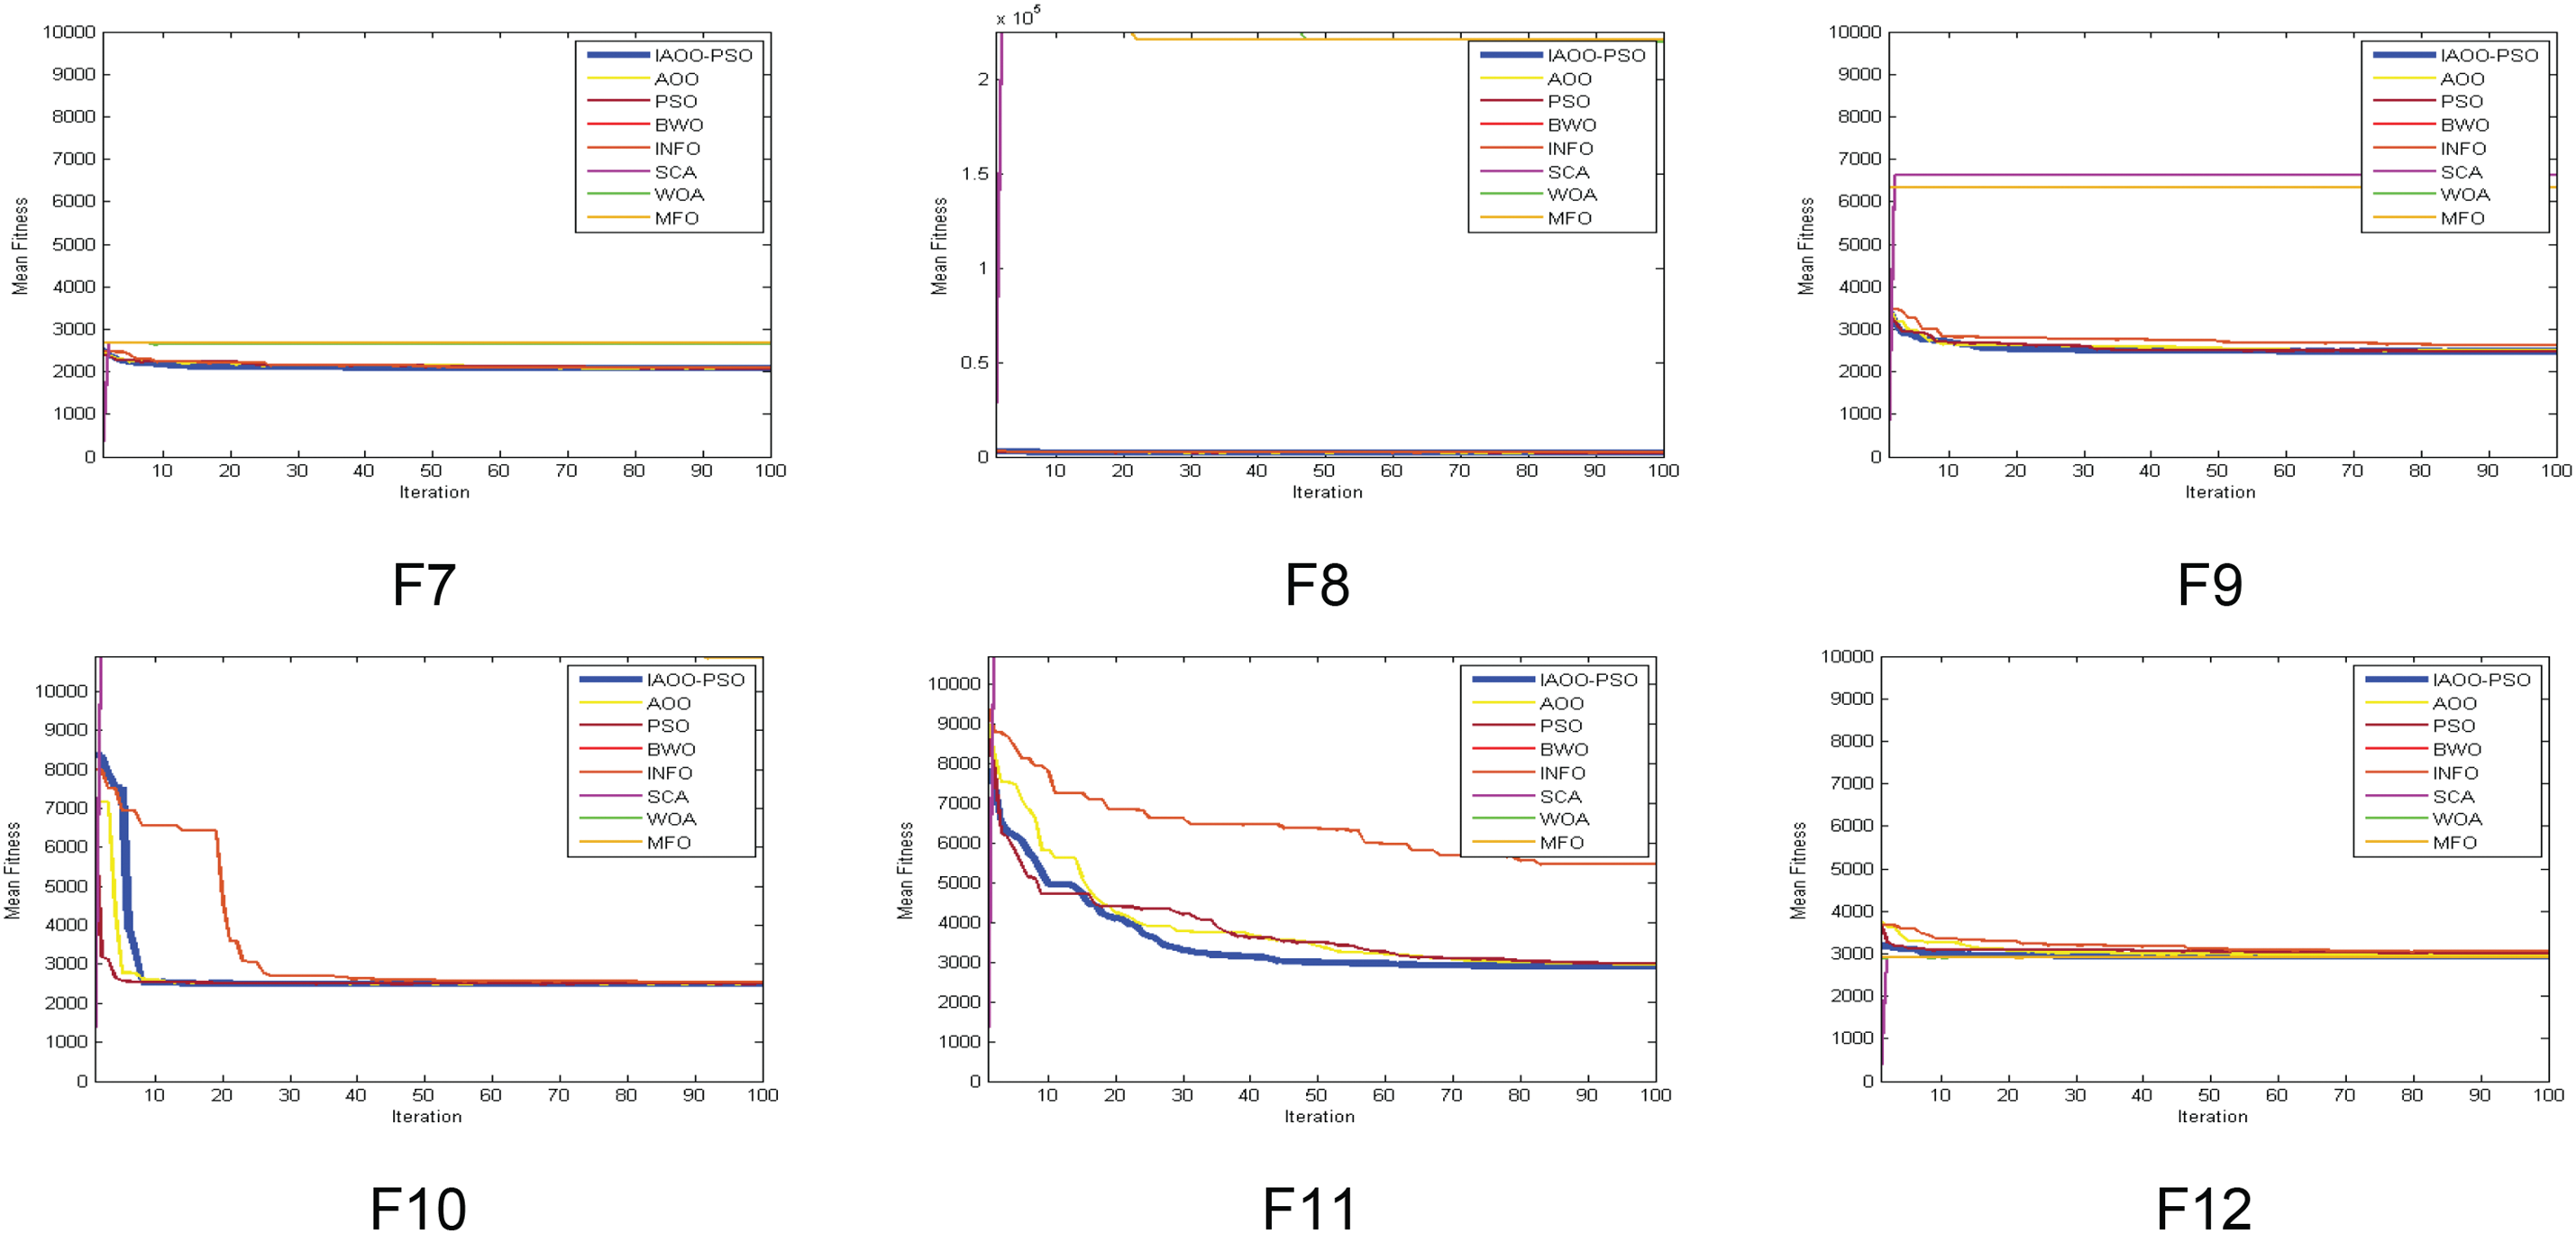
Figure 3: Convergence curves of IAOO-PSO vs. competing algorithms on benchmark functions F1–F12
WOA performs the worst, converges more slowly, and becomes stuck at larger error values than the other techniques. Similarly, IAOO-PSO outperforms all other algorithms in
In terms of convergence speed and accuracy, both IAOO-PSO surpass all other algorithms for
IAOO-PSO routinely outperforms alternative approaches, such as INFO and BWO, which suffer from slower convergence rates and less-than-ideal final outputs, in terms of convergence speed and final error levels for functions
As shown in Table 7, the IAOO-PSO algorithm outperforms all other compared methods in the mean fitness of benchmark functions solved.

5 Experiment 2: Classification Results on the DED Dataset
We describe the performance of the suggested IAOO-PSO-SVM classification model in several comparative assessments and explain the experimental results. The tests are designed to show how well the IAOO-PSO algorithm performs in FS and how well the DED dataset is classified. We thoroughly compare our suggested approach with seven other MH algorithms.
In the literature, Support Vector Machine (SVM) is frequently used as the final classifier following feature selection via metaheuristic algorithms [74,89]. However, some studies have utilized alternative classifiers, such as ensemble models [90] or random forest and k-nearest neighbors [91], based on specific problem domains or data characteristics. In this study, SVM was used consistently across all comparative methods to ensure fair benchmarking and eliminate classifier-induced performance bias.
The SVM classifier, which was set up with the same kernel function (RBF), hyperparameters, and training-validation configuration, received the chosen feature subsets from each MH algorithm separately. This uniform SVM setup throughout all experiments guarantees that variations in performance metrics can be directly assigned to the ability of the feature subset selected by the optimization algorithm rather than the impact of various classification models. The Intel(R) Core(TM) i7-13620H CPU utilized in the research ran at 2.60 GHz and had 16.0 GB of RAM. To guarantee uniformity and fairness in the comparison, every experiment was carried out on the same machine. The dataset was randomly divided using the stratified holdout validation approach to assess the generalization performance of our IAOO-PSO-SVM model for classification purposes, with 80% of the data used for training and FS, and 20% was held out for testing, ensuring that class proportions were preserved across both subsets. The holdout procedure was carried out 30 times with various random seeds to minimize variance and guarantee the stability of the results.
The proposed method was developed and implemented using the MATLAB programming language, which ensured a stable experimental setting. The categories for this section are as follows: In Section 5.1, the classification methods of IAOO-PSO-SVM and AOO−SVM are compared. In Section 5.2, the suggested IAOO-PSO algorithm is compared with other MH algorithms.
This section presents a comparative performance analysis of AOO variants based SVM classifier between the original algorithm (AOO), improved AOO-based OBL strategy (IAOO), integrated AOO with PSO algorithm (AOO-PSO), and the proposed IAOO-PSO based on an SVM classifier. The main focus of the comparison is the assessment of important classification performance measures using the DED dataset, such as ACC, SE, SP, PPV, FS, and F1. The results, as displayed in Table 8, reveal a notable performance difference between the four algorithms, underscoring the advantages of the IAOO-PSO optimization strategy over the fundamental AOO technique. Across all important classification metrics, the results in Table 8 unequivocally show that the IAOO-PSO-SVM model performs better than all other variants, including the AOO-SVM, IAOO-SVM, and AOO-PSO-SVM models. The ACC of the IAOO-PSO-SVM was a remarkable 99.8% greater than the ACC of the AOO-SVM 95.16%, IAOO-SVM 96.18%, and IAOO-PSO-SVM 96.39%.

Fig. 4 shows that IAOO-PSO-SVM has significantly improved overall classification performance, with more instances properly classified.

Figure 4: Evaluation of AOO variants based SVM classifier
The SE, which measures the true positive rate, was 99.44% for the IAOO-PSO-SVM model and higher than the SE of 95.15% for the AOO-SVM, 96.42% for the IAOO-SVM, and 96.35% for the AOO-PSO-SVM models. This improvement implies that the IAOO-PSO-SVM is significantly more adept at detecting DED cases that are real positives, hence reducing FN. The IAOO-PSO-SVM achieved 99.03% for SP, which is 4.03% greater than the AOO-SVM’s 95.00%. This suggests that the IAOO-PSO-SVM is more successful in accurately detecting negative situations, lowering the possibility of false positives. The IAOO-PSO-SVM achieved 99.63% for PPV, which is 4.00% higher than the AOO-SVM’s 95.63%. This suggests that the IAOO-PSO-SVM is more successful in correctly predicting positive instances among all instances predicted as positive. The IAOO-PSO-SVM model obtained a 0.0027 FS, 0.0756 greater than the AOO-SVM’s 0.0783 and a 0.25 best fitness, 0.18 greater than the AOO-SVM’s 0.43. Lastly, the IAOO-PSO-SVM model obtained a 99.53% F1, 4.15% greater than the AOO-SVM’s 95.38%, the IAOO-SVM’s 96.41%, and the AOO-PSO-SVM’s 96.32%. These results show how the IAOO-PSO algorithm has improved its optimization capabilities, giving it a more effective and efficient option for DED diagnosis.
5.2 Performance Comparison: IAOO-PSO vs. MH Algorithms
The suggested IAOO-PSO integrated with SVM (IAOO-PSO-SVM) is compared with several other MH techniques in this section. Using the DED dataset, the comparison analysis focuses on assessing how well these algorithms perform in terms of important classification parameters such as ACC, SE, SP, PPV, FS, Fit, and F1. By examining these measures, the IAOO-PSO-SVM model’s efficacy and resilience for FS and classification tasks are demonstrated, indicating its possible benefits over conventional optimization methods.
The FS optimizers included all comparative MH algorithms. Every technique was used separately to select a subset of the DED dataset’s 26 features. An SVM classifier was then trained on the selected feature subset, and performance was assessed using common metrics. The selected feature indices and the overall quantity of selected features for every method are shown in Table 9. Table 9 shows how IAOO-PSO increased classification accuracy while consistently selecting the smallest and most relevant subset of features. This demonstrates how IAOO-PSO can effectively reduce dimensionality without sacrificing model performance, which is especially useful in medical diagnostics.

A detailed comparison of IAOO-PSO against several popular optimization techniques, such as PSO, BWO, INFO, SCA, WOA, MFO, and the original AOO, for the classification task using the DED dataset is shown in Table 10 and Fig. 5. The original AOO (95.16%) and other MH algorithms are far less accurate than the IAOO-PSO, which achieves an impressive 99.8%. INFO is the nearest competitor, with an ACC of 97.63%. Because of its great ACC, the IAOO-PSO algorithm is a very dependable tool for predictive analysis, as it can accurately identify cases within the DED dataset.


Figure 5: Evaluation of algorithms based on average accuracy
The proposed IAOO-PSO achieves a notably high SE of 99.44%, reflecting its strong performance. This is far better than the highest SE of 97.82% attained by the INFO algorithm among conventional methods, and it is noticeably higher than the original AOO, which scored 95.15%. This enhanced SE demonstrates the IAOO-PSO’s capacity to reduce the possibility of FN, which is essential in medical diagnostics because failing to detect a positive instance might have serious consequences.
Additionally, the suggested IAOO-PSO performs exceptionally well in terms of SP, attaining a SP of 99.03%, surpassing both the original AOO’s 95.00% and other compared algorithms such as SCA (96.13%) and MFO (95.33%). This high SP level increases the model’s dependability and credibility by enabling the IAOO-PSO algorithm to correctly identify patients who do not have the ailment.
The effectiveness of the IAOO-PSO algorithm is further supported by the F1-score, which balances PPV and SE, which has a score of 99.53%. The INFO score of 97.80% and the original AOO’s F1 of 95.38% are both below this. Both FP and FNs are decreased by the IAOO-PSO’s strong F1, which shows that it successfully strikes a compromise between SE and PPV. Accurate classification is crucial in medical diagnostics, where this statistic is especially pertinent.
Consequently, the results presented in Table 10 and Fig. 6 show that the suggested IAOO-PSO method provides significant enhancements over the original AOO and other MH algorithms.
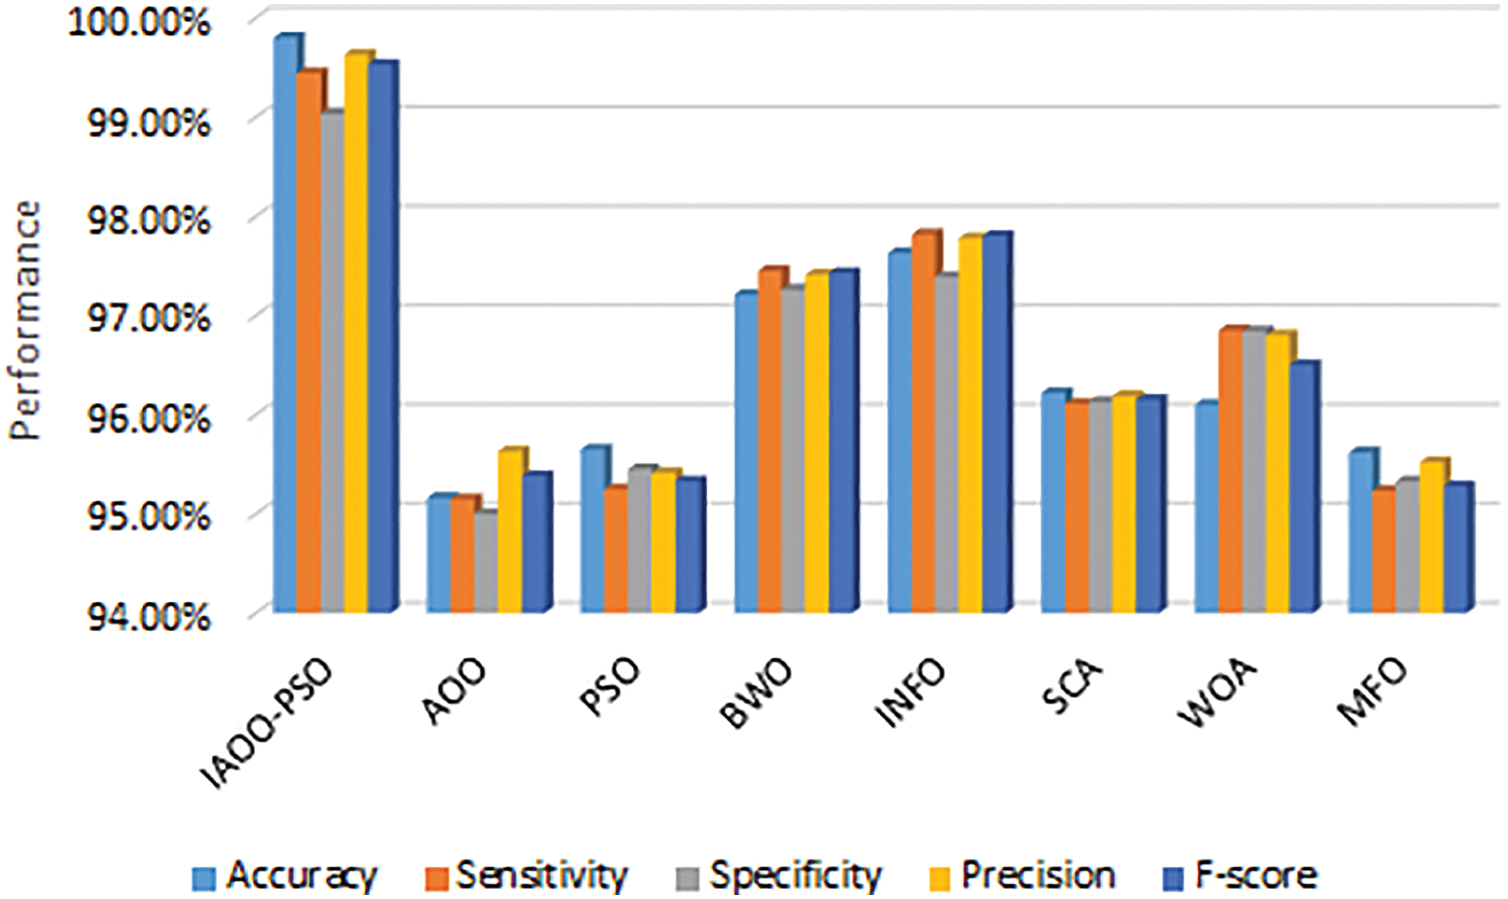
Figure 6: Evaluation of AOO and other MH algorithms based SVM classifier
Our method is superior in selecting the most relevant features while enhancing the overall classification performance, as this comparison shows. The results of the comparisons of several performance measures are shown in Table 10. The suggested IAOO-PSO once more demonstrates superiority when examining the average number of selected features. With an average of 27, it selected the fewest features compared to the other approaches.
The efficacy of IAOO-PSO in FS and classification tasks related to the DED dataset is demonstrated by its superior performance across all assessed parameters, including ACC, SE, SP, PPV, F1, and FS. Table 10 and Fig. 6 demonstrate the advanced optimization capabilities and potential of the IAOO-PSO as a powerful tool for medical data classification tasks, validating the improvements made to the system. This combination of low FS and high accuracy demonstrates the superiority of the IAOO-PSO-SVM algorithm over the other compared algorithms.
5.3 Convergence Curves Analysis
The convergence behavior of the proposed IAOO-PSO algorithm is compared against several MH algorithms using their final fitness values after optimization. A lower fitness value indicates better optimization performance for a minimization problem.
The IAOO-PSO algorithm achieved the lowest fitness value of 0.25, significantly outperforming the other algorithms. Table 10 and Fig. 7 indicate that IAOO-PSO has a superior convergence capability, rapidly and effectively finding the optimal solution.

Figure 7: Convergence curves of IAOO-PSO-SVM approach and other MHs on DED dataset
AOO and MFO had higher fit values (0.43 and 0.4028, respectively), meaning their solutions were less optimal compared to IAOO-PSO. The results demonstrate that the IAOO-PSO algorithm outperforms all other compared MH algorithms in DED classification. This reflects the effectiveness of IAOO-PSO in balancing exploration and exploitation, likely due to its hybrid design.
To provide a comprehensive comparison of the classification performance and robustness of each optimization-based model, a boxplot analysis was conducted using accuracy values collected over 30 independent runs for each algorithm. Boxplots are particularly effective for visualizing the distribution, central tendency (median), and variability (interquartile range) of performance metrics, as well as for identifying potential outliers.
Table 10 and Fig. 8 reveal that the IAOO-PSO algorithm outperforms all other methods with a median ACC of 99.80%. The corresponding boxplot for IAOO-PSO displays a very narrow interquartile range and minimal dispersion, indicating that the algorithm consistently delivers high ACC with low variance across runs. This suggests that IAOO-PSO is not only accurate but also reliable and robust in handling classification tasks.

Figure 8: Boxplot of IAOO-PSO-SVM approach and other MHs on DED dataset
In contrast, other algorithms such as AOO (95.16%), PSO (95.65%), BWO (95.21%), and MFO (95.62%) exhibit lower median accuracies along with wider boxplots, reflecting higher variability in performance. These results suggest less consistency and a greater likelihood of producing suboptimal outcomes in certain runs. Similarly, SCA (96.22%) and WOA (96.10%) demonstrate modest improvements in median ACC, but still fall short in terms of robustness when compared to IAOO-PSO.
Among the competing algorithms, INFO (97.63%) shows relatively better performance, with higher median accuracies and moderately narrow interquartile ranges. However, their performance still varies more significantly than that of IAOO-PSO and does not reach the same peak accuracy level.
Overall, the boxplot analysis underscores the superior performance of IAOO-PSO, which not only achieves the highest classification accuracy but also demonstrates remarkable stability and reliability across multiple runs. This highlights its potential suitability for critical applications, such as medical diagnostics, where both accuracy and consistency are essential.
A sensitivity analysis was conducted to evaluate the impact of the

Table 8 presents the comparative performance of four AOO variants (AOO, IAOO, AOO-PSO, and IAOO-PSO) combined with an SVM classifier. The results, averaged over 30 independent runs, include both mean values and standard deviations (std) for classification accuracy, sensitivity, specificity, precision, F1-score, best fitness, and FS rate.
The proposed IAOO-PSO method achieves the highest mean performance across all evaluated metrics:
• Accuracy: 99.80%
• Sensitivity: 99.44%
• Specificity: 99.03%
• F1-Score: 99.53%
• Best Fitness: 0.25
• FS Rate: 0.0027
Consistency and reliability of IAOO-PSO across multiple runs.
Table 10 compares IAOO-PSO against seven other MHs algorithms, again based on 30 independent runs. The IAOO-PSO consistently outperforms all others across all metrics:
• IAOO-PSO achieved the highest mean accuracy (99.80%) and lowest STD (
• Competing algorithms like INFO (97.63%
• IAOO-PSO also had the lowest FS rate (0.0027
These results demonstrate not only performance superiority but also low variability, underscoring the consistency and reliability of IAOO-PSO across multiple runs.
A wide range of algorithms has been designed to facilitate the early diagnosis of Dry Eye Disease (DED), with Machine Learning (ML) models playing a significant role in the management of classification tasks in various fields. This study presents a novel Feature Selection (FS) technique based on the Improved Animated Oat Optimization (IAOO) algorithm, specifically developed to tackle the issues associated with high-dimensional data commonly present in DED datasets.
The IAOO greatly improves exploration and exploitation capabilities by integrating Oppositional-Based Learning (OBL) strategy and Particle Swarm Optimization (PSO) algorithm. Using the DED dataset, the suggested IAOO-PSO-SVM classification model was used to guarantee the best possible classification accuracy. The most relevant features were selected using the IAOO-PSO-SVM, which decreased the complexity of the dataset without compromising its integrity. To assess the effectiveness of the proposed IAOO-PSO-SVM model, its performance was evaluated using widely accepted metrics: accuracy, sensitivity, specificity, best fitness, precision, FS rate, and F1-score, each providing insight into different aspects of classification quality. IAOO-PSO was used as a global optimization strategy using the CEC’2022 benchmark suite, in addition to being used in FS for classification tasks. According to the results, IAOO-PSO outperformed seven other optimization algorithms, such as PSO, BWO, INFO, SCA, MFO, WOA, and the original AOO algorithm. The IAOO-PSO consistently selected fewer features while retaining or outperforming other algorithms in classification. The proposed IAOO-PSO-SVM model was compared with several AOO-based SVM classifier variants, including AOO-SVM, IAOO-SVM, and AOO-PAO-SVM. Experimental results demonstrate that IAOO-PSO-SVM consistently outperforms these variants in both FS and classification tasks. In addition, the IAOO-PSO-SVM model was evaluated against other MH algorithms for DED classification, further highlighting its effectiveness and competitive performance.
This research highlights the strong performance of the proposed IAOO-PSO-SVM method in addressing the challenges of feature selection and classification. Comparative analysis against various MH algorithms revealed that the IAOO-PSO-SVM model achieved the highest classification accuracy of 99.8%, sensitivity of 99.454%, specificity of 99.03%, precision of 99.63% and F1 score of 99.53%. The combination of high classification accuracy, minimal FS, and strong optimization capabilities positions IAOO-PSO-SVM as a highly effective tool for medical diagnosis, particularly in addressing complex challenges such as DED classification. Despite its strong performance, this study has certain limitations. The proposed IAOO-PSO-SVM model was only validated on the DED dataset and benchmark functions, which may not fully capture its performance on more diverse or real-world medical datasets. Furthermore, the study was limited to binary classification and did not explore computational time trade-offs in practical deployment scenarios. Our goal for future research is to apply IAOO-PSO-SVM to additional important medical diseases, such as high-dimensional cancer genomics and cardiovascular diseases. Its adaptability to tasks including multiclass disease classification, survival analysis, and customized therapy planning will also be examined. In practical medical applications, investigating its integration with deep learning frameworks may enhance its diagnostic and predictive capabilities.
Acknowledgement: The authors extend their appreciation to the Princess Nourah bint Abdulrahman University Researchers Supporting Project number (PNURSP2025R746), Princess Nourah bint Abdulrahman University, Riyadh, Saudi Arabia.
Funding Statement: Princess Nourah bint Abdulrahman University Researchers Supporting Project number (PNURSP2025R746), Princess Nourah bint Abdulrahman University, Riyadh, Saudi Arabia.
Author Contributions: Essam H. Houssein: Supervision, Software, Visualization, Methodology, Formal analysis, Writing—review & editing. Eman Saber: Software, Validation, Data curation, Resources, Writing—original draft. Nagwan Abdel Samee: Methodology, Conceptualization, Formal analysis, Writing—review & editing. All authors reviewed the results and approved the final version of the manuscript.
Availability of Data and Materials: The data sets provided during the current study are available in [75].
Ethics Approval: This article does not contain any studies with human participants or animals performed by any of the authors.
Conflicts of Interest: The authors declare no conflicts of interest to report regarding the present study.
References
1. Wolffsohn JS, Arita R, Chalmers R, Djalilian A, Dogru M, Dumbleton K, et al. TFOS DEWS II diagnostic methodology report. Ocular Surface. 2017;15(3):539–74. doi:10.1016/j.jtos.2017.05.001. [Google Scholar] [CrossRef]
2. Wang H, Zhou R. Advanced diagnosis method analysis of the dry eye disease: a bibliographic study (2012–2022). Clin Med Front. 2022;1(1):1–8. [Google Scholar]
3. Azzam DB, Nag N, Tran J, Chen L, Visnagra K, Marshall K, et al. A novel epidemiological approach to geographically mapping population dry eye disease in the United States through Google Trends. Cornea. 2021;40(3):282–91. doi:10.1097/ico.0000000000002579. [Google Scholar] [CrossRef]
4. Jones L, Downie LE, Korb D, Benitez-del Castillo JM, Dana R, Deng SX, et al. TFOS DEWS II management and therapy report. Ocular Surface. 2017;15(3):575–628. doi:10.1016/j.jtos.2017.05.006. [Google Scholar] [CrossRef]
5. Wan KH, Lui GC, Poon KC, Ng SS, Young AL, Hui DS, et al. Ocular surface disturbance in patients after acute COVID-19. Clin Exp Ophthalmol. 2022;50(4):398–406. [Google Scholar]
6. Tsim NC, Chin J, Chan R, Li CL, Law A, Yeung LY, et al. Effect of systemic steroid and orbital radiotherapy on dry eye parameters in Thyroid Associated Orbitopathy (TAO). Invest Ophthalmol Visual Sci. 2018;59(9):5615–5. [Google Scholar]
7. Kumar S, Moni R, Rajeesh J. An automatic computer-aided diagnosis system for liver tumours on computed tomography images. Comput Electr Eng. 2013;39(5):1516–26. [Google Scholar]
8. Nair PP, Keskar M, Borghare PT, Methwani DA, Nasre Y, Chaudhary M. Artificial intelligence in dry eye disease: a narrative review. Cureus. 2024;16(9):e70056. doi:10.7759/cureus.70056. [Google Scholar] [CrossRef]
9. SaiSindhuTheja R, Shyam GK. An efficient metaheuristic algorithm based feature selection and recurrent neural network for DoS attack detection in cloud computing environment. Appl Soft Comput. 2021;100:106997. doi:10.1016/j.asoc.2020.106997. [Google Scholar] [CrossRef]
10. Nssibi M, Manita G, Korbaa O. Advances in nature-inspired metaheuristic optimization for feature selection problem: a comprehensive survey. Comput Sci Rev. 2023;49:100559. doi:10.1016/j.cosrev.2023.100559. [Google Scholar] [CrossRef]
11. Shamas S, Panda SN, Sharma I, Guleria K, Singh A, AlZubi AA, et al. An improved lung cancer segmentation based on nature-inspired optimization approaches. Comput Model Eng Sci. 2024;138(2):1051–75. [Google Scholar]
12. Guo X, Hu J, Yu H, Wang M, Yang B. A new population initialization of metaheuristic algorithms based on hybrid fuzzy rough set for high-dimensional gene data feature selection. Comput Biol Med. 2023;166:107538. doi:10.1016/j.compbiomed.2023.107538. [Google Scholar] [CrossRef]
13. Bartz-Beielstein T, Branke J, Mehnen J, Mersmann O. Evolutionary algorithms. Wiley Interdisciy Rev: Data Min Knowl Discov. 2014;4(3):178–95. doi:10.1002/widm.1124. [Google Scholar] [CrossRef]
14. Dorigo M, Stützle T. Ant colony optimization: overview and recent advances. In: Handbook of metaheuristics. Cham, Switzerland: Springer; 2018. p. 311–51. doi:10.1007/978-3-319-91086-4_10. [Google Scholar] [CrossRef]
15. Mirjalili S, Mirjalili S. Genetic algorithm. Evolutionary algorithms and neural networks: theory and applications. Cham, Switzerland: Springer; 2019. p. 43–55. [Google Scholar]
16. Abu-Mouti FS, El-Hawary ME. Overview of Artificial Bee Colony (ABC) algorithm and its applications. In: 2012 IEEE International Systems Conference SysCon 2012; 2019 Mar 19–22; Vancover, BC, Canada. p. 1–6. [Google Scholar]
17. Wang RB, Hu RB, Geng FD, Xu L, Chu SC, Pan JS, et al. The animated oat optimization algorithm: a nature-inspired metaheuristic for engineering optimization and a case study on wireless sensor networks. Knowl Based Syst. 2025;318(C):113589. doi:10.1016/j.knosys.2025.113589. [Google Scholar] [CrossRef]
18. Tizhoosh HR. Opposition-based learning: a new scheme for machine intelligence. In: International Conference on Computational Intelligence for Modelling, Control and Automation and International Conference on Intelligent Agents, Web Technologies and Internet Commerce (CIMCA-IAWTIC’06). Vol. 1. Piscataway, NJ, USA: IEEE; 2005. p. 695–701. [Google Scholar]
19. Kang Q, Xiong C, Zhou M, Meng L. Opposition-based hybrid strategy for particle swarm optimization in noisy environments. IEEE Access. 2018;6:21888–900. doi:10.1109/access.2018.2809457. [Google Scholar] [CrossRef]
20. Ewees AA, Abd Elaziz M, Houssein EH. Improved grasshopper optimization algorithm using opposition-based learning. Expert Syst Appl. 2018;112:156–72. doi:10.1016/j.eswa.2018.06.023. [Google Scholar] [CrossRef]
21. Özbay FA, Özbay E, Gharehchopogh FS. An improved artificial rabbits optimization algorithm with chaotic local search and opposition-based learning for engineering problems and its applications in breast cancer problem. Comput Model Eng Sci. 2024;141(2):1067–110. doi:10.32604/cmes.2024.054334. [Google Scholar] [CrossRef]
22. Zhang S, Luo Q, Zhou Y. Hybrid grey wolf optimizer using elite opposition-based learning strategy and simplex method. Int J Comput Intell Appl. 2017;16(02):1750012. doi:10.1142/s1469026817500122. [Google Scholar] [CrossRef]
23. Wang D, Tan D, Liu L. Particle swarm optimization algorithm: an overview. Soft Comput. 2018;22(2):387–408. doi:10.1007/s00500-016-2474-6. [Google Scholar] [CrossRef]
24. Ahmadianfar I, Heidari AA, Noshadian S, Chen H, Gandomi AH. INFO: an efficient optimization algorithm based on weighted mean of vectors. Expert Syst Appl. 2022;195:116516. doi:10.1016/j.eswa.2022.116516. [Google Scholar] [CrossRef]
25. Mirjalili S, Lewis A. The whale optimization algorithm. Adv Eng Softw. 2016;95:51–67. doi:10.1016/j.advengsoft.2016.01.008. [Google Scholar] [CrossRef]
26. Zhong C, Li G, Meng Z. Beluga whale optimization: a novel nature-inspired metaheuristic algorithm. Knowl Based Syst. 2022;251:109215. doi:10.1016/j.knosys.2022.109215. [Google Scholar] [CrossRef]
27. Mirjalili S. SCA: a sine cosine algorithm for solving optimization problems. Knowl-Based Syst. 2016;96:120–33. doi:10.1016/j.knosys.2015.12.022. [Google Scholar] [CrossRef]
28. Mirjalili S. Moth-flame optimization algorithm: a novel nature-inspired heuristic paradigm. Knowl-Based Syst. 2015;89:228–49. doi:10.1016/j.knosys.2015.07.006. [Google Scholar] [CrossRef]
29. Wang M, Lin Z, Zhou J, Xing L, Zeng P. Applications of explainable artificial intelligent algorithms to age-related macular degeneration diagnosis: a case study based on CNN, attention, and CAM mechanism. In: 2023 IEEE International Conference on Contemporary Computing and Communications (InC4). Vol. 1. Piscataway, NJ, USA: IEEE; 2023. p. 1–5. [Google Scholar]
30. Wang H, Zhou X, Du W, Huang L. The application of artificial intelligence to ophthalmology: a bibliometric study (2000–2021). 2021. doi:10.20944/preprints202111.0080.v1. [Google Scholar] [CrossRef]
31. Foo LL, Lim GYS, Lanca C, Wong CW, Hoang QV, Zhang XJ, et al. Deep learning system to predict the 5-year risk of high myopia using fundus imaging in children. npj Digit Med. 2023;6(1):10. doi:10.1038/s41746-023-00752-8. [Google Scholar] [CrossRef]
32. Jacoba CMP, Doan D, Salongcay RP, Aquino LAC, Silva JPY, Salva CMG, et al. Performance of automated machine learning for diabetic retinopathy image classification from multi-field handheld retinal images. Ophthalmol Retin. 2023;7(8):703–12. doi:10.1016/j.oret.2023.03.003. [Google Scholar] [CrossRef]
33. Kumar Y, Gupta B. Retinal image blood vessel classification using hybrid deep learning in cataract diseased fundus images. Biomed Signal Process Control. 2023;84:104776. doi:10.1016/j.bspc.2023.104776. [Google Scholar] [CrossRef]
34. Yabusaki K, Arita R, Yamauchi T. Automated classification of dry eye type analyzing interference fringe color images of tear film using machine learning techniques. Model Artif Intell Ophthalmol. 2019;2(3):28–35. doi:10.35119/maio.v2i3.90. [Google Scholar] [CrossRef]
35. Cartes C, López D, Salinas D, Segovia C, Ahumada C, Pérez N, et al. Dry eye is matched by increased intrasubject variability in tear osmolarity as confirmed by machine learning approach. Arch De La Soc Espanola De Oftalmol Engl Ed. 2019;94(7):337–42. doi:10.1016/j.oftale.2019.03.002. [Google Scholar] [CrossRef]
36. Yang WJ, Wu L, Mei ZM, Xiang Y. The application of artificial neural networks and logistic regression in the evaluation of risk for dry eye after vitrectomy. J Ophthalmol. 2020;2020(1):1024926. doi:10.1155/2020/1024926. [Google Scholar] [CrossRef]
37. Aggarwal S, Kheirkhah A, Cavalcanti BM, Cruzat A, Jamali A, Hamrah P. Correlation of corneal immune cell changes with clinical severity in dry eye disease: an in vivo confocal microscopy study. Ocular Surface. 2021;19:183–9. doi:10.1016/j.jtos.2020.05.012. [Google Scholar] [CrossRef]
38. Deng X, Tian L, Liu Z, Zhou Y, Jie Y. A deep learning approach for the quantification of lower tear meniscus height. Biomed Signal Process Control. 2021;68:102655. doi:10.1016/j.bspc.2021.102655. [Google Scholar] [CrossRef]
39. Khan ZK, Umar AI, Shirazi SH, Rasheed A, Qadir A, Gul S. Image based analysis of meibomian gland dysfunction using conditional generative adversarial neural network. BMJ Open Ophthalmol. 2021;6(1):e000436. doi:10.1136/bmjophth-2020-000436. [Google Scholar] [CrossRef]
40. da Cruz LB, Souza JC, de Sousa JA, Santos AM, de Paiva AC, de Almeida JDS, et al. Interferometer eye image classification for dry eye categorization using phylogenetic diversity indexes for texture analysis. Comput Methods Programs Biomed. 2020;188:105269. doi:10.1016/j.cmpb.2019.105269. [Google Scholar] [CrossRef]
41. Maruoka S, Tabuchi H, Nagasato D, Masumoto H, Chikama T, Kawai A, et al. Deep neural network-based method for detecting obstructive meibomian gland dysfunction with in vivo laser confocal microscopy. Cornea. 2020;39(6):720–5. doi:10.1097/ico.0000000000002279. [Google Scholar] [CrossRef]
42. Wei S, Ren X, Wang Y, Chou Y, Li X. Therapeutic effect of intense pulsed light (IPL) combined with meibomian gland expression (MGX) on meibomian gland dysfunction (MGD). J Ophthalmol. 2020;2020(1):3684963. doi:10.1155/2020/3684963. [Google Scholar] [CrossRef]
43. Koprowski R, Tian L, Olczyk P. A clinical utility assessment of the automatic measurement method of the quality of Meibomian glands. Biomed Eng Online. 2017;16:1–13. doi:10.1186/s12938-017-0373-4. [Google Scholar] [CrossRef]
44. Peteiro-Barral D, Remeseiro B, Méndez R, Penedo MG. Evaluation of an automatic dry eye test using MCDM methods and rank correlation. Med Biol Eng Comput. 2017;55:527–36. [Google Scholar]
45. Remeseiro B, Barreira N, García-Resúa C, Lira M, Giraldez MJ, Yebra-Pimentel E, et al. iDEAS: a web-based system for dry eye assessment. Comput Methods Program Biomed. 2016;130:186–97. doi:10.1016/j.cmpb.2016.02.015. [Google Scholar] [CrossRef]
46. Koh YW, Celik T, Lee HK, Petznick A, Tong L. Detection of meibomian glands and classification of meibography images. J Biomed Optics. 2012;17(8):086008. doi:10.1117/1.jbo.17.8.086008. [Google Scholar] [CrossRef]
47. González N, Iloro I, Soria J, Duran JA, Santamaría A, Elortza F, et al. Human tear peptide/protein profiling study of ocular surface diseases by SPE-MALDI-TOF mass spectrometry analyses. EuPA Open Proteom. 2014;3:206–15 doi:10.1016/j.euprot.2014.02.016. [Google Scholar] [CrossRef]
48. Grus FH, Augustin AJ. Analysis of tear protein patterns by a neural network as a diagnostical tool for the detection of dry eyes. Electrophor Int J. 1999;20(4–5):875–80. [Google Scholar]
49. Grus F, Augustin A, Evangelou N, Toth-Sagi K. Analysis of tear-protein patterns as a diagnostic tool for the detection of dry eyes. Eur J Ophthalmol. 1998;8(2):90–7 doi:10.1177/112067219800800207. [Google Scholar] [CrossRef]
50. Pereira C, Gonçalves L, Ferreira M. Optic disc detection in color fundus images using ant colony optimization. Med Biol Eng Comput. 2013;51:295–303. doi:10.1007/s11517-012-0994-5. [Google Scholar] [CrossRef]
51. Abdullah AS, Özok YE, Rahebi J. A novel method for retinal optic disc detection using bat meta-heuristic algorithm. Med Biol Eng Comput. 2018;56:2015–24. [Google Scholar]
52. Abed S, Al-Roomi SA, Al-Shayeji M. Effective optic disc detection method based on swarm intelligence techniques and novel pre-processing steps. Appl Soft Comput. 2016;49:146–63. doi:10.1016/j.asoc.2016.08.015. [Google Scholar] [CrossRef]
53. Alshayeji M, Al-Roomi SA, Abed S. Optic disc detection in retinal fundus images using gravitational law-based edge detection. Med Biol Eng Comput. 2017;55:935–48. doi:10.1007/s11517-016-1563-0. [Google Scholar] [CrossRef]
54. Nam SM, Peterson TA, Butte AJ, Seo KY, Han HW. Explanatory model of dry eye disease using health and nutrition examinations: machine learning and network-based factor analysis from a national survey. JMIR Med Inf. 2020;8(2):e16153. [Google Scholar]
55. Yoo TK, Choi JY, Kim HK, Ryu IH, Kim JK. Adopting low-shot deep learning for the detection of conjunctival melanoma using ocular surface images. Comput Methods Programs Biomed. 2021;205:106086. doi:10.1016/j.cmpb.2021.106086. [Google Scholar] [CrossRef]
56. Rajan S, Ponnan S. An efficient enhanced stacked auto encoder assisted optimized deep neural network for forecasting dry eye disease. Sci Rep. 2024;14(1):24945. doi:10.1038/s41598-024-75518-7. [Google Scholar] [CrossRef]
57. Hsiao HK, Liu CC, Yu CY, Kuo SW, Yu SS. A novel optic disc detection scheme on retinal images. Expert Systems Appl. 2012;39(12):10600–6. doi:10.1016/j.eswa.2012.02.157. [Google Scholar] [CrossRef]
58. Pruthi J, Arora S, Khanna K. Metaheuristic techniques for detection of optic disc in retinal fundus images. 3D Res. 2018;9(4):47. doi:10.1007/s13319-018-0198-3. [Google Scholar] [CrossRef]
59. Muthukannan P, Glaret subin P, Optimized convolution neural network based multiple eye disease detection. Comput Biol Med. 2022;146:105648. doi:10.1016/j.compbiomed.2022.105648. [Google Scholar] [CrossRef]
60. Ran J, Niu K, He Z, Zhang H, Song H. Cataract detection and grading based on combination of deep convolutional neural network and random forests. In: 2018 International Conference on Network Infrastructure and Digital Content (IC-NIDC). Piscataway, NJ, USA: IEEE; 2018. p. 155–9. [Google Scholar]
61. Prasad DK, Vibha L, Venugopal K. Machine learning based early detection of age-related macular degeneration: early warning system. In: 2018 Fourteenth International Conference on Information Processing (ICINPRO). Piscataway, NJ, USA: IEEE; 2018. p. 1–6. [Google Scholar]
62. Sisodia DS, Nair S, Khobragade P. Diabetic retinal fundus images: preprocessing and feature extraction for early detection of diabetic retinopathy. Biomed Pharmacol J. 2017;10(2):615–26. [Google Scholar]
63. Parashar D, Agrawal D. 2-D compact variational mode decomposition-based automatic classification of glaucoma stages from fundus images. IEEE Trans Instr Meas. 2021;70:1–10. doi:10.1109/tim.2021.3071223. [Google Scholar] [CrossRef]
64. Qureshi I, Ma J, Abbas Q. Diabetic retinopathy detection and stage classification in eye fundus images using active deep learning. Multimed Tools Appl. 2021;80(8):11691–721. doi:10.1007/s11042-020-10238-4. [Google Scholar] [CrossRef]
65. Tayal A, Gupta J, Solanki A, Bisht K, Nayyar A, Masud M. DL-CNN-based approach with image processing techniques for diagnosis of retinal diseases. Multimed Syst. 2022;28(4):1417–38. doi:10.1007/s00530-021-00769-7. [Google Scholar] [CrossRef]
66. Wolpert DH, Macready WG. No free lunch theorems for optimization. IEEE Trans Evol Comput. 1997;1(1):67–82. doi:10.1109/4235.585893. [Google Scholar] [CrossRef]
67. Lindtner T, Uzan AY, Eder M, Bar-On B, Elbaum R. Repetitive hygroscopic snapping movements in awns of wild oats. Acta Biomaterialia. 2021;135:483–92. doi:10.1016/j.actbio.2021.08.048. [Google Scholar] [CrossRef]
68. Kennedy J, Eberhart R. Particle swarm optimization. In: Proceedings of ICNN’9—International Conference on Neural Networks. Vol. 4. Piscataway, NJ, USA: IEEE; 1995. p. 1942–8. [Google Scholar]
69. Kennedy J. Swarm intelligence. In: Handbook of nature-inspired and innovative computing: integrating classical models with emerging technologies. Cham, Switzerland: Springer; 2006. p. 187–219. [Google Scholar]
70. Van den Bergh F. An analysis of particle swarm optimizers [Ph.D. thesis]. Pretoria, South Africa: University of Pretoria; 2007. [Google Scholar]
71. Mahdavi S, Rahnamayan S, Deb K. Opposition based learning: a literature review. Swarm Evol Comput. 2018;39:1–23. doi:10.1016/j.swevo.2017.09.010. [Google Scholar] [CrossRef]
72. Drucker H, Wu D, Vapnik VN. Support vector machines for spam categorization. IEEE Trans Neural Netw. 1999;10(5):1048–54. doi:10.1109/72.788645. [Google Scholar] [CrossRef]
73. Houssein EH, Emam MM, Ali AA, Suganthan PN. Deep and machine learning techniques for medical imaging-based breast cancer: a comprehensive review. Expert Syst Appl. 2021;167:114161. doi:10.1016/j.eswa.2020.114161. [Google Scholar] [CrossRef]
74. Houssein EH, Oliva D, Celik E, Emam MM, Ghoniem RM. Boosted sooty tern optimization algorithm for global optimization and feature selection. Expert Syst Appl. 2023;213:119015. doi:10.1016/j.eswa.2022.119015. [Google Scholar] [CrossRef]
75. Nagra D. Dry eye disease dataset. Kaggle; 2025 [Dataset]. [cited 2025 Aug 11]. Available from: https://www.kaggle.com/datasets/dakshnagra/dry-eye-disease?select=Dry_Eye_Dataset.csv. [Google Scholar]
76. Chu X, Ilyas IF, Krishnan S, Wang J. Data cleaning: overview and emerging challenges. In: Proceedings of the 2016 International Conference on Management of Data; 2016 Jun 26–Jul 1; San Francisco, CA, USA. p. 2201–6. [Google Scholar]
77. Kotsiantis SB, Kanellopoulos D, Pintelas PE. Data preprocessing for supervised leaning. Int J Comput Sci. 2006;1(2):111–7. [Google Scholar]
78. Arcuri A, Fraser G. Parameter tuning or default values? An empirical investigation in search-based software engineering. Empir Softw Eng. 2013;18(3):594–623. doi:10.1007/s10664-013-9249-9. [Google Scholar] [CrossRef]
79. Mack GA, Skillings JH. A Friedman-type rank test for main effects in a two-factor ANOVA. J Am Stat Assoc. 1980;75(372):947–51. doi:10.1080/01621459.1980.10477577. [Google Scholar] [CrossRef]
80. Abd Elaziz ME, Ewees AA, Oliva D, Duan P, Xiong S. A hybrid method of sine cosine algorithm and differential evolution for feature selection. In: International Conference on Neural Information Processing. Cham, Switzerland: Springer; 2017. p. 145–55. [Google Scholar]
81. Sun Y, Huang Q, Liu T, Cheng Y, Li Y. Multi-strategy enhanced Harris Hawks optimization for global optimization and deep learning-based channel estimation problems. Mathematics. 2023;11(2):390. doi:10.3390/math11020390. [Google Scholar] [CrossRef]
82. Rao RV, Patel V. An improved teaching-learning-based optimization algorithm for solving unconstrained optimization problems. Scientia Iranica. 2013;20(3):710–20. doi:10.1016/j.scient.2012.12.005. [Google Scholar] [CrossRef]
83. Yu X, Wu L, Xu C, Hu Y, Ma C. A novel neural network for solving nonsmooth nonconvex optimization problems. IEEE Trans Neural Netw Learn Syst. 2019;31(5):1475–88. doi:10.1109/tnnls.2019.2920408. [Google Scholar] [CrossRef]
84. Tiwari A, Bansal JC, Sharma H. EEFO: enhanced exploitation firefly optimizer for global numerical problems. Expert Syst Appl. 2023;216:120161. [Google Scholar]
85. Zhang H, Wang Z, Liu Y. Manta ray foraging optimization algorithm: an effective bio-inspired optimizer for global optimization. Appl Soft Comput. 2022;114:108190. [Google Scholar]
86. Faramarzi A, Heidarinejad M, Stephens B, Mirjalili S. Equilibrium optimizer: a novel optimization algorithm. Knowl Based Syst. 2020;191:105190. doi:10.1016/j.knosys.2019.105190. [Google Scholar] [CrossRef]
87. Yıldız BS, Pholdee N, Panagant N, Bureerat S, Yildiz AR, Sait SM. A novel chaotic Henry gas solubility optimization algorithm for solving real-world engineering problems. Eng Comput. 2022;38(Suppl 2):871–83. doi:10.1007/s00366-020-01268-5. [Google Scholar] [CrossRef]
88. Mirjalili S, Mirjalili SM, Lewis A. Grey wolf optimizer. Adv Eng Softw. 2014;69:46–61. doi:10.1016/j.advengsoft.2013.12.007. [Google Scholar] [CrossRef]
89. Gharehchopogh FS, Ucan A, Ibrikci T, Arasteh B, Isik G. Slime mould algorithm: a comprehensive survey of its variants and applications. Arch Comput Methods Eng. 2023;30(4):2683–723. doi:10.1007/s11831-023-09883-3. [Google Scholar] [CrossRef]
90. Chitra B, Kumar S. An optimized deep learning model using mutation-based atom search optimization algorithm for cervical cancer detection. Soft Comput. 2021;25(24):15363–76. doi:10.1007/s00500-021-06138-w. [Google Scholar] [CrossRef]
91. Eid HF. Binary whale optimisation: an effective swarm algorithm for feature selection. Int J Metaheuristics. 2018;7(1):67–79. doi:10.1504/ijmheur.2018.10012912. [Google Scholar] [CrossRef]
Cite This Article
 Copyright © 2025 The Author(s). Published by Tech Science Press.
This work is licensed under a Creative Commons Attribution 4.0 International License , which permits unrestricted use, distribution, and reproduction in any medium, provided the original work is properly cited.
 Downloads
 Citation Tools