
 Submit a Paper
 Propose a Special lssue
 Open Access
ARTICLE
Advanced Brain Tumor Segmentation in Magnetic Resonance Imaging via 3D U-Net and Generalized Gaussian Mixture Model-Based Preprocessing
1 Electronics, Photonics and Optronics Laboratory, Department of Electronics, Djillali Liabes University of Sidi Bel Abbes, Sidi Bel Abbes, 22000, Algeria
2 Department of Electrical Engineering, College of Engineering, Princess Nourah Bint Abdulrahman University, P.O. Box 84428, Riyadh, 11671, Saudi Arabia
3 Energy and Environment Laboratory, Department of Mechanical Engineering, Institute of Technology, University Center Salhi Ahmed Naama (Ctr. Univ. Naama), P.O. Box 66, Naama, 45000, Algeria
4 College of Technical Engineering, National University of Science and Technology, Dhi Qar, 64001, Iraq
5 Mining Research Center, Northern Border University, P.O. Box 1321, Arar, 91431, Saudi Arabia
6 Department of Mechanical Engineering, College of Engineering, University of Ha’il, Ha’il City, 81451, Saudi Arabia
7 Department of Electrical Engineering, College of Engineering, University of Ha’il, Ha’il City, 81451, Saudi Arabia
* Corresponding Authors: Younes Menni. Email: ; Lioua Kolsi. Email:
(This article belongs to the Special Issue: Advanced Computational Intelligence Techniques, Uncertain Knowledge Processing and Multi-Attribute Group Decision-Making Methods Applied in Modeling of Medical Diagnosis and Prognosis)
Computer Modeling in Engineering & Sciences 2025, 144(2), 2419-2443. https://doi.org/10.32604/cmes.2025.069396
Received 22 June 2025; Accepted 08 August 2025; Issue published 31 August 2025
 View Full Text
 Download PDF
Abstract
Brain tumor segmentation from Magnetic Resonance Imaging (MRI) supports neurologists and radiologists in analyzing tumors and developing personalized treatment plans, making it a crucial yet challenging task. Supervised models such as 3D U-Net perform well in this domain, but their accuracy significantly improves with appropriate preprocessing. This paper demonstrates the effectiveness of preprocessing in brain tumor segmentation by applying a pre-segmentation step based on the Generalized Gaussian Mixture Model (GGMM) to T1 contrast-enhanced MRI scans from the BraTS 2020 dataset. The Expectation-Maximization (EM) algorithm is employed to estimate parameters for four tissue classes, generating a new pre-segmented channel that enhances the training and performance of the 3D U-Net model. The proposed GGMM + 3D U-Net framework achieved a Dice coefficient of 0.88 for whole tumor segmentation, outperforming both the standard multiscale 3D U-Net (0.84) and MM U-Net (0.85). It also delivered higher Intersection over Union (IoU) scores compared to models trained without preprocessing or with simpler GMM-based segmentation. These results, supported by qualitative visualizations, suggest that GGMM-based preprocessing should be integrated into brain tumor segmentation pipelines to optimize performance.Keywords
Clinical segmentation of brain tumors is essential, as it enables accurate identification and assessment of tumors, which in turn supports the development of effective treatment plans [1]. Magnetic Resonance Imaging (MRI)-based segmentation allows radiologists and neurologists to precisely determine the tumor’s location, geometry, and volume, distinguishing tumor regions from healthy brain tissue. This data is vital for surgical planning, setting parameters for radiation therapy, and evaluating the progression of treatment over time [2].
Recent advances in medical imaging and deep learning have significantly improved brain tumor segmentation. Traditional approaches relied on automated [3], semi-automated, and manual methods [4], which were often time-consuming and subject to inter-observer variability. Earlier machine learning techniques, such as support vector machines (SVMs) [5,6] and random forests [7,8], performed segmentation tasks automatically but depended on hand-engineered features, which limited their performance and scalability.
The emergence of convolutional neural networks (CNNs) and architectures such as U-Net [9] has transformed the field. These models learn spatial features directly from data in an end-to-end manner, leading to substantial improvements in segmentation accuracy. As a result, tumor detection has become more consistent, efficient, and reliable, facilitating timely clinical decision-making and enabling real-time applications in clinical settings [10].
U-Net has shown significant benefits across various medical image segmentation tasks, including breast cancer detection [11], and has proven particularly effective in brain tumor segmentation using MRI. Numerous modifications and enhancements to the U-Net architecture have been proposed to improve segmentation accuracy and efficiency [9,12]. Key strategies include integrating edge information, optimizing model parameters, and applying advanced normalization techniques. In this paper, we emphasize the importance of data pre-processing by introducing a novel pre-segmented channel prior to employing the robust U-Net architecture on the BraTS-2020 dataset. We demonstrate that this approach can enhance performance across both established and emerging techniques. Specifically, our method incorporates the Generalized Gaussian Mixture Model (GGMM) applied to contrast-enhanced MRI, enabling more accurate delineation of necrotic and non-enhancing tumor cores, with particular attention to peritumoral edema. For comparative evaluation, we also applied the standard GMM and assessed segmentation performance with and without the pre-segmented channel. Unlike the standard GMM, the GGMM offers greater flexibility in modeling the heavy-tailed or peaked intensity distributions commonly observed in brain tumor MRIs, thereby improving its capability to differentiate complex tissue regions.
While previous studies have primarily focused on architectural enhancements to U-Net, input-level preprocessing strategies that transform the data prior to learning remain largely underexplored. This work addresses that gap by investigating statistical mixture modeling (GGMM) as a preprocessing technique to enhance input representation before training. To the best of our knowledge, this approach has not been thoroughly examined in the context of brain tumor segmentation.
Furthermore, to ensure a fair comparison, we evaluated the performance of three configurations: the baseline U-Net, the U-Net with a GMM-preprocessed T1CE channel (GMM + U-Net), and the U-Net with a GGMM-preprocessed T1CE channel (GGMM + U-Net). Our results provide strong evidence that the GGMM + U-Net configuration outperforms the others, particularly in accurately identifying necrotic and non-enhancing tumor cores as well as peritumoral edema.
This study offers three key contributions:
(i) To the best of our knowledge, it is the first to integrate a GGMM as a preprocessing step with a 3D U-Net architecture for brain tumor segmentation. This novel approach enhances tumor differentiation by effectively modeling the non-Gaussian intensity distributions commonly observed in MRI data.
(ii) We systematically assess the impact of GGMM preprocessing on segmentation performance by comparing it with conventional GMM-based preprocessing and the baseline U-Net.
(iii) Our experiments demonstrate that the GGMM + U-Net configuration achieves superior accuracy, particularly in delineating necrotic and non-enhancing tumor cores, thereby confirming the value of statistical modeling in deep learning-based medical image segmentation.
The remainder of this paper is organized as follows: Section Related Works reviews related work; Section 2 introduces the theoretical background of GMM and GGMM along with the preprocessing steps; Section 3 details the proposed method and training setup; Section 4 presents the results and discussion; and Section 5 concludes the study and outlines future research directions.
Recent advances in brain tumor segmentation have focused on enhancing model performance, improving computational efficiency, and integrating clinical knowledge to support diagnosis. Initial efforts in this direction employed 3D CNNs to address challenges such as data imbalance and memory constraints. Ballestar and Vilaplana [13] proposed a 3D U-Net-based approach that incorporates uncertainty estimation techniques to improve segmentation accuracy. Their method leveraged both epistemic and aleatoric uncertainties and utilized ensemble learning, contributing to the BraTS 2020 challenge with increased prediction confidence. Islam et al. [14] further advanced segmentation architectures by extending the U-Net model with channel and spatial attention mechanisms. Their work emphasized dual attention to enhance segmentation accuracy and survival prediction for glioma patients in the BraTS 2019 dataset.
Li and Li [15] proposed Dilated Convolution-Dense Block-Transformation Convolution-Unet, a novel segmentation model that integrates dilated convolutions, dense residual blocks, and the U-Net architecture. Their study demonstrated the effective use of multimodal MRI data from the BraTS-2018 and BraTS-2019 datasets, highlighting improvements in the extraction of critical features for segmentation. Similarly, Zhao et al. [16] proposed MM-UNet, a multimodal fusion network that integrates multi-modal MRI data to enhance segmentation performance, achieving superior results on the BraTS-2020 dataset. Ha et al. [17] presented a segmentation system based on the U-Net++ architecture, tailored for radiosurgery planning. By leveraging the BraTS-2020 dataset, their approach offered a clinically oriented solution that addressed the challenges posed by heterogeneous datasets and region-specific medical requirements.
Collectively, these and other studies underscore the strength of U-Net-based architectures in brain tumor segmentation. Their widespread adoption and consistent success, particularly as core components of top-performing solutions in the Medical Image Computing and Computer Assisted Intervention BraTS challenges, demonstrate U-Net’s remarkable ability to capture and integrate spatial features essential for accurate medical image analysis. Inspired by this success, the present study investigates whether U-Net’s performance can be further improved through informed data preprocessing. Specifically, we explore the potential advantages of incorporating a pre-segmented T1-weighted contrast-enhanced (T1CE) modality into the input pipeline. Given the T1CE sequence’s efficacy in delineating contrast-enhancing tumor regions, we hypothesize that its targeted inclusion as a prior can guide the learning process, enhance convergence during training, and ultimately yield more accurate and robust segmentation outcomes. Through this approach, we aim not only to improve U-Net’s segmentation accuracy but also to assess the broader impact of modality-specific priors in complex multimodal segmentation tasks.
2 Pre-Segmentation Using GMM and GGMM
2.1 Gaussian Mixture Model (GMM)
A GMM is a statistical model that represents a population as a weighted sum of two or more Gaussian distributions, each corresponding to a cluster, class, or subpopulation [18]. GMMs are particularly useful when the underlying data can be divided into subgroups with features that follow a normal distribution. The probability density function (PDF) of GMM for a data point x in a D-dimensional space is given by:
where:
–
–
–
–
–
2.2 Generalized Gaussian Mixture Model (GGMM)
A GGMM is an extension of the standard GMM where the individual components follow Generalized Gaussian Distributions (GGD) instead of only Gaussian distributions [19]. This modification allows GGMM to represent a wider variety of data distributions, especially those exhibiting skewness or heavy tails. Therefore, GGMM has a better ability to handle real-world data of various shapes and nature, which can’t be adequately represented by the Gaussian assumption. The probability density function of GGMM at a data point x is:
where:
–
–
–
The GGD for a component is given by:
where:
–
–
–
2.3 GMM and GGMM for Image Segmentation
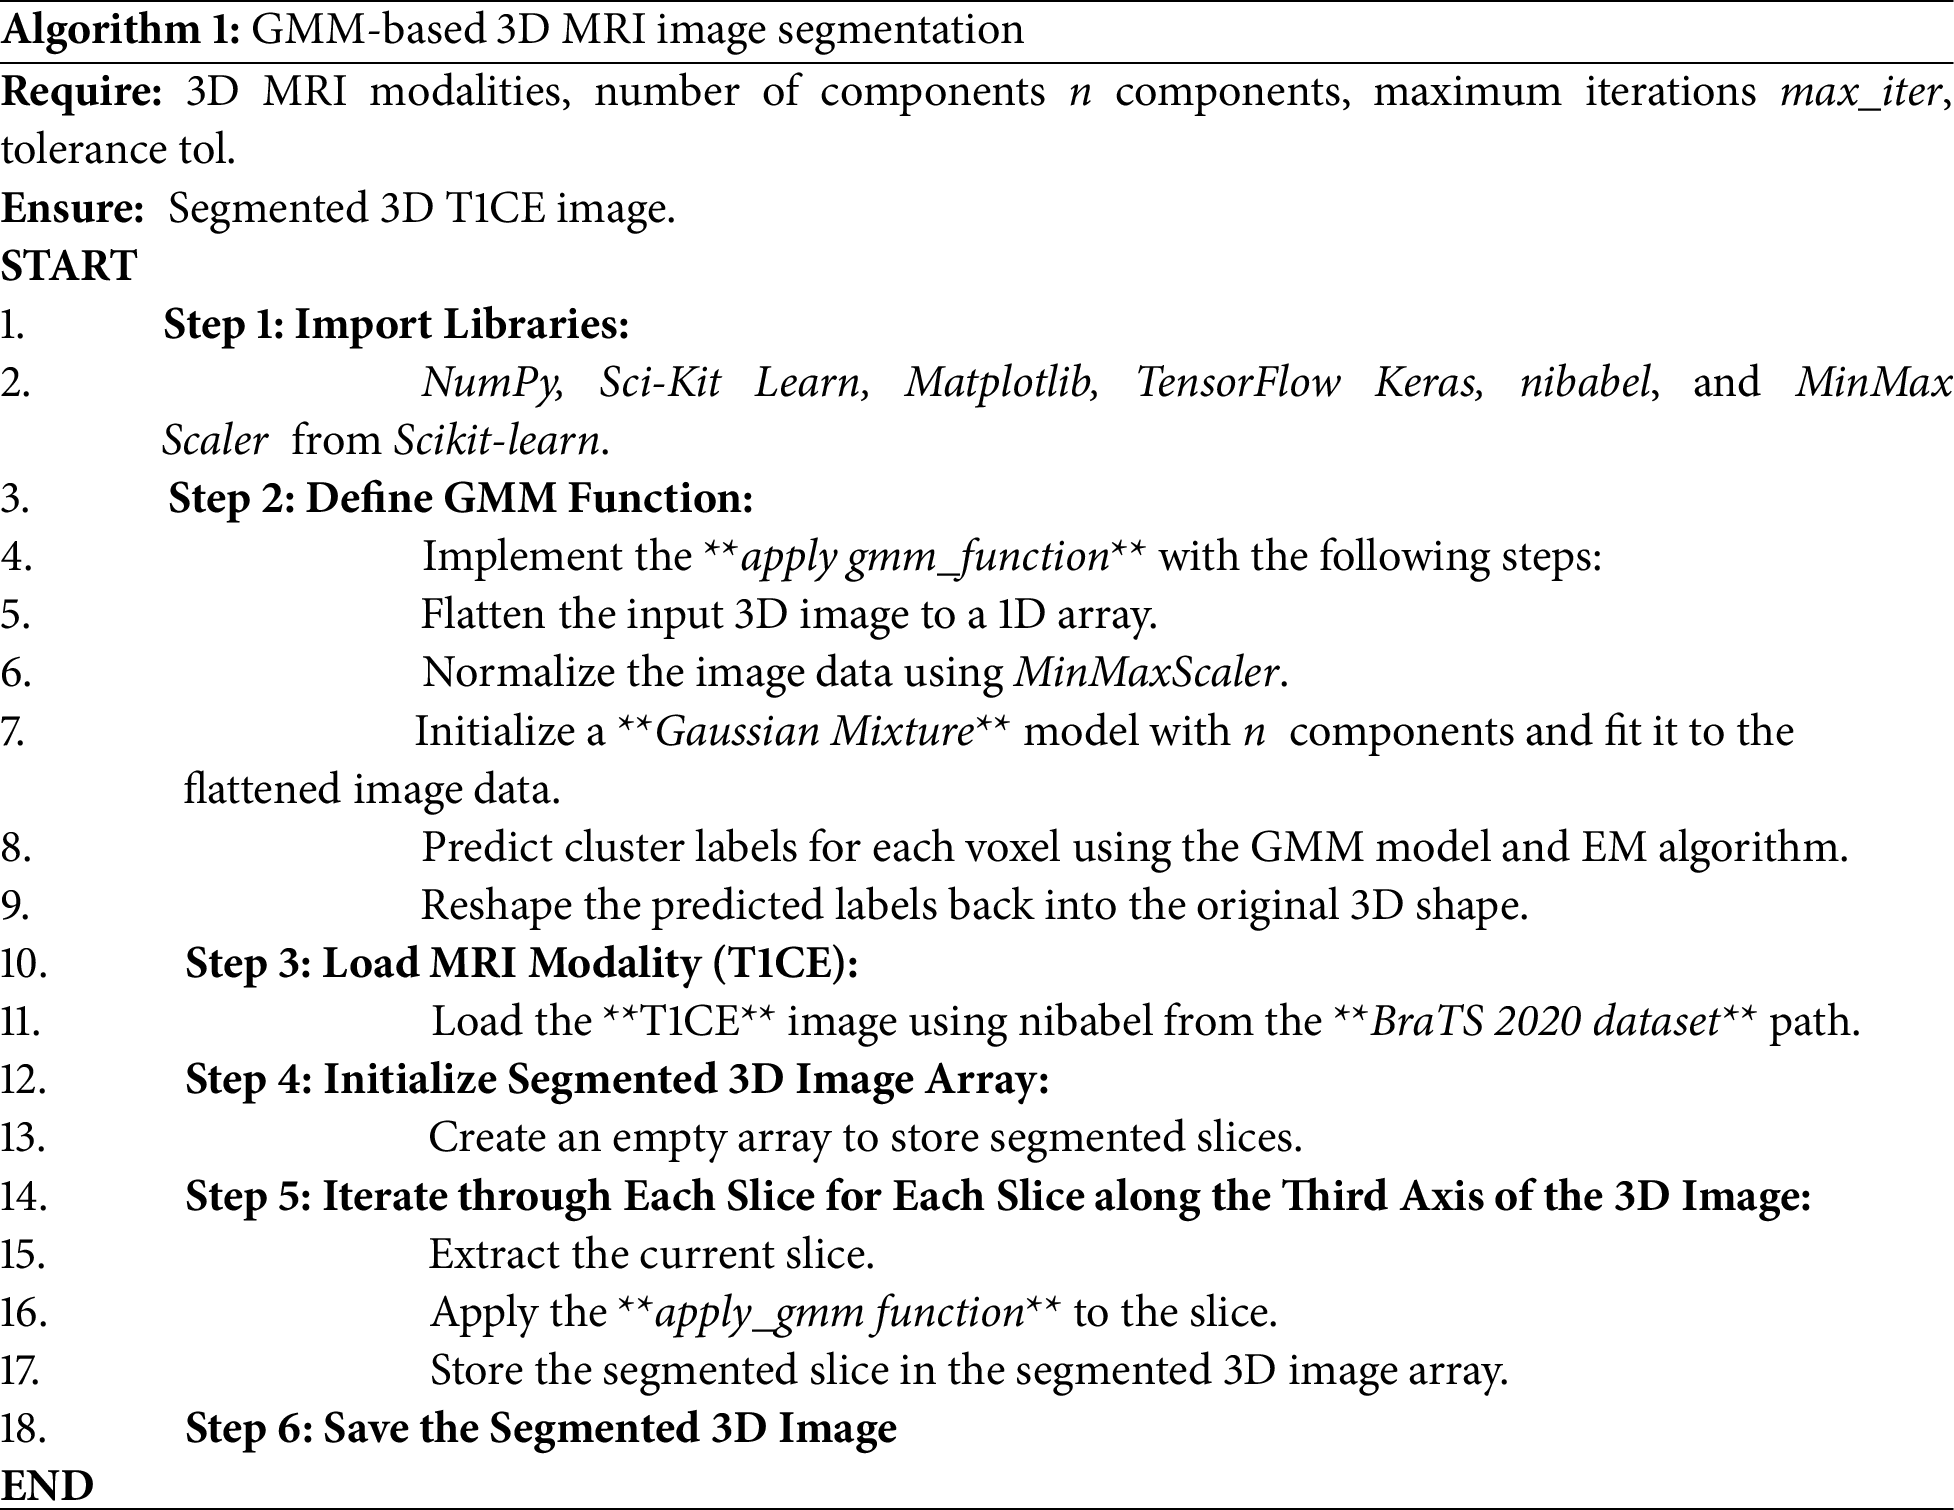
2.3.1 GMM-Based 3D MRI Image Segmentation
The GMM-based segmentation algorithm described below (see Algorithm 1) employs a statistical approach by modeling voxel intensities as a mixture of Gaussian distributions. Each voxel intensity is treated as a data point, which the GMM clusters into different classes (e.g., healthy tissue, tumor regions). The algorithm begins by importing the necessary libraries. The T1CE MRI image is flattened into a one-dimensional array, normalized, and segmented using a GMM with the EM algorithm [20], based on its grayscale histogram. Each voxel is then assigned a cluster label according to the class Gaussian whose mean is closest to its intensity, and these labels are reshaped back into the original three-dimensional structure. The result is a segmented 3D image that highlights regions of interest. This approach is computationally efficient, making it well-suited for scenarios where segmentation speed is critical.
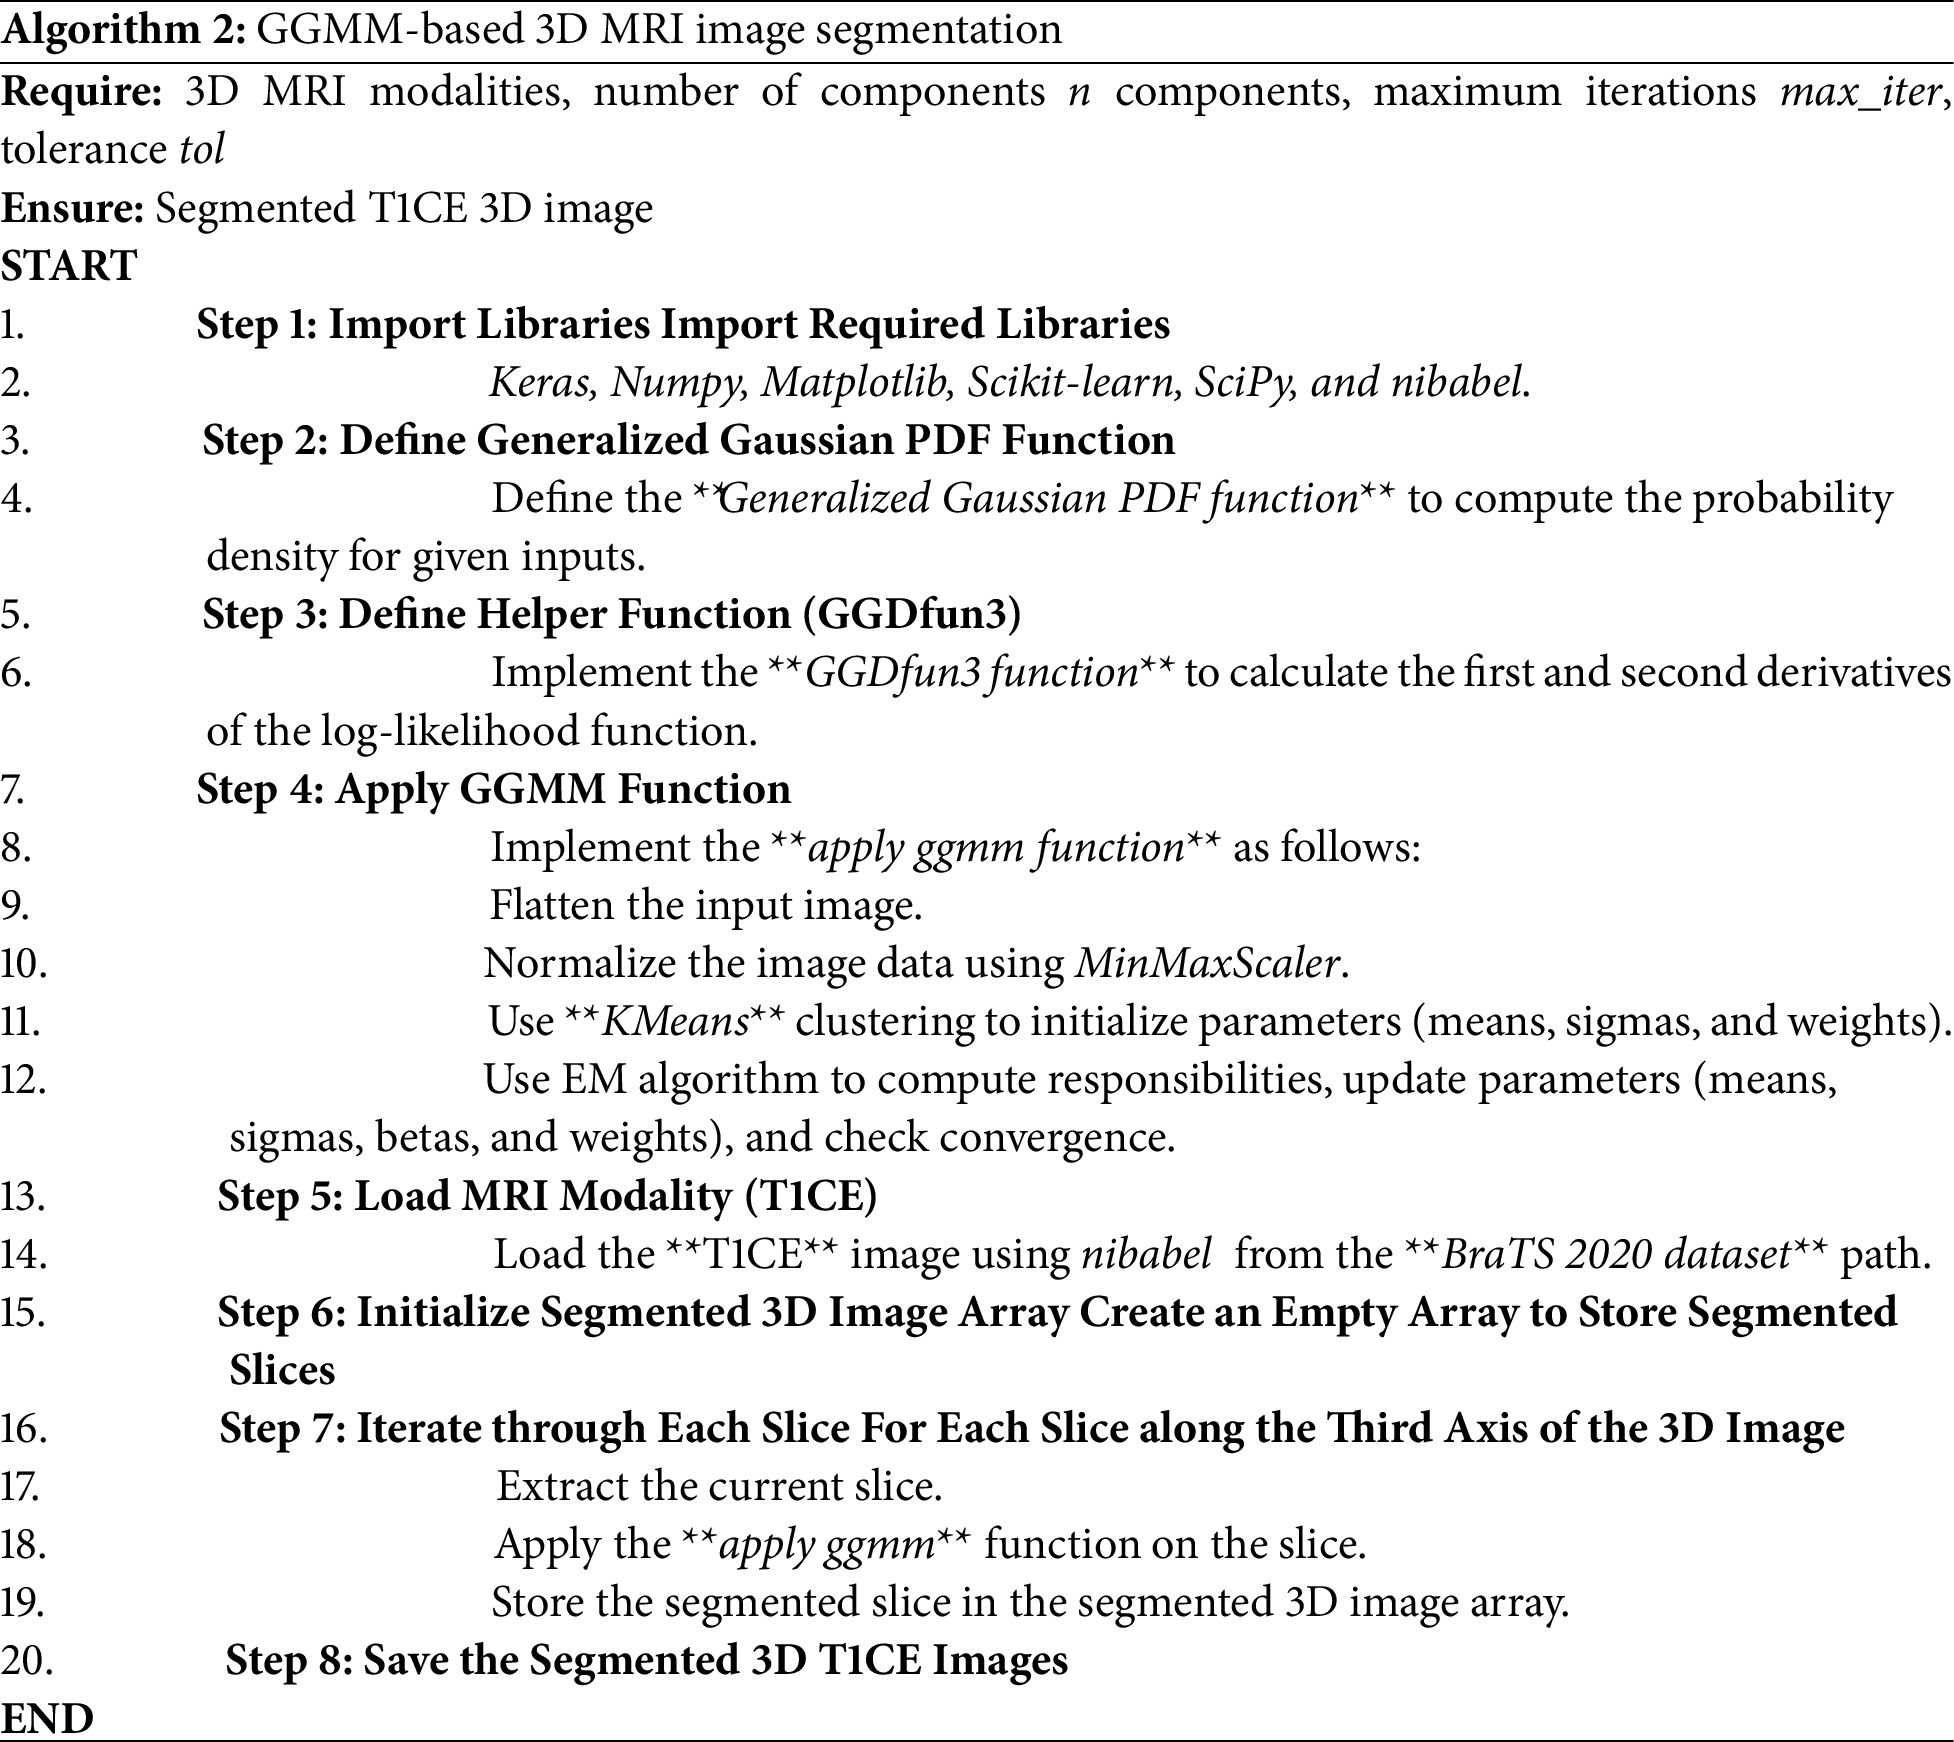
2.3.2 GGMM-Based 3D MRI Image Segmentation
The GGMM-based segmentation algorithm introduced herein (see Algorithm 2) enhances the GMM model by offering greater flexibility in modeling voxel intensity distributions. It employs the Generalized Gaussian PDF, incorporating parameters such as shape and tail thickness, which enable it to better fit subtle variations in the data. The GGMM uses K-Means clustering to initialize the model’s parameters (means, sigmas, and weights), while the shape parameter β is initially set to 2 for each component, assuming a Gaussian starting point. It is then iteratively updated using a second-order gradient-based method derived from the log-likelihood function’s derivatives. Subsequently, the EM algorithm [21] is employed to iteratively update all four parameter sets, means, sigmas, shape parameters, and weights, refining the segmentation with each iteration. The algorithm also utilizes a helper function [22] to compute the first and second derivatives of the log-likelihood function, facilitating improved convergence. This enhanced model captures subtle variations in MRI data, which can be critical for distinguishing between tumor sub-regions.
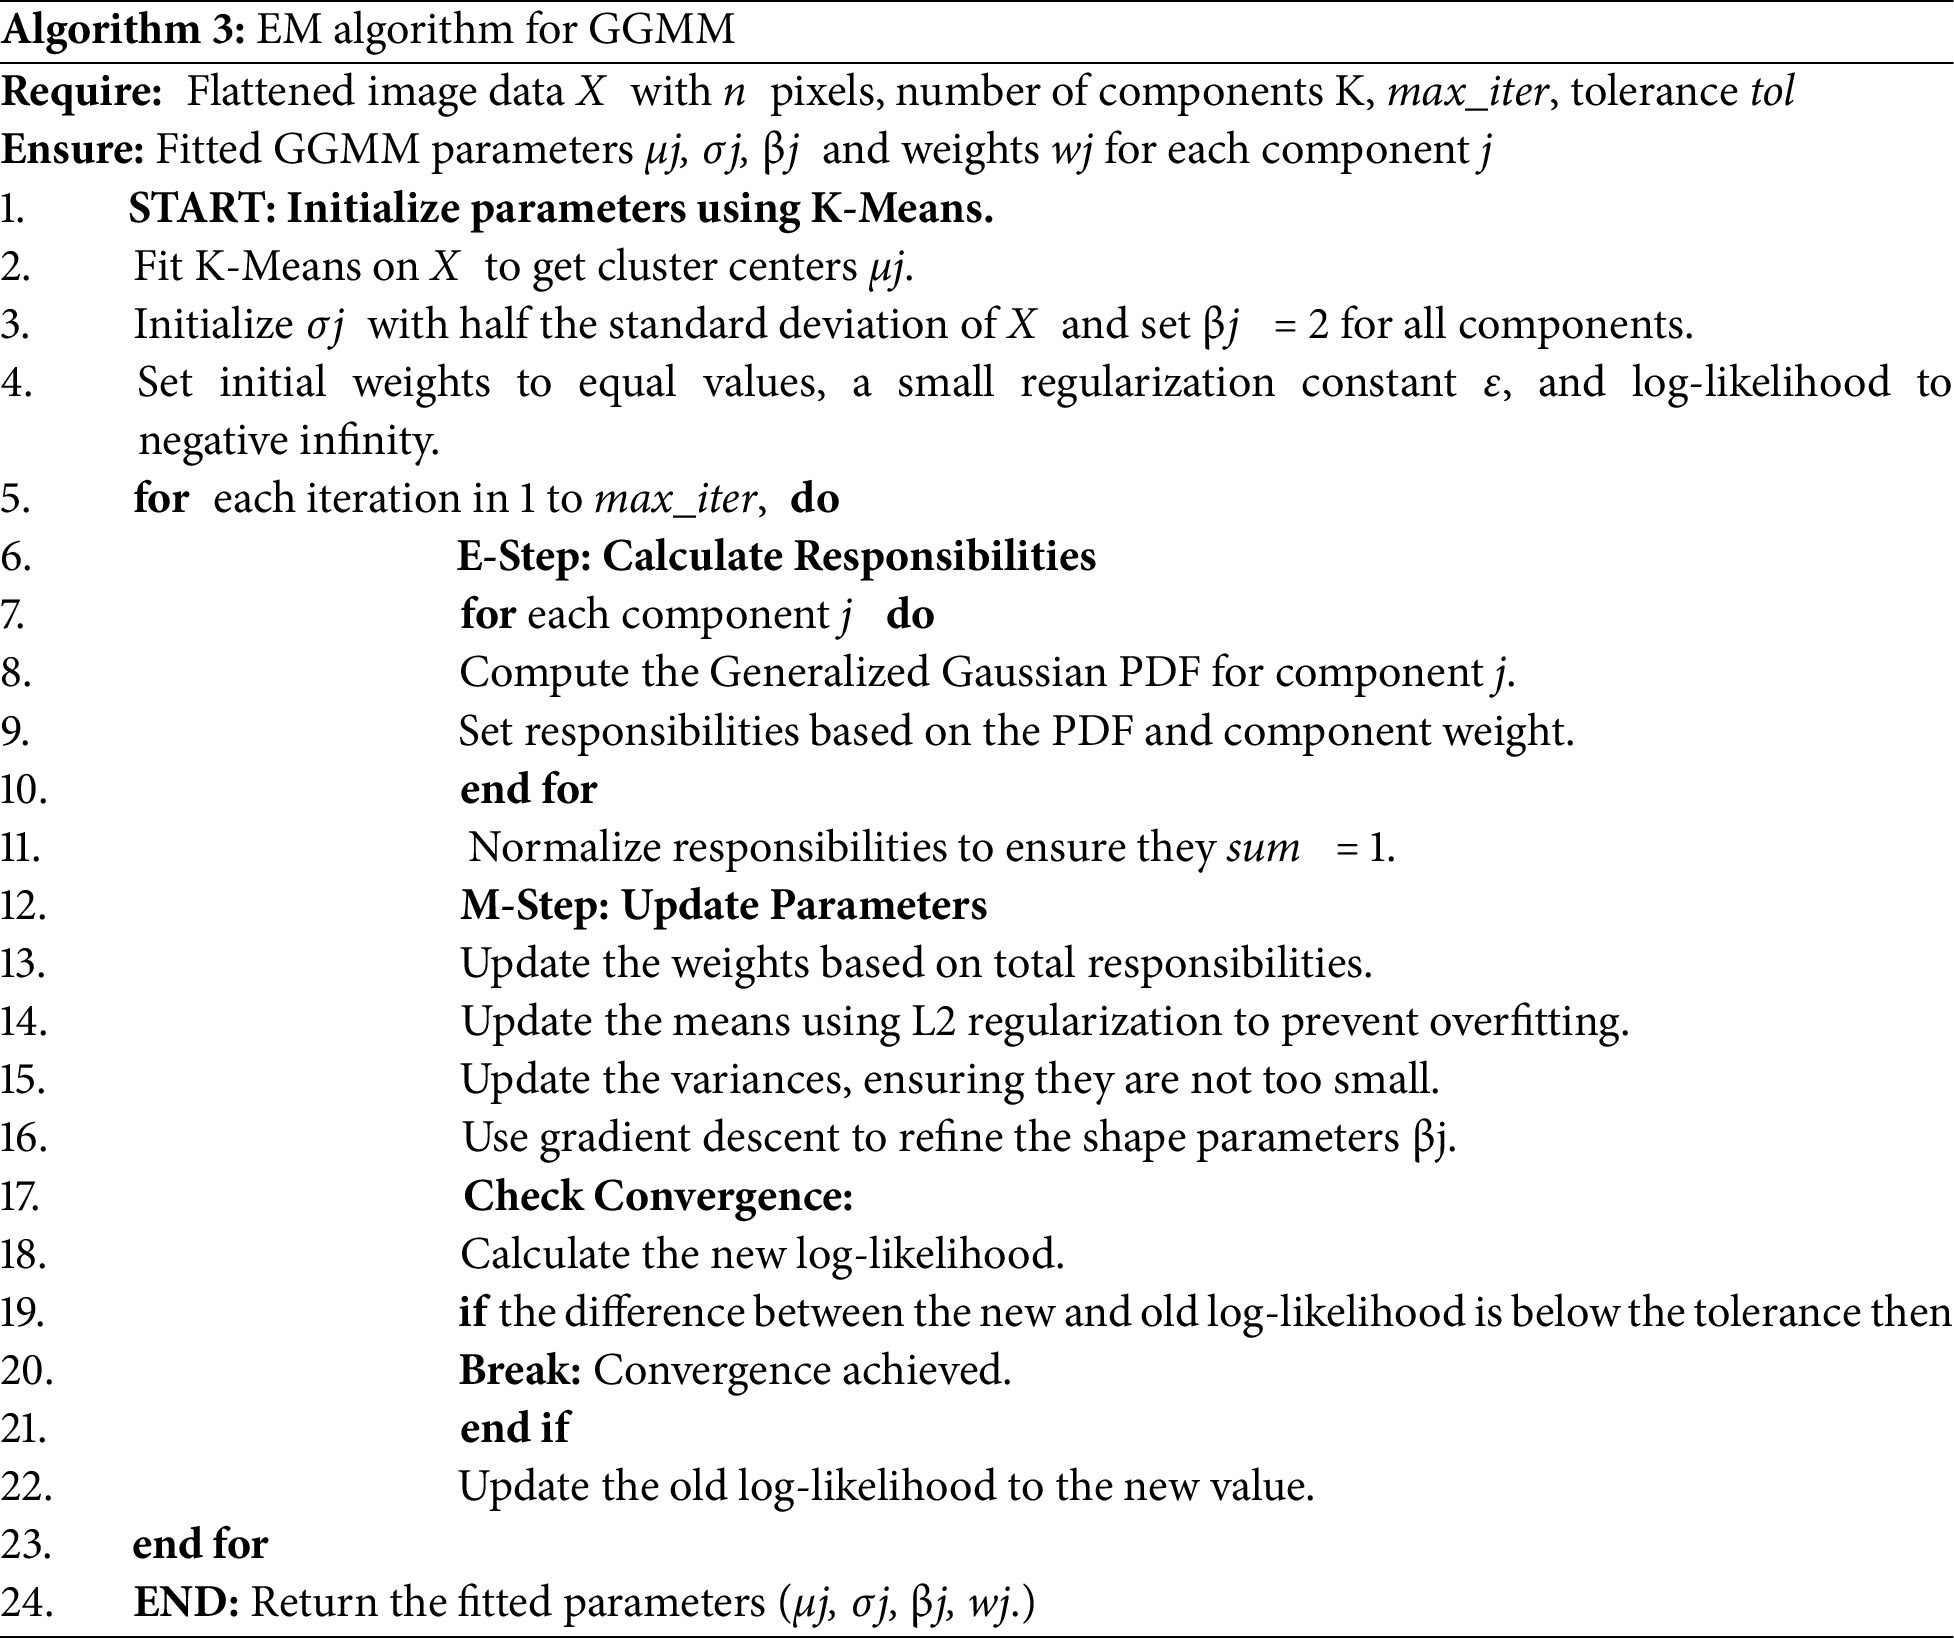
Expectation-Maximization (EM) for GGMM fits several Gaussian-like curves to complex data [23], such as medical image pixel intensities [20,24], where regular Gaussian distributions might not be accurate. As described in Algorithm 3, we start by initializing component means using K-Means clustering, followed by initializing variances, shape parameters (β), and equal weights for all components. E-step calculates Generalized Gaussian PDF for all components and normalizes to one in each iteration to calculate responsibility for each data point. During the M-step, weights are calculated from the overall responsibilities, and means are recalculated with L2 regularization applied to the mean and variance updates to prevent overfitting and avoid division by zero. A regularization weight of λ = 0.01 is used to stabilize training, and variances are updated to ensure numerical stability. The β shape parameter is adjusted using gradient descent and the gradients of an auxiliary function. Log-likelihood is tracked at each iteration to monitor convergence and the process stops when the change falls below a predefined threshold. The EM algorithm runs for a maximum of 10 iterations or until the difference in log-likelihood between successive iterations is less than 10−4. This iterative process enables the GGMM to effectively fit complex, non-Gaussian data distributions.
2.3.4 Pre-Processing Segmentation Results
Fig. 1 shows the results of pre-processing (or pre-segmentation) for four randomly selected slices. The top row presents T1-weighted contrast-enhanced (T1CE) MRI images, which clearly distinguish the tumor from the surrounding tissue, demonstrating their effectiveness in delineating tumor boundaries and filled regions. The second row displays the segmentation results using the GMM, which attempts to differentiate tissue regions based on intensity but may struggle with complex contrast variations, leading to potential misclassifications. The third row demonstrates the use of the GGMM, which is an improvement over these boundaries because it enables a more diverse set of intensity distributions, enhancing identification of tumor areas such as the necrotic core, edema, and tumor-enhancing areas. The fourth row depicts the ground truth segmentation mask, a regular image that delineates the specific region of interest (e.g., necrotic core, edema, and enhancing tumor) in different colors, for reference to look at details presented by GGMM pre-segmented T1CE and how useful it is to utilize as model training input.
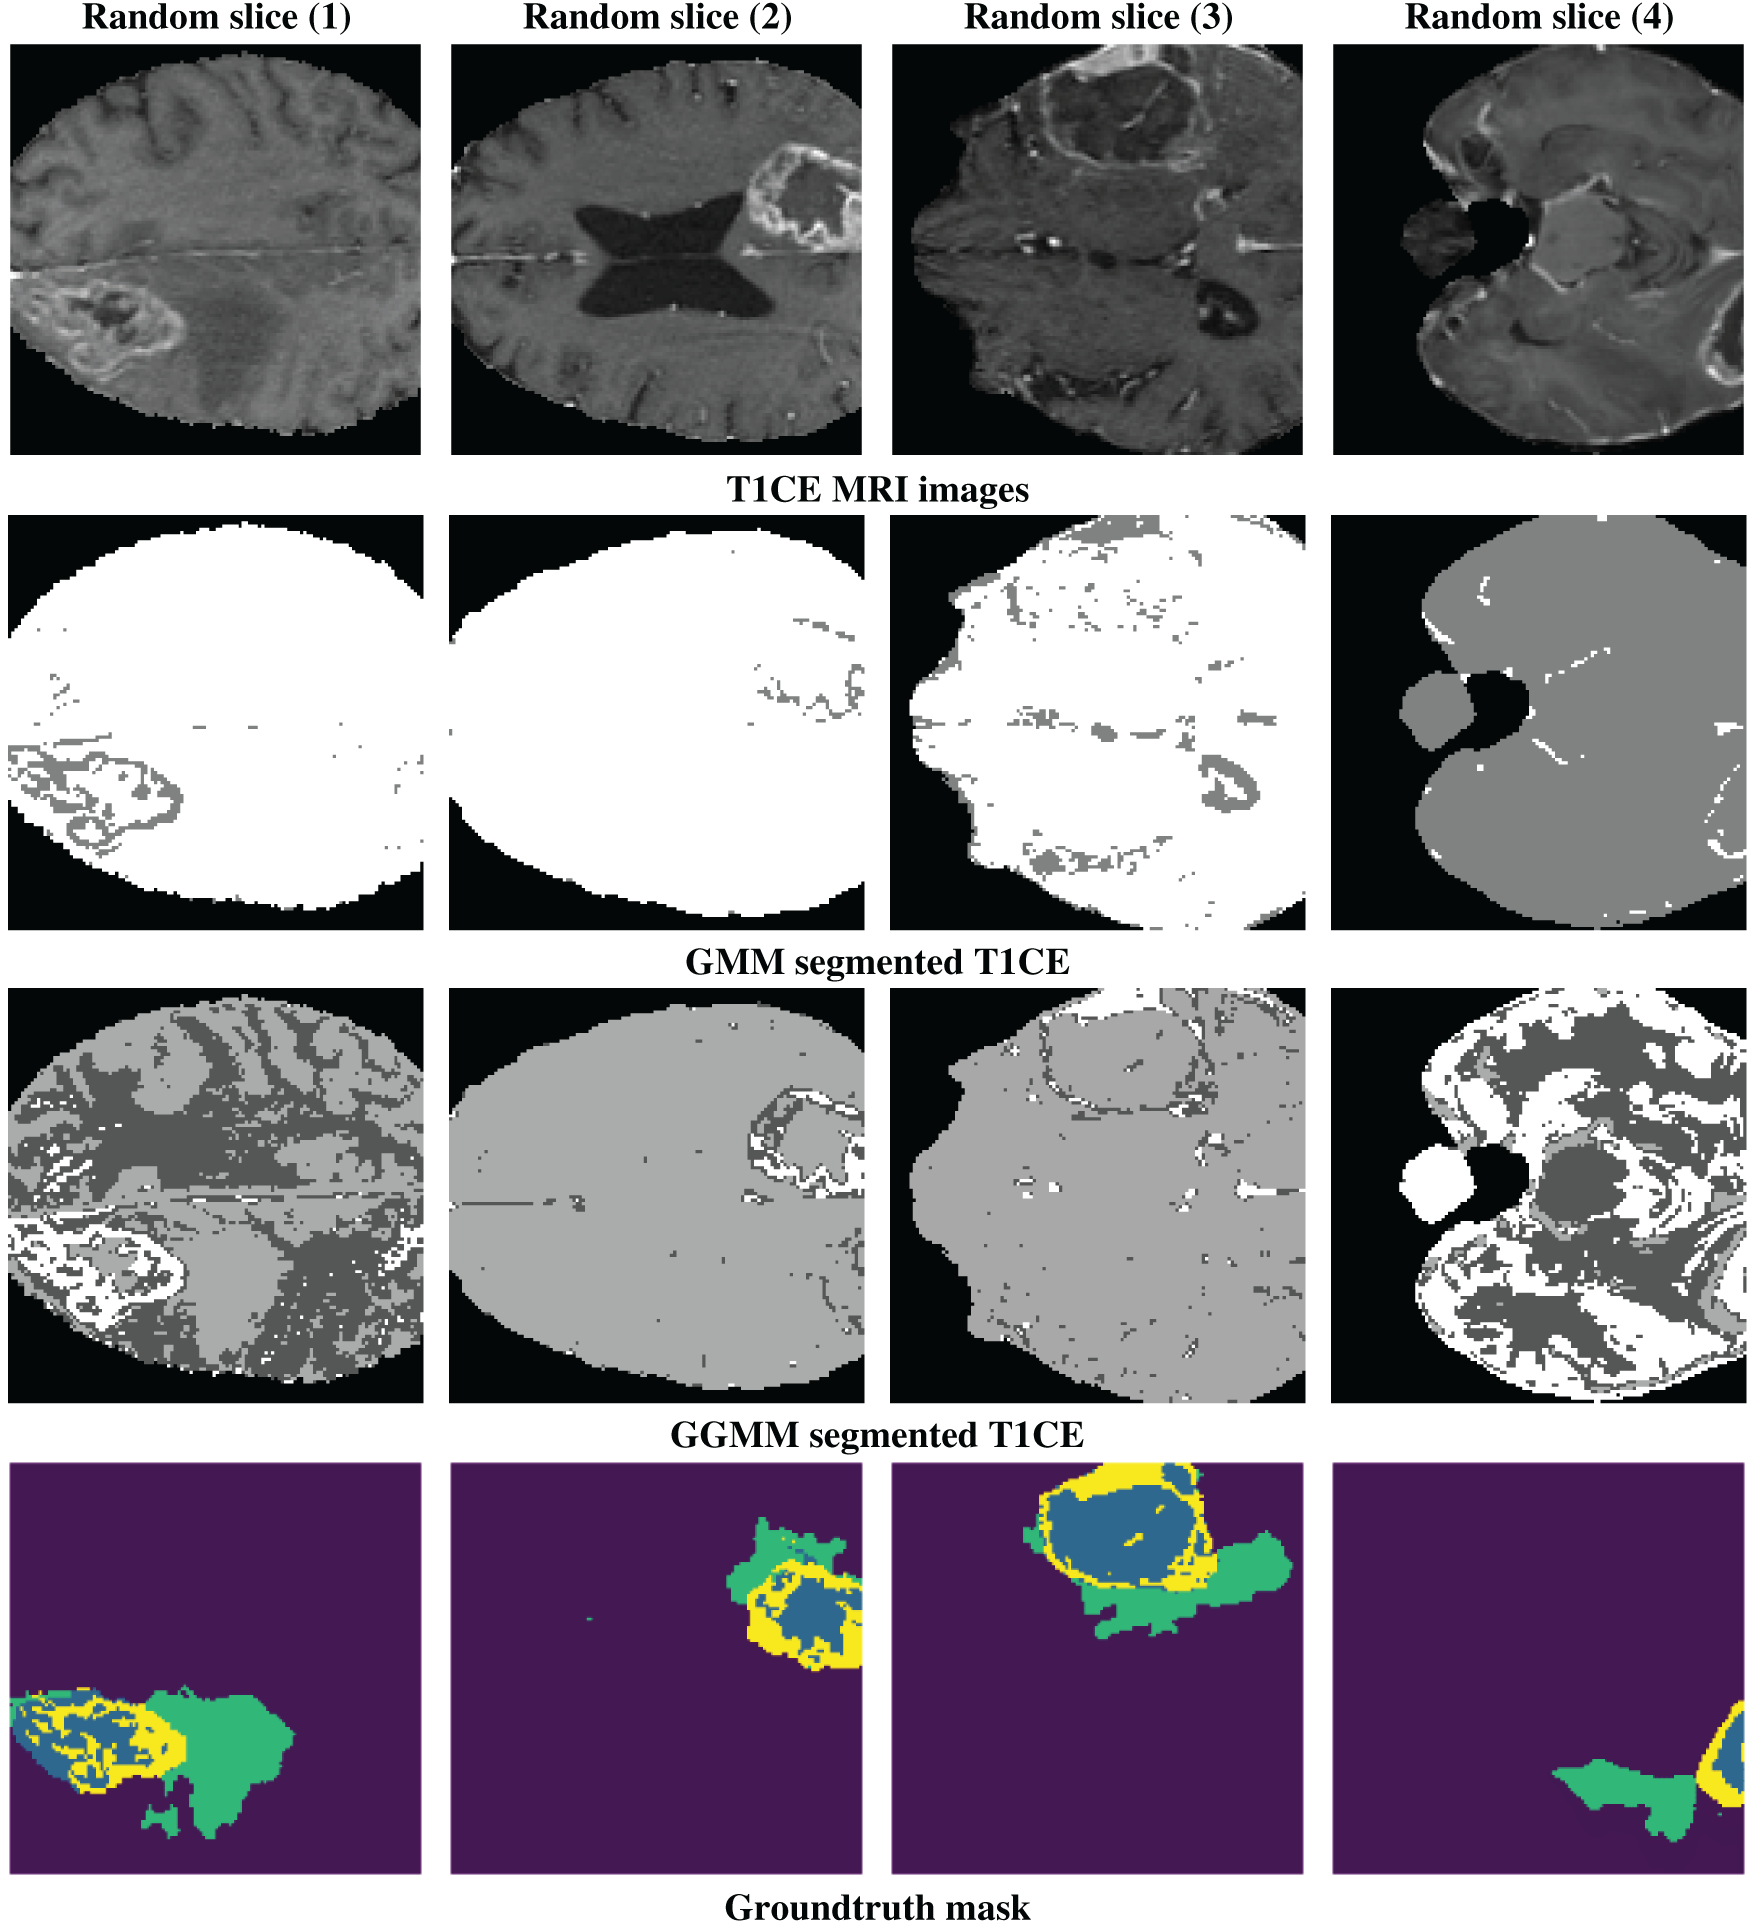
Figure 1: Example of a random slice: 1st line shows the T1CE modality, 2nd line shows the GMM-segmented T1CE, 3rd line shows the GGMM-segmented T1CE, and the 4th line shows the ground truth mask of the tumor regions
3 Segmentation Framework Using 3D U-Net
We used the BraTS-2020 dataset [25–27] for our segmentation approach and model training. Its standardized structure and high-quality annotations make it well-suited for developing and validating segmentation models. As highlighted in [28], benchmark datasets like BraTS provide a necessary foundation for controlled model evaluation before tackling the variability and complexity of real clinical data. The dataset includes four modalities: native T1, contrast-enhanced T1-weighted (T1Gd), T2-weighted (T2), and T2 Fluid-Attenuated Inversion Recovery (T2-FLAIR). Due to hardware limitations, we trained our models using cropped MRIs of size 128 × 128 × 128. For a fair comparison, we trained three models, as detailed in the following sub-sections: U-Net, GMM pre-segmented T1CE channel with U-Net (GMM + U-Net), and GGMM pre-segmented T1CE channel with U-Net (GGMM + U-Net). The GMM and GGMM components were applied during the preprocessing step.
3.1 Data Preparation and Preprocessing
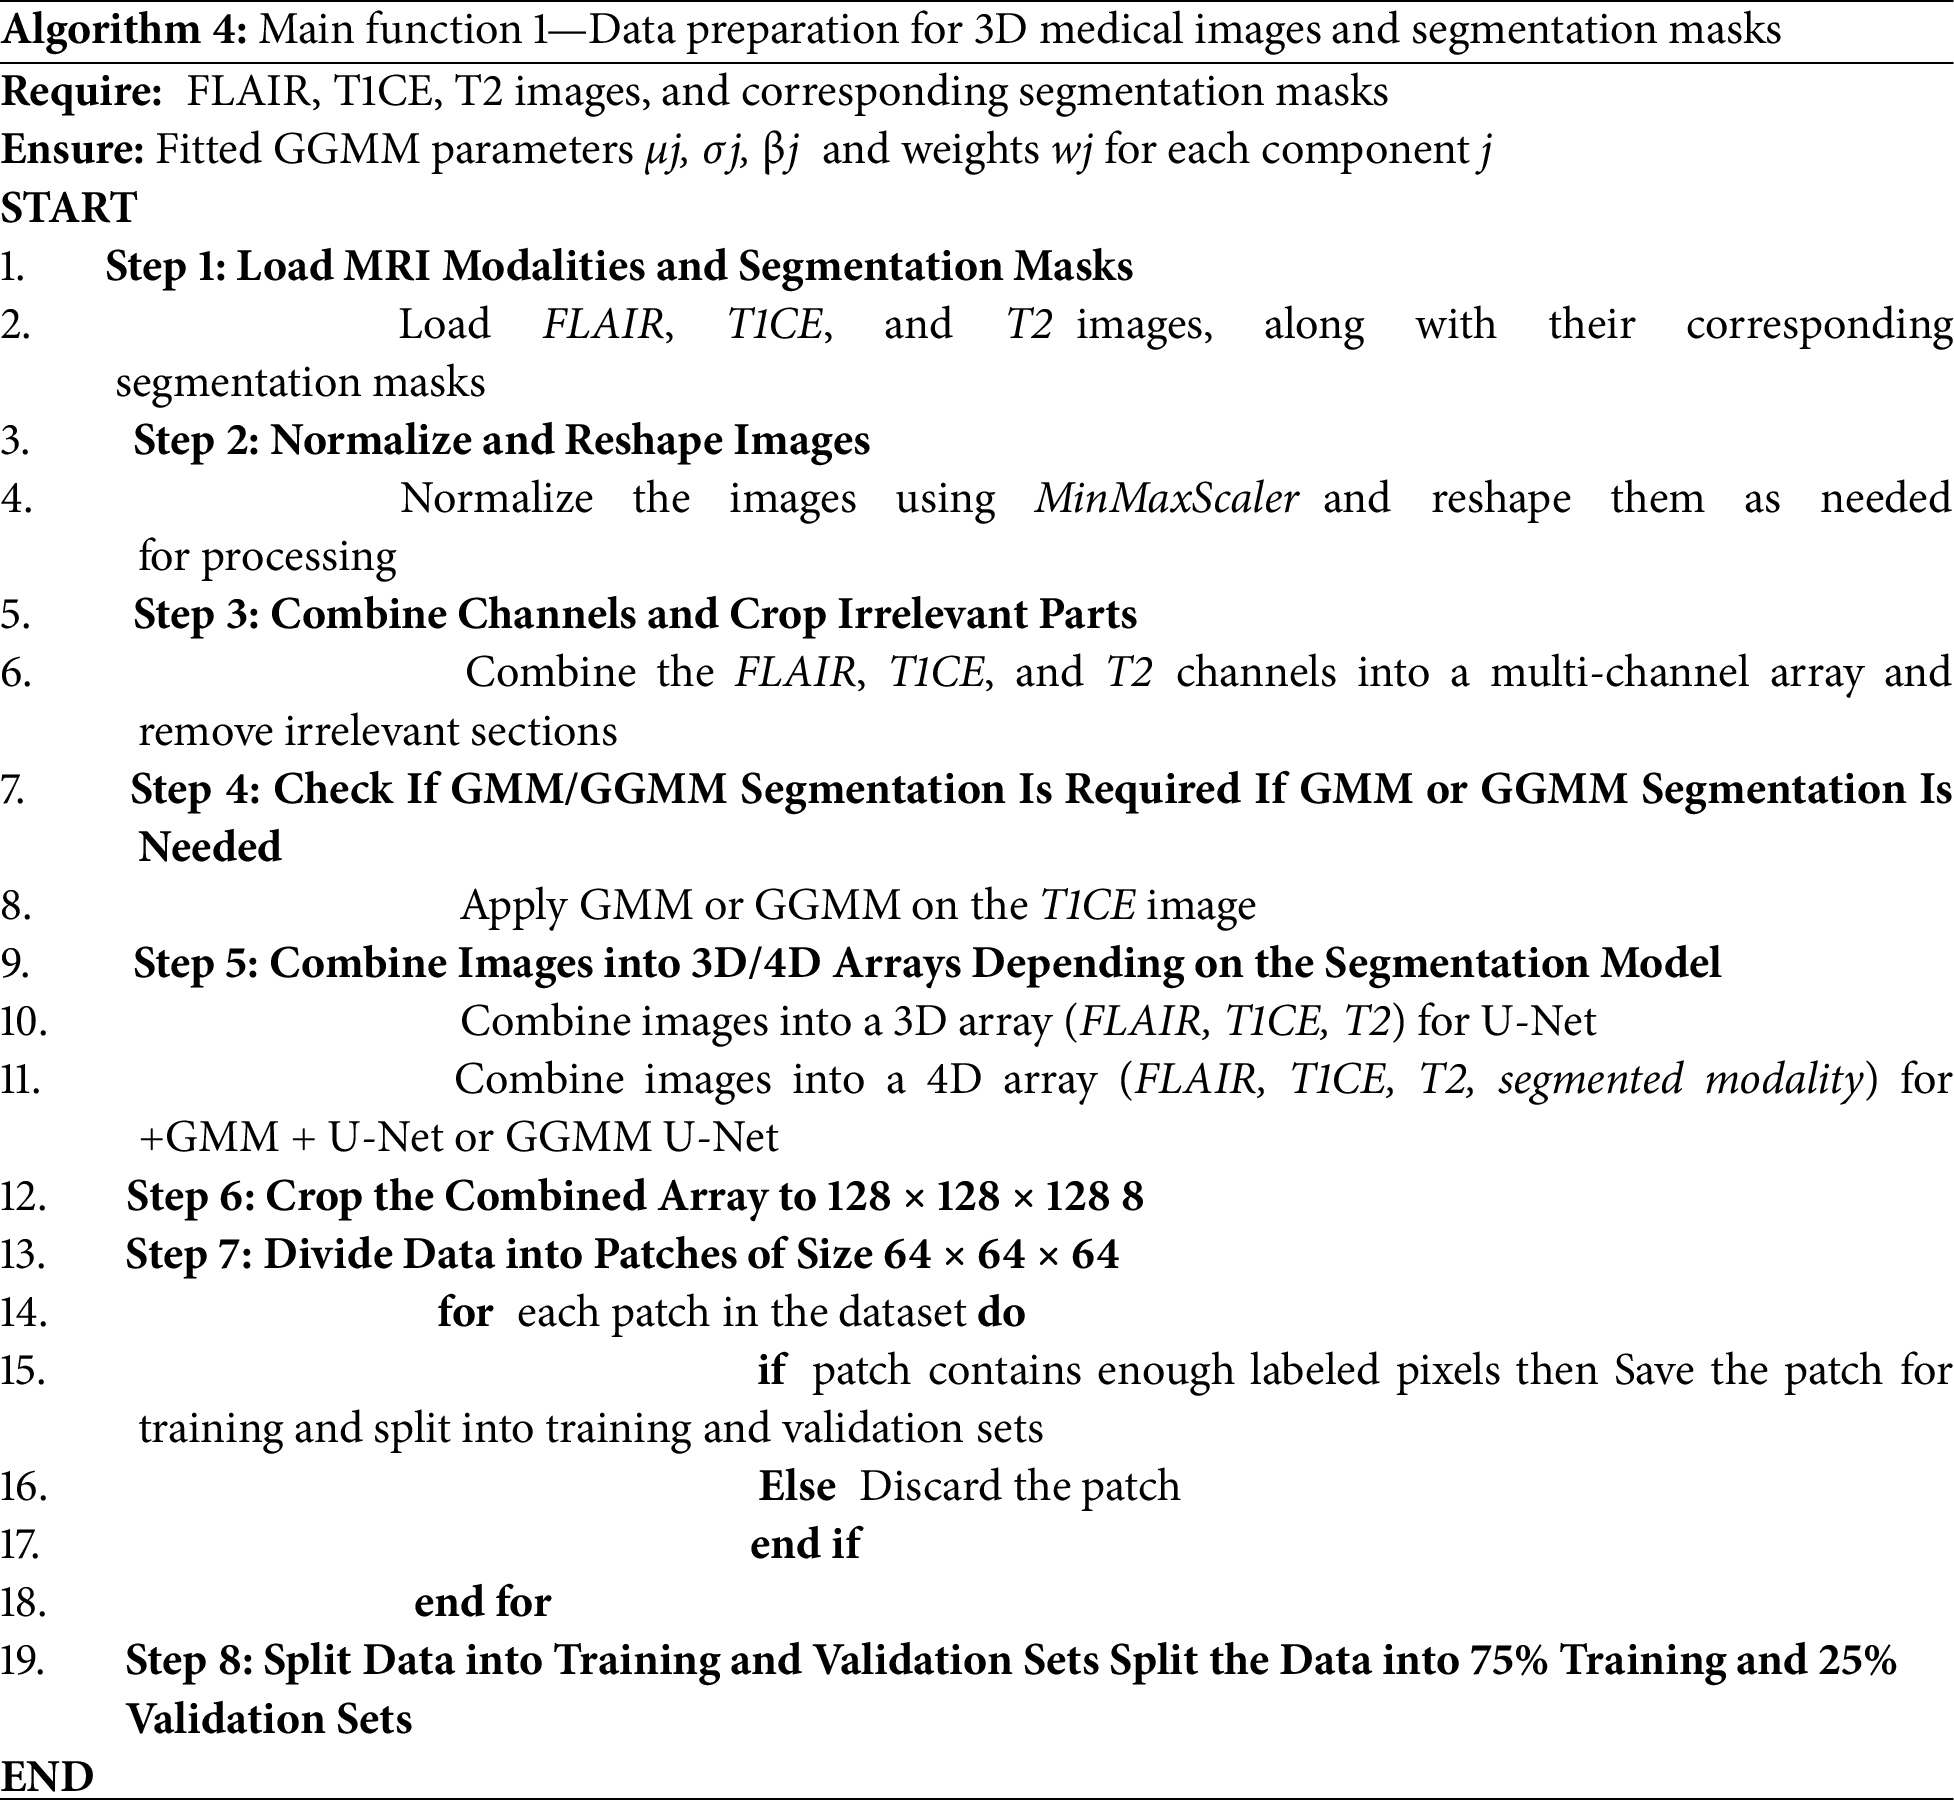
The overall workflow for segmenting the BraTS-2020 dataset is explained below in eight main steps in Algorithm 4. First, we load the MRI modalities, FLAIR, T1, T1CE, and T2, along with their corresponding segmentation masks. Then, we normalize the images to a range between 0 and 1, since the intensity values across different modalities vary. This normalization helps the model better understand the nature of the images. Subsequently, the modalities are combined into a single 4D array. After that, the 4D array is cropped to a standard size of 128 × 128 × 128 to ensure that the input meets the model’s requirements. Next, the data is divided into smaller patches of 64 × 64 × 64 to improve memory efficiency and accelerate model training. Patches containing a sufficient number of non-zero labels are retained, while the others are discarded. The dataset is then split into training and validation sets using the splitfolders tool with a 75/25 ratio. Finally, this prepared dataset can be used to train deep learning models such as 3D U-Net.
3.2 Model Configuration and Training
As shown in Fig. 2, the 3-dimensional U-Net model consists of three main components: a contracting path (C1–C4), a bottleneck (C5), and an expansive path (U6–U9). The contracting path learns spatial variations using convolutional and max-pooling layers, progressively reducing the spatial dimensions and deepening feature representations. The bottleneck (C5) acts as a bridge, where it learns high-level abstract features. The expansive path (U6–U9) regains spatial resolution using upsampling and convolutional layers, with skip connections added from corresponding layers in the contracting path to retain fine-grained details, thereby increasing segmentation accuracy. The 3D U-Net algorithm we utilized in our study (see Algorithm 5) for the segmentation of medical images is guided by a methodical process to efficiently learn and predict from volumetric data [29]. It begins with importing necessary libraries such as Keras and NumPy, followed by data preparation through loading and preprocessing of the training and validation sets (images and masks). The 3D U-Net architecture includes a contracting path (encoder) to capture spatial information, a bottleneck layer to represent features in a compact manner, and an expansive path (decoder) with skip connections to merge contextual and spatial information.
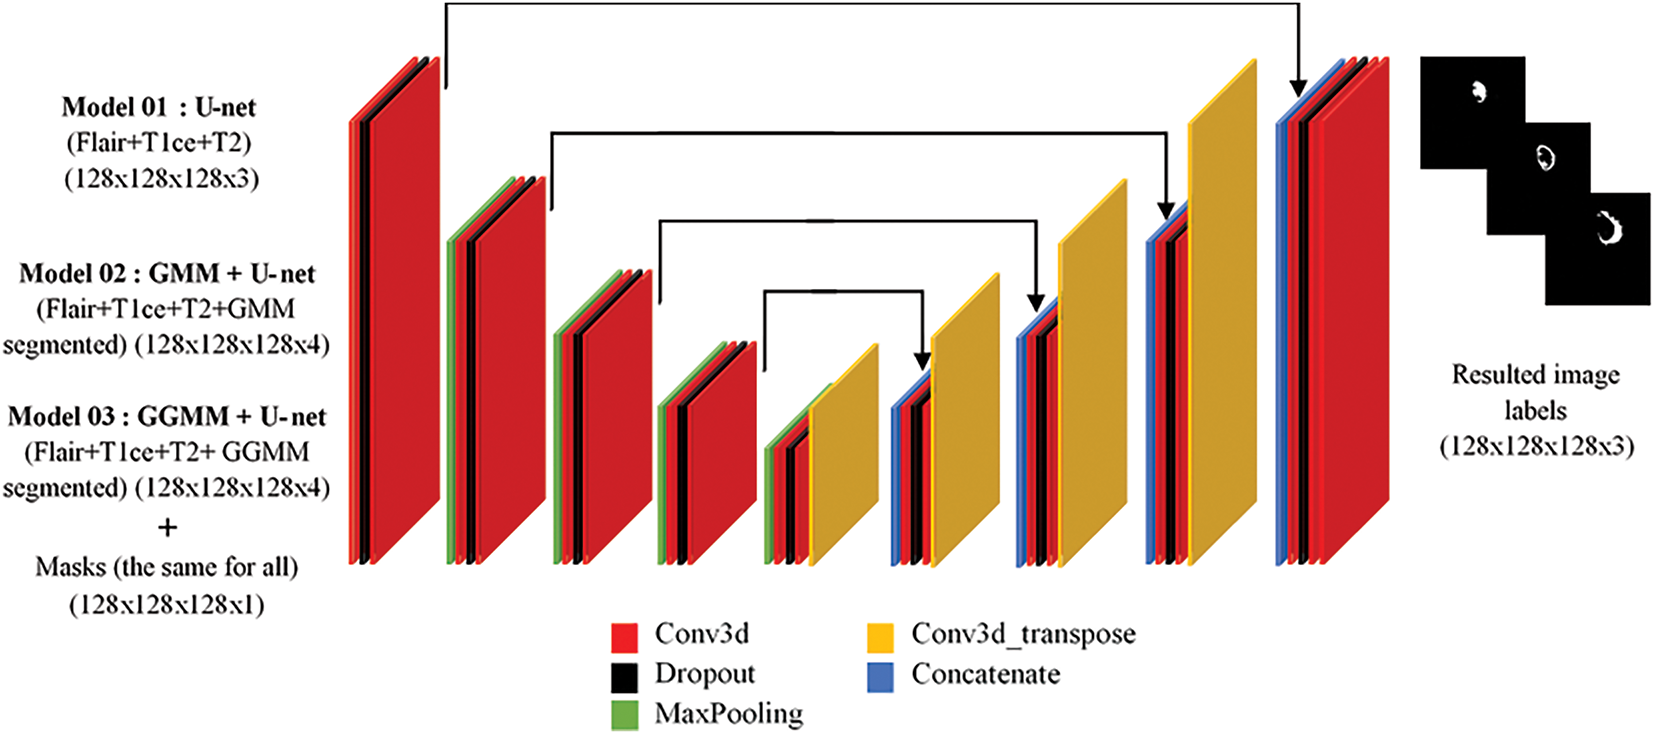
Figure 2: 3D U-Net architecture overview
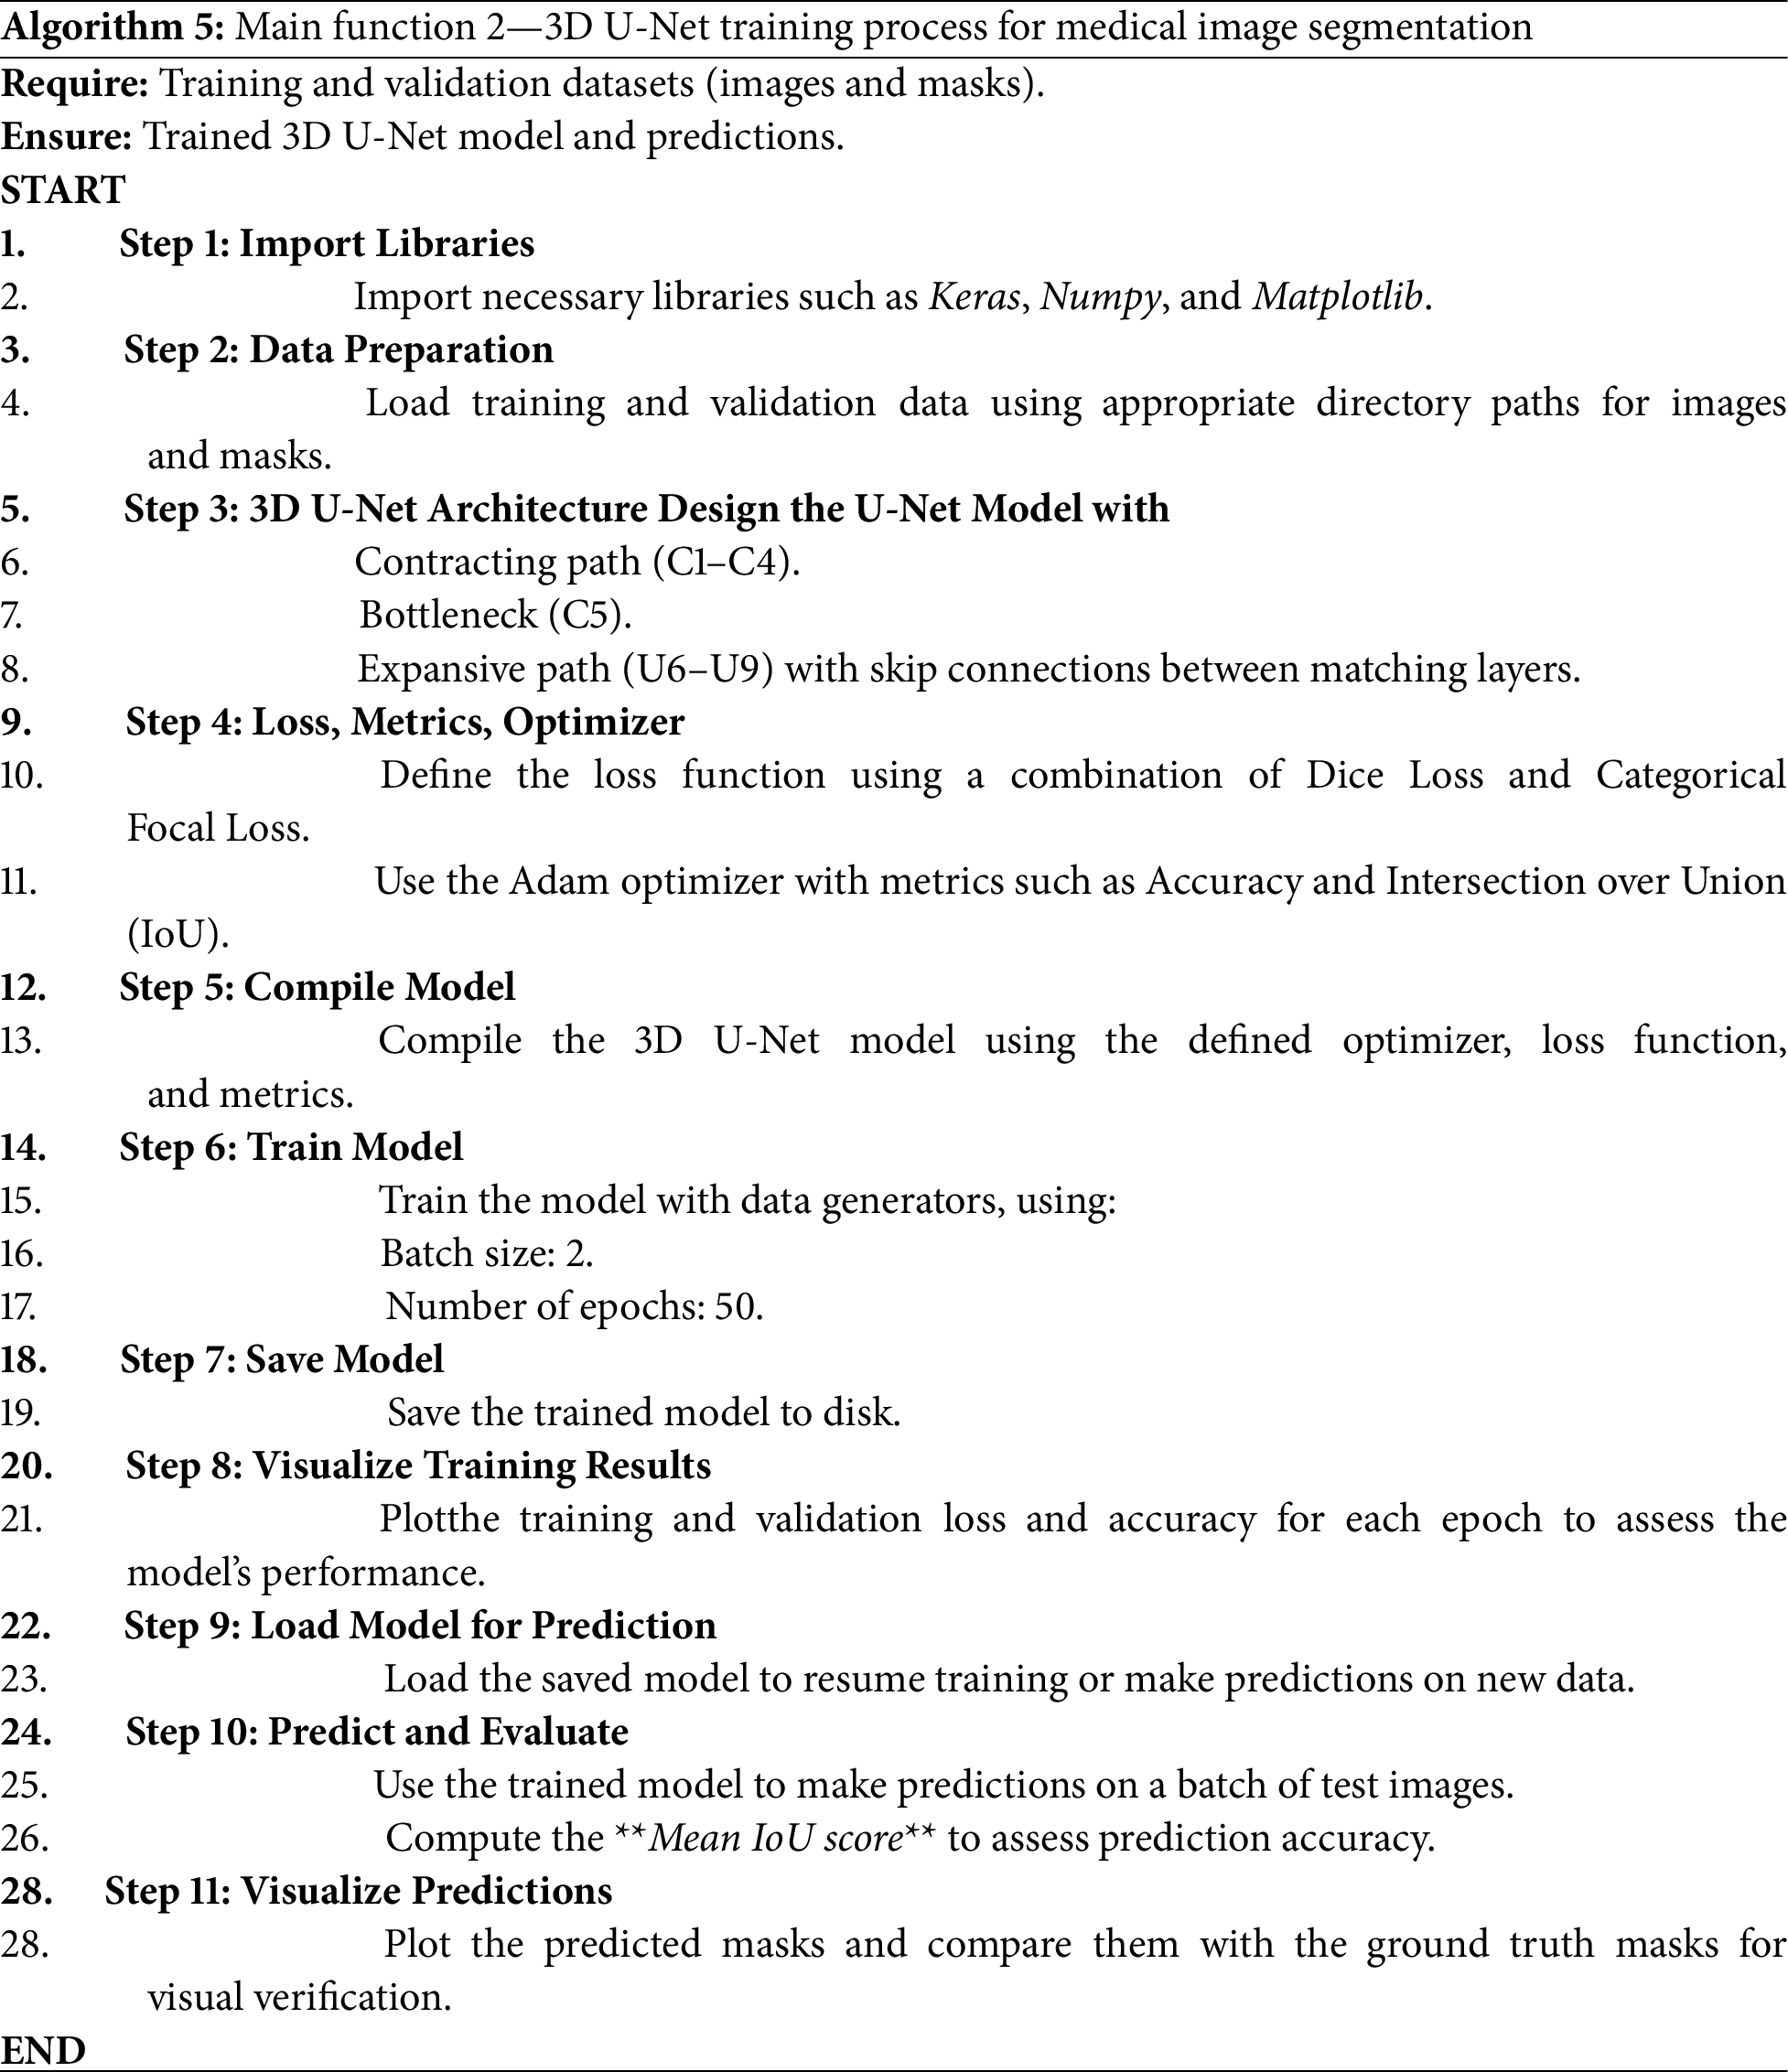
The model is optimized using a combination of Dice Loss and Categorical Focal Loss, along with the Adam optimizer, and its performance is monitored by measuring accuracy and IoU. The combined use of Dice Loss and Categorical Focal Loss helps balance class representation during training. Dice Loss enhances spatial overlap, while Focal Loss focuses learning on underrepresented tumor regions, improving the segmentation of challenging substructures.
Training is performed over 50 epochs in batches of size 2 using data generators to prevent memory overflow. To reduce overfitting, dropout was applied in the U-Net architecture, and random cropping of 3D patches was used during training to introduce variability and improve generalization. Once trained, the model is saved and used for prediction, with the Mean IoU value used to measure segmentation efficiency. Finally, training enhancements, along with visualizations comparing predictions to ground truth masks, provide feedback regarding the model’s accuracy and its ability to learn effectively. We trained three versions of the model, each with a different input configuration derived from the preprocessing stage.
– Model 01: U-net (FLAIR, T1CE, T2) (128 × 128 × 128 × 3) + masks.
– Model 02: GMM + U-net (FLAIR, T1CE, T2, GMM segmented) (128 × 128 × 128 × 4) + masks.
– Model 03: GGMM + U-net (FLAIR, T1CE, T2, GGMM segmented) (128 × 128 × 128 × 4) + masks.
Fig. 3 illustrates and summarizes our data pipeline. Raw T1CE MRI is preprocessed using either GMM or GGMM, generating a new pre-segmented channel. This channel is combined with the original MRI modalities (FLAIR, T1CE, T2) to form a 4D input array, which is then used for training. We evaluate three models: (1) Baseline U-Net, (2) GMM + U-Net, and (3) GGMM + U-Net, following a standard training pipeline. The GGMM-preprocessed model demonstrates superior segmentation accuracy by enhancing feature representation.
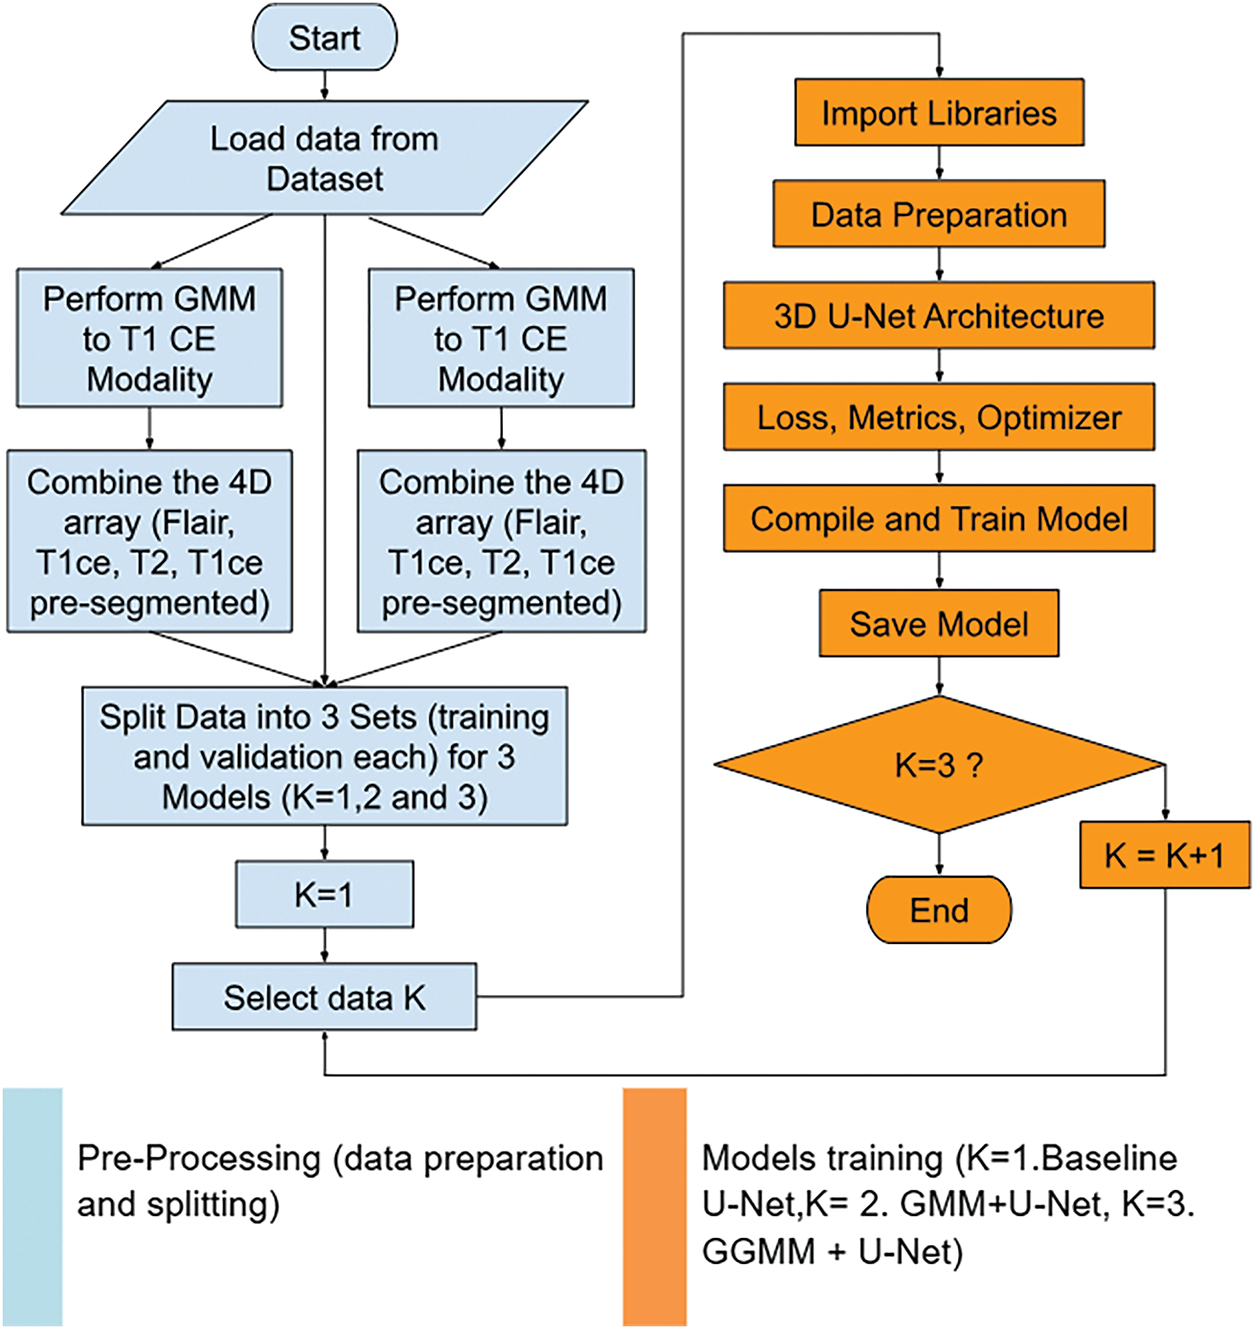
Figure 3: Data processing pipeline integrating GMM/GGMM-based pre-segmentation into U-Net training for enhanced brain tumor segmentation
4.1 Model Performance and Generalization Analysis
The comparison of training performance among the three models clearly demonstrates that incorporating pre-segmented channels into the input significantly enhances segmentation accuracy compared to the baseline U-Net. Notably, the model augmented with the T1-weighted contrast-enhanced (T1CE) modality, segmented by the GGMM, consistently outperformed its counterparts across all key evaluation metrics. This superior performance highlights the value of embedding prior structural knowledge, specifically, spatially localized tumor information, directly into the model’s input. Such an approach is particularly beneficial when addressing the heterogeneous and multi-regional nature of brain tumors, as represented in the BraTS2020 dataset. The GGMM + U-Net model achieved the highest accuracy, recall, and Dice similarity coefficient, underscoring its robustness and ability to balance sensitivity and specificity. These results affirm that incorporating a semantically rich, pre-segmented modality can provide meaningful guidance to the network during training, improving its ability to delineate complex tumor subregions. Consequently, the GGMM-enhanced U-Net emerges as a promising and well-balanced architecture for semantic segmentation tasks involving multifocal or infiltrative tumor structures.
Furthermore, the training and validation curves revealed that the baseline U-Net model exhibited noticeable overfitting, demonstrating strong performance on the training set but weaker results on the validation set, particularly in terms of IoU and loss. In contrast, the GGMM + U-Net model displayed more consistent behavior across both training and validation phases, indicating improved generalization. This suggests that the GGMM preprocessing step not only enhances segmentation accuracy but also contributes to greater robustness on unseen data.
4.2 The Intersection over Union IoU Score (Training and Validation)
The Intersection over Union (IoU) score graph for the three models, shown in Fig. 4, clearly highlights the superior performance of the GGMM + U-Net model. By epoch 50, this model achieved an IoU of 0.74 on the training set and approximately 0.65 on the validation set, outperforming the GMM + U-Net model, which reached 0.71 and 0.63, respectively. The baseline U-Net model recorded the lowest scores, with 0.68 for training and 0.58 for validation. These results underscore the positive impact of incorporating a GGMM-pre-segmented T1CE modality as an additional input channel. The enriched structural information provided by the GGMM segmentation enhances the model’s capacity to localize and delineate tumor boundaries with greater precision. This improvement is particularly evident in validation performance, reflecting better generalization and robustness in segmenting complex tumor geometries. Overall, integrating the GGMM-enhanced input substantially contributes to more accurate and fine-grained semantic segmentation.
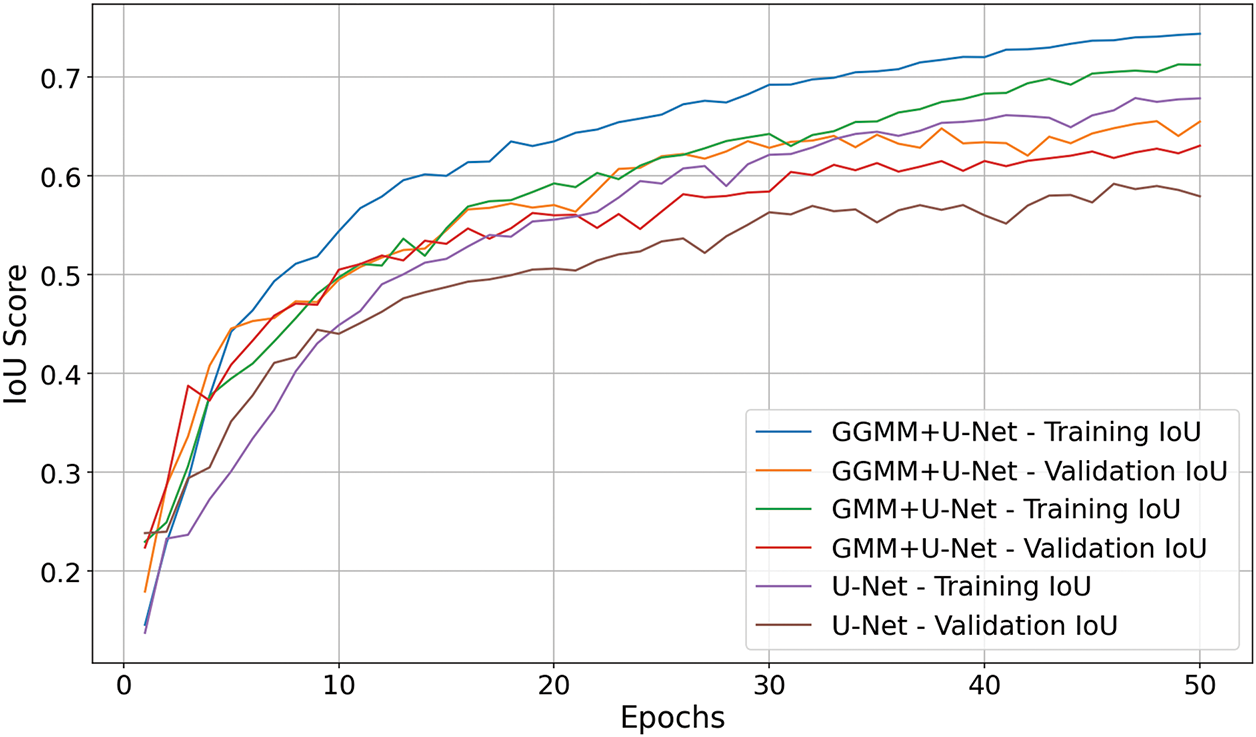
Figure 4: IoU score comparison of U-Net models with different preprocessing techniques
4.3 Loss Comparison (Training and Validation)
The loss graph in Fig. 5 (where lower values indicate better performance) illustrates that the GGMM + U-Net model most effectively minimizes error throughout training. It exhibits the steepest decline in both training and validation loss and concludes at epoch 50 with the lowest validation loss of 0.82. The GMM + U-Net model also demonstrates solid convergence, closely trailing the leading model. In contrast, the baseline U-Net shows slower optimization and weaker convergence, indicating its reduced effectiveness in the segmentation task. These findings further confirm that GGMM preprocessing enhances model robustness and facilitates more efficient learning from the data.
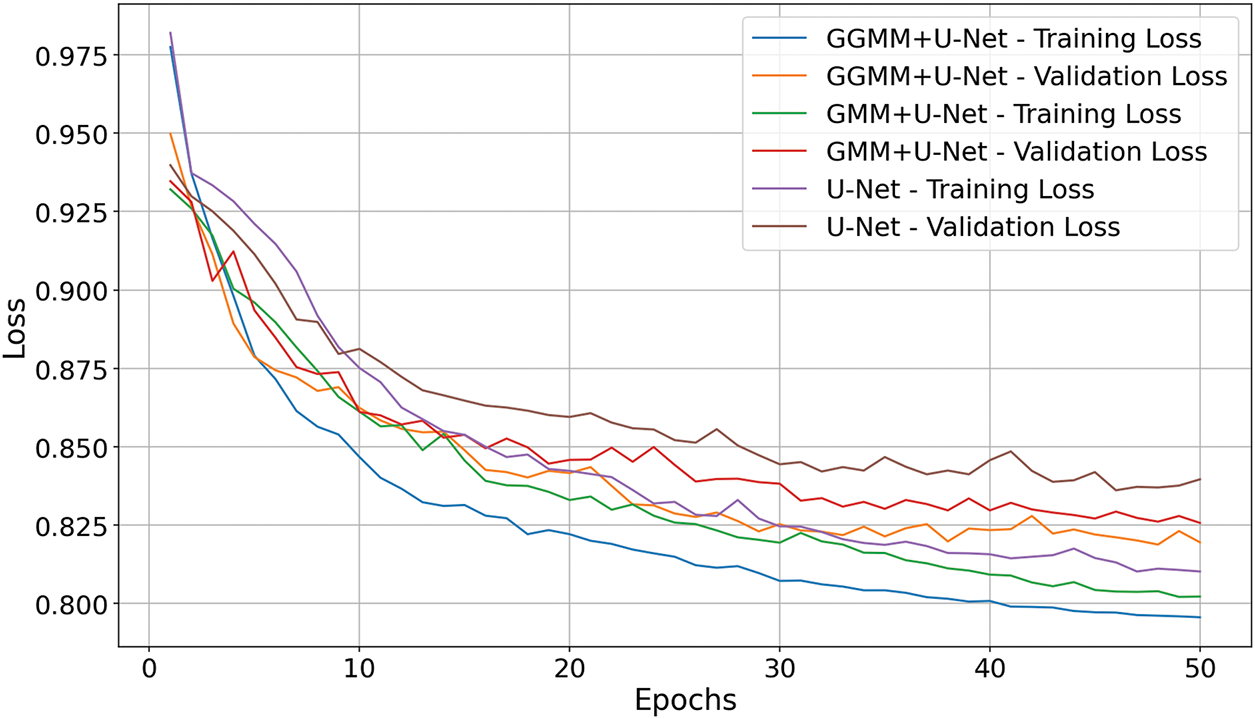
Figure 5: Loss comparison of U-Net with GMM and GGMM preprocessing
Accuracy is a metric that reflects the model’s ability to correctly classify instances across all classes [30,31]. It represents the proportion of correct predictions among the total number of cases, offering a general indication of the model’s overall performance.
– TP (True Positives): Instances identified correctly to belong to the target class, matching the ground truth.
– FP (False Positives): Instances identified incorrectly to belong to the target class when they do not.
– FN (False Negatives): Instances belong to the target class but not identified.
– TN (True Negatives): Instances identified correctly do not belong to the target class.
The accuracy graph presented in Fig. 6 demonstrates that the GGMM + U-Net model achieved the highest segmentation accuracy at 98.35%, surpassing both the baseline U-Net model (98.11%) and the GMM + U-Net model (97.95%). While the differences in overall accuracy may appear marginal, they are consistent and clinically meaningful within the context of medical image segmentation, where even slight improvements can significantly impact diagnostic outcomes. These findings further substantiate the effectiveness of the GGMM-based preprocessing strategy in enhancing the network’s capacity to detect and delineate complex tumor structures. By supplying a semantically enriched and spatially informative input derived from the T1CE modality, the GGMM segmentation enables the U-Net architecture to more accurately focus on critical tumor regions. This leads to more reliable and precise segmentation, which is essential for supporting diagnostic decision-making and treatment planning in brain tumor analysis.
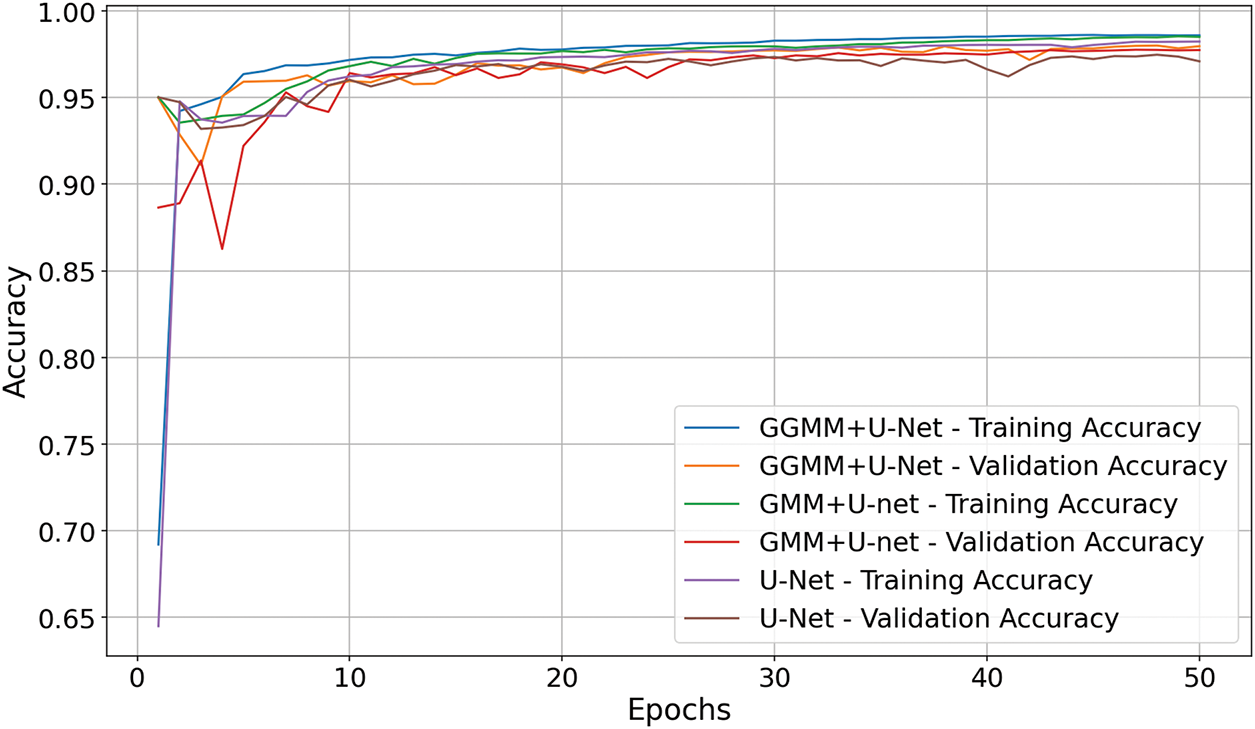
Figure 6: Accuracy comparison of U-Net models with GMM and GGMM preprocessing
The confusion matrix of the baseline U-Net model, shown in Fig. 7, demonstrates a high degree of accuracy in segmenting the background (Class 0), reflecting the model’s strong ability to identify non-tumorous brain regions. However, its performance declines markedly when classifying tumor-related regions, particularly Class 2 (peritumoral edema) and Class 3 (Gadolinium-enhancing tumor). This drop in classification accuracy suggests that, although the baseline U-Net effectively captures dominant non-tumor areas, it struggles with the more complex and less prevalent tumor subregions. These results reveal an imbalance in the model’s sensitivity across tissue types, emphasizing its limitations in detecting subtle or heterogeneous features characteristic of malignant growths. Consequently, this underscores the need for enhanced input representations or architectural modifications to improve the model’s discriminatory power for tumor-specific regions.
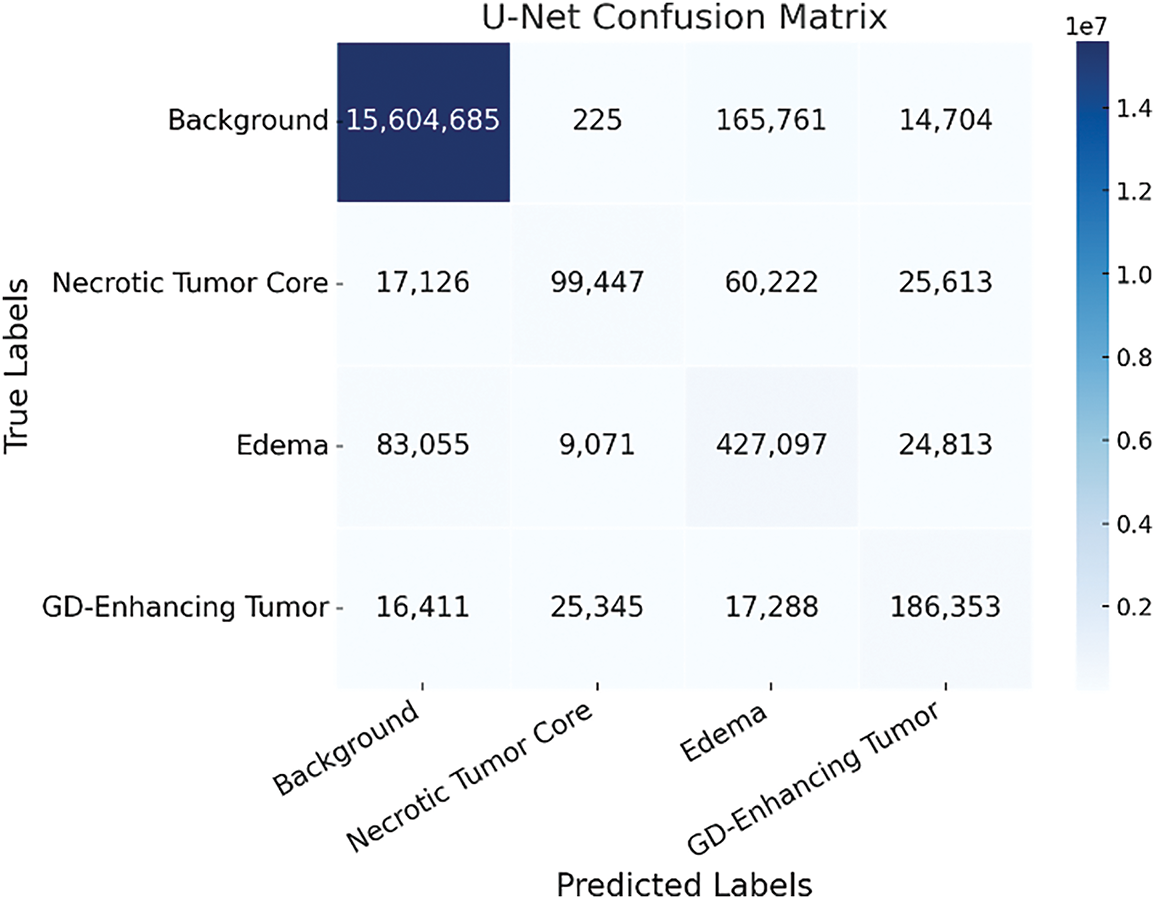
Figure 7: Confusion matrix of the baseline U-Net model showing tumor class misclassification patterns
The inclusion of the GMM-pre-segmented T1CE modality as an additional input channel enhances class separability, particularly between edema (Class 2) and background (Class 0). This improvement is evident in Fig. 8, where the overlap between these two classes is significantly reduced compared to the baseline model. The reduced overlap suggests that the model, guided by the pre-segmented structural cues, is better equipped to distinguish morphologically similar but clinically distinct regions. By incorporating prior spatial context related to tumor-enhancing areas, the GMM-enhanced input allows the network to more effectively capture subtle intensity variations and spatial boundaries. This results in more accurate voxel-level classification and, ultimately, more precise and reliable segmentation, critical for clinical tasks that require accurate delineation of tumor subregions.

Figure 8: Confusion matrix of the GMM + U-Net model highlighting improved class differentiation
As illustrated in Fig. 9, the GGMM + U-Net model demonstrates superior performance, particularly in reducing misclassifications between challenging tumor subregions such as the necrotic tumor core (Class 1) and peritumoral edema (Class 2). This enhanced distinction highlights the value of incorporating the GGMM pre-segmented T1CE modality, which enriches the input with spatially relevant prior information and facilitates more effective feature learning during training. By improving the model’s ability to differentiate morphologically adjacent yet clinically distinct regions, the GGMM layer significantly contributes to more accurate and reliable segmentation. Among the evaluated models, GGMM + U-Net achieves the highest accuracy and the most balanced predictions across all tumor classes, particularly in complex and infiltrative regions. This makes it the most effective architecture for medical image segmentation in scenarios requiring precise delineation of tumor boundaries to support clinical diagnosis, treatment planning, and patient monitoring.
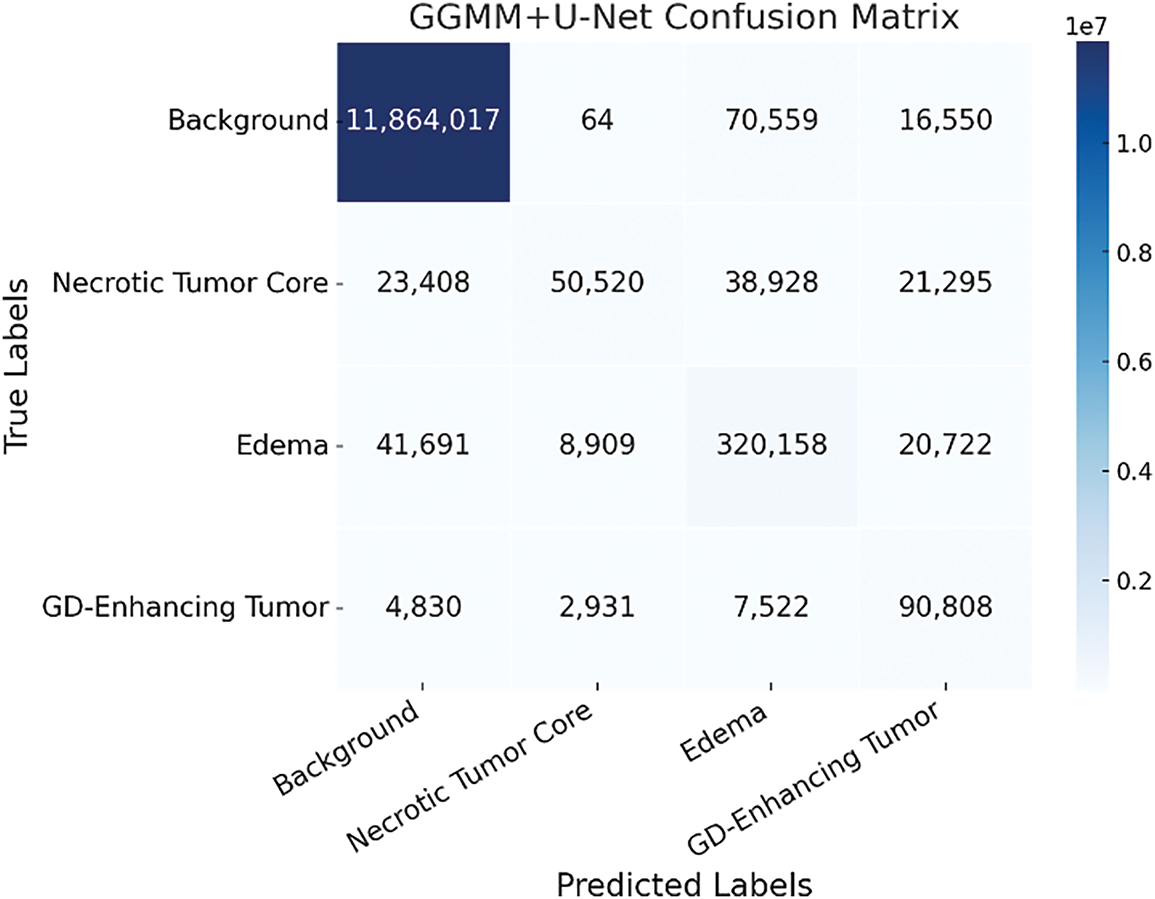
Figure 9: Confusion matrix of the GGMM + U-Net model demonstrating enhanced tumor region segmentation accuracy
4.6 Per-Class Performance Analysis
Dice score and Recall were selected as the primary evaluation metrics due to their well-established relevance in medical image segmentation, particularly within the BraTS challenge benchmarks. Dice offers a robust measure of spatial overlap, while Recall reflects the model’s sensitivity to tumor detection, making both metrics essential for evaluating segmentation quality in clinical applications.
4.6.1 Calculated Key Performance Metrics
To comprehensively evaluate segmentation performance, we computed two key metrics, Recall and the Dice Coefficient, for each class, as illustrated in Figs. 10 and 11. The evaluated classes include:
• Class 0: Background,
• Class 1: Necrotic and Non-Enhancing Tumor Core,
• Class 2: Peritumoral Edema, and
• Class 3: Gadolinium-Enhancing Tumor.
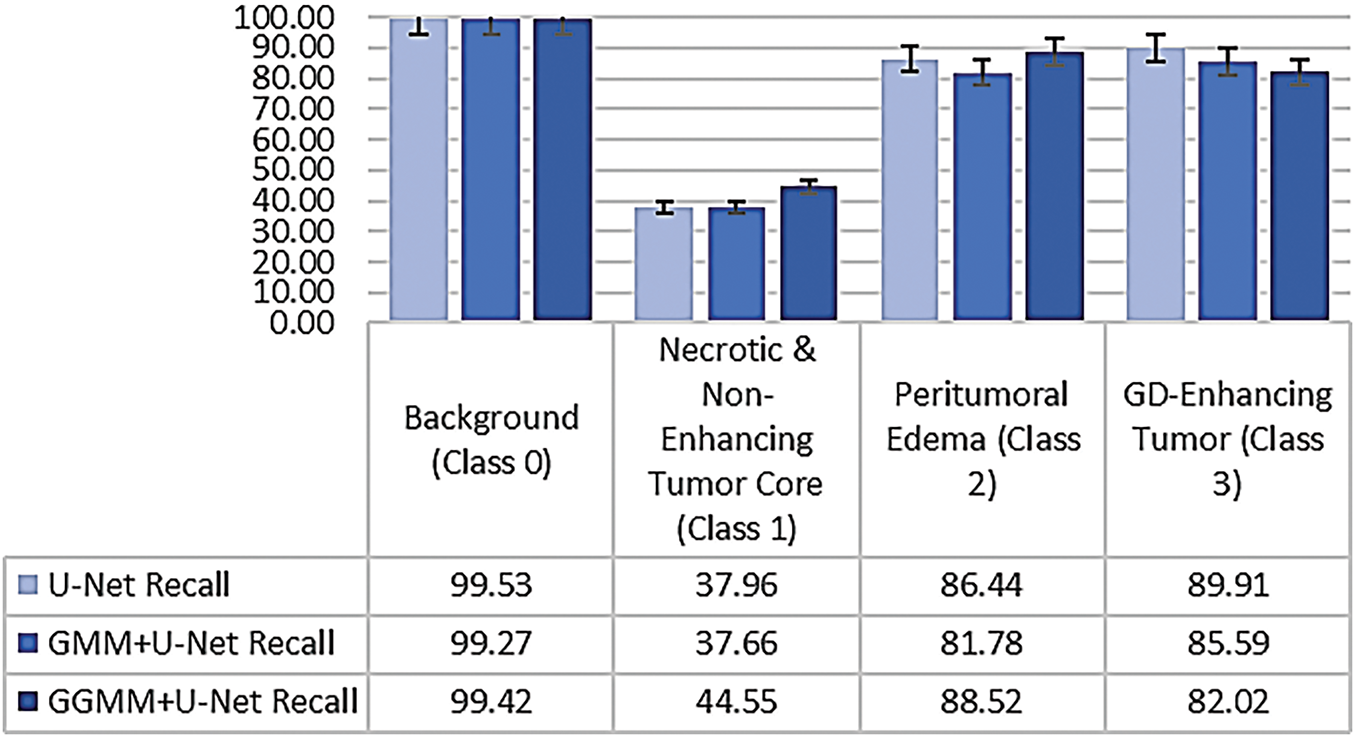
Figure 10: Class-wise recall comparison across segmentation models
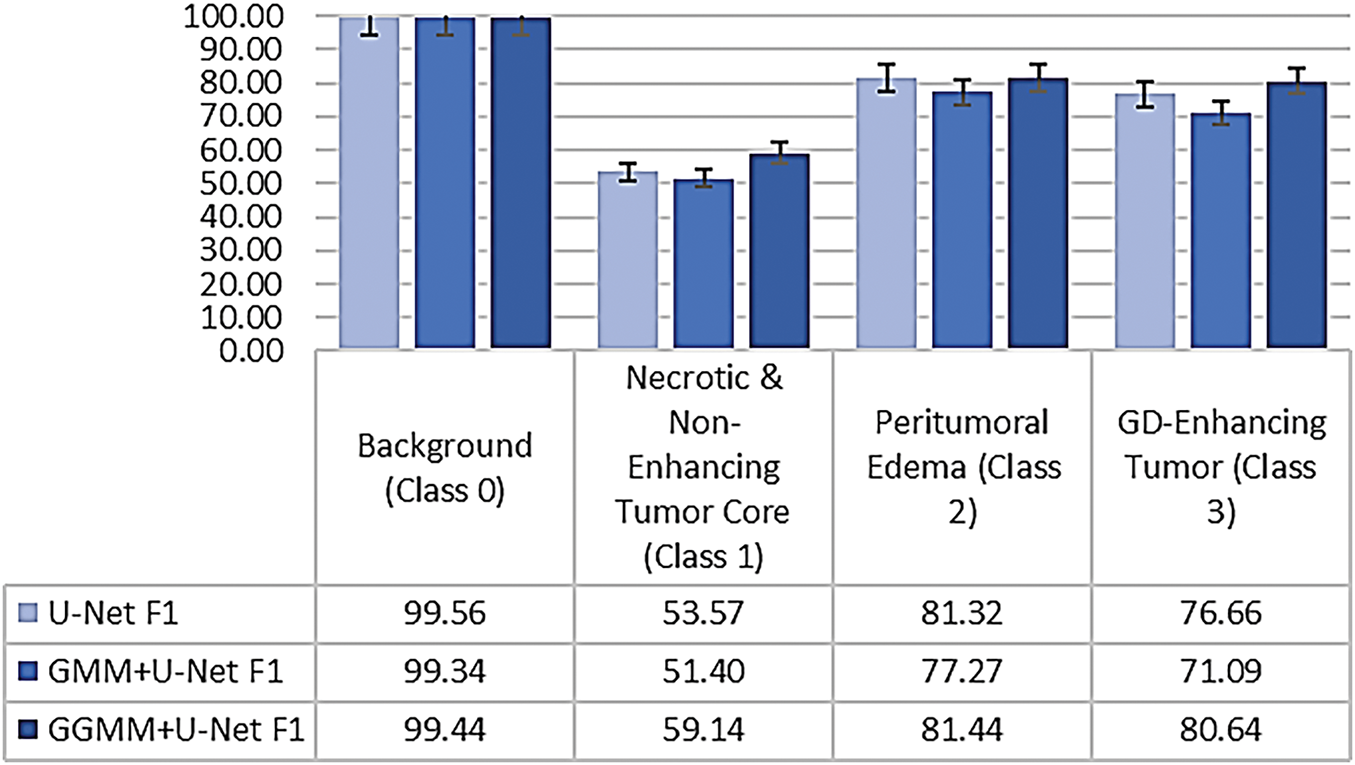
Figure 11: Class-wise dice coefficient comparison demonstrating overlap accuracy
Recall, also referred to as the true positive rate or sensitivity, measures the model’s ability to correctly identify all relevant voxels for a given class. It represents the proportion of true positive predictions relative to the total actual instances of that class, and is defined as follows [30–32]:
where TP denotes true positives and FN denotes false negatives.
The Dice Coefficient is a widely used metric for evaluating segmentation quality. It quantifies the degree of overlap between the predicted segmentation and the ground truth, and is particularly effective in assessing spatial agreement for medical image segmentation tasks [30–32]:
where FP represents false positives. A higher Dice score indicates a better match between predicted and true segmentation masks, with 1.0 representing perfect agreement.
The comparative analysis of class-wise performance across the three models, as illustrated in Figs. 10 and 11, reveals significant variations in segmentation accuracy among tumor subregions. All models demonstrate excellent performance on Class 0 (Background), with the baseline U-Net achieving the highest recall (99.53%) and Dice coefficient (99.56%). This is expected, as background pixels dominate the volume and are typically easier to distinguish due to their distinct characteristics.
In Class 1 (Necrotic and Non-Enhancing Tumor Core), the GGMM + U-Net model clearly outperforms the other models, achieving the highest recall and Dice score. This indicates its improved capability in identifying more challenging and less distinct tumor regions, likely due to the enhanced structural prior provided by the GGMM-pre-segmented input.
For Class 2 (Peritumoral Edema), the GGMM + U-Net again shows superior performance, with a recall of 88.52% and a Dice coefficient of 81.44%. These results suggest that the model is more effective in capturing the diffuse and often ambiguous boundaries associated with edema, a critical region for clinical analysis and treatment planning.
In Class 3 (Gadolinium-Enhancing Tumor), the baseline U-Net achieves the highest Recall, reflecting strong sensitivity to contrast-enhancing regions. However, this comes at the cost of increased false positives, as evidenced by its lower Dice score. The GGMM + U-Net model closely follows, achieving the highest Dice coefficient (80.64%), indicating a better overall balance between sensitivity and precision, an essential consideration in clinical contexts where minimizing false positives is often as important as detecting all tumor tissue.
Taken together, the GGMM + U-Net model demonstrates the most consistent and balanced performance across all tumor classes. Its ability to accurately detect and delineate complex and morphologically varied tumor structures makes it a strong candidate for robust medical image segmentation, particularly in scenarios requiring precise boundary detection to support clinical decision-making.
4.6.3 Statistical Significance of Dice Improvements
To evaluate the statistical significance of performance differences in Dice coefficients, a repeated-measures Analysis of Variance (ANOVA) was performed using class-wise Dice scores from the three segmentation models. This approach was appropriate given the within-subject design, where each model was assessed across the same tumor classes. The analysis revealed a statistically significant effect of model type on segmentation performance, F(2, 6) = 5.68, p = 0.041, with 2 and 6 representing the between-model and within-subject degrees of freedom, respectively. These results confirm that the performance gains achieved by the GGMM + U-Net model are not attributable to random variation. Among the evaluated models, GGMM + U-Net consistently achieved the highest Dice scores across all tumor subregions, whereas GMM + U-Net demonstrated the weakest performance. These findings underscore the effectiveness of the GGMM-based preprocessing strategy in enhancing segmentation accuracy; particularly when measured by the Dice coefficient, the most widely adopted and balanced metric in medical image segmentation.
4.7 Training Time and Preprocessing Cost Comparison
Beyond segmentation accuracy, we also evaluated the computational cost associated with both the training and preprocessing phases of the proposed pipeline. Model training was performed on a system equipped with an NVIDIA GeForce RTX 3050 Ti GPU (4 GB VRAM), 16 GB RAM, and an Intel Core i5 12th Gen CPU. Fig. 12 presents the total training time required for each model. The baseline U-Net completed training in 26,297 s, while the GMM + U-Net and GGMM + U-Net models required 25,694 and 25,617 s, respectively. These results indicate that the integration of pre-segmented input channels, particularly the GGMM-preprocessed T1CE modality, does not increase training time. In fact, the GGMM + U-Net model, which delivered the best segmentation performance, also achieved the shortest training duration.
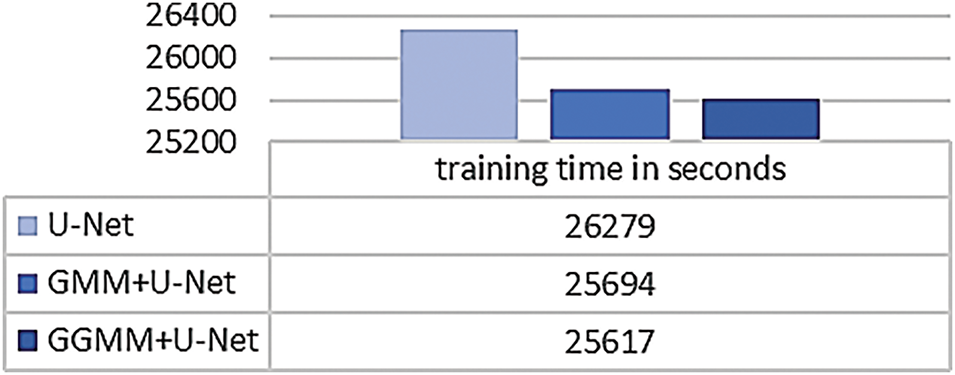
Figure 12: Total training time for baseline and preprocessed U-Net models
To assess the feasibility of preprocessing, we also measured the time required to generate the pre-segmented input volumes. This step was performed on a separate machine equipped with an Intel Core i7 10th Gen CPU and 16 GB RAM. GMM-based preprocessing took approximately 3 h for the entire dataset, while GGMM-based preprocessing required about 7 h. Although GGMM incurs a higher computational cost due to its more complex parameter estimation, this additional time is justified by the resulting improvement in segmentation accuracy, particularly in terms of the Dice score.
4.8 Performance Evaluation and Benchmarking
The evaluation metrics for Whole Tumor (WT) segmentation on the test dataset indicate strong performance, with an accuracy of 97.75%, reflecting a high overall correctness in predictions. The model achieves a precision of 86.57%, indicating a low rate of false positives, while the recall of 88.93% demonstrates its effectiveness in capturing most tumor regions. The Dice score of 88.03% represents a balanced trade-off between precision and recall, and the Intersection over Union (IoU) of 78.15% suggests substantial overlap between the predicted and ground truth tumor regions. To further enhance segmentation quality, techniques such as post-processing, data augmentation, and hyperparameter tuning could be explored to improve the IoU and refine the model’s predictions.
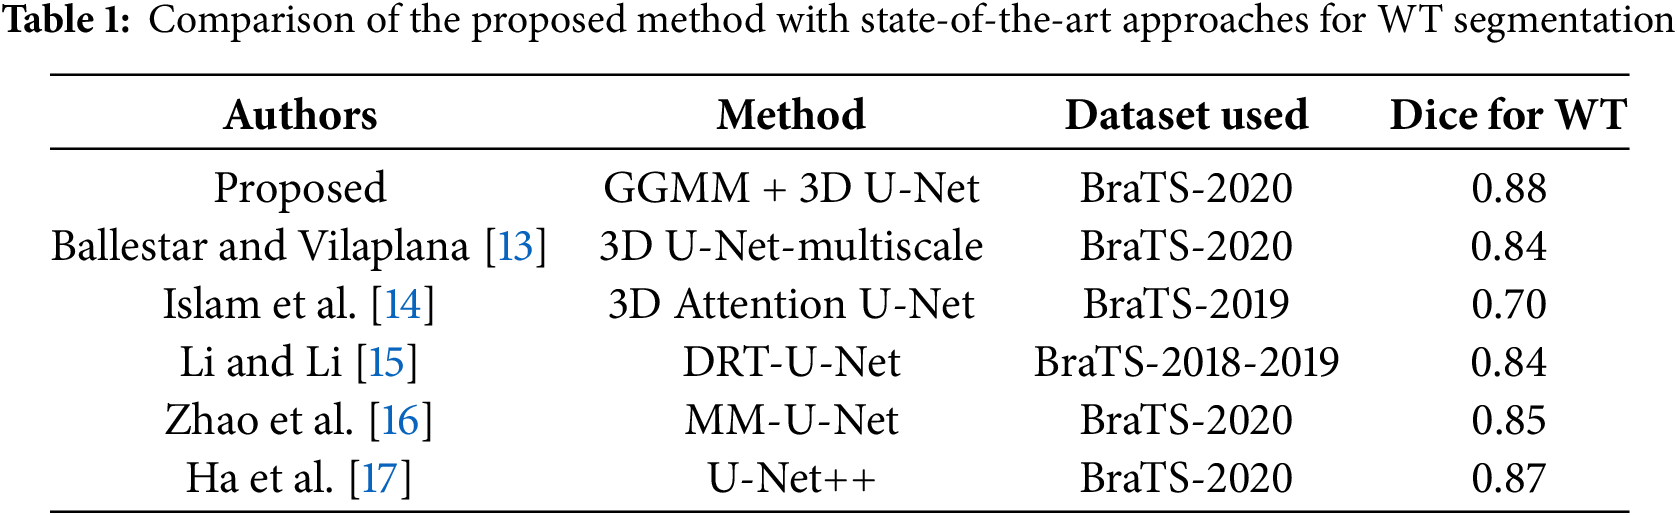
A comparative analysis with state-of-the-art methods was conducted to validate the proposed approach. As summarized in Table 1, the proposed GGMM + 3D U-Net achieves a Dice score of 0.88 for Whole Tumor segmentation on the BraTS 2020 dataset. This performance is competitive with recent deep learning models, outperforming the 3D Attention U-Net (Dice = 0.70) and 3D U-Net-Multiscale (Dice = 0.84). While models such as U-Net++ (Dice = 0.87) show comparable results, the proposed method benefits from the integration of GGMM for enhanced feature extraction, contributing to more robust and accurate tumor segmentation.
4.9 Strengths, Limitations, and Future Directions
The proposed GGMM + U-Net model significantly enhances brain tumor segmentation by integrating Generalized Gaussian Mixture Model (GGMM) preprocessing with a 3D U-Net architecture. The flexibility of GGMM in modeling non-Gaussian data distributions improves feature separation, leading to increased segmentation accuracy across diverse tumor subregions.
The GGMM + U-Net model demonstrates balanced performance across all tumor classes, making it effective for segmenting heterogeneous tumor structures. The inclusion of GGMM-based preprocessing improves the model’s ability to distinguish complex tumor regions, resulting in a Dice score of 0.88 for Whole Tumor segmentation. This performance is comparable to or surpasses that of other state-of-the-art methods.
Despite its high accuracy, the model exhibits occasional misclassifications, particularly in distinguishing the necrotic core from peritumoral edema, which often share similar intensity profiles. Training was limited to 50 epochs using cropped images due to hardware constraints, potentially restricting the model’s ability to capture broader spatial context. Additionally, the EM algorithm employed in GGMM is sensitive to initialization, which may affect segmentation consistency. Although efforts were made to ensure proper dataset partitioning, evaluation was restricted to the BraTS dataset, limiting insight into generalizability across different datasets or clinical settings. The relatively small training set and limited regularization introduce a risk of overfitting, especially in high-contrast regions where the model may learn dataset-specific noise. Furthermore, due to limited computational resources, all reported performance metrics are based on single representative runs without variance analysis, which may impact the repeatability of findings. Lastly, GGMM-based preprocessing was applied solely to the T1CE modality, omitting complementary information from FLAIR and T2 sequences, modalities crucial for identifying edema and non-enhancing tumor regions.
Future work will focus on incorporating multi-modal MRI data (e.g., FLAIR, T2) into the GGMM preprocessing pipeline to improve the delineation of all tumor components. Advanced architectures, such as those integrating attention mechanisms or transformer-based modules, will be explored to enhance feature representation. Post-processing methods like Conditional Random Fields (CRFs) may further refine tumor boundaries. Leveraging higher-end computational resources would enable full-resolution training, deeper architectures, and extended training schedules. To ensure robustness and reproducibility, future studies will include statistical validation across multiple runs and random seed initializations. Moreover, external validation on datasets from different institutions or imaging protocols is essential to assess the model’s generalizability. Beyond medical imaging, the GGMM preprocessing strategy also holds potential for segmentation tasks in other domains, such as satellite imagery analysis, industrial defect detection, and biometric recognition.
Fig. 13 shows the processing step results for the same 4 random slices shown in Fig. 1; the predicted results are presented for the 3 models trained by 50 epochs. The base U-Net configuration, as we can notice in the figure, detects the general tumor area. However, it fails to define at the edge, particularly within the necrotic core, resulting in a trespassing effect on nearby structures like edema or GD-enhancing region. This baseline U-Net model has a general shape for edema but no fine details at the boundaries, this can affect the accuracy of assessing peritumoral edema. Although the model is fairly good, its inability to recognize accurate boundaries compromises its potential in analyzing fine tumor structure. However, it is still very good at detecting the whole tumor. The GMM pre-segmented channel configuration enhances segmentation accuracy for the necrotic tumor core; it delivers more defined details than the baseline U-Net. However, we notice some overlaps and incomplete edges. For edema, the model setup shows modest improvements yet remains somewhat limited in contrast sensitivity in identifying the GD-enhancing tumor. This model addition may not help fully capture the variable MRI contrasts in certain areas, impacting the accuracy of GD-enhancing tumor segmentation.
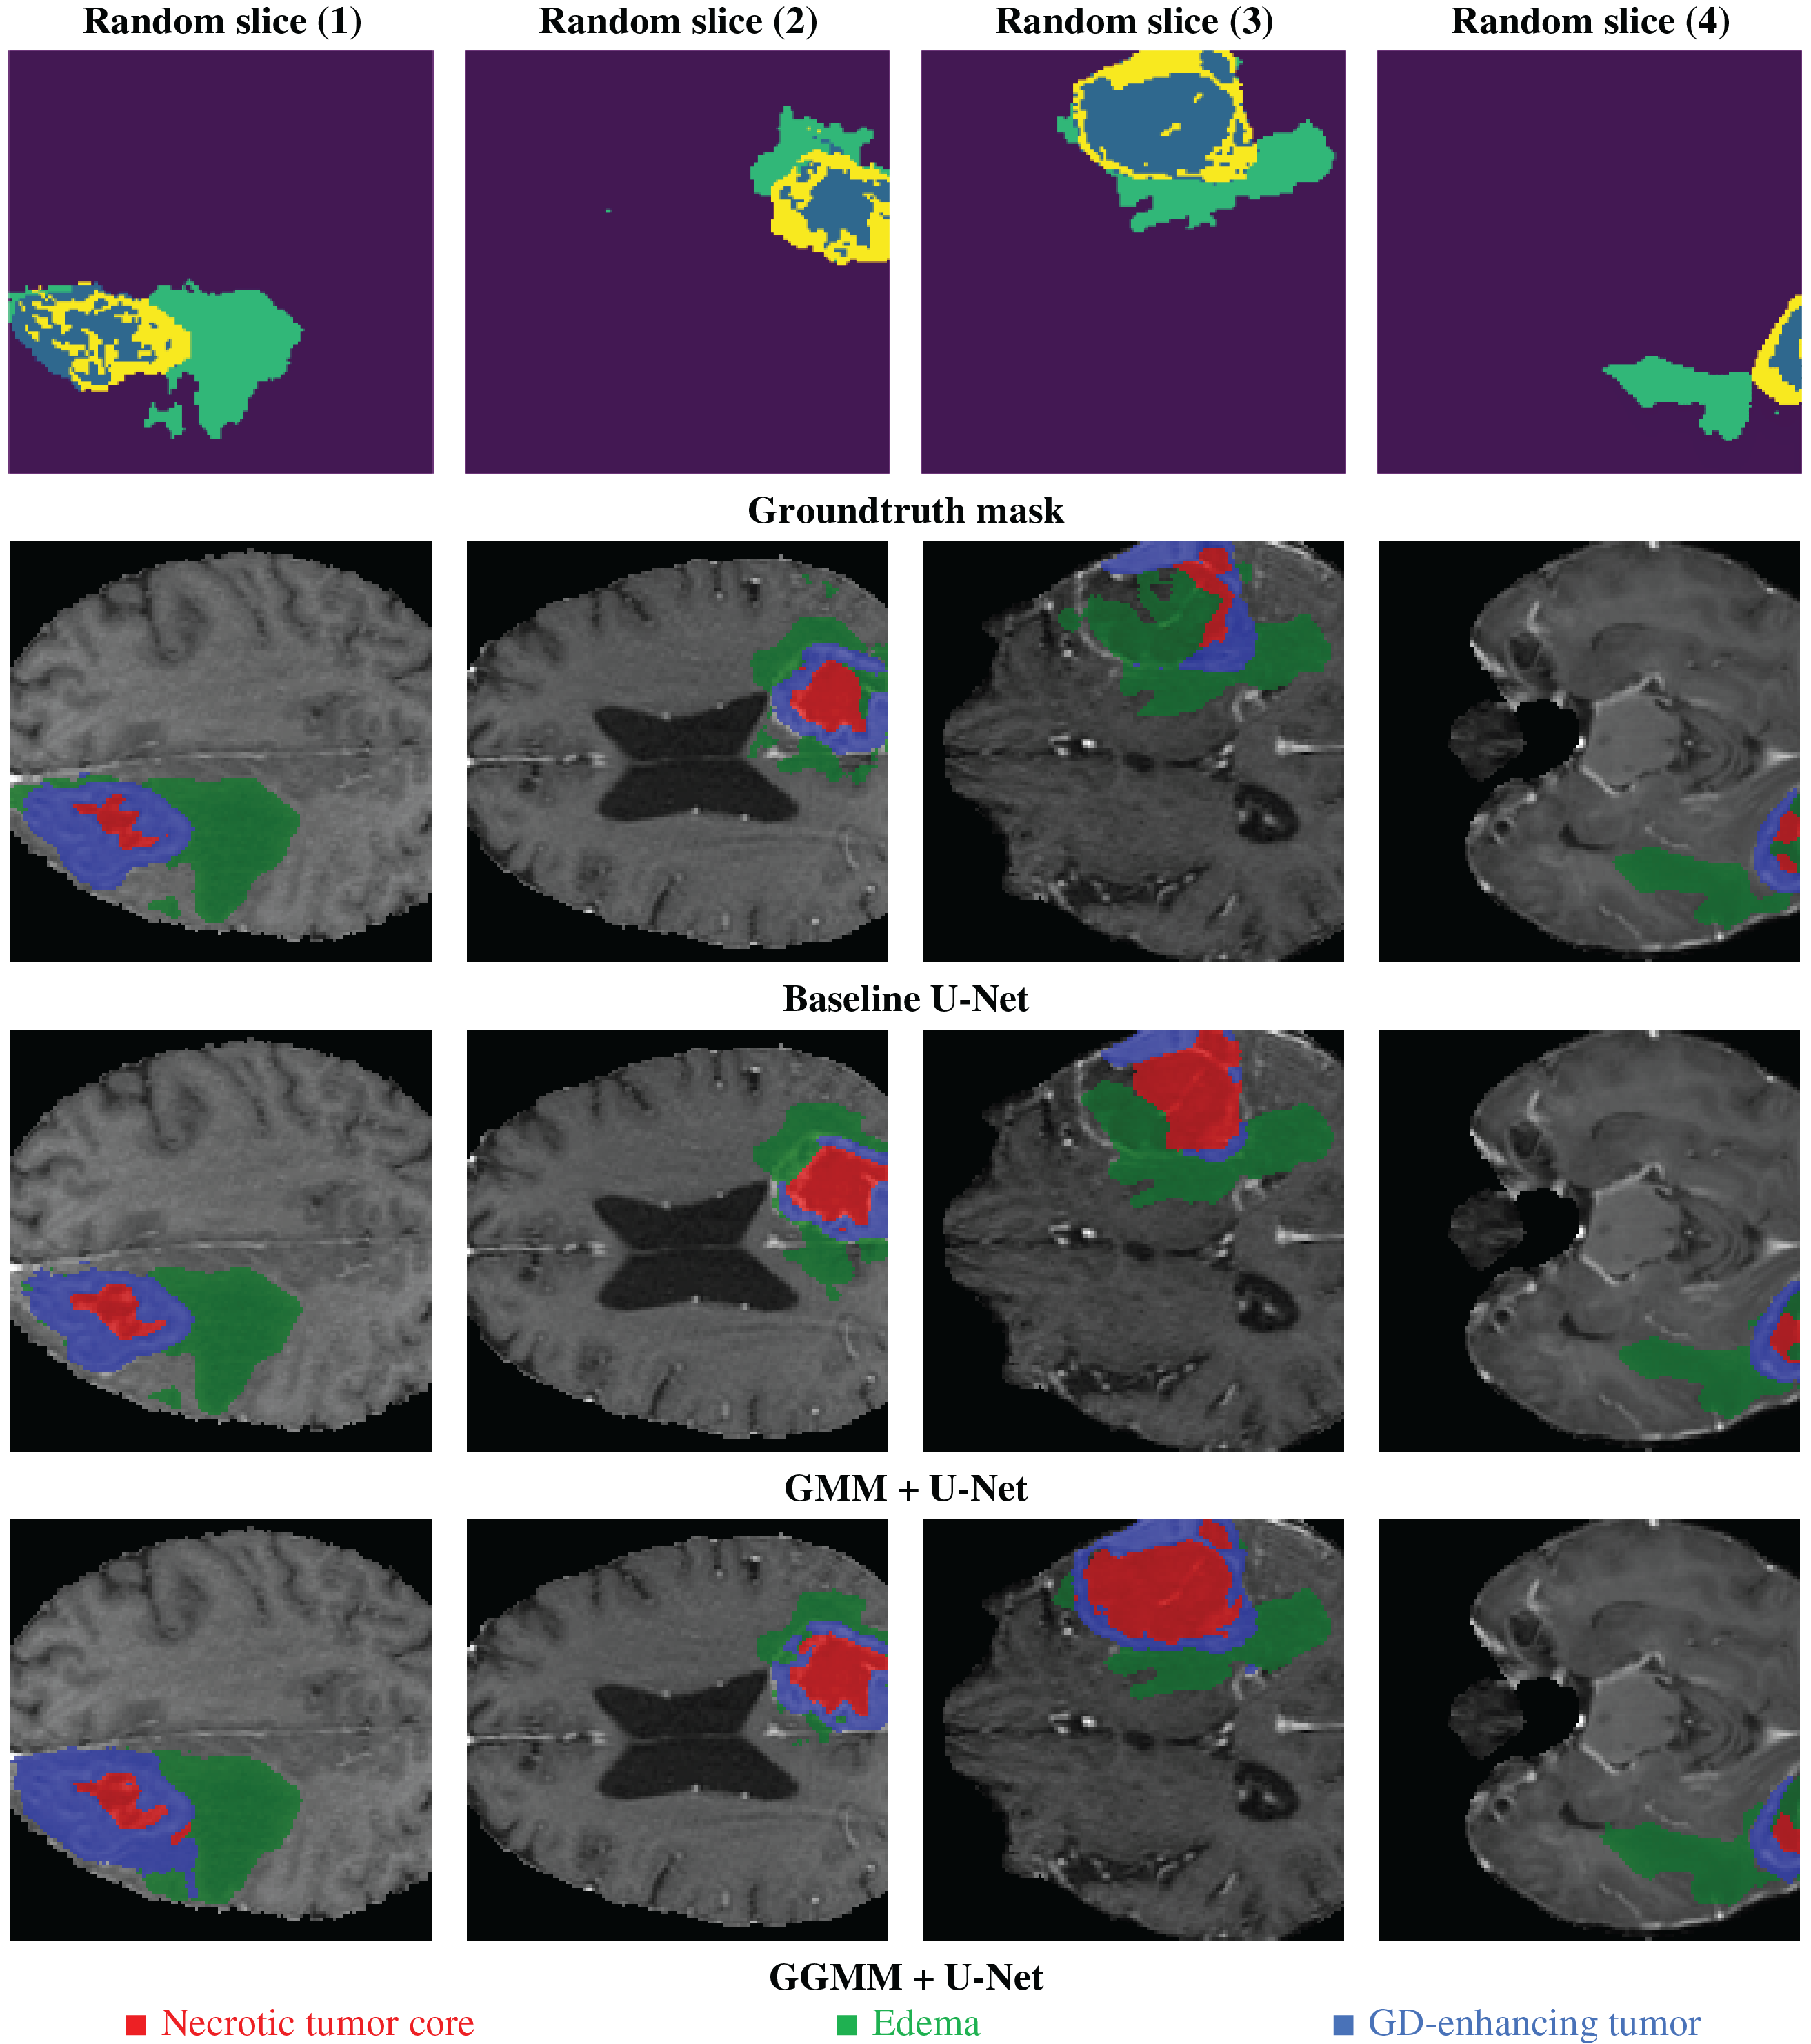
Figure 13: Example of predicted segmentation for 04 random slices for the three 03 trained models
The GGMM pre-segmented channel configuration produces sharp and highly precise segmentations, particularly for the necrotic tumor core, which is distinctly delineated with high boundary accuracy. This improvement is attributed to GGMM’s flexibility in modeling diverse MRI contrast levels. In the case of edema, the model demonstrates enhanced detection capabilities, enabling precise separation from adjacent tissues and facilitating clearer identification of peritumoral edema. Additionally, the GD-enhancing tumor region is accurately isolated with minimal overlap, making the model highly effective for reliable and accurate tumor segmentation.
The results clearly indicate that the GGMM + U-Net configuration outperforms both the standard U-Net and the GMM + U-Net in terms of segmentation accuracy. This is evident in its ability to produce more sharply defined edges for both the necrotic tumor core and edema, enabling better differentiation between tumor subregions. Moreover, the model exhibits enhanced sensitivity to contrast variations, an essential factor in the accurate detection of tumor structures, thereby improving the overall reliability of the segmentation. Furthermore, the GGMM + U-Net precisely delineates GD-enhancing regions, which are critical indicators of active tumor growth. These capabilities make the GGMM + U-Net architecture highly suitable for applications that demand high segmentation accuracy, such as treatment planning and disease monitoring in clinical settings. Its improved performance has the potential to enhance diagnostic accuracy and enable more personalized therapy, ultimately contributing to better patient outcomes.
This study evaluated the effectiveness of incorporating a dedicated preprocessing step to enhance brain tumor segmentation performance using the BraTS 2020 dataset. The proposed approach applied a GGMM in combination with EM to estimate class parameters from the T1-weighted contrast-enhanced (T1CE) modality. The resulting segmented outputs were used to enrich the input data with structural priors before training.
Three models were developed and assessed: a baseline 3D U-Net, a U-Net augmented with a GMM-presegmented T1CE channel, and a U-Net enhanced with a GGMM-presegmented T1CE channel. Among these, the GGMM + U-Net model consistently outperformed the others across multiple evaluation metrics, including recall, Dice coefficient, and Intersection over Union (IoU). It also demonstrated superior class-level differentiation, particularly in accurately segmenting tumor subregions that are typically difficult to delineate. These findings highlight the efficacy of GGMM-based preprocessing in improving both segmentation accuracy and boundary precision by providing informative structural context.
GGMM proved to be a flexible and powerful tool for extracting salient features prior to training, enhancing the model’s ability to learn from complex, multimodal data. Its adaptability to variations in imaging characteristics supports improved generalization across tumor classes.
However, certain limitations were encountered due to hardware constraints. Training was limited to 50 epochs, full-resolution images were down sampled via cropping, and the number of classes in the pre-segmentation step was reduced. These compromises, while necessary, may have limited the full potential of the proposed approach. With enhanced computational resources, including support for higher resolution volumes, longer training durations, and more detailed class-level priors, the performance of the GGMM-enhanced models could be further optimized.
Future work could extend this approach by incorporating additional pre-segmented channels, particularly from the FLAIR modality, to improve delineation of the whole tumor region. Moreover, leveraging full-volume scans and more advanced network architectures could further boost segmentation outcomes.
Acknowledgement: Princess Nourah Bint Abdulrahman University Researchers Supporting Project number (PNURSP2025R826), Princess Nourah Bint Abdulrahman University, Riyadh, Saudi Arabia. The authors extend their appreciation to Northern Border University, Saudi Arabia, for supporting this work through project number (NBU-CRP-2025-2933).
Funding Statement: Princess Nourah Bint Abdulrahman University Researchers Supporting Project number (PNURSP2025R826), Princess Nourah Bint Abdulrahman University, Riyadh, Saudi Arabia. The authors extend their appreciation to Northern Border University, Saudi Arabia, for supporting this work through project number (NBU-CRP-2025-2933).
Author Contributions: The authors confirm contribution to the paper as follows: Conceptualization, Khalil Ibrahim Lairedj, Zouaoui Chama and Amina Bagdaoui; methodology, Samia Larguech, Younes Menni, Nidhal Becheikh, Lioua Kolsi and Badr M. Alshammari; software, Khalil Ibrahim Lairedj; validation, Zouaoui Chama and Amina Bagdaoui; formal analysis, Khalil Ibrahim Lairedj, Samia Larguech and Younes Menni; writing—original draft preparation, Khalil Ibrahim Lairedj, Zouaoui Chama, Amina Bagdaoui, Samia Larguech, Younes Menni, Nidhal Becheikh, Lioua Kolsi and Badr M. Alshammari; writing—review and editing, Khalil Ibrahim Lairedj, Zouaoui Chama, Amina Bagdaoui, Samia Larguech, Younes Menni, Nidhal Becheikh, Lioua Kolsi and Badr M. Alshammari; supervision, Zouaoui Chama, Younes Menni and Lioua Kolsi; project administration, Samia Larguech and Nidhal Becheikh; funding acquisition, Samia Larguech and Nidhal Becheikh. All authors reviewed the results and approved the final version of the manuscript.
Availability of Data and Materials: The BraTS 2020 dataset used in this study is publicly available from the Center for Biomedical Image Computing and Analytics (CBICA) at the University of Pennsylvania. It can be accessed at: https://www.med.upenn.edu/cbica/brats2020/data.html (accessed on 01 January 2025). Use of the dataset complies with the BraTS data usage agreement, and the required references are cited in the manuscript.
Ethics Approval: Not applicable.
Conflicts of Interest: The authors declare no conflicts of interest to report regarding the present study.
References
1. Bauer S, Wiest R, Nolte LP, Reyes M. A survey of MRI-based medical image analysis for brain tumor studies. Phys Med Biol. 2013;58(13):R97–129. doi:10.1088/0031-9155/58/13/R97. [Google Scholar] [PubMed] [CrossRef]
2. Veloz A, Orellana A, Vielma J, Salas R, Chabert S. Brain tumors: how can images and segmentation techniques help?. In: Diagnostic techniques and surgical management of brain tumors. Singapore: InTech; 2011. doi:10.5772/22466. [Google Scholar] [CrossRef]
3. Lairedj KI, Chama Z, Bagdaoui A, Larguech S, Mawuefa Afenyiveh SD, Menni Y. An automatic generalized Gaussian mixture-based approach for accurate brain tumor segmentation in magnetic resonance imaging analysis. AIP Adv. 2025;15(3):035146. doi:10.1063/5.0265407. [Google Scholar] [CrossRef]
4. Joe BN, Fukui MB, Meltzer CC, Huang QS, Day RS, Greer PJ, et al. Brain tumor volume measurement: comparison of manual and semiautomated methods. Radiology. 1999;212(3):811–6. doi:10.1148/radiology.212.3.r99se22811. [Google Scholar] [PubMed] [CrossRef]
5. Ayachi R, Ben Amor N. Brain tumor segmentation using support vector machines. In: Symbolic and quantitative approaches to reasoning with uncertainty. Berlin/Heidelberg, Germany: Springer; 2009. p. 736–47. doi:10.1007/978-3-642-02906-6_63. [Google Scholar] [CrossRef]
6. Rao CS, Karunakara K. Efficient detection and classification of brain tumor using kernel based SVM for MRI. Multimed Tools Appl. 2022;81(5):7393–417. doi:10.1007/s11042-021-11821-z. [Google Scholar] [CrossRef]
7. Pinto A, Pereira S, Correia H, Oliveira J, Rasteiro DMLD, Silva CA. Brain tumour segmentation based on extremely randomized forest with high-level features. In: 2015 37th Annual International Conference of the IEEE Engineering in Medicine and Biology Society (EMBC); 2015 Aug 25–29; Milan, Italy. p. 3037–40. doi:10.1109/EMBC.2015.7319032. [Google Scholar] [PubMed] [CrossRef]
8. Pallavi G, Vidhya K. Brain tumor detection with high accuracy using random forest and comparing with thresholding method. AIP Conf Proc. 2024;2853(1):020079. doi:10.1063/5.0198189. [Google Scholar] [CrossRef]
9. Tie J, Peng H. Multi-level parallel network for brain tumor segmentation. Comput Model Eng Sci. 2024;139(1):741–57. doi:10.32604/cmes.2023.043353. [Google Scholar] [CrossRef]
10. Mut M, Zhang M, Gupta I, Fletcher PT, Farzad F, Nwafor D. Augmented surgical decision-making for glioblastoma: integrating AI tools into education and practice. Front Neurol. 2024;15:1387958. doi:10.3389/fneur.2024.1387958. [Google Scholar] [PubMed] [CrossRef]
11. Anari S, Sadeghi S, Sheikhi G, Ranjbarzadeh R, Bendechache M. Explainable attention based breast tumor segmentation using a combination of UNet, ResNet, DenseNet, and EfficientNet models. Sci Rep. 2025;15(1):1027. doi:10.1038/s41598-024-84504-y. [Google Scholar] [PubMed] [CrossRef]
12. Shaukat Z, Farooq QUA, Tu S, Xiao C, Ali S. A state-of-the-art technique to perform cloud-based semantic segmentation using deep learning 3D U-Net architecture. BMC Bioinform. 2022;23(1):251. doi:10.1186/s12859-022-04794-9. [Google Scholar] [PubMed] [CrossRef]
13. Ballestar LM, Vilaplana V. MRI brain tumor segmentation and uncertainty estimation using 3D-UNet architectures. arXiv:2012.15294v1. 2020. [Google Scholar]
14. Islam M, Vibashan VS, Jose VJM, Wijethilake N, Utkarsh U, Ren H. Brain tumor segmentation and survival prediction using 3D attention UNet. arXiv:2104.00985v1. 2011. [Google Scholar]
15. Li S, Li L. DRT-UNet: a segmentation network for aiding brain tumor diagnosis. Secur Commun Netw. 2022;2022(7):2546466. doi:10.1155/2022/2546466. [Google Scholar] [CrossRef]
16. Zhao L, Ma J, Shao Y, Jia C, Zhao J, Yuan H. MM-UNet: a multimodality brain tumor segmentation network in MRI images. Front Oncol. 2022;12:950706. doi:10.3389/fonc.2022.950706. [Google Scholar] [PubMed] [CrossRef]
17. Ha B, Nguyễn TK, Trần D, Trần NT, Hồ QT, Vũ TT. Development of brain MRI image segmentation program using UNET++ network for radiosurgery planning. Nucl Sci and Tech. 2023;13(1):1–9. doi:10.53747/nst.v13i1.398. [Google Scholar] [CrossRef]
18. Bishop CM. Section 9.2, mixtures of Gaussians. In: Pattern recognition and machine learning. New York, NY, USA: Springer; 2006. p. 430–5. [Google Scholar]
19. Mohamed OMM, Jaïdane-Saïdane M. Generalized Gaussian mixture model. In: 17th European Signal Processing Conference; 2009 Aug 24–28; Glasgow, UK. p. 2273–7. [Google Scholar]
20. Yang MS, Lai CY, Lin CY. A robust EM clustering algorithm for Gaussian mixture models. Pattern Recognit. 2012;45(11):3950–61. doi:10.1016/j.patcog.2012.04.031. [Google Scholar] [CrossRef]
21. Teng Y, Zhang T. The EM algorithm for generalized exponential mixture model. In: 2010 International Conference on Computational Intelligence and Software Engineering; 2010 Dec 10–12; Wuhan, China. p. 1–4. doi:10.1109/CISE.2010.5677272. [Google Scholar] [CrossRef]
22. Nguyen TM, Jonathan Wu QM, Zhang H. Bounded generalized Gaussian mixture model. Pattern Recognit. 2014;47(9):3132–42. doi:10.1016/j.patcog.2014.03.030. [Google Scholar] [CrossRef]
23. Zhang B, Zhang C, Yi X. Competitive EM algorithm for finite mixture models. Pattern Recognit. 2004;37(1):131–44. doi:10.1016/S0031-3203(03)00140-7. [Google Scholar] [CrossRef]
24. Nacereddine N, Tabbone S, Ziou D, Hamami L. L’algorithme EM et le modèle de mélanges de Gaussiennes généralisées pour la segmentation d’images. In: Application au contrôle des joints soudés par radiographie. Paris, France: HAL-Inria; 2009. (In France). [cited 2025 Jan 1]. Available from: https://inria.hal.science/inria-00430930. [Google Scholar]
25. Bakas S, Akbari H, Sotiras A, Bilello M, Rozycki M, Kirby JS, et al. Advancing the cancer genome atlas glioma MRI collections with expert segmentation labels and radiomic features. Sci Data. 2017;4(1):170117. doi:10.1038/sdata.2017.117. [Google Scholar] [PubMed] [CrossRef]
26. Bakas S, Reyes M, Jakab A, Bauer S, Rempfler M, Crimi A, et al. Identifying the best machine learning algorithms for brain tumor segmentation, progression assessment, and overall survival prediction in the BRATS challenge. arXiv:1811.02629. 2018. [Google Scholar]
27. Menze BH, Jakab A, Bauer S, Kalpathy-Cramer J, Farahani K, Kirby J, et al. The multimodal brain tumor image segmentation benchmark (BRATS). IEEE Trans Med Imaging. 2015;34(10):1993–2024. doi:10.1109/TMI.2014.2377694. [Google Scholar] [PubMed] [CrossRef]
28. Ranjbarzadeh R, Keles A, Crane M, Bendechache M. Comparative analysis of real-clinical MRI and BraTS datasets for brain tumor segmentation. IET Conf Proc. 2024;2024(10):39–46. doi:10.1049/icp.2024.3274. [Google Scholar] [CrossRef]
29. Çiçek Ö., Abdulkadir A, Lienkamp SS, Brox T, Ronneberger O. 3D U-Net: learning dense volumetric segmentation from sparse annotation. In: Medical image computing and computer-assisted intervention—MICCAI 2016. Berlin/Heidelberg, Germany: Springer; 2016. p. 424–32. doi:10.1007/978-3-319-46723-8_49. [Google Scholar] [CrossRef]
30. Müller D, Soto-Rey I, Kramer F. Towards a guideline for evaluation metrics in medical image segmentation. BMC Res Notes. 2022;15(1):210. doi:10.1186/s13104-022-06096-y. [Google Scholar] [PubMed] [CrossRef]
31. Taha AA, Hanbury A. Metrics for evaluating 3D medical image segmentation: analysis, selection, and tool. BMC Med Imaging. 2015;15(1):29. doi:10.1186/s12880-015-0068-x. [Google Scholar] [PubMed] [CrossRef]
32. Popovic A, de la Fuente M, Engelhardt M, Radermacher K. Statistical validation metric for accuracy assessment in medical image segmentation. Int J Comput Assist Radiol Surg. 2007;2(3):169–81. doi:10.1007/s11548-007-0125-1. [Google Scholar] [CrossRef]
Cite This Article
 Copyright © 2025 The Author(s). Published by Tech Science Press.
This work is licensed under a Creative Commons Attribution 4.0 International License , which permits unrestricted use, distribution, and reproduction in any medium, provided the original work is properly cited.
 Downloads
 Citation Tools