
 Submit a Paper
 Propose a Special lssue
 Open Access
ARTICLE

CEOE-Net: Chaotic Evolution Algorithm-Based Optimized Ensemble Framework Enhanced with Dual-Attention for Alzheimer’s Diagnosis
1 Center for Medical Genetics, Central South University, Changsha, 410083, China
2 School of Computer Science and Engineering, Central South University, 932 Lushan S Rd, Yuelu District, Changsha, 410083, China
* Corresponding Authors: Saif Ur Rehman Khan. Email: ; Chao Chen. Email:
Computer Modeling in Engineering & Sciences 2025, 145(2), 2401-2434. https://doi.org/10.32604/cmes.2025.072148
Received 20 August 2025; Accepted 22 October 2025; Issue published 26 November 2025
 View Full Text
 Download PDF
Abstract
Detecting Alzheimer’s disease is essential for patient care, as an accurate diagnosis influences treatment options. Classifying dementia from non-dementia in brain MRIs is challenging due to features such as hippocampal atrophy, while manual diagnosis is susceptible to error. Optimal computer-aided diagnosis (CAD) systems are essential for improving accuracy and reducing misclassification risks. This study proposes an optimized ensemble method (CEOE-Net) that initiates with the selection of pre-trained models, including DenseNet121, ResNet50V2, and ResNet152V2 for unique feature extraction. Each selected model is enhanced with the inclusion of a channel attention (CA) block to improve the feature extraction process. In addition, this study employs the Short Time Fourier transform (STFT) technique with each individual model for hierarchical feature extraction before making final predictions in classifying MRI images of dementia and non-demented individuals, considering them as backbone models for building the ensemble method. STFT highlights subtle differences in brain structure and activity, particularly when combined with CA mechanisms that emphasize relevant features by converting spatial data into the frequency domain. The predictions generated from these models are then processed by the Chaotic Evolution Optimization (CEO) algorithm, which determines the optimal weightage set for each backbone model to maximize their contribution. The CEO optimizer explores weight distribution to ensure the most effective combination of model predictions for enhancing classification accuracy, thus significantly improving overall ensemble performance. This study utilized three datasets for validation: two private clinical brain MRI datasets (OSASIS and ADNI) to test the proposed model’s effectiveness. Image augmentation techniques were also employed to enhance dataset diversity and improve classification performance. The proposed CEOE-Net outperforms conventional baseline models and existing methods by showing its effectiveness as a clinical tool for the accurate classification of dementia and non-dementia MRI brain images, as well as autistic and non-autistic facial features. It achieved consistent accuracies of 93.44% on OSASIS and 81.94% on ADNI.Keywords
Alzheimer’s disease (AD) is a progressive and irreversible brain disorder that deteriorates brain cells over time, leading to significant memory loss, cognitive impairment, and ultimately the inability to carry out basic daily tasks, resulting in a loss of independence [1,2]. This condition often initiates gradual memory impairment by disproportionately affecting older adults. As the disease progresses, patients can struggle with confusion, speech difficulties, and challenges in performing daily tasks [3]. The advancement in AD brings a wide range of symptoms, including disorientation, inability to recognize familiar people, and difficulty with basic activities [4]. Diagnosing AD presents significant challenges and often requires considerable time. On average, it takes approximately 2.8 years to diagnose cases that develop later in life and about 4.4 years for cases that appear earlier [5]. Early diagnosis is critical, as it not only enhances treatment outcomes but also has the potential to lower healthcare costs. This allows patients to benefit from specialized care by assisting them in maintaining their independence for longer periods. Recently, diagnostic methods for AD have included advanced imaging techniques such as Magnetic Resonance Imaging (MRI), Computed Tomography (CT), Positron Emission Tomography (PET), and Electroencephalography (EEG) scans [6]. These methods enable the identification of specific structural or functional changes in the brain, particularly in areas such as the hippocampus that are vital to memory processing [7]. Such imaging methods provide essential insights into brain morphology, which is central to assessing disease progression. MRI scans are especially valuable as they provide high spatial resolution and reveal critical features that assist clinicians in accurately diagnosing AD [8]. Although some treatments can provide temporary relief for AD symptoms, there is currently no effective therapy that can change the progression of this disease in the brain [9]. Research in neuroimaging and AI continues to enhance diagnostic capabilities, but the demand for effective intervention strategies remains high [10]. Recent advancements in brain imaging have been instrumental in enhancing diagnosis, as MRI scans can now reveal fine structural details that allow specialists to detect significant signs of the disease more accurately. The economic impact of AD is projected to rise significantly with the expected growth of low- and middle-income countries [11].
Recent research has initiated examining distinctive facial features as possible markers for early detection of AD disease, especially in younger populations [12]. These facial characteristics can share neurodevelopmental patterns connected to AD by providing insights into early-stage identification. Researchers are investigating diagnostic indicators that can reveal initial signs of AD in children by detecting specific facial anomalies or expression patterns [13]. Although still in the early stages, this approach indicates that non-invasive facial analysis can play a valuable role in enhancing early AD diagnosis across diverse age groups. This growing number of cases highlights an urgent need for both improved early detection and broader impact of AD on individuals and society [14]. Addressing this challenge is crucial, as the impact of AD is expected to grow significantly, making the development of effective diagnostic tools and treatment options a top priority in the field. Developing tools and algorithms to classify structural MRI data and distinguish brain disorder patterns from healthy ones has been a key area of interest for clinicians. Machine learning (ML) models for identifying AD assist healthcare professionals in accurate diagnosis [15]. A convolutional neural network (CNN) is an advanced deep learning (DL) architecture that processes MRI data to accurately distinguish Alzheimer’s-affected brains from healthy ones, resulting in a highly reliable predictive model [16]. With the integration of AI algorithms, diagnostic accuracy and efficiency in AD detection have significantly improved. These advanced technologies address the limitations of traditional cognitive tests by playing an essential role in enhancing the precision of medical assessment. Advanced DL models are increasingly applied in diagnosing a range of diseases with diverse medical data, including mpox [17], cervical cancer [18], oral cancer [19], and particularly in neurodegenerative disorders such as Alzheimer’s disease [20]. The complexity of diverse medical data frequently requires combining features from multiple models, as a single model is often insufficient to capture complex features for comprehensive analysis [21]. In addition, image fusion through transformation techniques allows the integration of different imaging modalities, providing a more comprehensive view of Alzheimer’s-related changes in the brain [22]. These methods enhance diagnostic accuracy and provide deeper insights, supporting clinicians in making more reliable and informed diagnosis by leveraging both image and feature fusion.
1.1 Motivation and Major Contributions
Efficient handling of dementia disease depends on the accurate detection of conditions such as hippocampal atrophy and cortical thinning in brain MRI scans. Early and accurate diagnosis is essential for optimal treatment outcomes. Traditional manual diagnostic methods, however, are complex and error-prone. These conventional approaches can result in misdiagnoses where minor, but critical signs of dementia can be missed or wrongly interpreted, leading to treatment strategies that can adversely affect patient health. In addition, the labor-intensive nature of manual evaluations, alongside the limitations of less advanced CNNs, can delay essential intrusions. This allows the progression of diseases such as Alzheimer to advance outside control, further complicating the diagnosis. Therefore, there is an urgent demand for more precise and efficient diagnostic tools. AI-based CAD systems have the potential to significantly enhance diagnostic accuracy while reducing the burden on healthcare professionals. This study introduces a new framework aimed at reducing the errors caused by humans by making the diagnostic process more efficient, which can enhance patient care and enable timely, effective interventions for managing dementia. The key contributions of this study are outlined as follows.
• It develops an effective optimized ensemble method by leveraging image fusion techniques, selection of deep CNN models, a dual-attention mechanism, and a chaotic evolution algorithm. This approach aims to achieve the maximum performance of the ensemble method and reduce the misclassification rate.
• This research implements image fusion methods by combining CLAHE (Contrast Limited Adaptive Histogram Equalization) and GAMMA adjusted with an alpha value of 0.5 to enhance MRI brain scans. This method enhances contrast and detail resolution, which is crucial for differentiating between dementia and non-dementia cases, thus improving the analysis and visualization of brain structures. The goal is to lower the misclassification rates in Alzheimer’s diagnosis.
• The proposed Ensemble methods initiate with the selection of well-performing Deep CNN models, including DenseNet121, ResNet50V2, and ResNet152V2 for robust feature extraction. These models are further enhanced through the inclusion of a designed attention mechanism to refine the extraction of features and focus on the most crucial features. After that, the Short Time Fourier Transform is used with each backbone model before the usage of the final classification layer. This step enhances the capability of models to capture temporal features, which is beneficial for improving the classification accuracy.
• The novelty of this research lies in maximizing the contribution of each backbone model within the ensemble method. Prior approaches assigned manual weightage to each model based on accuracy, but this method does not fully utilize the strengths of each model. Hence, this research employs a chaotic evolution algorithm (CEA) that dynamically searches for the optimal set of weightage vectors assigned to each backbone model. In this way, it can fully utilize the strengths of each model within the proposed optimized ensemble method.
• This study validated the proposed model using three datasets: two private clinical brain MRI datasets (OSASIS and ADNI) and one public dataset of autistic children’s faces (Appendix A). The model achieved consistent accuracies of 93.44% on OSASIS, 81.94% on ADNI, and 92.09% on the autistic children’s faces dataset.
1.2 Organization of the Manuscript
This paper is organized as follows: Section 2 will comprise a review of the relevant literature on Alzheimer’s diagnosis methods. Section 3 outlines the methodological framework, including dataset details. Section 4 presents experimental outcomes and analysis. Finally, Section 5 concludes the manuscript with key findings and future directions.
Recent studies highlight the effectiveness of CNNs in classifying AD with high accuracy using MRI brain data. Researchers have explored various DL models trained on large and diverse MRI datasets, specifically for AD detection [23]. CNNs have shown robust performance across independent test sets, including widely used datasets such as OASIS MRI Brain. Some studies also apply these models to related neurological conditions, such as autism spectrum disorder (ASD), further demonstrating the adaptability and precision of CNNs in neurological disease classification. Transfer learning (TL) techniques have been utilized in several studies to significantly improve the performance of the model while reducing overfitting [24]. Ntampakis et al. [25] classified demented and non-demented patients by processing brain MRI scans. They focused on key regions using the OASIS dataset and employed three DL models to enhance decision accuracy. Their approach was validated on the Alzheimer’s Disease Neuroimaging Initiative (ADNI) dataset, demonstrating robust performance and confirming its clinical applicability. Vo et al. [26] developed MNA-net, an attention-based CNN that predicts the progression from normal cognition to AD. Their model enhances the fusion of MRI and PET images beyond the simple concatenation used in prior studies. It demonstrated its effectiveness by achieving an accuracy of 83% on the OASIS-3 dataset, showing its potential in detecting early cognitive decay. Study [27] proposed a computer-aided system for diagnosing autism spectrum disorder (ASD) through facial image analysis. The model achieved an accuracy of 86.2% using an SVM classifier to differentiate between ASD and typically developing (TD) groups. Their approach demonstrates potential for advancing early and accessible ASD diagnosis with technical precision in facial analysis. Atlam et al. [28] aimed to improve ASD diagnosis by analyzing facial morphology through a dataset of facial images. The study achieved an accuracy of 88.61%, demonstrating that the choice of algorithms for facial detection and landmark identification significantly impacts the classification performance, especially when training data is limited. Odusami et al. [29] presented a feature fusion model that integrates MRI and PET imaging data to enhance AD detection. Applying a modified ResNet18 architecture on the ADNI database, the model extracts critical features from the combined data by achieving an accuracy of 73.90%. Their method highlights the potential of MRI and PET integration for more effective early diagnosis of AD. Mujeeb Rahman and Subashini [30] introduced a model for ASD detection using facial images by employing five pre-trained CNNs with a DNN for classification. Testing on the Kaggle autistic children dataset, the Xception model showed the highest diagnostic potential. Alam et al. [31] employed several deep CNN-based TL methods to detect ASD in children using facial images as biomarkers. The modified Xception model demonstrated the highest accuracy, indicating its potential as a reliable tool to support doctors in early [32] ASD diagnosis. Pavithra et al. [33] proposed a method for ASD detection that utilizes brain imaging data from the Autism Brain Imaging Data Exchange (ABIDE) to analyze functional connectivity in resting-state fMRI data. Their study employs the Synthetic Minority Over-sampling Technique (SMOTE) to balance the dataset and compare classification performance between RCNN and CNN models. The RCNN model achieved the highest accuracy, reaching approximately 85%. Alkahtani et al. [34] proposed a system for early ASD detection by analyzing facial landmarks in children, utilizing DL models. Their model was evaluated using a dataset of 2940 facial images from Kaggle, achieving a top accuracy of 92% with MobileNetV2. Akter et al. [35] introduce an enhanced TL framework for early ASD detection by analyzing facial markers in images of children from the Kaggle repository. The authors improved the MobileNet-V1 model and achieved 92.10% accuracy when applied to ASD subtypes using k-means clustering.
The proposed methodology utilized to identify dementia and non-dementia classes using brain MRI image samples is described in this section. This study presents a set of prerequisites intended to ensure a precise diagnosis. An extensive collection of brain MRI images from patients with and without dementia serves as the basis for the proposed framework. This study employs a novel image fusion strategy combining CLAHE and Gamma for feature fusion, thus enhancing dementia detection. After that, a thorough data preprocessing step is conducted, which includes crucial tasks such as resizing (224 × 224) MRI images and scaling the input images to a standardized form. Data augmentation, channel attention mechanisms, and Short-Time Fourier Transform are applied to increase dataset diversity and boost model robustness. This approach enhances the extraction of key features from dementia MRI images, improving the performance of models.
Alzheimer’s disease poses a major public health challenge [36,37], where early detection is essential for timely intervention and effective management. Utilizing MRI brain images enables the identification of specific neural changes associated with the disease, facilitating timely diagnosis and personalized treatment strategies. This study utilizes the MRI brain images from the Open Access Series of Imaging Studies (OASIS) database (https://www.oasis-brains.org/). It must formally request permission for the usage of this dataset exclusively for research purposes to access the OASIS database. The application should include a detailed description of these research objectives and how the OASIS data will contribute to the research study. After the approval by the OASIS management team, the dementia MRI brain dataset is collected. Fig. 1 displays sample images of brain MRI for both dementia and non-demented individuals, with each category for the training and test sets.
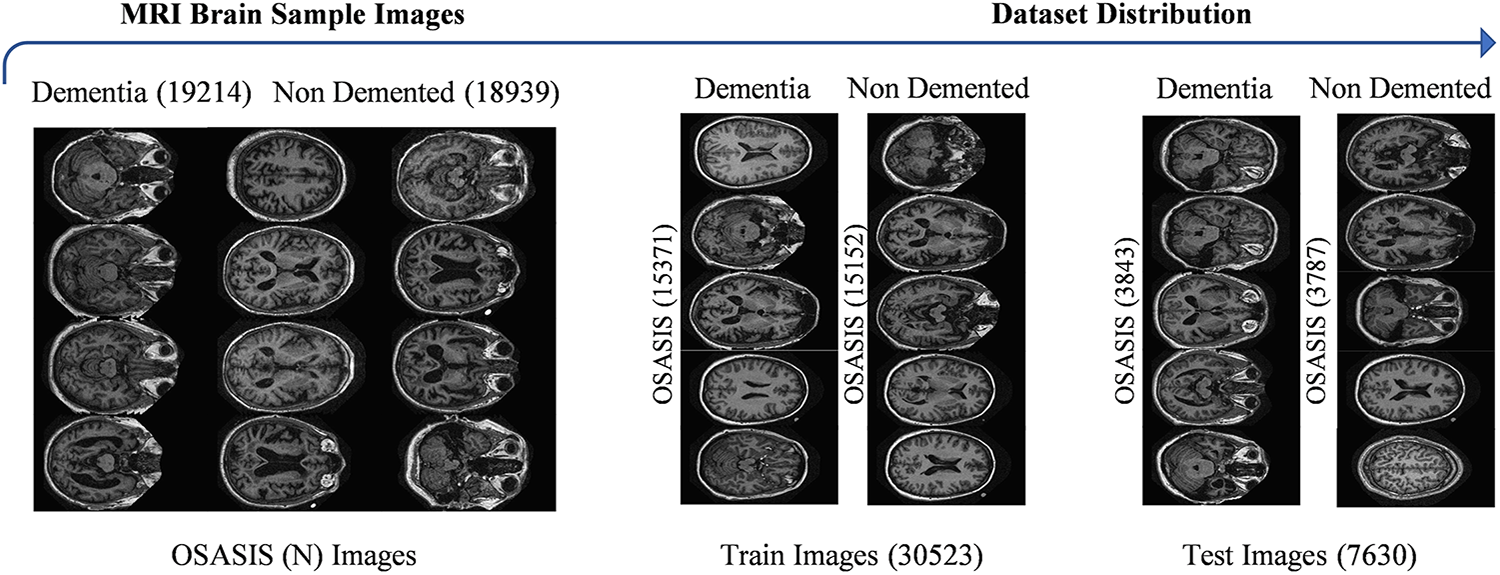
Figure 1: Visualization of the OSASIS Brain MRI dataset sample images
3.2 CLAHE-Gamma Fusion Image Technique
Dementia and Non-dementia MRI brain fused images utilizing techniques such as CLAHE and GAMMA enhance the visibility of subtle features in MRI scans, making it easier to identify hippocampal atrophy and cortical thinning associated with dementia. These methods improve contrast and detail in areas that can be overlooked by facilitating more accurate differentiation between dementia and non-dementia cases. Enhanced image quality supports effective feature extraction, which is crucial for developing reliable diagnostic tools and monitoring disease progression. Fig. 2 provides a detailed visualization of the CLAHE-Gamma Fusion Image Technique.

Figure 2: Visualization of CLAHE-Gamma fusion procedure with sample images
The algorithm for image fusion outlined above combines two processed images (MC1 and MG1) using wavelet decomposition as illustrated in Fig. 3. First, both images are ensured to have the same dimensions. The images are then decomposed into wavelet coefficients using the wavedec2 function, which applies a chosen wavelet transform to break down the images into multiple frequency bands. The fusion is performed by iterating over the different levels of wavelet coefficients, where the fusion method, such as mean, min, or max, is applied to the coefficients at each level. Specifically, for the first level, the fusion method is set to the mean of the corresponding coefficients from MC1 and MG1, and for the subsequent levels, the method is applied to each frequency band (c1, c2, and c3). After the fusion of coefficients at all levels, the fused image is reconstructed by performing the inverse wavelet transform (IWT) on the fused coefficients. The image is normalized, adjusting its pixel values to the standard range of [0, 255] by making it suitable for further processing. Finally, the fused image is saved as the output. This method effectively combines the complementary features of the two input images while maintaining the crucial information from both types of images.

Figure 3: Flowchart diagram for proposed fused image model
MRI sequences should be preprocessed before subsequent steps to improve MRI image quality and ensure consistency in the dementia and non-dementia class datasets. This stage is essential for removing noise and emphasizing the different dementia and non-dementia MRI attributes, such as Dementia MRI typically shows hippocampal atrophy and cortical thinning, while non-dementia MRI appears normal or can show age-related changes without significant volume loss, which are essential for effective feature extraction. The accuracy and robustness of the model are increased by processing the images prior to model training, which enhances the diagnostic performance in identifying and categorizing dementia in the MRI brain. In this stage, all MRI brain images were resized to a standard size of 224 × 224 pixels, making them compatible with the pretrained model. This resizing helps ensure consistency across the dataset, which can improve model performance. Next, the MRI images were rescaled to a range of zero to one. This normalization aids in stabilizing the training process and can lead to faster convergence. This study employed data augmentation techniques, including vertical and horizontal flipping, to enhance the generalizability of models. This augmentation increases the diversity of training samples by helping to avoid model overfitting. Fig. 4 illustrates the visualization of the image preprocessing phase.

Figure 4: Visualization of dataset preprocessing sample images
3.4 Convolutional Neural Networks for Feature Extraction
The CNN models revolutionized the field of medical imaging with their ability to automatically extract complex features from images. Unlike conventional methods that often rely on manual feature selection, CNNs can learn hierarchical patterns through multiple layers of processing. This automated feature extraction capability makes them particularly effective for analyzing medical images such as X-rays, MRIs, and CT scans, where subtle differences can be critical for accurate diagnoses. CNNs can detect complex structures and anomalies by enabling them to recognize and classify various medical conditions efficiently by employing convolutional layers. Their implementation in medical imaging not only improved the diagnostic performance but also plays a key role in the early detection of diseases. For instance, in the detection of cancers or neurological disorders, CNNs can highlight crucial indicators that can be overlooked by the human observer. These CNNs operate through a multi-layered architecture, with each layer designed for specific functions to perform distinct operations that enhance the ability of the network to extract critical features from medical images. Diagnostic accuracy is enhanced by resulting in improved patient outcomes and a more efficient healthcare system by leveraging CNNs.
Baselines Selection Criteria and Procedure
Initially, a systematic approach was employed to ensure that the selected baselines were both robust and capable of delivering high performance in different dementia and non-dementia MRI attributes. This study considered 13 widely adopted pre-trained models [38] that have been frequently utilized in the literature [39] for medical image classification to establish a fair comparison. These models were chosen due to their proven effectiveness, availability of pre-trained weights, and ability to generalize across diverse datasets. During the preliminary evaluation, each of the 13 models was fine-tuned and assessed on the OASIS collected dataset. The evaluation metrics included accuracy and F1-score, which provided a comprehensive measure of predictive performance. Among the evaluated models, DenseNet121, ResNet50V2, and ResNet152V2 consistently outperformed the others, demonstrating superior classification accuracy and balanced trade-offs between complexity and effectiveness. Based on these results, DenseNet121, ResNet50V2, and ResNet152V2 were selected as the baselines for subsequent experimental analysis. This selection ensures that the comparative framework is grounded in strong, state-of-the-art architectures while also maintaining methodological rigor by relying on systematic evaluation rather than arbitrary choice.
3.4.1 DenseNet121 Architecture
It is a specialized version of the Dense Convolutional Network (DenseNet) that achieves architectural efficiency by reducing redundant feature learning. It connects each layer to the next in a sequential feed-forward manner by allowing the learned features to be reused and minimizing the vanishing gradients issues. This design improves both the training stability and performance. The DenseNet121 architecture consists of dense blocks comprising convolutional layers, batch normalization, and ReLU activations. Bottleneck and transition layers are integrated between these blocks by ensuring that the model remains efficient to avoid an exponential increase in feature maps to manage the expansion of feature maps. With roughly 8 million parameters and a file size of 33 MB, DenseNet121 achieves a balance between high performance and minimal computational expense for scenarios needing rapid and cost-effective training. The structure of DenseNet121 is depicted in Fig. 5.
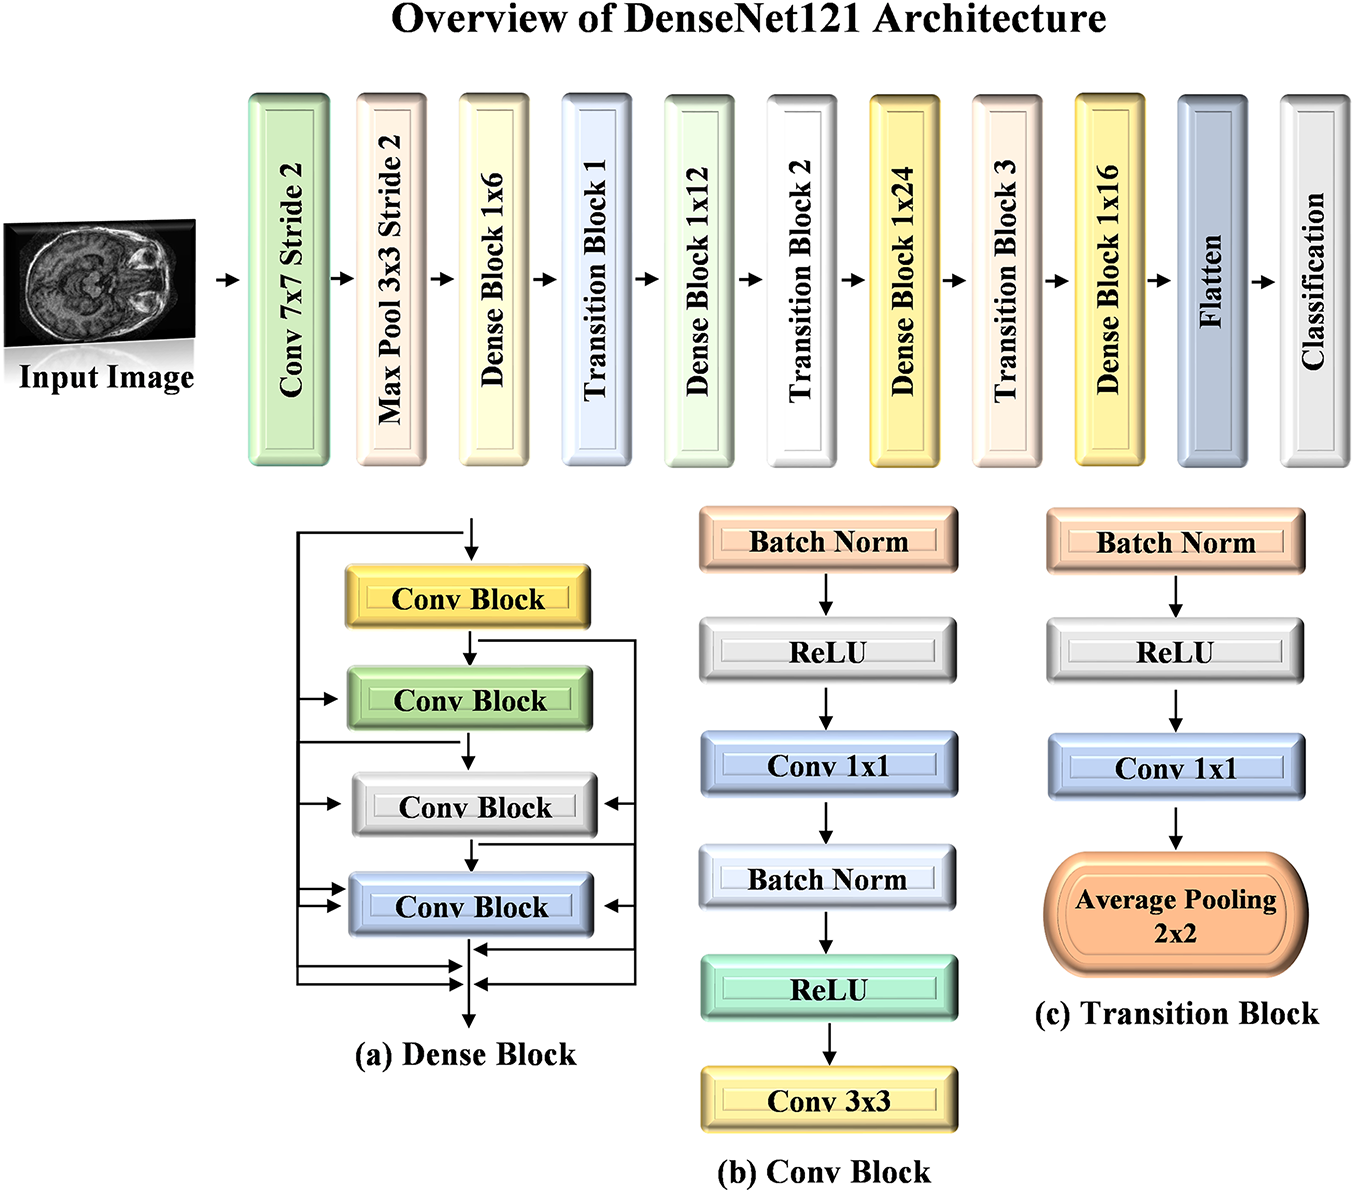
Figure 5: Architecture visualization of DenseNet121 model
The ResNet50V2 [40] architecture is a refined version of the original ResNet50 model, which is designed to enhance performance through improved residual learning. This model comprises 50 layers by incorporating convolutional and identity shortcut connections that facilitate the training of deeper networks. ResNet50V2 employs a pre-activation design, where the batch normalization and ReLU activation occur before the weight layers. This approach mitigates the vanishing gradient problem by allowing for more effective training and better feature extraction. The architecture is particularly effective for image classification tasks by demonstrating robust performance across various datasets. The workflow diagram of ResNet50V2 is detailed in Fig. 6.
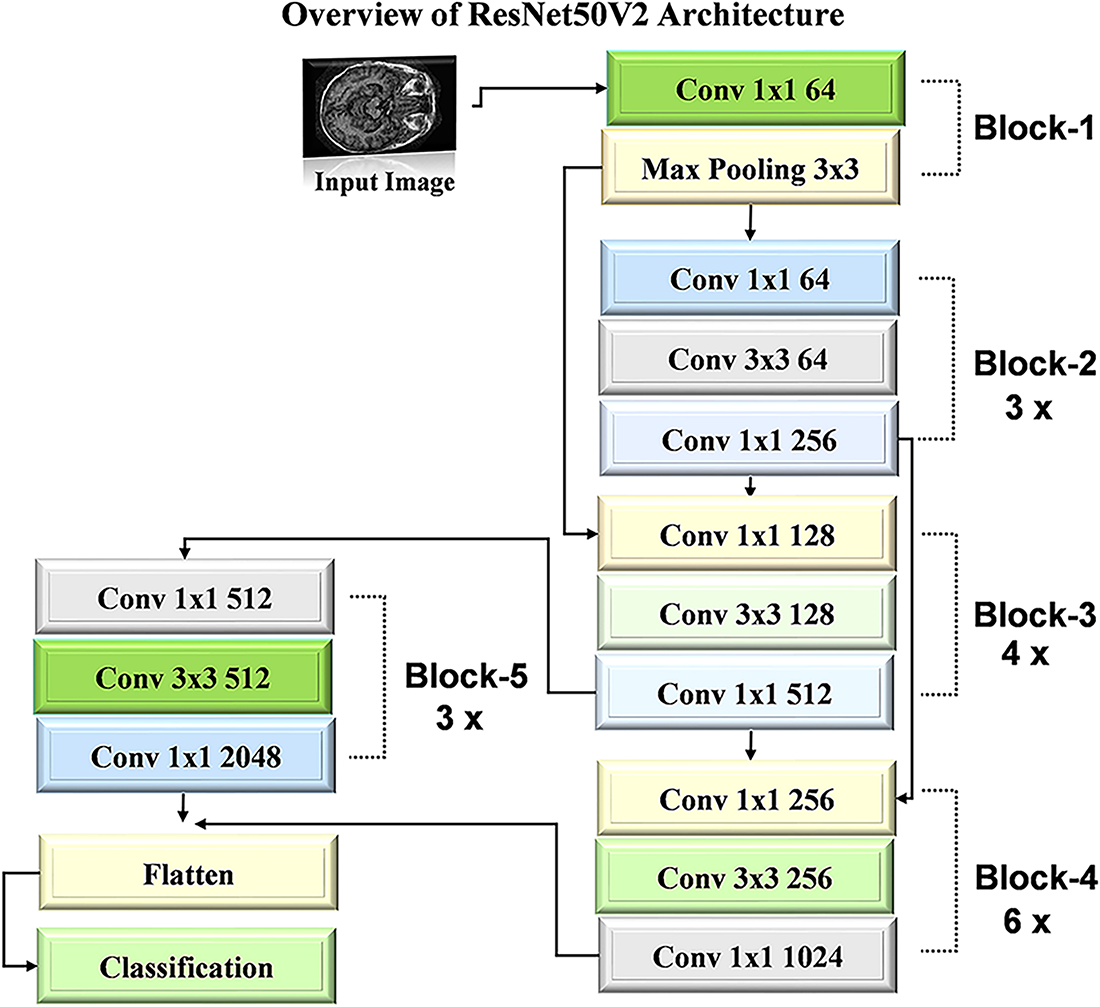
Figure 6: Architecture visualization of ResNet50V2 model
3.4.3 ResNet152V2 Architecture
ResNet152V2 [41] builds upon the deep residual learning framework established in earlier ResNet models, aiming to provide both greater depth and improved efficiency for complex image recognition tasks. With its 152 layers, this model achieves high accuracy within the ResNet family and is preferred over deeper models such as VGG16 and VGG19 due to its relatively lower complexity despite its considerable depth. Although it is a very deep network, it maintains strong performance by using residual connections, which allow information to pass from earlier layers to subsequent layers without losing gradient strength. A key enhancement in ResNet152-V2 involves placing the batch normalization (BN) layer and ReLU activation before each weight layer. This configuration improves training stability, reduces overfitting, and facilitates smoother gradient flow. Therefore, it enhances convergence speed and model accuracy. Fig. 7 illustrates the architecture diagram of the ResNet152V2 model.
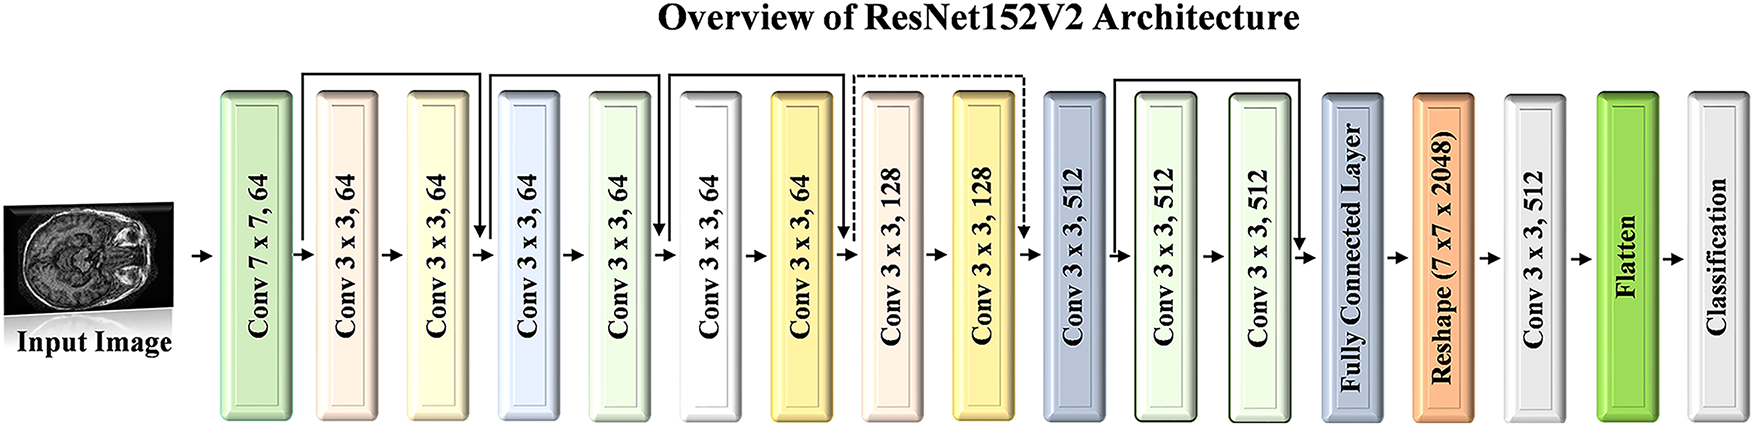
Figure 7: Architecture visualization of ResNet152V2 model
3.5 Chaotic Evolution Optimization (CEO)
This section presents a detailed mathematical formulation for the Chaotic Evolution Optimization (CEO) algorithm [42]. The overall structure of the CEO follows a similar approach to Differential Evolution (DE) by incorporating mutation, crossover, and selection mechanisms. The primary distinction lies in the mutation operation, where the CEO employs a two-dimensional discrete memristive hyperchaotic map to determine the mutation trajectory for each member of the population.
Step 1. Population Initialization
The optimization process for the CEO initiates by defining a population of candidate solutions, where each solution consists of three parameters that need to be optimized. These parameters represent the variables under consideration for optimization. The population is initialized by randomly selecting values for each parameter within specific bounds, typically between 0 and 1 to provide an initial set of potential solutions from which the optimization process can evolve.
• The population size P_N is set to 100, representing the total number of candidate solutions in the population.
• The number of chaotic samples is set to 50, which determines how many chaotic candidates are generated during the mutation phase.
• The optimization problem involves three models with specified lower and upper bounds:
Step 2. Fitness Function
The fitness function is based on the accuracy of the ensemble approach, which evaluates the performance of the candidate solutions. In this approach, predictions are generated from three individual models, which are denoted as
where
• The ensemble technique integrates the weighted predictions to produce the final class labels.
• Finally, the fitness function
The weight vector
Step 3. Mutation Operation
The CEO is a population-based evolutionary algorithm, which applies a standardized set of search criteria to guide its mutation operations:
where
where
At this stage,
where
where
where
Step 4. Crossover operation
Following the mutation phase, a binomial crossover operator is applied to the pairs
For each dimension
where
Step 5. Selection Operation
Once the trial vectors
Similarly, the selection rule for
where
3.6 Channel Attention Block for Attention
The performance of DL models [43,44], especially in applications such as the categorization of MRI images for dementia and non-dementia, is enhanced with Channel Attention (CA) mechanisms. This CA selects and highlights relevant channels in the feature maps for each class. CA techniques improve the model’s capacity to concentrate on the most significant features. CA blocks primarily serve to increase the representational power of the CNN [45,46] model by shifting the model’s focus to the most optimal channels and reducing the influence of less important ones. The model can extract the most relevant MRI feature for precise dementia and non-dementia categorization with adaptive fix of channel weights, which increases diagnostic precision. The function of CA is much more crucial in medical imaging applications such as dementia detection.
This study employed the CA module in conjunction with each DL model by demonstrating promising results for classifying dementia and non-dementia images. In the context of dementia diagnosis, CA blocks enhance the sensitivity of models to subtle differences between regions affected by dementia and healthy brain tissue. CA facilitates the detection of early neurodegeneration signs that can otherwise be overlooked by highlighting the most critical brain regions. For non-dementia cases, CA refines the capability of models to differentiate between healthy and non-demented individuals by focusing on the relevant features indicative of normal brain structures. The adoption of CA mechanisms in the proposed approach leads to more accurate and robust classification by providing significant potential for enhancing the early detection of dementia and other neurodegenerative conditions. Ultimately, the use of CA not only improves the performance of models but also contributes to better clinical outcomes [47,48] by providing more reliable and interpretable diagnostic results for subsequent steps. Fig. 8 illustrates the overview of the CA Block.
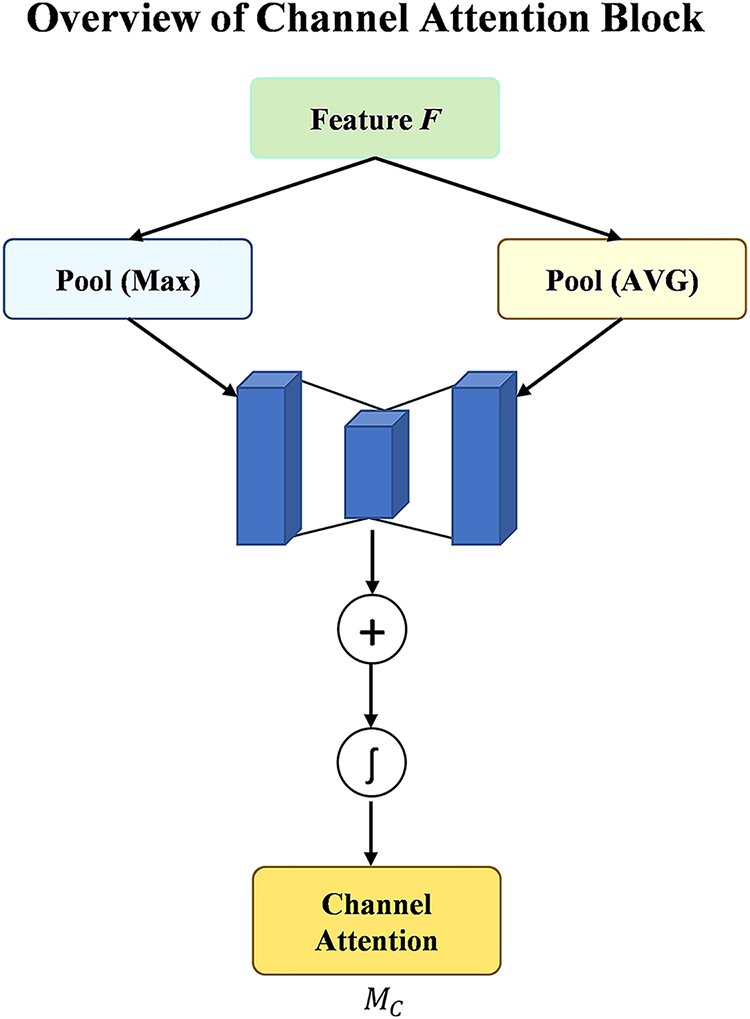
Figure 8: Architecture visualization of channel attention block
3.7 Short-Time Fourier Transformed-STFT
The STFT enhances feature extraction by transforming spatial MRI features into hierarchical frequency extraction, allowing the capture of both temporal and spectral features critical for detecting subtle changes in brain structure and function, which is highlighted by the CA block. In addition, it provides robustness to noise and complexity commonly present in MRI brain images, focusing on significant frequency components while filtering out irrelevant disturbances, improving the reliability of classification outcomes. In addition to this, STFT enables the analysis of temporal dynamics, which is essential for monitoring the progression of neurodegenerative diseases, as it highlights evolving patterns in brain alterations that can facilitate earlier intervention and better-targeted therapies.
This study employs the STFT technique before making a final prediction in the analysis of hierarchical feature extraction, making it particularly effective in the classification of MRI images for dementia and non-demented individuals. STFT allows for the extraction of hierarchical features that can reveal subtle differences in brain activity and structure between the two groups by transforming the spatial data from the MRI scans into the frequency domain. This transformation is especially valuable in medical imaging, where the spatial relationships and frequency components of the MRI image can provide critical insights into the presence of neurodegenerative changes. When applied after CA mechanisms, STFT benefits from the enhanced focus on relevant features, ensuring that the frequency analysis emphasizes the most informative aspects of the MRI images. Integrating STFT into the classification pipeline following CA mechanisms facilitates a more nuanced understanding of the underlying patterns in dementia-related changes in the brain. The frequency domain representation generated by STFT can highlight variations in texture and hierarchical feature complexity that are indicative of early neurodegeneration. This dual approach, using CA to prioritize essential features and then applying STFT to analyze those features in the frequency domain, enables the development of more robust classifiers. The combination enhances the model’s ability to differentiate between dementia and non-demented MRI images, ultimately leading to improved diagnostic precision. The classification process is refined for providing clinicians with deeper insights into the underlying neurophysiological changes associated with dementia, utilizing STFT in conjunction with CA, thus contributing to better patient management and outcomes.
3.8 Overview of the Proposed CEO Based Ensemble Method
This section presents a detailed description of the proposed optimized ensemble method for the categorization of dementia and non-dementia, as illustrated in Fig. 9. Preprocessing is a crucial step to improve the quality of MRI images and ensure consistency within the dementia and non-dementia datasets before model training. This stage involves noise removal and emphasizes key features in dementia MRI. All MRI images were standardized to a size of 224 × 224 pixels to ensure compatibility with the selected top-performing models, such as DenseNet121, ResNet50V2, and ResNet152V2, which aids in maintaining dataset uniformity and improving model performance. In addition, the images were rescaled to a range of 0–1 by facilitating a more stable training process and enhancing convergence. Data augmentation strategies such as vertical and horizontal flipping were implemented, which expand the variety of the training dataset and help to prevent overfitting to further improve the model’s robustness. In the subsequent stage, utilizing pre-trained DenseNet121, ResNet50V2, and ResNet152V2 models for feature extraction significantly enhances performance in classifying dementia and non-dementia MRI images. These models are pre-trained on large, diverse datasets to capture complex patterns and relationships within images, making them ideal for MRI brain image analysis. This study employs CA mechanisms with each of the selected models to further refine the extraction of features for differentiating dementia-affected brain regions while refining the ability to distinguish healthy structures in non-dementia cases. The integration of CA leads to more accurate and robust classifications by facilitating early detection of neurodegenerative conditions and contributing to better clinical outcomes. In addition, this study also employs the STFT technique with each individual model for hierarchical feature extraction before making final predictions in classifying MRI images of dementia and non-demented individuals. STFT highlights subtle differences in brain structure and activity, particularly when combined with CA mechanisms that emphasize relevant features by converting spatial data into the frequency domain. This dual approach enhances the ability of models to differentiate between dementia and non-demented MRI images for improving diagnostic accuracy and providing clinicians with valuable insights into neurophysiological changes associated with dementia. The predictions generated from each of the three backbone models are fed into the CEO algorithm to perform an optimization task. The CEO algorithm searches for an optimal weightage vector to assign appropriate weightage to each model within the proposed method.
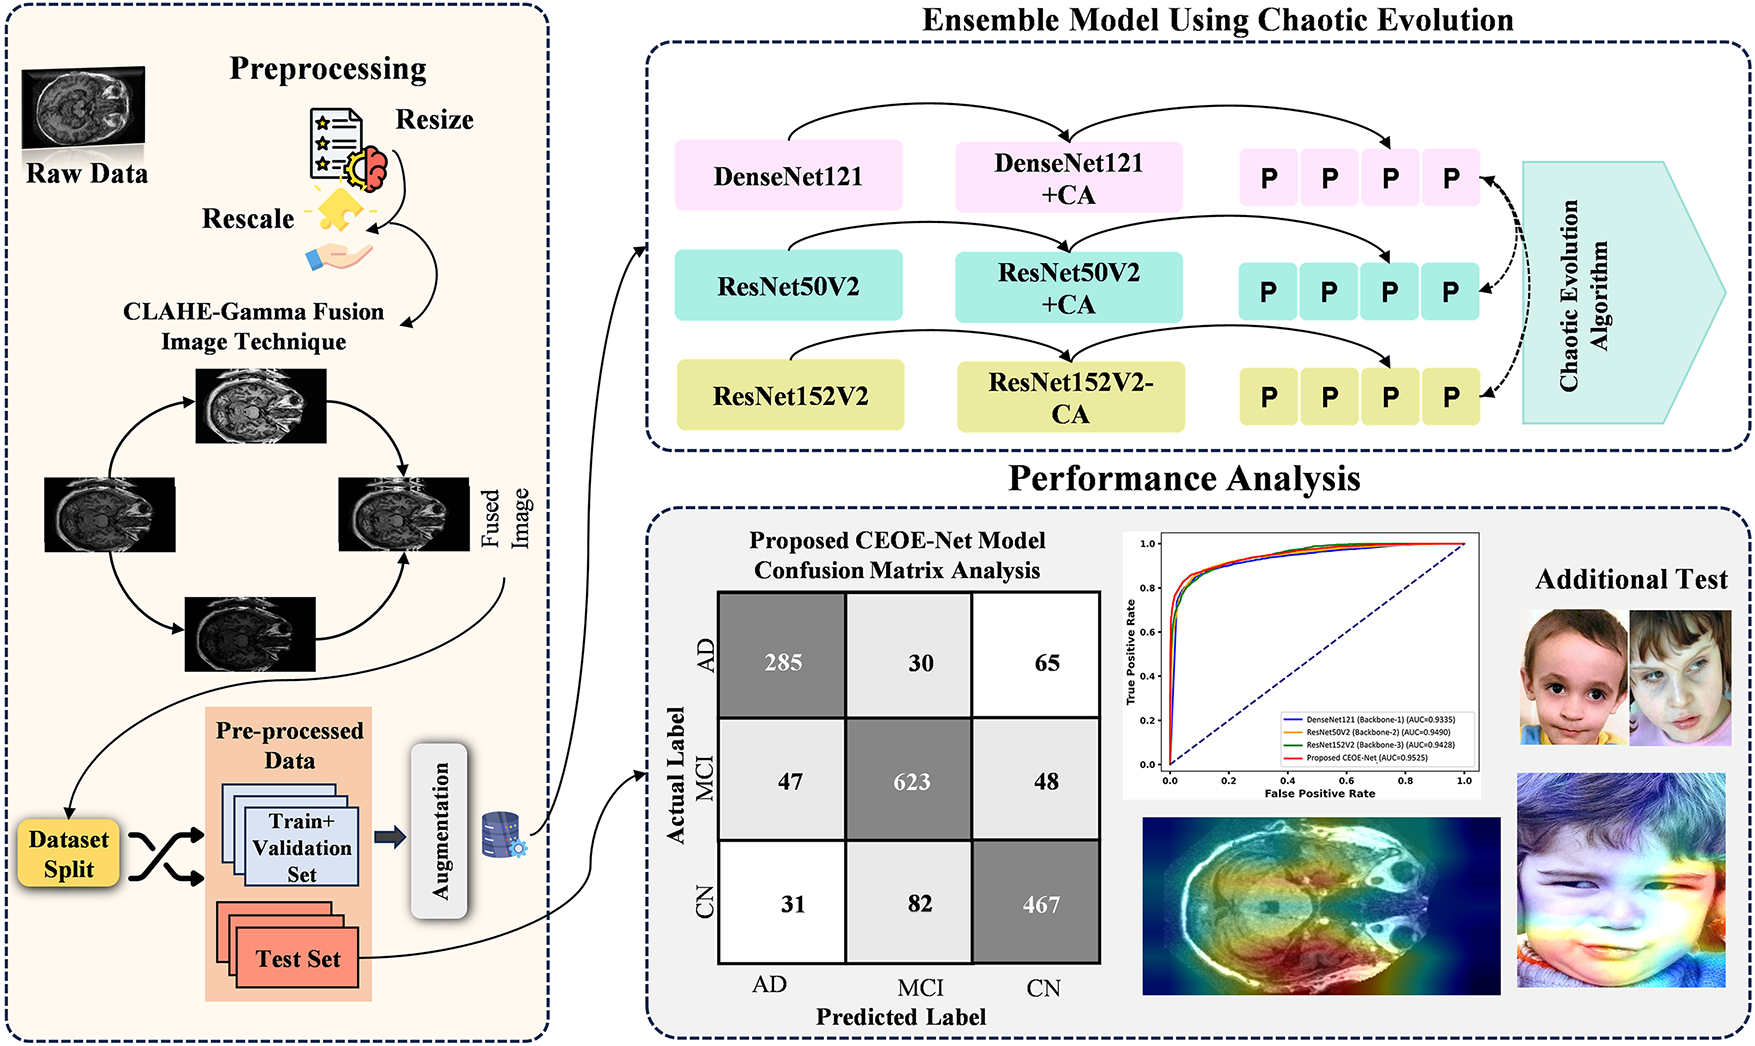
Figure 9: Overview of novel proposed chaotic evolution architecture
The final stage of the methodology involves a detailed performance evaluation. The metrics described in Section 4 allow for a comprehensive assessment of the proposed model. A confusion matrix displays classification accuracy across different categories by aiding in the identification of misclassifications for highlighting the strengths and weaknesses of various models. Gradient-weighted Class Activation Mapping (Grad-CAM) determines the areas of focus within the images during prediction, providing insight into the decision-making process of models. In addition, statistical tests such as McNemar’s Chi-Square Test are utilized to determine the significance of the results. This test evaluates the differences between paired predictions to confirm their statistical validity for ensuring reliable performance comparisons. This approach establishes a robust framework for validating and interpreting the performance of the proposed ensemble method. The detailed analysis emphasizes the effectiveness of the individual backbone models and the ensemble approach by resulting in a reliable and accurate diagnostic tool for Alzheimer’s disease. Fig. 9 presents the optimized ensemble method through the CEO algorithm.
4 Experimental Results and Discussion
This section details the findings of the proposed CEOE-Net model for classifying brain MRI images into dementia and non-dementia categories. A comprehensive examination [49,50] of experimental results emphasizes the effectiveness of the model in distinguishing various dementia MRI images. Visualization and interpretation assessments provide insights into the allocation of images to distinct classes and highlight key features prioritized by the model. Performance comparisons with pre-trained models and current approaches validate the effectiveness of the model in classification tasks. Additional testing demonstrates resilience across datasets, while ablation studies illustrate the impact of modifications in feature extraction and architectural decisions on overall performance.
4.1 Experimental Settings and Hyperparameters
The hyperparameters of models are essential to guide the learning of models and optimize their performance. The selection of appropriate hyperparameters is essential for enabling the models to learn effectively from the training data and generalize accurately to new data. Each parameter influences different aspects of the training, such as learning efficiency, stability, and the ability to generalize. Table 1 provides an overview of these hyperparameters. This setup enables the model to learn effectively from the data while maintaining computational efficiency.

4.2 Model Evaluation with Performance Evaluation Metrics
Assessing the performance of learning models is critical for determining their effectiveness, especially in tasks such as Alzheimer’s disease classification. Standard key performance metrics such as accuracy, precision, recall, and F1 score provide a comprehensive evaluation (calculate macro) for the effectiveness of the model. These metrics are derived from a confusion matrix to provide a clear visualization of classification accuracy and allow for detailed analysis. Various key performance indicators are utilized, with their calculations presented in the subsequent equations to assess the effectiveness of models.
4.3 Class-Wise Performance Evaluation
Class-wise performance evaluation is essential to fully understand how well each model performs across different classes within a dataset. In the context of dementia detection, analyzing performance for both Dementia and Non-Demented classes ensures that the model can accurately detect each condition without bias. The detailed analysis allows us to assess the robustness of the model if the model is biased towards any particular class, ensuring a balanced performance across different categories. Table 2 lists a class-wise performance comparison analysis between backbone models and the proposed CEOE-Net model on the OASIS MRI Brain Dataset. The performance of each model is assessed using key metrics to measure both its recall and accuracy in identifying each class. Among the evaluated models, ResNet50V2 achieves the highest accuracy at 91.87% by outperforming DenseNet121 and ResNet152V2 models, which achieve accuracies of 88.29% and 88.55%, respectively. The proposed CEOE-Net demonstrates superior performance with an overall accuracy of 93.44%. In terms of recall, CEOE-Net also achieves a 0.9400 recall value for the dementia class by surpassing the recall values of DenseNet121 at 0.8900, ResNet50V2 at 0.9300, and ResNet152V2 at 0.9100. The proposed method also achieved a superior recall score for the non-dementia class at 0.9300 compared to all other backbone models. This improvement highlights the effectiveness of the proposed approach in identifying dementia cases.

The confusion matrix (CM) evaluates the robustness of the proposed method by visually comparing actual and predicted samples across classes. It aids in assessing the ability of models to differentiate between Dementia categories and highlights areas for improvement. Fig. 10 presents a comparative analysis of CMs from a test set of 7630 images across two classes. The DenseNet121 (Backbone-1) model, as shown in Fig. 10a, misclassifies 893 images by leaving potential for enhancing classification accuracy. In Fig. 10b, the ResNet50V2 (Backbone-2) model misclassifies 620 images by indicating a reduced misclassification rate. The ResNet152V2 (Backbone-3) model in Fig. 10c shows 873 misclassified samples from the same test set. Finally, the proposed CEOE-Net method in Fig. 10d significantly outperforms the other backbone models by misclassifying only 500 images out of the 7630 tested. This improvement highlights the enhanced capability of the CEOE-Net method to accurately classify Alzheimer’s disease.


Figure 10: Confusion matrix analysis among (a) DenseNet121 (Backbone-1), (b) ResNet50V2 (Backbone-2), (c) ResNet152V2 (Backbone-3), and (d) Proposed CEOE-Net on OASIS MRI brain dataset
After thorough evaluation through confusion matrices, it further assesses the performance of the proposed method through Receiver Operating Characteristic (ROC) curves. The ROC curve [1] is employed to evaluate the classification performance of the models across various thresholds. The Area Under the Curve (AUC) values reflect each model’s effectiveness in accurately differentiating between Dementia and Non-Demented categories. Fig. 11 presents the ROC curves with AUC values for three backbone models and the proposed CEOE-Net. DenseNet121 achieves an AUC of 0.9335, while ResNet50V2 and ResNet152V2 attain AUCs of 0.9490 and 0.9428, respectively. The proposed CEOE-Net demonstrates superior performance with an AUC of 0.9525 by indicating its enhanced ability to distinguish between classes. This improvement highlights the improved precision of the proposed CEOE-Net method in identifying positive cases while reducing false positives.
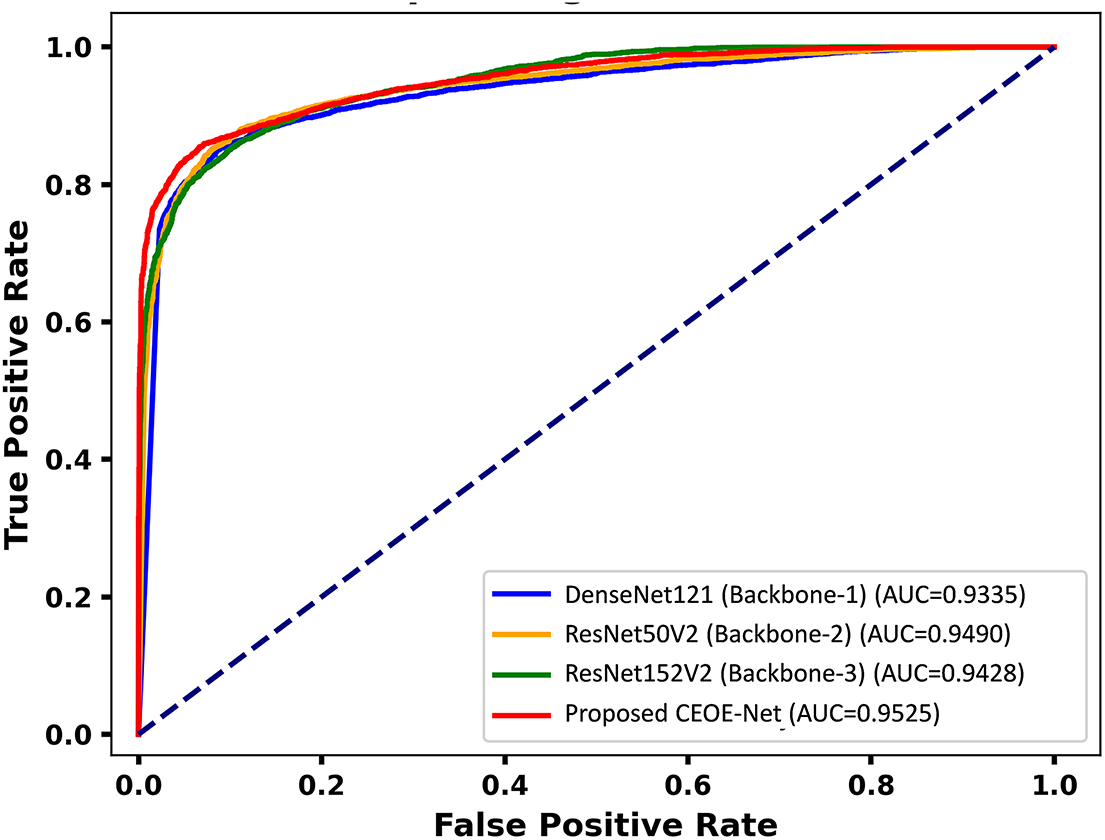
Figure 11: ROC curve analysis among backbone models and the proposed model on the OASIS MRI brain dataset
4.4 Performance Comparison of Proposed Model and Other CNN Models: OASIS MRI Brain Dataset
This section explores a comparative performance analysis of the proposed method against several pre-trained models on the OASIS MRI brain dataset, as detailed in Table 3. Analyzing metrics such as accuracy and recall across models highlights the strengths and limitations of each approach and helps to identify the most suitable model for dementia classification. Among all evaluated models, DenseNet121, ResNet50V2, and ResNet152V2 exhibit higher recall scores of 86.87, 90.39, and 87.03, respectively. Their corresponding accuracies are also higher at 86.89, 90.43, and 87.11, respectively, by considering them as top-performing models and justifying their selection for building the ensemble method. Among these, ResNet50V2 emerges as the highest performing pre-trained model. In contrast, MobileNet series models demonstrate lower performance in both recall and accuracy. Although other models show reasonable recall scores and accuracy, the focus remained on the top-performing three models. Finally, the proposed CEOE-Net method surpasses all individual models by achieving a recall score of 93.41 and an accuracy of 93.44. The higher performance of the proposed method across all key performance metrics demonstrates its effectiveness compared to all other individual models.

4.5 Performance Comparison of Proposed Model with Existing SOTA: OASIS MRI Brain Dataset
A comparative analysis of the proposed CEOE-Net against state-of-the-art (SOTA) methods is summarized in Table 4. The BrainNet2D method achieves an accuracy of 88.00%. In comparison, CEOE-Net improves accuracy by 5.44%, benefiting from the integration of Channel Attention and STFT, which enhance spatial–spectral feature learning beyond the conventional convolutional layers used in BrainNet2D. The ensemble CNN method demonstrates improved performance at 93.18%; however, CEOE-Net surpasses it with an accuracy of 93.44%. This gain of 0.26%, though modest, highlights the advantage of CEOE-Net’s optimization-driven feature refinement using the CEO algorithm, which ensures more stable and generalized classification. Methods that integrate MRI with clinical features result in an accuracy of only 78.80%. CEOE-Net outperforms this approach by a substantial 14.64%, demonstrating that the proposed model can achieve superior results through purely imaging-based analysis, avoiding the variability and dependency associated with clinical data integration. The MRI + PET combination reports the lowest accuracy of 53.79%. CEOE-Net provides a remarkable improvement of 39.65%, emphasizing that its deep attention-based spectral–spatial strategy extracts more discriminative biomarkers from MRI alone than multi-modal fusion approaches that can suffer from data heterogeneity.

4.6 Interpretability Visualization Analysis
Highlighting dementia and non-dementia regions in brain MRI is crucial for accurate diagnosis and treatment planning in clinical settings, as it enables clinicians to identify specific neurodegenerative changes, such as hippocampal atrophy or cortical thinning. This differentiation aids in understanding the progression of the disease and adapting interventions to individual patient needs. In addition, clear visualization of these regions enhances communication between healthcare providers and patients regarding the condition’s impact and prediction. This section provides GRAD-CAM visualizations applied to brain MRI images of dementia and non-dementia regions for the proposed model. Fig. 12 presents Grad-CAM visualizations comparing DenseNet121, ResNet50V2, and ResNet152V2 models. DenseNet121 and ResNet frequently distribute attention diffusely across the brain, sometimes highlighting irrelevant regions. It consistently concentrates on dementia-specific structures such as the hippocampus, cortical regions, and ventricles, exhibiting atrophy. This targeted focus aligns with established clinical markers of dementia and avoids mis-emphasis on non-pathological areas. In addition, the baseline model demonstrates higher consistency across slices, indicating stable recognition of disease-relevant patterns. These results indicate that the selected baselines not only improve classification accuracy but also provide interpretable visual cues that enhance clinical trust and support radiologists in identifying disease progression.

Figure 12: GRAD CAM visualization of OSASIS brain MRI dataset sample images
4.7 McNemar’s Statistical Tests
McNemar’s statistical test is utilized to compare the predictions of two models to determine if there is a significant difference (SD) between them. The null hypothesis (

An ablation study is essential to understand the impact of components or techniques on model performance. Assessing the performance of selected models with Channel Attention learning and various existing block configurations provides key insights into their performance. Testing the models within the ensemble method with other attention blocks allows us to identify the most effective architecture for enhancing classification accuracy and ensuring robust feature extraction. The comparison of these blocks highlights how each model influences the ability of models to distinguish classes accurately. Table 6 demonstrates the impact of various attention blocks on models’ performance. For DenseNet121, the Convolutional Block Attention Module (CBAM) yields an accuracy of 87.15%, while the Squeeze-and-Excitation (SE) block results in a marginally improved accuracy of 87.34%. The residual block achieves a slightly lower accuracy of 87.02%. In contrast, the proposed Channel Attention (CA) block shows superior performance by achieving an accuracy of 87.87% compared to other tested blocks. ResNet50V2 exhibits higher accuracy across all blocks. The CBAM, SE, and residual blocks attain accuracies of 90.56%, 90.82%, and 90.30%, respectively. With the proposed CA block, ResNet50V2 achieves its highest accuracy of 91.28%. ResNet152V2 follows a similar pattern to DenseNet121, where CBAM, SE, and residual blocks achieved accuracies of 87.28%, 87.41%, and 87.15%, respectively. The proposed CA block also achieves the highest accuracy for ResNet152V2 at 87.94%. Across all three models, the proposed CA block consistently yields the highest accuracy by demonstrating its effectiveness in enhancing model performance.

The impact of Short-Time Fourier Transform (STFT) on the accuracy performance of three pre-trained models enhanced with channel attention (CA) is presented in Table 7. Without STFT, DenseNet121+CA achieves an accuracy of 87.87%, ResNet50V2+CA achieves 91.28%, and ResNet152V2+CA achieves 87.94%. The incorporation of STFT leads to marginal performance improvements for all three models. The accuracy performance of DenseNet121+CA with STFT improved to 88.29%. ResNet50V2+CA experiences a similar improvement by reaching 91.87% accuracy with STFT. ResNet152V2+CA also benefits from STFT by achieving an improved accuracy of 88.55%. These results indicate that the incorporation of STFT further enhanced model performance.

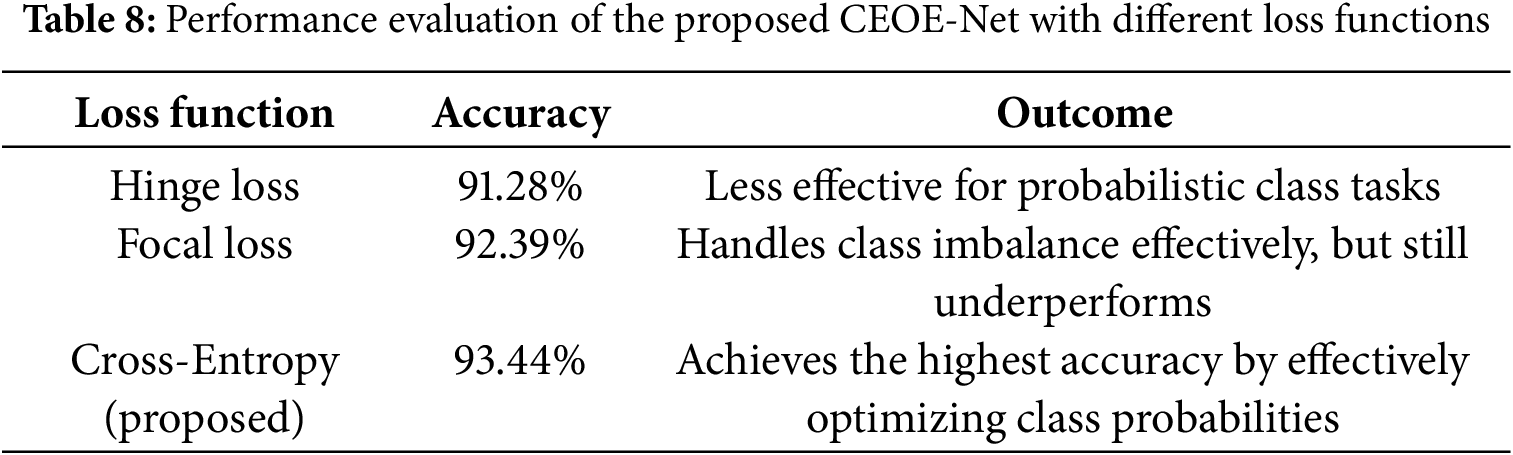
Effect of Loss Function
This study investigated how different loss formulations influence the training stability and classification performance of the proposed CEOE-Net to evaluate the effect of the loss function. This analysis highlights the role of the selected loss function in guiding the model toward improved feature discrimination and superior accuracy. Table 8 lists the performance of the proposed CEOE-Net under different loss functions. The results show that Hinge Loss yields an accuracy of 91.28%, indicating limited suitability for probability-based classification tasks. Focal Loss improves performance to 92.39% by addressing class imbalance, but still falls short of the optimal level. In contrast, the proposed method with Cross-Entropy Loss achieves the highest accuracy of 93.44%, demonstrating its effectiveness in optimizing class probabilities and guiding the network toward more discriminative feature learning. This confirms that cross-entropy is the most suitable loss function for the classification task in CEOE-Net.
4.9 Additional Testing on Other Datasets
Experiments were conducted on an additional dataset of autistic child faces to improve the diagnostic precision of the Proposed CEOE-Net method for identifying dementia and non-dementia brain MRI images. It makes it possible to evaluate model performance under different circumstances by assuring robustness and generalizability across a variety of patient datasets. Ultimately, by enabling earlier and more precise diagnosis, these tests help to improve patient outcomes while highlighting the proposed model’s effectiveness [6].
Private Clinical Brain MRI Dataset: Alzheimer’s Disease Neuroimaging Initiative
This section presents the private clinical dataset to validate the robustness of the proposed method. Using a clinical dataset to validate the performance of the proposed model ensures that the findings are applicable to real-world scenarios, enhancing the model’s relevance and utility in clinical practice. It allows for the assessment of the model accuracy and reliability in distinguishing between Alzheimer’s Disease Neuroimaging conditions, which is crucial for early diagnosis and treatment decisions. In addition, validation with clinical data raises confidence among healthcare providers in adopting the model, ultimately leading to improved patient outcomes through evidence-based interventions. This study utilized the private clinical Alzheimer’s Disease Neuroimaging from the ANTI dataset management system (https://ida.loni.usc.edu/login.jsp, accessed on 01 January 2025).
This study formally applied for access to the Alzheimer’s Disease Neuroimaging Initiative (ADNI) private dataset, following all procedures outlined in the ADNI dataset accessibility guidelines. This process included submitting a comprehensive application detailing the research objectives and the specific ways in which the ADNI data will contribute to the study on dementia classification. After thorough review and approval by the ADNI management team, this study successfully obtained access to the dementia MRI brain dataset. Fig. 13 displays sample images of brain MRI for both autistic and non-autistic individuals, along with the total images in each category for the training and test sets. This dataset comprises ADNI brain MRI images collected from 2018 to 2023, featuring signal axes for detailed analysis. ADNI provides Alzheimer’s data in 3D volumetric Nifti or DICOM format. Since working directly on 3D data can be challenging, the provided dataset was made to make image processing techniques easier to build. The 2D axial images in this collection were taken from the Nifti images that made up the ADNI baseline dataset. There are three kinds of subjects: those with Alzheimer’s disease-AD, mild cognitive impairment-MCI, and common normal-CN. The dataset contains a total of 2280 images classified as AD, 3618 images representing MCI, and 3480 images categorized as CN. These images are essential for analyzing the different stages of cognitive decline and facilitating the development of robust classification models. The dataset provides a comprehensive resource for understanding the variations in brain MRI characteristics associated with each condition by encompassing a diverse range of cases, contributing to more accurate diagnoses and targeted interventions in clinical practice.
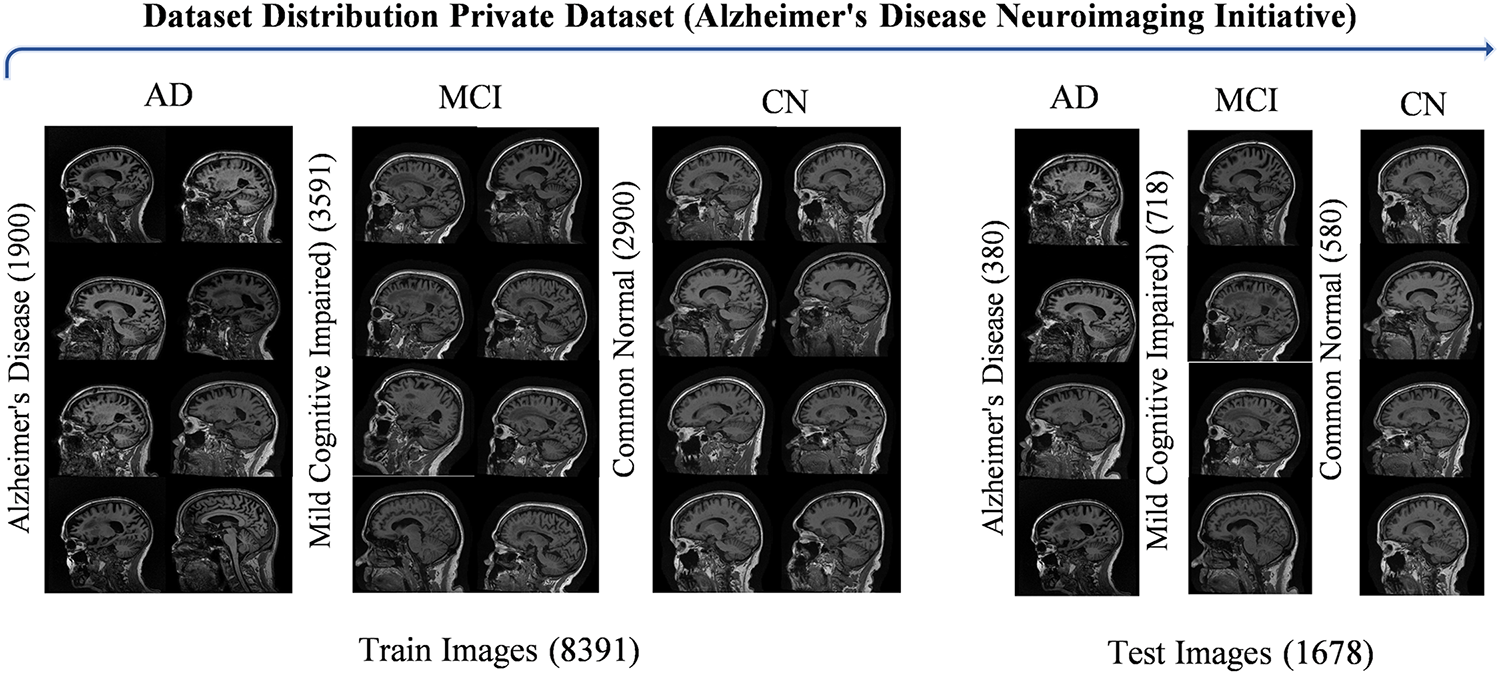
Figure 13: Visualization of ANDI brain MRI dataset sample images
This study employed the same experimental settings utilized in the OSASIS dataset experiments to ensure a fair experimental comparison. This approach allows for a consistent methodology and enables us to accurately assess the performance of the proposed model against the private ADNI dataset in the AD field. This study enhances the reliability of findings and facilitates meaningful comparisons by aligning the experimental conditions with those previously used.
Evaluating the performance of the proposed approach on an additional ADNI brain MRI dataset is essential to assess its robustness across diverse medical data. Table 9 details a comparative analysis of different models on the ADNI Brain MRI Dataset. DenseNet121 achieves an accuracy of 75.44% and a recall of 72.95%. ResNet50V2 demonstrates improved performance with an accuracy of 80.15% and a recall of 76.45%. ResNet152V2 exhibits slightly lower performance, achieving 76.10% accuracy and 71.03% recall. The proposed CEOE-Net demonstrates the highest performance on this dataset, with an accuracy of 81.94% and a recall of 82.36% by showing its robustness and effectiveness in handling diverse medical image data.

The comparative performance analysis among various models is evaluated on the ADNI Brain MRI Dataset using a CM to assess multi-class classification accuracy across the three classes: Alzheimer’s Disease (AD), Mild Cognitive Impairment (MCI), and Cognitively Normal (CN). Fig. 14 presents a comparative analysis of the confusion matrices for each model on the ANDI dataset, comprising a total of 1678 test samples. In Fig. 14a, the CM for the DenseNet121 (Backbone-1) model shows a total of 412 misclassified images out of 1678 test images, indicating a need for further refinement, as these misclassifications indicate limited discrimination among classes. Fig. 14b illustrates the CM of ResNet50V2 (Backbone-2), which further reduces the number of errors to 333 by highlighting an enhanced capability to correctly identify samples across three different categories. Fig. 14c displays the CM for the ResNet152V2 (Backbone-3) model, which misclassifies a total of 401 images on the same set of test images. The model shows slight improvement over DenseNet121 with a difference of 11 misclassifications, but still leaves room for enhancement in distinguishing between classes. Finally, the Proposed CEOE-Net method reduces misclassifications in only 303 images. The proposed model demonstrates superior accuracy compared to other models, showing its effectiveness in accurately classifying images across all three categories in the ADNI Brain MRI Dataset.
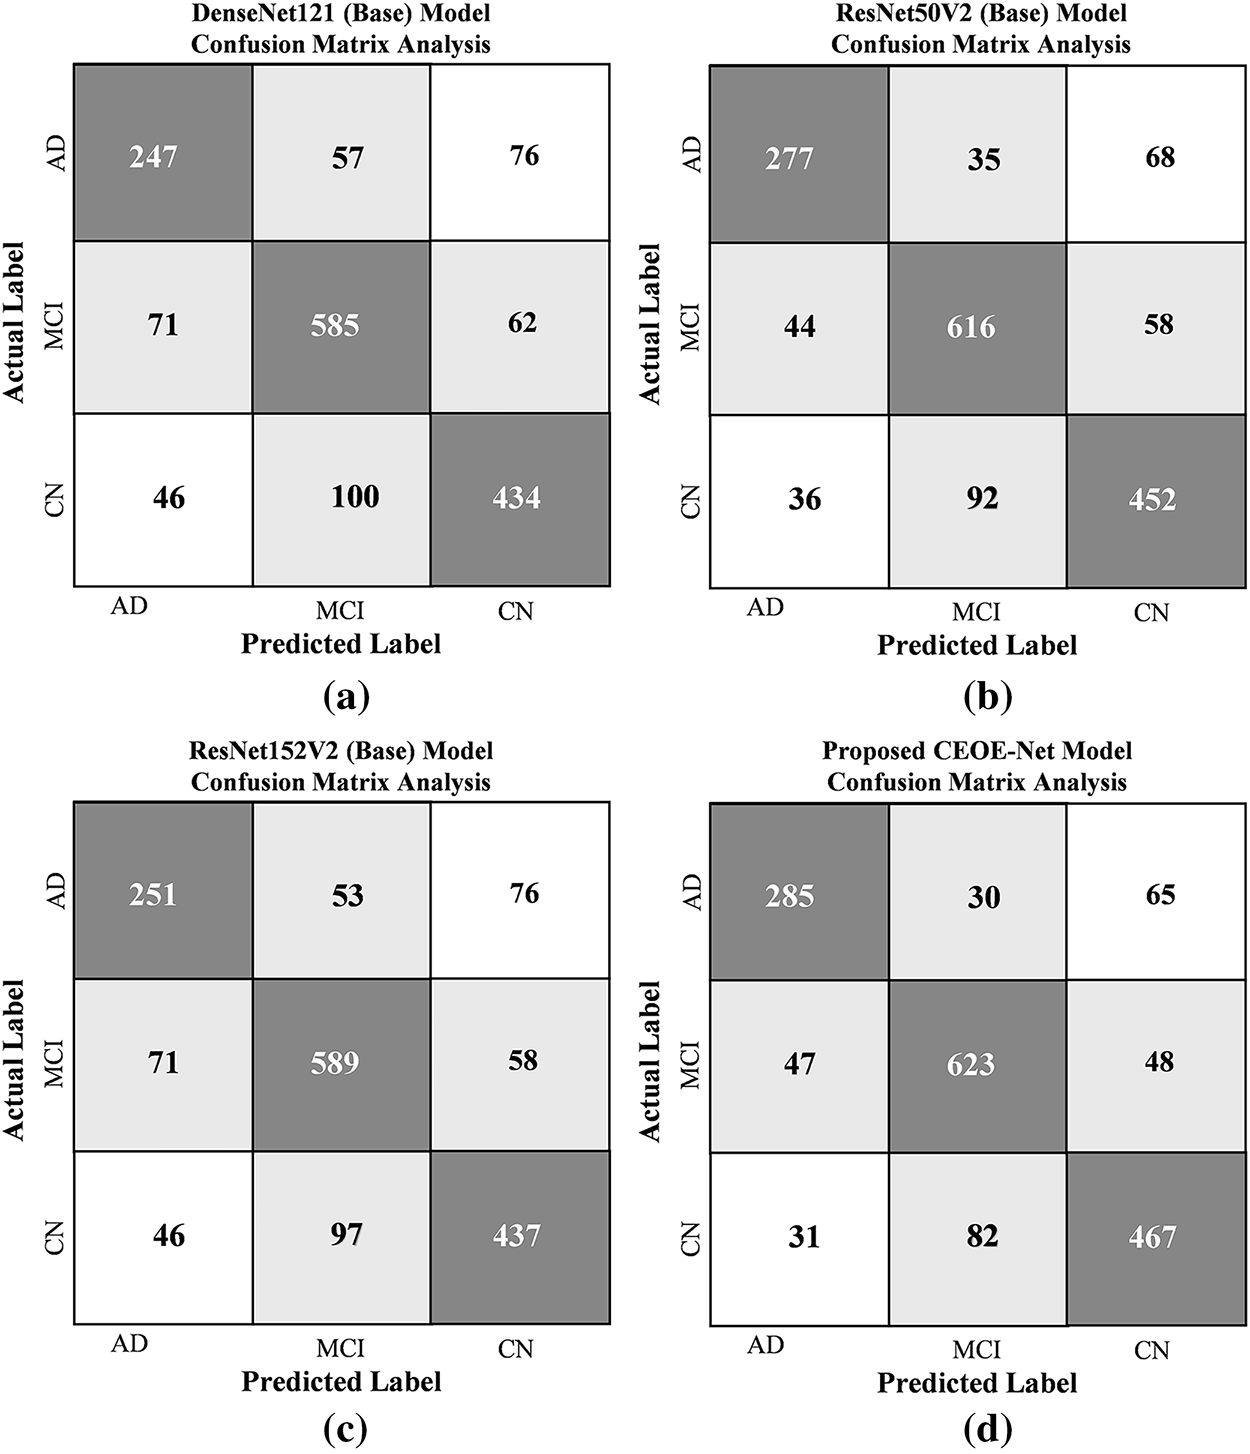
Figure 14: Confusion matrix analysis among (a) DenseNet121 (Backbone-1), (b) ResNet50V2 (Backbone-2), (c) ResNet152V2 (Backbone-3), and (d) Proposed CEOE-Net on ANDI Brain MRI Dataset
Fig. 15 highlights the AD, MCI, and CN regions in brain MRI, which is crucial for accurate diagnosis and treatment planning by helping clinicians identify specific neurodegenerative changes, such as hippocampal atrophy. This differentiation aids in understanding disease progression and enhances communication regarding the condition’s impact. GRAD-CAM visualizations illustrate the regions identified by the proposed model, consistently demonstrating attention to multiple brain diseases. The proposed model demonstrates efficient performance on the private ADNI dataset, effectively identifying and classifying various stages of AD. This constant performance demonstrates the model’s robustness and applicability in real-world clinical settings.
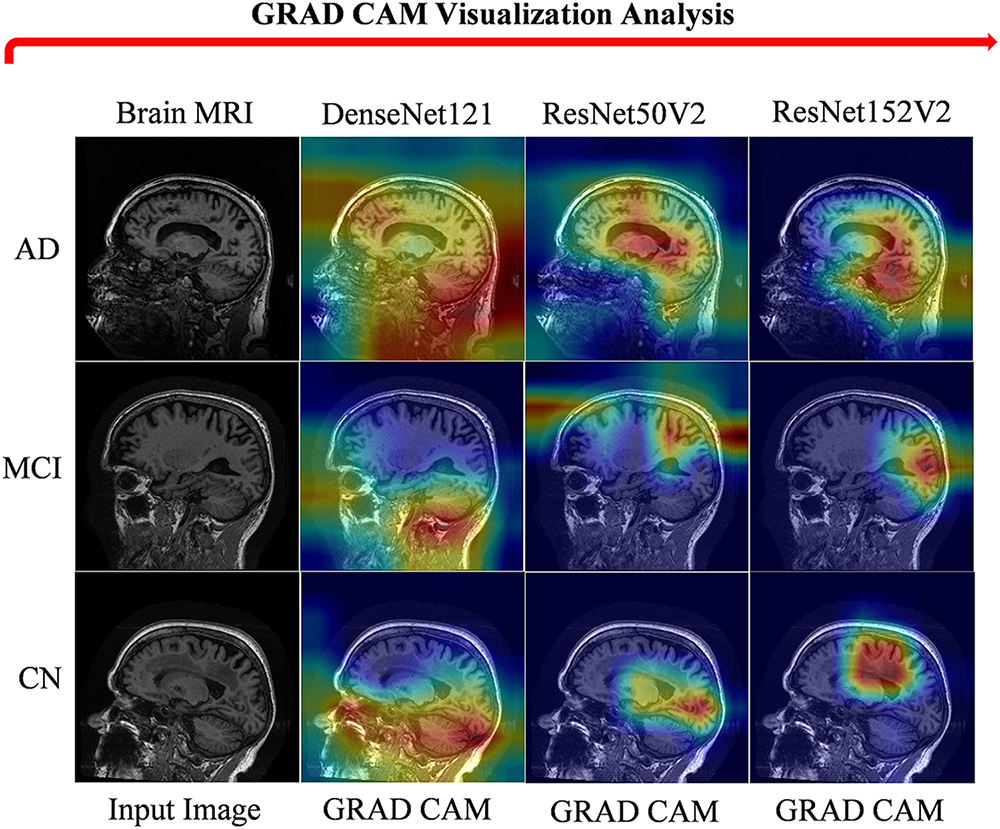
Figure 15: GRAD CAM visualization of ANDI brain MRI dataset sample images
5 Discussion: Performance Discrepancy between OASIS and ADNI
The performance difference between OASIS and ADNI can be attributed to the characteristics of the datasets. The OASIS dataset is relatively homogeneous, with scans collected under consistent acquisition protocols and preprocessing settings, leading to cleaner and more uniform images. This makes the separation between demented and non-demented subjects more distinct, allowing models to achieve higher precision, recall, and accuracy. In contrast, ADNI is more heterogeneous, as it combines data from multiple sites, scanners, and imaging protocols. Variability in voxel resolution, intensity distributions, and preprocessing pipelines increases noise and reduces the ability of models to generalize effectively. Another factor is the complexity of labels and the distribution of subjects in ADNI. The dataset includes subjects across a broader spectrum of disease progression, including mild cognitive impairment and normal aging, which introduces subtle overlaps between classes. This class imbalance and blurred boundaries make the classification with the proposed CEOE-Net more challenging compared to OASIS. In addition, raw ADNI scans often suffer from motion artifacts, lower contrast, and clinical variability such as comorbidities in older participants, which further impact model performance.
Computational and running time
Table 10 presents the computational and running time analysis of the selected three backbone models. DenseNet121 (Backbone-1) has 18 million parameters with a model size of approximately 76,775 KB and requires 15.69 s for testing, reflecting its relatively lightweight nature. ResNet50V2 (Backbone-2) increases the parameter count to 23 million with a larger size of 96,091 KB, yet achieves the fastest test time of 14.02 s, indicating its efficiency in balancing complexity and speed. In contrast, ResNet152V2 (Backbone-3) is the most computationally intensive, with 60 million parameters and a size of about 248,000 KB, resulting in a slightly longer test time of 16.96 s. These results highlight the trade-off between model size, parameter count, and inference speed, showing that deeper architectures demand more resources but can potentially provide stronger feature extraction.

This study achieves significant advancements in the classification of Alzheimer’s disease by developing CEOE-Net, an optimized ensemble method. It successfully integrates pre-trained models, including DenseNet121, ResNet50V2, and ResNet152V2, enhancing them with channel attention (CA) blocks and Short Time Fourier Transform (STFT) techniques to improve feature extraction and emphasize subtle differences in brain structures. The implementation of the Chaotic Evolution Optimization (CEO) algorithm allows for dynamic optimization of the weightage of each model, resulting in a substantial enhancement of classification accuracy. The proposed approach is validated across three datasets: two private clinical brain MRI datasets (OSASIS and ADNI) and a public dataset of autistic children’s faces. CEOE-Net demonstrated its robustness and effectiveness, achieving high accuracies of 93.44% on OSASIS, 81.94% on ADNI, and 92.09% on the autistic children’s faces dataset. These results confirm that it can successfully create a reliable clinical tool capable of accurately distinguishing between dementia and non-dementia conditions, as well as identifying autistic and non-autistic features. This achievement supports early and accurate diagnosis, improving patient care and treatment outcomes. These findings highlight the potential of the proposed model as an effective medical tool in the medical imaging field, providing significant improvements in the accuracy and reliability of Alzheimer’s and autism diagnoses. In addition, a limitation of this study is the reliance on a single modality (brain MRI images and faces dataset) for classification, which can limit the model’s generalizability across other diagnostic contexts. In addition, the model performance needs further validation in complex, real-time clinical settings to ensure its robustness in diverse environments. For further research, the proposed model can explore the integration of additional modalities and diagnostic features that can refine the model’s applicability and accuracy even further. In addition, the advancement of computer-aided diagnostic systems in clinical settings, promising to enhance patient outcomes through more precise and early detection of complex conditions such as Alzheimer’s disease and autism, must validate the proposed model in complex clinical real-time settings.
Acknowledgement: We would like to acknowledge all co-authors for their valuable contributions in planning, conducting, editing, and reporting this research.
Funding Statement: This work was supported in part by the Science and Technology Major Special Project Fund of Changsha (No. kh2401010), and in part by the High-Performance Computing Center of Central South University. This work was supported by the National Natural Science Foundation of China (Grants Nos. 82022024, 31970572). The Science and Technology Innovation Program of Hunan Province (2021RC4018, 2021RC5027). Innovation-Driven Project of Central South University (Grant No. 2020CX003). NIH grants U01 MH122591, 1U01MH116489, 1R01MH110920, R01MH126459. We acknowledge the Bioinformatics Center of Furong Laboratory.
Author Contributions: Saif Ur Rehman Khan: Conceptualization, Data curation, Methodology, Software, Validation, Writing—original draft. Ming Zhao & Chao Chen: Conceptualization, Funding acquisition, Supervision, Validation, and Visualization. Omair Bilal & Huihui Yang: Data curation, Visualization, Editing, and Reviewing. All authors reviewed the results and approved the final version of the manuscript.
Availability of Data and Materials: Dataset-1: The Open Access Series of Imaging Studies (OASIS) database is publicly available and can be accessed at https://www.oasis-brains.org/. Dataset-2: The Alzheimer’s Disease Neuroimaging data used in this study was obtained from the private clinical database of the ANTI dataset management system. Access can be requested via https://ida.loni.usc.edu/login.jsp (accessed on 01 January 2025). Dataset-3: The Autistic Children Facial Dataset is publicly available on Kaggle and can be accessed at https://www.kaggle.com/datasets/imrankhan77/autistic-children-facial-data-set (accessed on 01 January 2025).
Ethics Approval: Not applicable.
Conflicts of Interest: The authors declare no conflicts of interest to report regarding the present study.
⮚ Autistic Dataset Details
This study explores facial traits associated with autism spectrum disorder (ASD) in children, such as a broad upper face and widely spaced eyes. It utilized a Kaggle dataset that comprises facial images of children aged between 2 and 14, primarily focusing on those between 2 and 8 years old. The dataset is publicly accessible and includes 2D RGB JPEG images divided into 1317 images of children diagnosed with autism and 1609 images of children without an autism diagnosis, for a total of 2926 images. The sample images taken from the autism spectrum dataset are shown in Fig. A1.
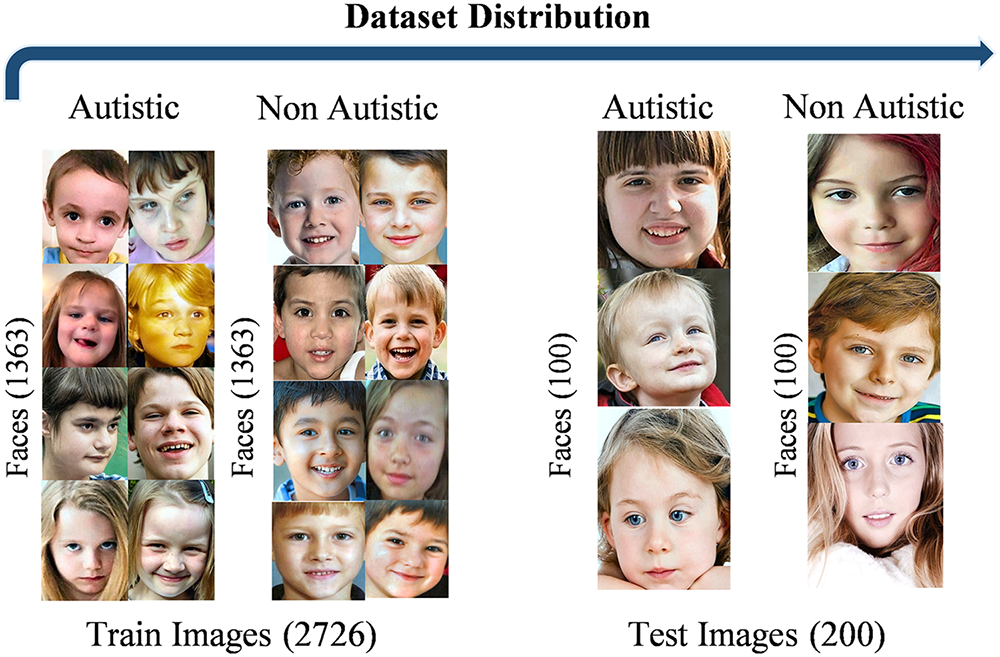
Figure A1: Visualization of autistic child faces dataset sample images
Testing the model on an additional Autistic Child Faces (ACFs) Dataset is essential to evaluate its robustness across different data types. After retraining the models on this dataset, it can assess their performance outside the primary dataset. Table A1 lists a performance comparison across different models on the ACFs Dataset. DenseNet121 achieves 88.00% accuracy and an 88.00% recall rate. ResNet50V2 demonstrates improved performance with 92.50% accuracy and recall. ResNet152V2 attains slightly lower metrics at 89.00% for both accuracy and recall. The proposed CEOE-Net achieves the highest performance on this dataset by exhibiting an accuracy of 93.50% and a recall rate of 93.49%. This result demonstrates the robustness of CEOE-Net and its ability to maintain high performance across diverse datasets.

The performance of the proposed method, along with individual backbone models, was evaluated on the ACFs dataset using CM to assess classification accuracy. Fig. A2 presents a comparison among these models via confusion matrices, where each model was tested on binary classification using a total of 200 test images. In Fig. A2a, the CM for the DenseNet121 (Backbone-1) model indicates 24 misclassified images. Fig. A2b reveals that ResNet50V2 (Backbone-2) misdiagnosed 15 samples, while Fig. A2c shows ResNet152V2 (Backbone-3) misclassified 22 samples. The proposed CEOE-Net method in Fig. A2d achieved the highest performance with only 13 misclassified images by demonstrating a significant reduction in misclassifications compared to all other individual backbone models. The proposed model exhibits superior accuracy relative to the other models by highlighting its effectiveness in accurately classifying autistic and non-autistic images.

Figure A2: Confusion matrix analysis of (a) DenseNet121 (Backbone-1), (b) ResNet50V2 (Backbone-2), (c) ResNet152V2 (Backbone-3), and (d) Proposed CEOE-Net on Autistic child faces dataset
Clinicians can accurately diagnose and plan treatments by observing autistic and non-autistic regions in children’s faces, which helps in identifying specific neurodegenerative changes such as hippocampal atrophy, as shown in Fig. A3. This differentiation not only aids in understanding disease progression but also enhances communication about the condition’s impact. In this section, GRAD-CAM visualizations illustrate the regions identified by the proposed model in child face images, consistently showing attention to autistic areas. This clarity allows radiologists to understand the influence of specific facial regions on model predictions, supporting more effective clinical interventions.
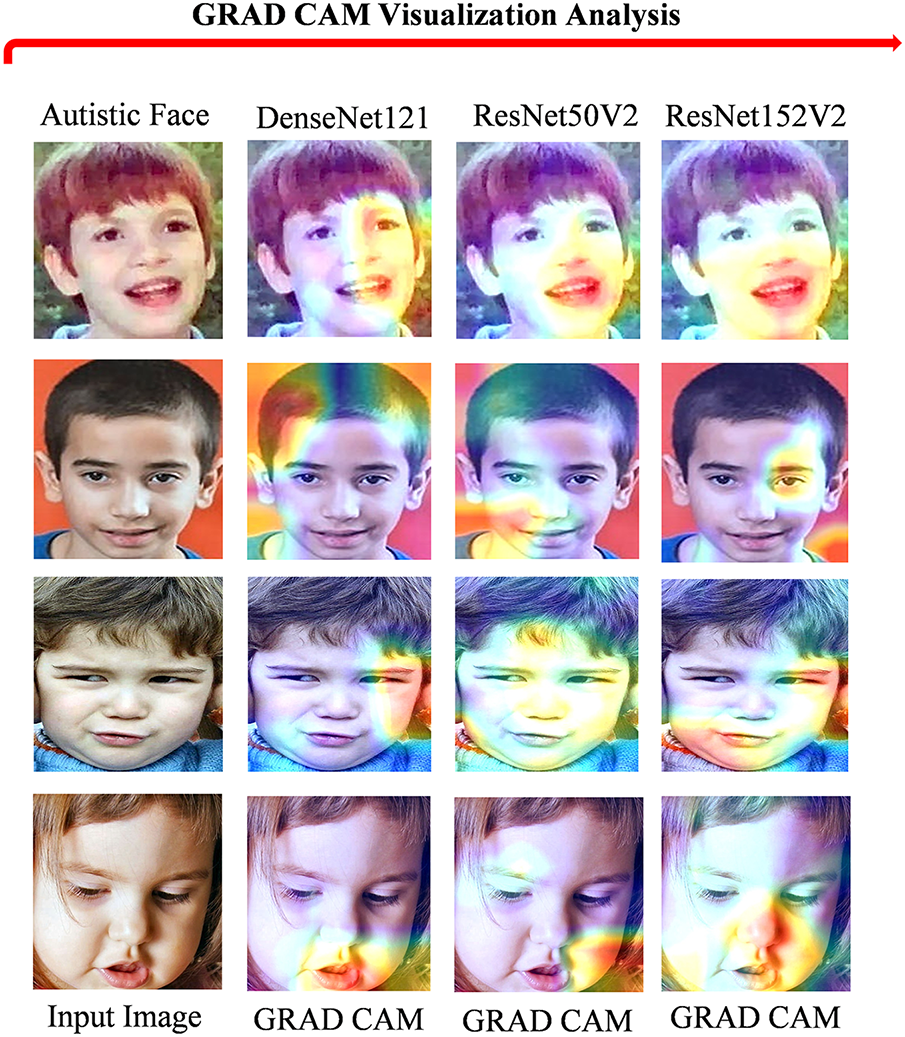
Figure A3: GRAD CAM visualization of autistic child faces dataset sample images
⮚ Convergence Analysis Based on Loss Curves
Fig. A4 shows the training and testing loss plots; both curves decrease rapidly during the initial epochs and gradually stabilize, indicating proper convergence. Convergence is achieved within approximately 20 epochs, as indicated, since the loss values flatten out after this point with minimal fluctuations. This confirms that the training process is stable and the model does not suffer from divergence or overfitting.
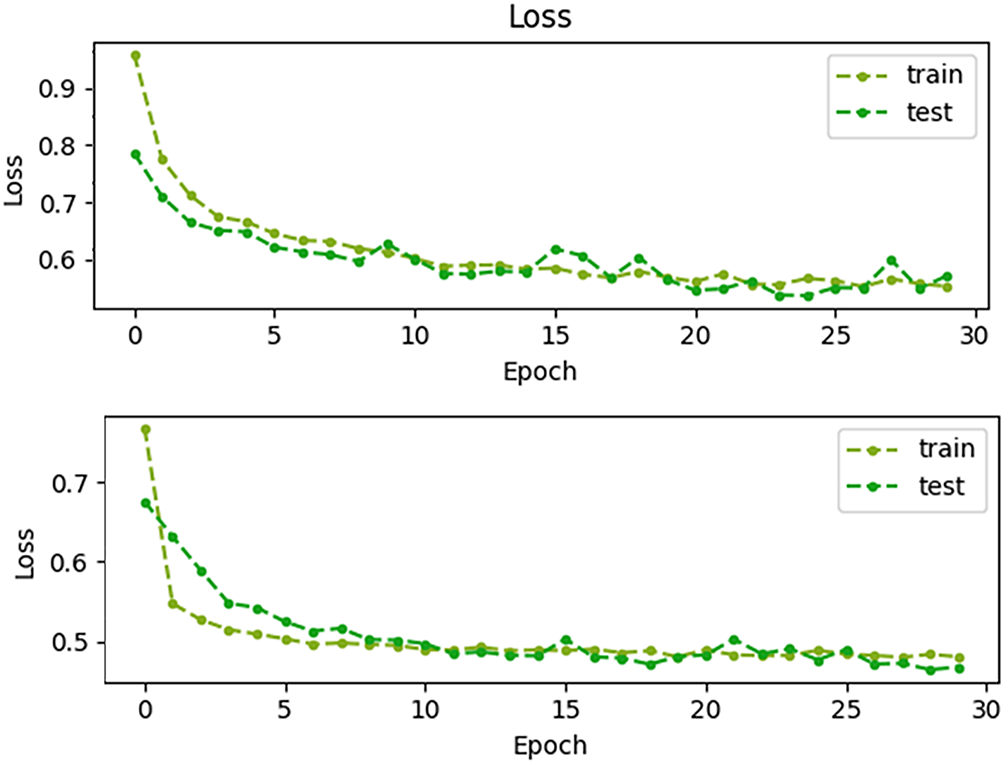
Figure A4: Training and testing loss curves across 30 epochs, demonstrating stable convergence within approximately 20 epochs
References
1. Jahn H. Memory loss in Alzheimer’s disease. Dialogues Clin Neurosci. 2013;15(4):445–54. doi:10.31887/DCNS.2013.15.4/hjahn. [Google Scholar] [PubMed] [CrossRef]
2. Sarraf S, Tofighi G. Classification of Alzheimer’s disease structural MRI data by deep learning convolutional neural networks. arXiv:1607.06583. 2016. [Google Scholar]
3. Lim BY, Lai KW, Haiskin K, Kulathilake KASH, Ong ZC, Hum YC, et al. Deep learning model for prediction of progressive mild cognitive impairment to Alzheimer’s disease using structural MRI. Front Aging Neurosci. 2022;14:876202. doi:10.3389/fnagi.2022.876202. [Google Scholar] [PubMed] [CrossRef]
4. Tarawneh R, Holtzman DM. The clinical problem of symptomatic Alzheimer disease and mild cognitive impairment. Cold Spring Harb Perspect Med. 2012;2(5):a006148. doi:10.1101/cshperspect.a006148. [Google Scholar] [PubMed] [CrossRef]
5. van Vliet D, de Vugt ME, Bakker C, Pijnenburg YAL, Vernooij-Dassen MJFJ, Koopmans RTCM, et al. Time to diagnosis in young-onset dementia as compared with late-onset dementia. Psychol Med. 2013;43(2):423–32. doi:10.1017/s0033291712001122. [Google Scholar] [PubMed] [CrossRef]
6. Hnilicova P, Kantorova E, Sutovsky S, Grofik M, Zelenak K, Kurca E, et al. Imaging methods applicable in the diagnostics of Alzheimer’s disease, considering the involvement of insulin resistance. Int J Mol Sci. 2023;24(4):3325. doi:10.3390/ijms24043325. [Google Scholar] [PubMed] [CrossRef]
7. Karl H. Imaging clinical subtypes and associated brain networks in Alzheimer’s disease. Brain Sci. 2022;12(2):146. doi:10.3390/brainsci12020146. [Google Scholar] [PubMed] [CrossRef]
8. Garg N, Choudhry MS, Bodade RM. A review on Alzheimer’s disease classification from normal controls and mild cognitive impairment using structural MR images. J Neurosci Methods. 2023;384(4):109745. doi:10.1016/j.jneumeth.2022.109745. [Google Scholar] [PubMed] [CrossRef]
9. Tatiparti K, Sau S, Rauf MA, Iyer AK. Smart treatment strategies for alleviating tauopathy and neuroinflammation to improve clinical outcome in Alzheimer’s disease. Drug Discov Today. 2020;25(12):2110–29. doi:10.1016/j.drudis.2020.09.025. [Google Scholar] [PubMed] [CrossRef]
10. Khan SUR, Asim MN, Vollmer S, Dengel A. FOLC-net: a federated-optimized lightweight architecture for enhanced MRI disease diagnosis across axial, coronal, and sagittal views. arXiv:2507.06763. 2025. [Google Scholar]
11. Nandi A, Counts N, Chen S, Seligman B, Tortorice D, Vigo D, et al. Global and regional projections of the economic burden of Alzheimer’s disease and related dementias from 2019 to 2050: a value of statistical life approach. EClinicalMedicine. 2022;51:101580. doi:10.1016/j.eclinm.2022.101580. [Google Scholar] [PubMed] [CrossRef]
12. Zheng C, Bouazizi M, Ohtsuki T, Kitazawa M, Horigome T, Kishimoto T. Detecting dementia from face-related features with automated computational methods. Bioengineering. 2023;10(7):862. doi:10.3390/bioengineering10070862. [Google Scholar] [PubMed] [CrossRef]
13. Umeda-Kameyama Y, Kameyama M, Tanaka T, Son BK, Kojima T, Fukasawa M, et al. Screening of Alzheimer’s disease by facial complexion using artificial intelligence. Aging. 2021;13(2):1765–72. doi:10.18632/aging.202545. [Google Scholar] [PubMed] [CrossRef]
14. Hilsabeck RC, Lacritz LH, Colvin MK, Espe-Pfeifer P, Sperling SA, Arnett PA, et al. Cognition is a critical vital sign for older adults: the need for early detection of cognitive impairment is now. Policy Insights Behav Brain Sci. 2022;9(2):188–95. doi:10.1177/23727322221110261. [Google Scholar] [CrossRef]
15. Stoleru GI, Iftene A. Prediction of medical conditions using machine learning approaches: Alzheimer’s case study. Mathematics. 2022;10(10):1767. doi:10.3390/math10101767. [Google Scholar] [CrossRef]
16. El-Assy AM, Amer HM, Ibrahim HM, Mohamed MA. A novel CNN architecture for accurate early detection and classification of Alzheimer’s disease using MRI data. Sci Rep. 2024;14(1):3463. doi:10.1038/s41598-024-53733-6. [Google Scholar] [PubMed] [CrossRef]
17. Khan SUR, Asif S, Bilal O, Ali S. Deep hybrid model for Mpox disease diagnosis from skin lesion images. Int J Imaging Syst Tech. 2024;34(2):e23044. doi:10.1002/ima.23044. [Google Scholar] [CrossRef]
18. Bilal O, Asif S, Zhao M, Li Y, Tang F, Zhu Y. Differential evolution optimization based ensemble framework for accurate cervical cancer diagnosis. Appl Soft Comput. 2024;167:112366. doi:10.1016/j.asoc.2024.112366. [Google Scholar] [CrossRef]
19. Khan SUR, Asif S. Oral cancer detection using feature-level fusion and novel self-attention mechanisms. Biomed Signal Process Control. 2024;95(1):106437. doi:10.1016/j.bspc.2024.106437. [Google Scholar] [CrossRef]
20. Chaki J, Woźniak M. Deep learning for neurodegenerative disorder (2016 to 2022a systematic review. Biomed Signal Process Control. 2023;80:104223. doi:10.1016/j.bspc.2022.104223. [Google Scholar] [CrossRef]
21. Tu Y, Lin S, Qiao J, Zhuang Y, Zhang P. Alzheimer’s disease diagnosis via multimodal feature fusion. Comput Biol Med. 2022;148:105901. doi:10.1016/j.compbiomed.2022.105901. [Google Scholar] [PubMed] [CrossRef]
22. Ali Mustafa R, Thabt Saleh K, Salman Chyad H. Feature extraction based on wavelet transform and moment invariants for medical image. Int J Eng Res Adv Technol. 2018;4(8):80–98. doi:10.31695/ijerat.2018.3315. [Google Scholar] [CrossRef]
23. Lu B, Li HX, Chang ZK, Li L, Chen NX, Zhu ZC, et al. A practical Alzheimer’s disease classifier via brain imaging-based deep learning on 85,721 samples. J Big Data. 2022;9(1):101. doi:10.1186/s40537-022-00650-y. [Google Scholar] [CrossRef]
24. Agarwal R, Sathwik AS, Godavarthi D, Naga Ramesh JV. Comparative analysis of deep learning models for multiclass Alzheimer’s disease classification. EAI Endorsed Trans Perv Health Tech. 2023;9:1–8. doi:10.4108/eetpht.9.4334. [Google Scholar] [CrossRef]
25. Ntampakis N, Diamantaras K, Chouvarda I, Argyriou V, Sarigianndis P. Enhanced deep learning methodologies and MRI selection techniques for dementia diagnosis in the elderly population. arXiv:2407.17324. 2024. [Google Scholar]
26. Vo J, Sharif N, Hassan GM. Multimodal neuroimaging attention-based architecture for cognitive decline prediction. arXiv:2401.06777. 2023. [Google Scholar]
27. Michelassi GC, Bortoletti HS, Pinheiro TD, Nobayashi T, Barros FR, Testa RL, et al. Classification of facial images to assist in the diagnosis of autism spectrum disorder: a study on the effect of face detection and landmark identification algorithms. In: Brazilian Conference on Intelligent Systems; 2023; Cham, Switzerland: Springer Nature. p. 261–275. doi:10.21203/rs.3.rs-448184/v1. [Google Scholar] [CrossRef]
28. Atlam ES, Aljuhani KO, Gad I, Abdelrahim EM, Atwa AEM, Ahmed A. Automated identification of autism spectrum disorder from facial images using explainable deep learning models. Sci Rep. 2025;15(1):26682. doi:10.1038/s41598-025-11847-5. [Google Scholar] [PubMed] [CrossRef]
29. Odusami M, Maskeliūnas R, Damaševičius R, Misra S. Explainable deep-learning-based diagnosis of Alzheimer’s disease using multimodal input fusion of PET and MRI images. J Med Biol Eng. 2023;43(3):291–302. doi:10.1007/s40846-023-00801-3. [Google Scholar] [CrossRef]
30. Mujeeb Rahman KK, Subashini MM. Identification of autism in children using static facial features and deep neural networks. Brain Sci. 2022;12(1):94. doi:10.3390/brainsci12010094. [Google Scholar] [PubMed] [CrossRef]
31. Alam MS, Rashid MM, Roy R, Faizabadi AR, Gupta KD, Ahsan MM. Empirical study of autism spectrum disorder diagnosis using facial images by improved transfer learning approach. Bioengineering. 2022;9(11):710. doi:10.3390/bioengineering9110710. [Google Scholar] [PubMed] [CrossRef]
32. Al-Nefaie AH, Aldhyani THH, Ahmad S, Alzahrani EM. Application of artificial intelligence in modern healthcare for diagnosis of autism spectrum disorder. Front Med. 2025;12:1569464. doi:10.3389/fmed.2025.1569464. [Google Scholar] [PubMed] [CrossRef]
33. Pavithra R, Abirami SP, Krithika S, Sabitha S, Tharanidharan P. Identification of autism spectrum disorder from functional MRI using deep learning. In: Advances in Information Communication Technology and Computing; 2022 Dec 17–18; Bikaner, India. Berlin/Heidelberg, Germany: Springer; 2023. p. 277–84. doi:10.1007/978-981-19-9888-1_20. [Google Scholar] [CrossRef]
34. Alkahtani H, Aldhyani THH, Alzahrani MY. Deep learning algorithms to identify autism spectrum disorder in children-based facial landmarks. Appl Sci. 2023;13(8):4855. doi:10.3390/app13084855. [Google Scholar] [CrossRef]
35. Akter T, Ali MH, Khan MI, Satu MS, Uddin MJ, Alyami SA, et al. Improved transfer-learning-based facial recognition framework to detect autistic children at an early stage. Brain Sci. 2021;11(6):734. doi:10.3390/brainsci11060734. [Google Scholar] [PubMed] [CrossRef]
36. Sarvamangala DR, Kulkarni RV. Convolutional neural networks in medical image understanding: a survey. Evol Intell. 2022;15(1):1–22. doi:10.1007/s12065-020-00540-3. [Google Scholar] [PubMed] [CrossRef]
37. Acquarelli J, van Laarhoven T, Postma GJ, Jansen JJ, Rijpma A, van Asten S, et al. Convolutional neural networks to predict brain tumor grades and Alzheimer’s disease with MR spectroscopic imaging data. PLoS One. 2022;17(8):e0268881. doi:10.1371/journal.pone.0268881. [Google Scholar] [PubMed] [CrossRef]
38. Kourounis G, Elmahmudi AA, Thomson B, Hunter J, Ugail H, Wilson C. Computer image analysis with artificial intelligence: a practical introduction to convolutional neural networks for medical professionals. Postgrad Med J. 2023;99(1178):1287–94. doi:10.1093/postmj/qgad095. [Google Scholar] [PubMed] [CrossRef]
39. Huang G, Liu Z, Van Der Maaten L, Weinberger KQ. Densely connected convolutional networks. In: 2017 IEEE Conference on Computer Vision and Pattern Recognition (CVPR); 2017 Jul 21–26; Honolulu, HI, USA. p. 2261–9. doi:10.1109/cvpr.2017.243. [Google Scholar] [CrossRef]
40. He K, Zhang X, Ren S, Sun J. Deep residual learning for image recognition. In: 2016 IEEE Conference on Computer Vision and Pattern Recognition (CVPR); 2016 Jun 27–30; Las Vegas, NV, USA. p. 770–8. doi:10.1109/cvpr.2016.90. [Google Scholar] [CrossRef]
41. He K, Zhang X, Ren S, Sun J. Deep residual learning. Image Recognit. 2015;7(4):327–36. [Google Scholar]
42. Dong Y, Zhang S, Zhang H, Zhou X, Jiang J. Chaotic evolution optimization: a novel metaheuristic algorithm inspired by chaotic dynamics. Chaos Soliton Fract. 2025;192(1):116049. doi:10.1016/j.chaos.2025.116049. [Google Scholar] [CrossRef]
43. Hoo ZH, Candlish J, Teare D. What is an ROC curve? Emerg Med J. 2017;34(6):357–9. doi:10.1136/emermed-2017-206735. [Google Scholar] [PubMed] [CrossRef]
44. Saratxaga CL, Moya I, Picón A, Acosta M, Moreno-Fernandez-de-Leceta A, Garrote E, et al. MRI deep learning-based solution for Alzheimer’s disease prediction. J Pers Med. 2021;11(9):902. doi:10.3390/jpm11090902. [Google Scholar] [PubMed] [CrossRef]
45. Islam J, Zhang Y. Brain MRI analysis for Alzheimer’s disease diagnosis using an ensemble system of deep convolutional neural networks. Brain Inform. 2018;5(2):2. doi:10.1186/s40708-018-0080-3. [Google Scholar] [PubMed] [CrossRef]
46. Altaf T, Anwar SM, Gul N, Majeed MN, Majid M. Multi-class Alzheimer’s disease classification using image and clinical features. Biomed Signal Process Control. 2018;43(4):64–74. doi:10.1016/j.bspc.2018.02.019. [Google Scholar] [CrossRef]
47. Liu S, Liu S, Cai W, Che H, Pujol S, Kikinis R, et al. Multimodal neuroimaging feature learning for multiclass diagnosis of Alzheimer’s disease. IEEE Trans Biomed Eng. 2015;62(4):1132–40. doi:10.1109/tbme.2014.2372011. [Google Scholar] [PubMed] [CrossRef]
48. Shahzad I, Khan SUR, Waseem A, Abideen ZUI, Liu J. Enhancing ASD classification through hybrid attention-based learning of facial features. Signal Image Video Process. 2024;18(1):475–88. doi:10.1007/s11760-024-03167-4. [Google Scholar] [CrossRef]
49. Sarshar NT, Sadeghi S, Kamsari M, Avazpour M, Ghoushchi SJ, Ranjbarzadeh R. Advancing brain MRI image classification: integrating VGG16 and ResNet50 with a multi-verse optimization method. BioMed. 2024;4(4):499–523. doi:10.3390/biomed4040038. [Google Scholar] [CrossRef]
50. Rahman MA, Masum MI, Hasib KM, Mridha MF, Alfarhood S, Safran M, et al. GliomaCNN: an effective lightweight CNN model in assessment of classifying brain tumor from magnetic resonance images using explainable AI. Comput Model Eng Sci. 2024;140(3):2425–48. doi:10.32604/cmes.2024.050760. [Google Scholar] [CrossRef]
Cite This Article
 Copyright © 2025 The Author(s). Published by Tech Science Press.
This work is licensed under a Creative Commons Attribution 4.0 International License , which permits unrestricted use, distribution, and reproduction in any medium, provided the original work is properly cited.
 Downloads
 Citation Tools