
 Submit a Paper
 Propose a Special lssue
 Open Access
ARTICLE

Explainable Data-Driven Modeling for Optimized Mix Design of 3D-Printed Concrete: Interpreting Nonlinear Synergies among Binder Components and Proportions
Department of Civil Engineering, College of Engineering, King Saud University, Riyadh, 12372, Saudi Arabia
* Corresponding Authors: Yassir M. Abbas. Email: ; Abdulaziz Alsaif. Email:
(This article belongs to the Special Issue: Frontiers in Computational Modeling and Simulation of Concrete)
Computer Modeling in Engineering & Sciences 2025, 145(2), 1789-1819. https://doi.org/10.32604/cmes.2025.073088
Received 10 September 2025; Accepted 28 October 2025; Issue published 26 November 2025
 View Full Text
 Download PDF
Abstract
The rapid advancement of three-dimensional printed concrete (3DPC) requires intelligent and interpretable frameworks to optimize mixture design for strength, printability, and sustainability. While machine learning (ML) models have improved predictive accuracy, their limited transparency has hindered their widespread adoption in materials engineering. To overcome this barrier, this study introduces a Random Forests ensemble learning model integrated with SHapley Additive exPlanations (SHAP) and Partial Dependence Plots (PDPs) to model and explain the compressive strength behavior of 3DPC mixtures. Unlike conventional “black-box” models, SHAP quantifies each variable’s contribution to predictions based on cooperative game theory, which enables causal interpretability, whereas PDP visualizes nonlinear and interactive effects between features that offer practical mix design insights. A systematically optimized random forest model achieved strong generalization (R2 = 0.978 for training, 0.834 for validation, and 0.868 for testing). The analysis identified curing age, Portland cement, silica fume, and the water-to-binder ratio as dominant predictors, with curing age exerting the highest positive influence on strength development. The integrated SHAP-PDP framework revealed synergistic interactions among binder constituents and curing parameters, which established transparent, data-driven guidelines for performance optimization. Theoretically, the study advances explainable artificial intelligence in cementitious material science by linking microstructural mechanisms to model-based reasoning, thereby enhancing both the interpretability and applicability of ML-driven mix design for next-generation 3DPC systems.Keywords
In the construction sector, 3D printing (3DP) has swiftly gained attention, emerging as a promising technology that is altering established practices in architectural design and structural fabrication. Unlike traditional methods, this technology addresses some of the most pressing challenges faced by the industry, including labor shortages, resource depletion, and increased safety demands [1,2]. Extensive experimental investigations have highlighted the substantial advantages of 3DP, reporting reductions in material waste by 30%–60%, construction timelines by 50%–70%, and labor expenditures by 50%–80% [3]. Furthermore, the elimination of formwork not only limits material usage but also contributes significantly to overall project cost-efficiency [4].
Since its conceptual inception in the mid-1990s [5], 3D concrete printing has evolved into a precision-driven, layer-wise fabrication process facilitated by advanced robotic systems [6,7]. The technique commences with the homogeneous blending of raw constituents, followed by controlled extrusion through a calibrated nozzle that ensures accurate deposition of each layer [8]. To enable a stable and uninterrupted flow, the fresh concrete must meet rigorous rheological specifications, particularly regarding pumpability and structural build-up, which are essential for maintaining layer integrity during deposition [9].
Current 3DP practices in the construction sector are broadly categorized into two primary systems. The first comprises extrusion-based methods, where material is continuously deposited along a predetermined path. The second encompasses powder-based approaches, such as the D-shape technique, which employs selective binding agents to consolidate granular materials layer by layer [10] (see Fig. 1). While these technologies advance automation and design flexibility, they also introduce new material challenges, particularly in terms of mechanical behavior. Recent investigations into high-volume fly ash composites modified with nano-attapulgite clay have revealed a distinct enhancement in rheological performance, particularly in terms of yield strength and structural recovery, without inducing undesirable increases in viscosity. This balance between flow resistance and cohesiveness has proven crucial for maintaining geometric stability during extrusion, thereby facilitating more reliable layer stacking and superior print integrity in 3D-printed concrete (3DPC) systems [11]. Critical engineering parameters (e.g., compressive strength (CS), modulus of elasticity, flexural strength, and tensile capacity) remain fundamental to evaluating the structural viability of printed elements. Accurate prediction of CS in 3DPC based on its compositional design is particularly vital for performance optimization and for reducing dependence on labor-intensive “trial-and-error” mix design strategies [12,13]. Traditional approaches often rely on repetitive adjustments, which become increasingly impractical as the number of interacting variables increases and the relationships among them grow more nonlinear and complex. Recently, machine learning (ML) frameworks have been efficiently utilized to predict and optimize the CS of 3DPC, which facilitates the development of robust mix designs.
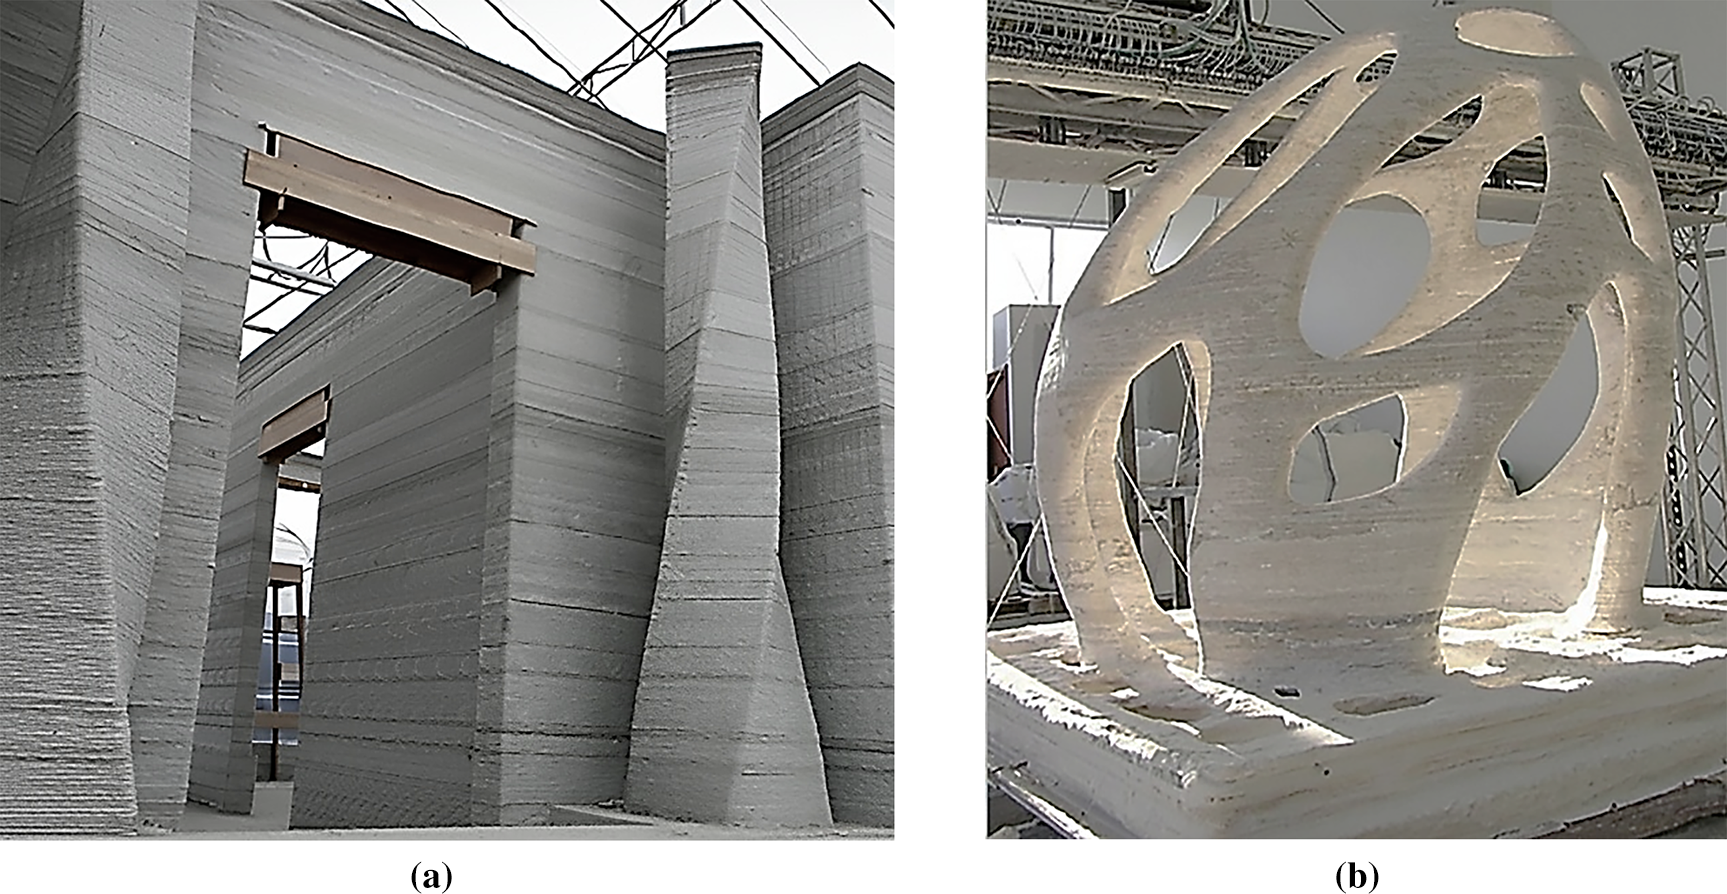
Figure 1: 3DPC techniques: (a) extrusion [14], and (b) D-shape [15]
Over the past decade, the application of ML to 3DPC has grown considerably, supported by increasingly comprehensive datasets. ML offers a practical alternative to labor-intensive experimental campaigns. In this context, Zhu et al. [16] combined experimental observations with numerical simulations to construct an ML-based framework for estimating both compressive and flexural strengths of aggregate-modified 3DPC. Their results showed that the inclusion of silica fume, ground tire rubber, and glass fibers improved the material’s cost-effectiveness while simultaneously enhancing its stress–strain response. In a complementary effort, Alyami et al. [1] compiled a dataset of 299 specimens and benchmarked seven algorithms [support vector regression, decision trees, SVR with bagging and boosting, random forests, gradient boosting, and gene expression programming] to forecast the CS of 3D-printed fiber-reinforced concrete (3DP-FRC). Their analysis revealed that water dosage, silica fume content, superplasticizer concentration, sand fraction, and the orientation of loading were the most influential variables governing CS. Collectively, these investigations highlight the capacity of ML tools to capture complex multivariate interactions in 3DPC systems, while also emphasizing the significance of tailored binder compositions and process parameters in determining mechanical performance.
Moreover, Ghasemi and Naser [5] assembled a database of more than 300 experimental records to examine the CS of 3DPC mixtures. They compared traditional multilinear regression with two explainable artificial intelligence (XAI) algorithms (Random Forest and XGBoost) and reported that XAI-driven approaches not only achieved higher predictive accuracy but also offered greater interpretability. Along similar lines, Arif et al. [17] employed three algorithms [Gene Expression Programming, Multi-Expression Programming (MEP), and Decision Trees (DT)] to model the CS of 3DP-FRC using 299 experimental samples. Their analysis emphasized the central roles of water dosage, silica fume proportion, fiber diameter, curing duration, and loading orientation in strength development.
Efforts to integrate optimization strategies with ML have also been documented. Yao et al. [18] trained two models on experimental datasets and incorporated the beetle antennae search (BAS) algorithm, successfully predicting the mechanical behavior of steam-cured concrete. Malik et al. [19] broadened the scope by creating a dataset containing 21 mixture parameters and four output variables, including printed and cast CS and slump flow. They benchmarked several algorithms [XGBoost, Support Vector Machines (SVM), Decision Tree Regression (DTR), Gaussian Process Regression (GPR), and Artificial Neural Networks (ANN)] to capture the relationships between mix design and mechanical response. In structural contexts, Mütevelli Özkan and Aldemir [20] developed ML models tailored to forecast the ultimate axial capacity and displacement behavior of 3DPC walls. Uddin et al. [21] further explored fiber-reinforced systems using multiple algorithms (RF, SVM, XGBoost, LightGBM, CatBoost, and NGBoost), demonstrating that CS was governed primarily by the water-to-binder ratio (WB) and cement dosage, whereas flexural strength was most sensitive to loading orientation and fiber volume. Complementary work by Rehman et al. [22] highlighted the value of data augmentation: by applying deep generative adversarial networks (DGAN) and bootstrap resampling (BR), they improved the training of SVM, ANN, and XGBoost models, which in turn enhanced predictions of slump flow and anisotropic compressive strength.
Advancements in optimization-focused ML frameworks have also been notable. Izadgoshasb et al. [23] combined artificial neural networks with a multi-objective grasshopper optimization algorithm (MOGOA) to refine extrusion-based compressive strength predictions. Uddin et al. [24] adopted a broader comparative strategy, applying eight ML algorithms to more than 299 mixtures with 11 features. Their best-performing models achieved R2 values between 0.927 and 0.990 on training sets and 0.914 and 0.988 on testing sets, confirming high generalization capability. Parallel to mechanical properties, Rasel et al. [25] shifted attention to rheology, developing ML models for spreading diameter (SPD), static and dynamic yield stresses (SYs and DYs), and plastic viscosity (PV) using ANN, RF, DT, CatBoost, and XGBoost. Their findings confirmed that fresh-state properties could be predicted with a high degree of accuracy.
Recent developments in XAI have further advanced the integration of interpretability into materials design workflows, particularly in mix optimization. The latest studies reveal two complementary directions: (i) embedding post-hoc explainers (most notably SHAP) into predictive-to-optimization pipelines, and (ii) coupling surrogate or inherently interpretable models such as MEP and dependence plots with ensemble-based learners to expose actionable feature relationships [26–28]. These approaches collectively excel conventional black-box models by generating transparent, data-driven insights that directly inform mix-design decision-making processes. Specifically, SHAP-based attribution methods have been employed to rank and quantify the influence of mixture variables on strength, thereby revealing nonlinear feature interactions and their relative importance. In parallel, Partial Dependence Plots (PDP) and Individual Conditional Expectation analyses have been widely used to visualize complex dependencies (e.g., nonlinear responses to foam content or the water-to-cement ratio)—thus explaining meaningful thresholds for optimization [26]. Recent advances also demonstrate the potential of integrating Auto-ML with explainability tools, where automatic model selection is paired with SHAP or PDP to retain interpretability throughout the model search process and link these insights directly to multi-objective optimization (MOO) frameworks [27]. In addition, MEP-based surrogate formulations have been proposed to derive explicit, interpretable equations verified through SHAP and PDP analyses, enabling transparent deployment for engineering use [26]. Several recent investigations have further integrated SHAP-derived feature importance into optimization algorithms such as non-dominated sorting genetic algorithm II (NSGA II) and TOPSIS to generate interpretable Pareto frontiers, balancing mechanical performance, cost, and sustainability metrics [26–28].
Despite their predictive accuracy, most existing ML models for concrete and composite materials continue to operate as “black boxes”, which offer little insight into the physical mechanisms underlying their predictions. This lack of interpretability restricts their utility in structural design, quality assurance, and performance optimization. To further contextualize this limitation, Table 1 presents a comparative analysis between traditional ML models (e.g., ANN, XGBoost, GBM) and the interpretable approach employed herein. As shown, while conventional algorithms achieve high accuracy (R2 ≈ 0.85–0.96), they lack interpretability and fail to provide actionable guidance for material optimization. In contrast, the integrated SHAP–PDP framework delivers comparable predictive performance (R2 ≈ 0.87–0.95) while offering transparent, physics-consistent explanations of feature interactions and their influence on strength development. Specifically, SHAP quantifies each variable’s contribution to the predicted output, which reveals the relative influence of curing age, cement content, and binder proportions, whereas PDP visualizes the nonlinear relationships and identifies optimal parameter ranges for achieving target mechanical performance. This dual explainability framework enhances model credibility, enables rational mix proportioning, and supports data-driven decision-making in advanced material design.

The present work addresses this issue by embedding interpretability directly into the modeling process. Specifically, we employ SHAP, a game-theoretic approach that quantifies the individual contribution of each feature, alongside feature importance rankings and PDPs. This framework enables sensitivity assessments that clarify how specific mix design and curing parameters affect CS. Importantly, the variables incorporated here were carefully chosen based on their documented significance in 3DPC performance [1]. While factors such as environmental exposure, interlayer bonding, and process parameters (e.g., layer height and deposition velocity) are also known to influence strength development [33], the current analysis focuses on the critical mix-related and curing parameters highlighted by earlier reviews [34,35]. Through this emphasis on transparency and interpretability, the study contributes to more reliable, data-driven strategies for optimizing sustainable 3DPC mixtures.
2 Compilation and Structuring of the Study’s Database
2.1 Experimental Data and Definition of the Study Variables
The dataset utilized in this research was methodically assembled from 56 peer-reviewed experimental studies (summarized in Table 2) that incorporate a total of 312 individual 3DPC formulations that satisfied the defined inclusion parameters. Each entry represents an independent mix design containing complete quantitative details on mixture composition, curing duration, and the corresponding CS. To ensure uniformity and eliminate bias across disparate sources, a comprehensive data refinement and normalization procedure was adopted. All numerical values were first recalibrated to consistent SI units (expressed as kg/m³ for compositional inputs and MPa for CS). Incomplete records missing critical information (e.g., binder composition, curing period, or WB) were systematically excluded. Furthermore, to reduce inconsistencies arising from variations in laboratory protocols, curing conditions were normalized to a standard reference of 20 ± 2°C and a curing age range of 1 to 56 days. Following this rigorous standardization and verification process, 312 high-integrity data points were preserved for subsequent modeling. The finalized dataset includes nine predictive input parameters and a single output variable, as listed in Table 3. All compiled results conform to internationally recognized testing standards (ASTM C39 and EN 12390-3), thereby ensuring the reliability, reproducibility, and scientific robustness of the analyses and predictive models derived from this dataset.


2.2 Statistical Analysis and Preprocessing of Data
2.2.1 Explanatory Data Analysis
The statistical characteristics of the dataset are summarized in Table 4, while Fig. 2 offers a graphical representation of both input variables and the target output through violin plots. This analysis reflects the diversity of mix formulations and performance outcomes of the compiled data. PC spans a broad range, but the interquartile values, 345.3 kg/m3 (lower quartile, Q1) and 666.0 kg/m3 (upper quartile, Q3), indicate that most mixes fall within a conventional dosage space. This distribution suggests a central tendency toward moderate cement use, with relatively few mixes exhibiting exceptionally high PC values. In contrast, the distribution of SF and FA is markedly skewed. Both exhibit a Q1 of zero, which highlights the incidence of mixes that exclude supplementary cementitious materials (SCMs). However, their respective Q3 (SF: 82.0 kg/m3; FA: 166.0 kg/m3) imply that, when included, these materials are dosed within moderate bounds. The presence of high maximum values for these binders may point to experimental or performance-optimized mixtures targeting advanced rheological or mechanical properties.
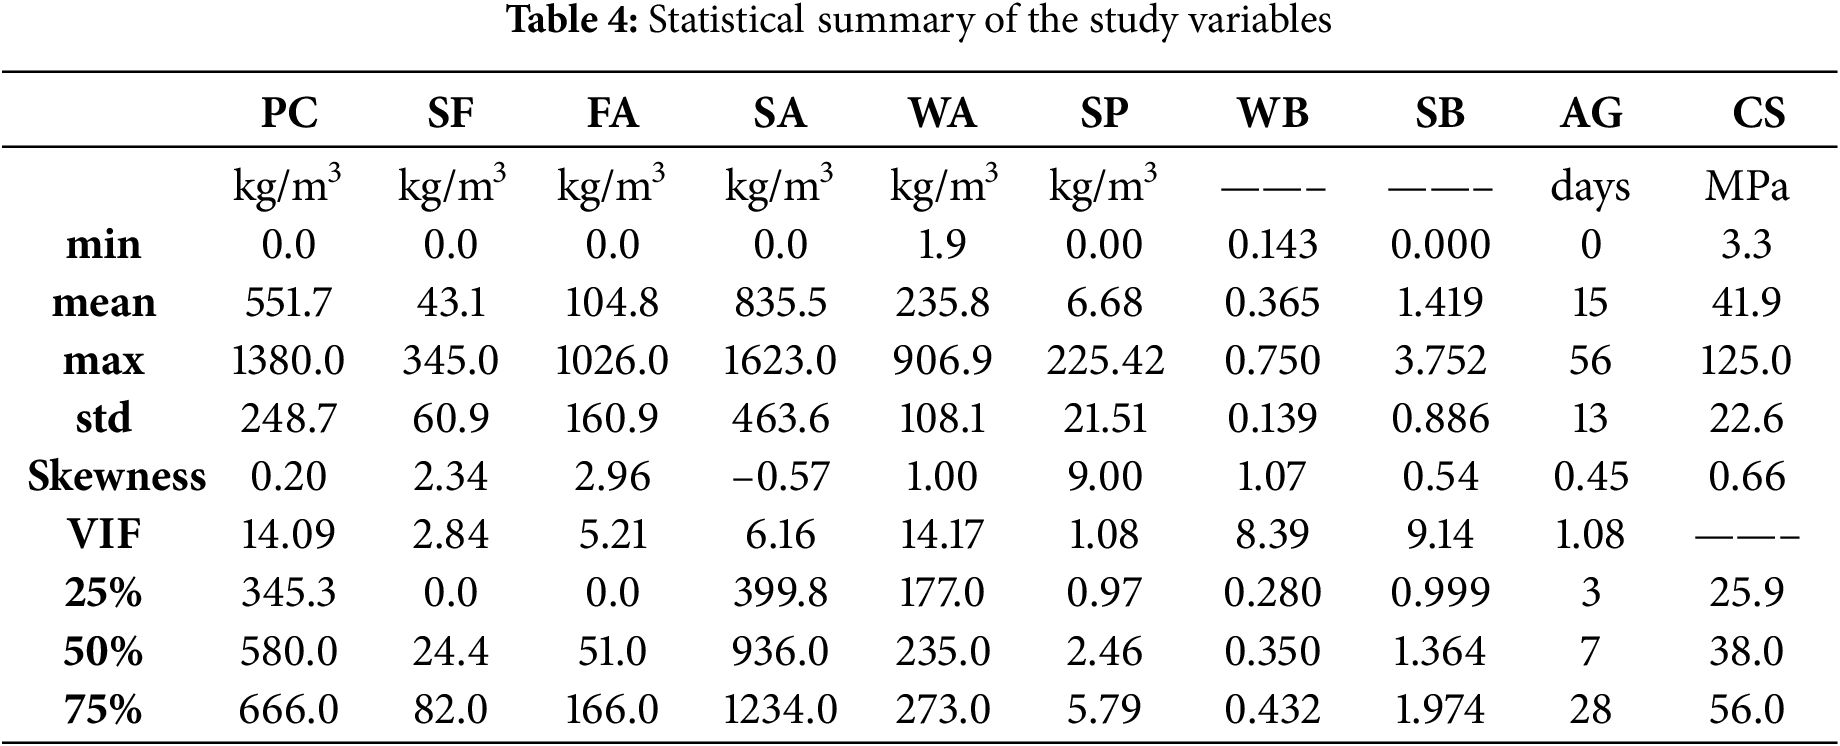
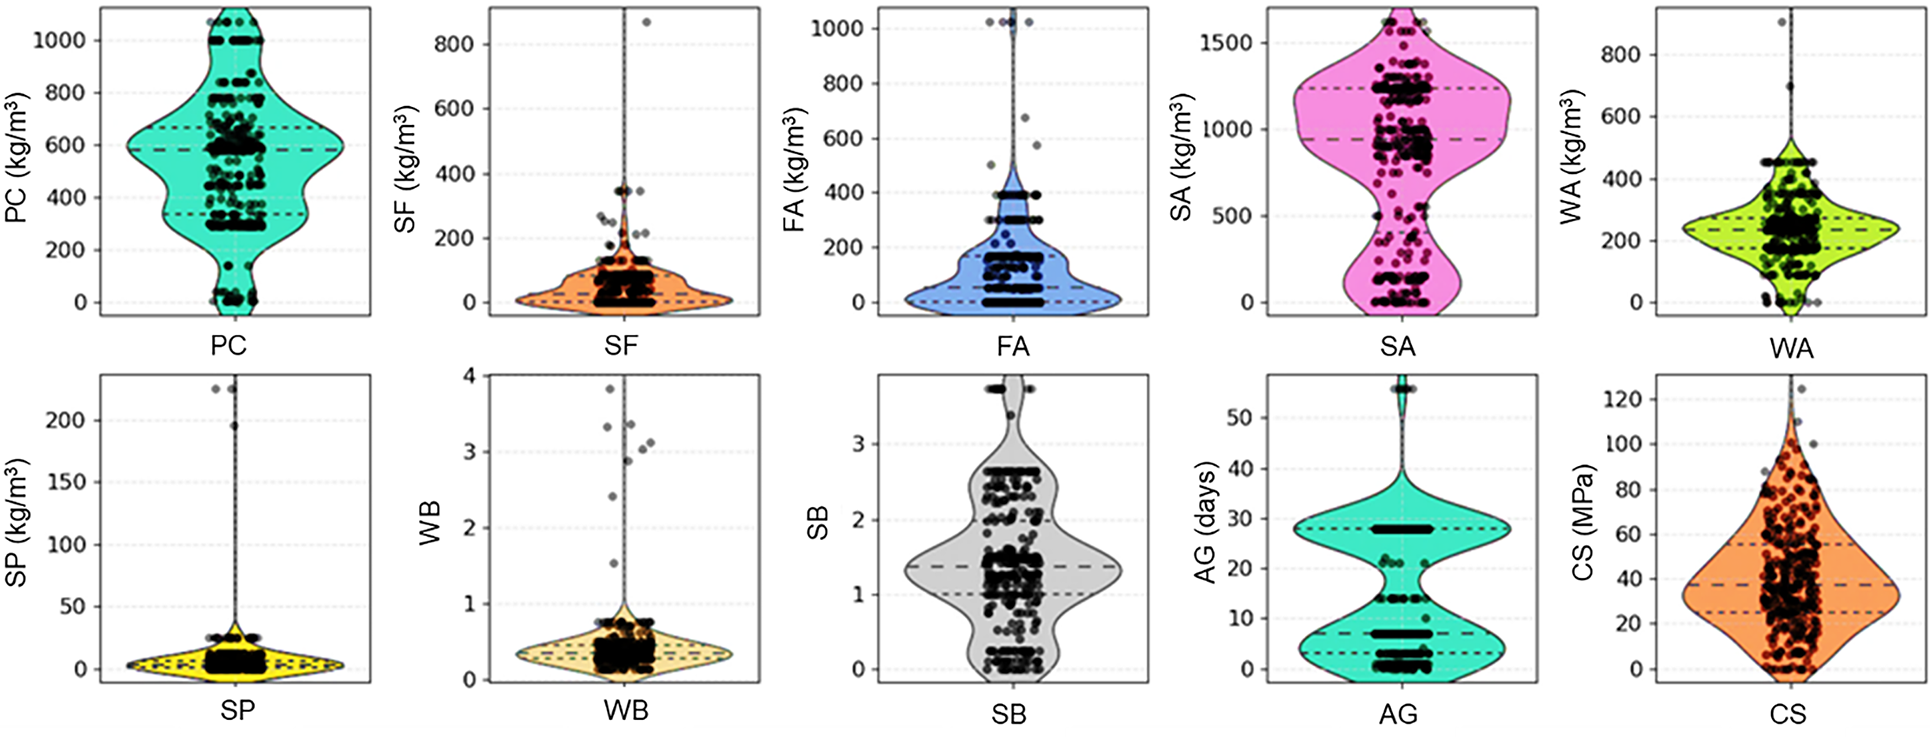
Figure 2: Violin plots depicting the distribution of the study variables
In addition to the descriptive statistics, Table 4 includes both skewness (calculated as Fisher’s standardized third moment) and the Variance Inflation Factor (VIF) to assess potential multicollinearity among predictors. The VIF values were computed by performing an auxiliary regression for each variable against all others, following the relationship
Additionally, SA dosage exhibits a particularly wide spread (0–1623 kg/m3) with a mean of 835.5 kg/m3. While this average aligns with typical values observed in conventional concrete, the extent of the range and its substantial standard deviation (463.6 kg/m3) highlight the presence of highly variable mix strategies. Some mixes appear to have significantly low sand content, whereas others seem intentionally designed to be rich in fine aggregate, potentially to facilitate flowability or enhance print stability (self-consolidating 3DPC).
Moreover, WA also reveals notable variation (1.9–906.9 kg/m3). While the majority of samples align with standard water dosage ranges, the extreme upper values suggest that certain mixes may rely on higher water content, possibly to counterbalance high binder or aggregate levels. Conversely, the very low minimum values may either indicate data anomalies or mixes that rely heavily on chemical admixtures to achieve workability with minimal water (an approach common in high-performance concrete). SP dosages (ranging from 0.0 to 20.8 kg/m3) are similarly skewed. The interquartile range (Q1–Q3: 0.97–5.79 kg/m3) suggests standard practice in the majority of samples, though exceptionally high dosages appear in select formulations. These higher values likely correspond to ultra-low WB ratio systems, where high admixture levels are necessary to ensure sufficient dispersion and flow.
The WB ratio itself demonstrates a clear bias toward strength-optimized formulations. The interquartile spread (0.280 to 0.432) confirms a dominant trend toward low WB values, typically associated with reduced porosity and enhanced mechanical performance. The breadth of SB distribution (0–3.752) likely reflects a variety of particle packing approaches and rheological targets. The inclusion of high SB ratios in some mixes may point to economic or process-driven motivations, where cost-effectiveness or printability takes precedence over strength.
The AG (0–56 days) further reflects the variability in performance assessment protocols. The mean curing age (15 days) and the standard deviation (13 days) imply a dataset weighted toward early-age strength evaluations, a common practice in assessing the rapid hardening behavior of 3DPC. Finally, the CS ranges widely (Q1: 25.5; Q3: 56.0 MPa), which suggests that about 50% of the dataset includes a broad spectrum of strength classifications. The upper limit (125 MPa) confirms the inclusion of ultrahigh performance concrete (UHPC) formulations. Altogether, the dataset embodies significant variability across all input and output parameters, capturing a rich diversity of mix designs, binder systems, and performance profiles. While this heterogeneity enhances the generalizability and representativeness of data-driven modeling, it also highlights the importance of rigorous feature selection, careful handling of outliers, and stratified sampling to ensure the reliability and robustness of predictive models.
2.2.2 Exploring the Correlations between the Study Variables
To explore the relationships among the variables in this study, both Pearson’s and Spearman’s correlation coefficients were employed, as detailed in Eqs. (1) and (2). Pearson’s coefficient (
where,
In both Pearson’s and Spearman’s matrices (Fig. 3), CS displays strong positive correlations with SF. This result aligns with the established understanding that higher use of high-reactivity SCMs like SF contributes to denser microstructures and improved strength development. The high correlation in both matrices confirms that this relationship is not only linear but also consistent in monotonic trends across the dataset. Moreover, FA shows weak or no consistent correlation with CS, which may reflect the variability in its reactivity depending on its class (e.g., Class F or C), dosage, and synergy with other SCMs. Conversely, WB exhibits a strong negative correlation with CS in both correlation measures. This is theoretically consistent with the well-known inverse relationship between WB ratio and strength in cementitious systems, where higher WB ratios typically lead to increased porosity and reduced mechanical performance. The negative correlation is slightly stronger in Spearman’s matrix, which suggests that even in cases where the WB–CS relationship deviates from strict linearity, the overall downward trend remains robust across varying mix proportions.
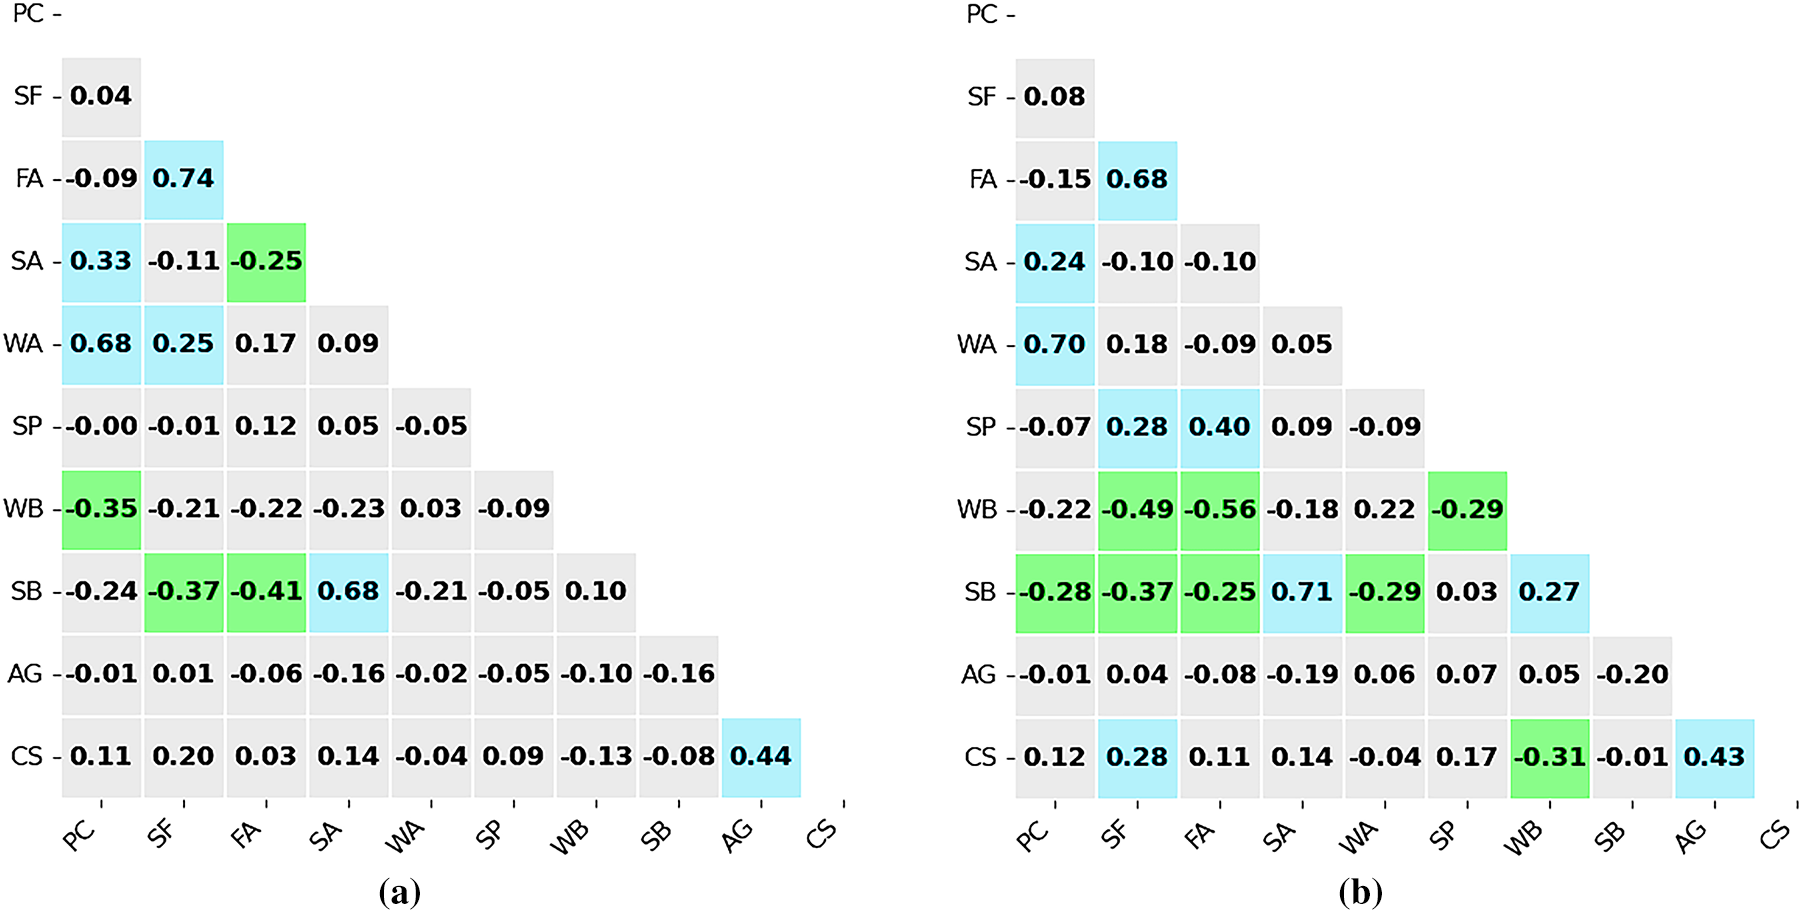
Figure 3: Variable correlations: (a) Pearson’s and (b) Spearman’s correlation coefficients
Additionally, SP shows a mild to moderate positive correlation with CS, more pronounced in Spearman’s matrix. This can be interpreted as evidence of nonlinear interaction, where increased SP dosage enhances flowability at lower WB, indirectly promoting better particle packing and strength development. The stronger Spearman’s coefficient supports the idea that SP’s role in strength gain may not follow a direct linear path but instead depends on complex rheological and mix design interactions. Interestingly, SB and SA exhibit weak or negligible correlations with CS in both matrices. This suggests that within the range of mix designs analyzed, these variables have limited direct influence on CS, possibly due to compensatory effects or because their influence is conditional on other mix parameters (e.g., binder content, SP dosage). Such low correlations indicate that fine aggregate content may play a more indirect role, perhaps impacting printability or fresh-state properties rather than hardened strength. Whereas AG demonstrates a moderate to strong positive correlation with CS in both matrices, with a slightly higher coefficient in the Spearman analysis. This observation reflects the well-established kinetics of cement hydration, where strength development is inherently time-dependent, and longer curing periods allow for more complete hydration, especially in mixes with SCMs.
To assess the influence of individual observations on the regression model, Cook’s distance was applied as a diagnostic measure of influence [91]. This metric quantifies how much a fitted model’s predictions would change if a specific data point were removed. Observations with Cook’s distance values exceeding the conventional threshold of
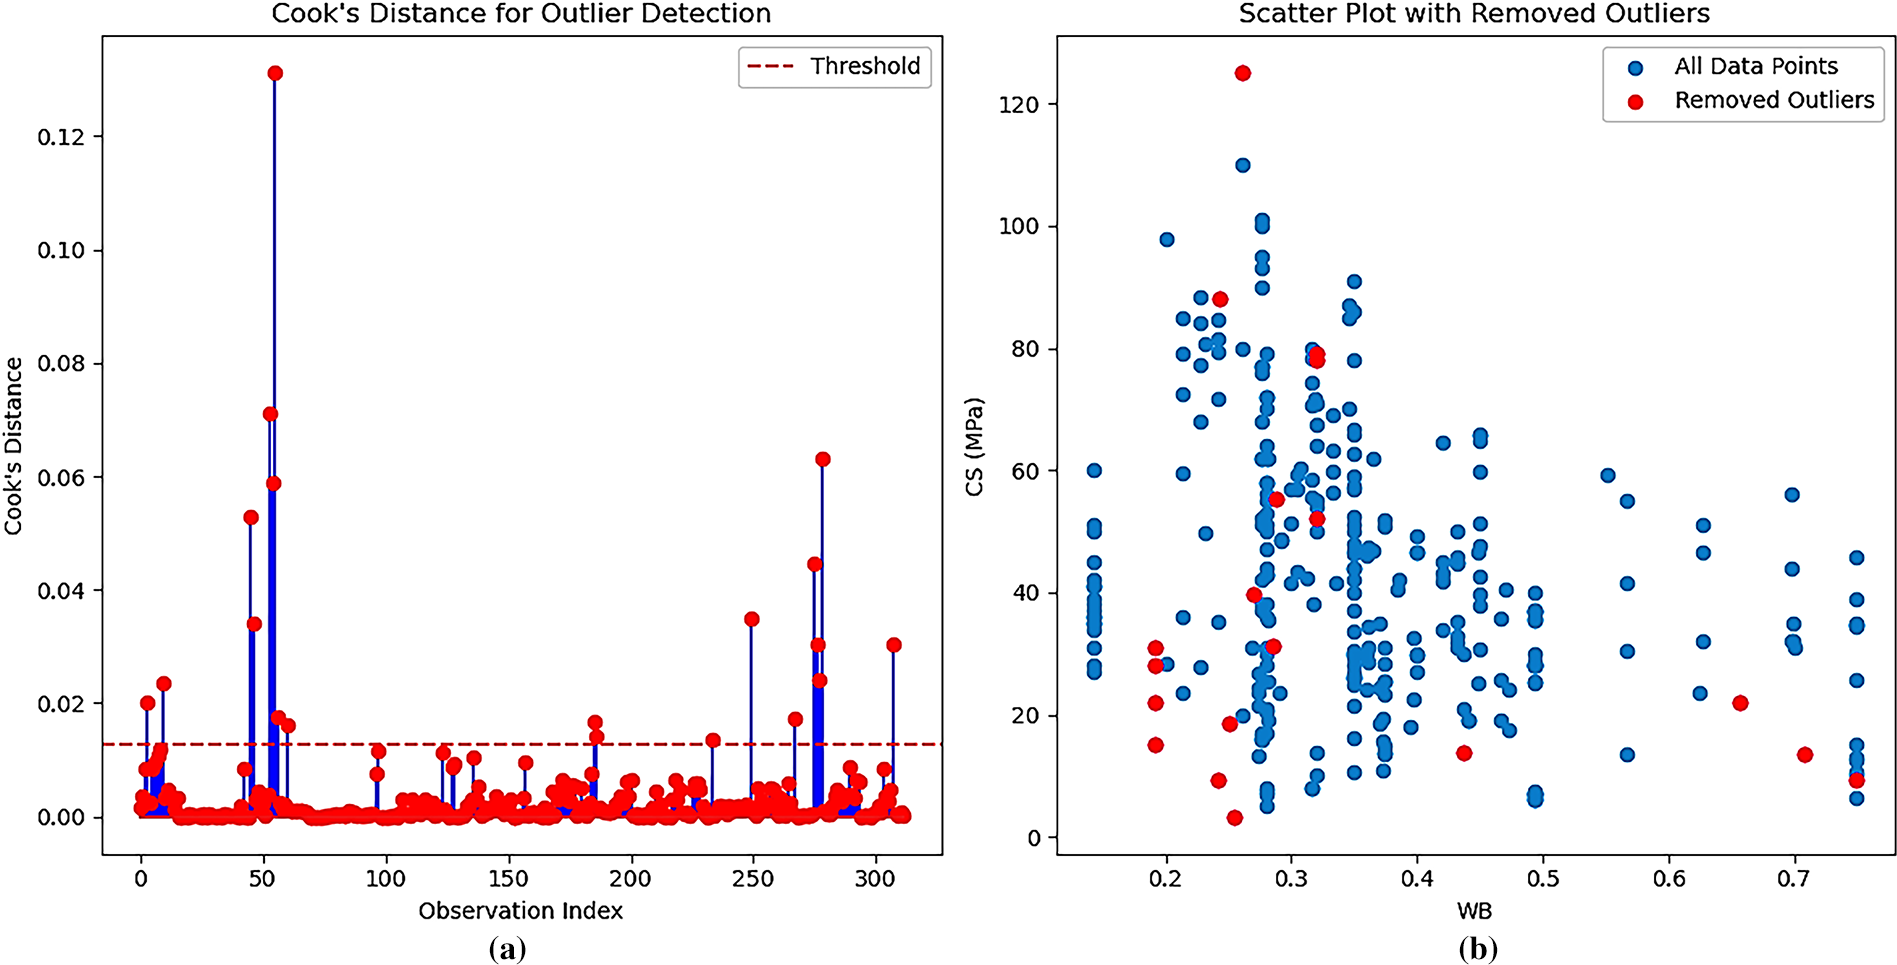
Figure 4: Outlier identification and elimination: (a) Cook’s distance and (b) outlier removal
After eliminating the most influential outliers, the dataset underwent normalization to establish a uniform scale across all predictor variables before model development. Because the input features varied considerably in both units and magnitude (e.g., spanning values expressed in kg/m3, %, and curing durations in days), standardization was essential to avoid biasing the algorithms toward variables with larger numerical ranges. To achieve this, a Min–Max rescaling procedure (Eq. (3)) was applied, mapping each variable to a fixed interval between 0 and 1. This transformation preserved the underlying distributional structure of the data while ensuring that all features contributed on a comparable scale during training.
In this formulation,

Figure 5: Distribution of: (a) normalized SB, and CS: (b) before-, and (c) after outlier removal
3 Framework for Data-Driven Predictive Modeling
3.1 Fundamental Principles of Tree-Based Decision Models
Decision trees (DTs) are supervised learning methods that rely on a hierarchical, tree-like architecture to perform both classification and regression tasks. The structure consists of a root node, a series of internal decision points, connecting branches, and terminal leaves, which collectively partition the dataset into increasingly uniform subsets [92]. The algorithm employs a recursive, top-down procedure often described as a greedy strategy, since at each step it selects the attribute that most effectively reduces uncertainty and sharpens the decision boundary. This process continues until the data are divided into subsets that exhibit maximum possible homogeneity. The choice of the splitting attribute is guided by impurity metrics, which evaluate how well a feature separates the data. Commonly used criteria include entropy, information gain, and the Gini index [93], each providing a quantitative basis for determining the most informative division at a given node. Here, Entropy [
DTs are among the most accessible supervised learning methods, but they are also prone to overfitting when applied to complex datasets, as they often memorize noise instead of capturing meaningful structure. To mitigate this weakness, pruning strategies are used to simplify the tree and improve its ability to generalize [94]. Pre-pruning halts tree growth early by imposing thresholds such as a minimum number of samples per split, while post-pruning trims less informative branches once the full tree has been constructed, thereby reducing unnecessary complexity. Several classical algorithms underpin DT construction. The ID3 (Iterative Dichotomiser 3) algorithm selects attributes based on entropy and information gain, while its successor, C4.5, introduces the gain ratio to offset biases toward multi-valued features. In contrast, the CART (Classification and Regression Trees) approach relies on the Gini index for classification problems and mean squared error (MSE) for regression tasks.
One of the major strengths of DTs lies in their interpretability; they provide decision rules that can be followed intuitively, making them attractive for applications where transparency is critical [95]. They can also accommodate both categorical and continuous variables, handle incomplete records, and generally require little preprocessing. Nevertheless, these advantages are balanced by key shortcomings. Without pruning, DTs can grow very deep, which makes them highly sensitive to variations in the training data and reduces their generalization capacity. Even small perturbations can result in structurally different trees, reflecting their high variance [96]. To address this instability, DTs are frequently embedded within ensemble frameworks, such as random forests and boosting methods, which aggregate predictions across multiple trees to improve accuracy and robustness. Despite these limitations, DTs remain a cornerstone of machine learning and continue to provide the foundation for more advanced ensemble and hybrid predictive models [97].
3.2 Random Forests Ensemble Learning
3.2.1 Architecture and Mechanisms
The decision forest framework, originally formalized by Dietterich [98], represents an ensemble learning strategy in which the outputs of multiple DTs are aggregated to yield more reliable predictions. In regression problems, the ensemble response is calculated as the mean of the individual tree outputs, while in classification contexts, the decision is based on majority voting. Since the current work is centered on regression, attention is placed specifically on Random Forest (RF) regression models. An RF model is composed of mmm tree estimators, each denoted as
For an ensemble such as RF to surpass the predictive strength of a single tree, two essential criteria must be satisfied: the base learners must perform better than random guessing, and their prediction errors should be sufficiently uncorrelated [101]. These conditions enable the forest to reduce variance and strengthen generalization. The ensemble prediction function is expressed as the arithmetic mean across all trees:

Figure 6: The architecture of the decision forest (opted from [104])
3.2.2 Regularization Approach for the Key Hyperparameters
To enhance the predictive reliability of the decision forest, a structured hyperparameter optimization protocol was implemented. The tuning process relied on an exhaustive grid search, systematically evaluating a broad set of parameter configurations to identify those yielding the best trade-off between accuracy, generalization, and efficiency. Three parameters known to exert a strong influence on model behavior were selected for exploration. The first was maximum tree depth (
For every configuration, the ensemble comprised 100 decision trees trained independently on the bootstrapped datasets. This deterministic approach ensured that the optimization procedure was reproducible across computational runs, eliminating variability associated with random hyperparameter sampling. By adopting this exhaustive and systematic strategy, the study achieved a rigorous evaluation of model capacity, ultimately identifying a configuration that preserved predictive strength while avoiding unnecessary complexity. This balance highlights the suitability of the tuned decision forest for real-world regression tasks, where both robustness and computational efficiency are essential.
3.2.3 Evaluation Metrics for Predictive Model Performance
The predictive performance of the model was evaluated through three complementary statistical indicators, each capturing a different dimension of accuracy. The Mean Absolute Error (MAE, Eq. (7)) was first applied to measure the average magnitude of the deviations between predicted and observed values, providing a straightforward assessment of error without considering its direction. To give greater weight to larger discrepancies, the Root Mean Squared Error (RMSE, Eq. (8)) was then calculated; by expressing error in the same units as the response variable, RMSE facilitates direct interpretation of prediction quality. Finally, the coefficient of determination (
here,
4.1 Fine-Tuning and Performance Optimization of the Random Forest Model
Fig. 7 presents the outcomes of the 1120 trained models (see Section 3.2.2), which highlight those that fall along the Pareto frontier derived from systematic hyperparameter optimization. Models located on this frontier represent the most favorable balance between training accuracy and validation generalization, as they achieve the highest validation performance for a given training score. From this set, the most effective configuration was chosen based on its ability to combine strong fitting capacity with stable validation behavior. The associated hyperparameter values and corresponding performance metrics are summarized in Table 5.

Figure 7: Comparative analysis of training accuracy vs. validation scores
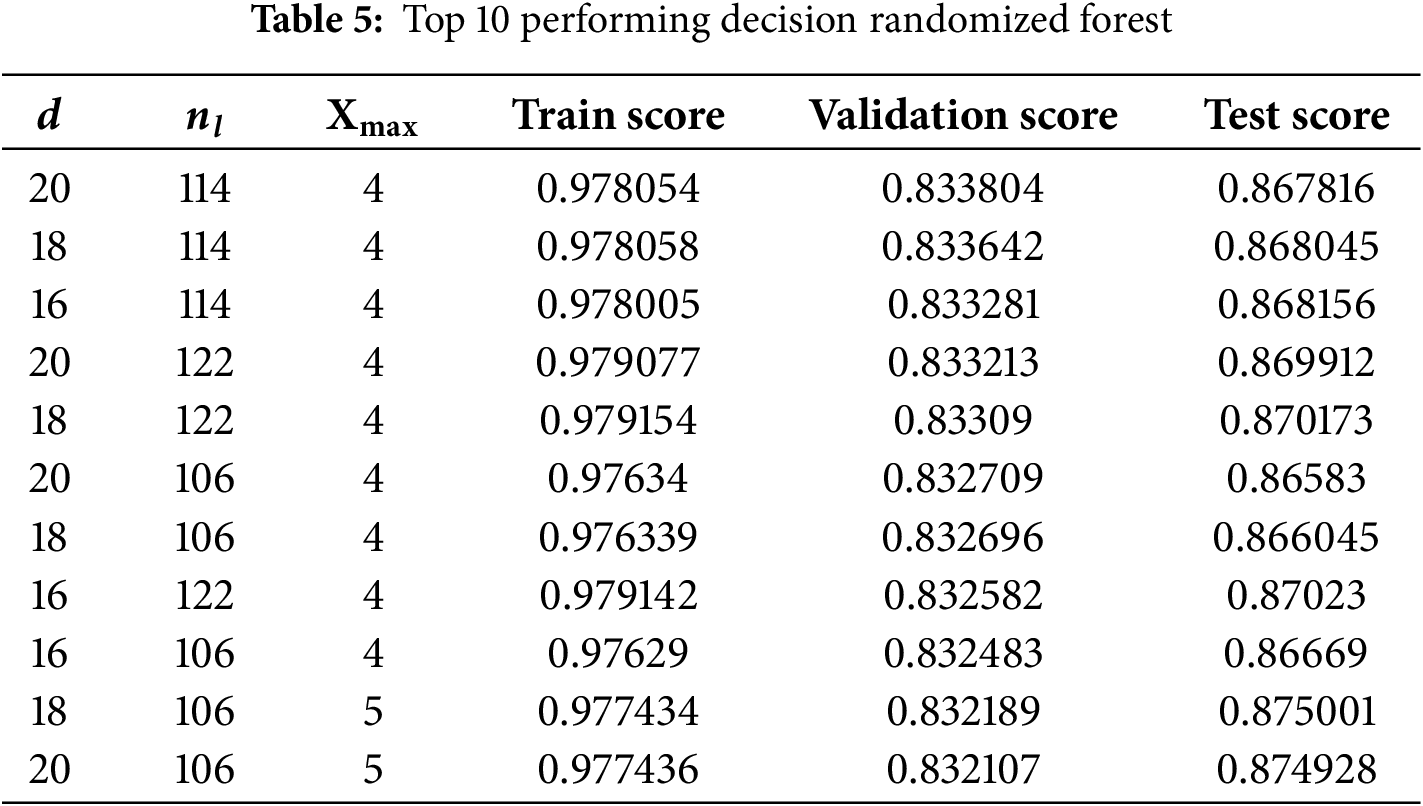
Analysis of the Pareto-optimal group reveals several consistent patterns. First, tree depth values clustered between 16 and 20, suggesting that moderately deeper structures contribute positively to predictive accuracy without sacrificing stability. Second, the number of leaf nodes generally ranged from 106 to 122, supporting the notion that constraining terminal nodes limits overfitting while preserving generalization [105]. Third, the number of features considered at each split also influenced performance: models using four features achieved slightly better validation scores (0.884) compared with those using five (0.875), although the marginal difference implies diminishing benefits beyond a certain threshold.
Comparisons across training, validation, and test scores reinforce the importance of this balance in complexity. The best-performing configuration, a depth of 20, 14 leaf nodes, and four selected features, produced scores of 0.978 (training), 0.834 (validation), and 0.868 (testing). Importantly, this model was not an outlier but part of a broader set with similar performance, indicating that optimal hyperparameters reside within a bounded range rather than a single solution. Minor fluctuations observed in the test results further suggest limited sensitivity to hyperparameter adjustments, underscoring the robustness of the tuning strategy.
4.2 Analysis and Visualization of Optimized Model Performance
Fig. 8 depicts the hierarchical architecture of the 100-tree ensemble generated through the optimized framework. The branching structure of the decision trees reveals the dominant pathways by which input variables influence the prediction of CS. At the highest level of the hierarchy, AG, WA, and SP consistently emerge as the most influential attributes. Their prominence reflects established material science principles: curing age governs strength development through hydration kinetics, water dosage affects porosity and microstructural density, and superplasticizers regulate flowability and mix uniformity. Together, these variables form the primary decision nodes, shaping the subsequent partitioning of the dataset and providing insight into the mechanisms underpinning predictive performance.

Figure 8: The 100-DT of the optimized model
Fig. 9 compares the predicted CS values with their experimental counterparts across the training, validation, and test sets, using three evaluation metrics: MAE, RMSE, and

Figure 9: Comparison of predicted and experimental compressive strength: (a) training, (b) validation, and (c) test sets
4.3 Interpretability of the Best-Performing Model
4.3.1 Identification of Key Predictive Features
To evaluate the relative influence of input parameters on the CS of 3DPC, SHAP was applied. Fig. 10a illustrates the average impact and directional influence of each feature across the dataset. Among all predictors, AG emerged as the most influential variable (mean absolute SHAP value = 9.24), significantly higher than that of any other input. This finding underlines the central role of curing in strength development. Longer curing periods facilitate the continued hydration of cement particles and promote the pozzolanic reaction of SCMs, which results in a denser, more cohesive binder matrix and, consequently, higher CS [106]. The prominence of AG in the model’s interpretation aligns with the well-established link between time-dependent microstructural evolution and mechanical performance.
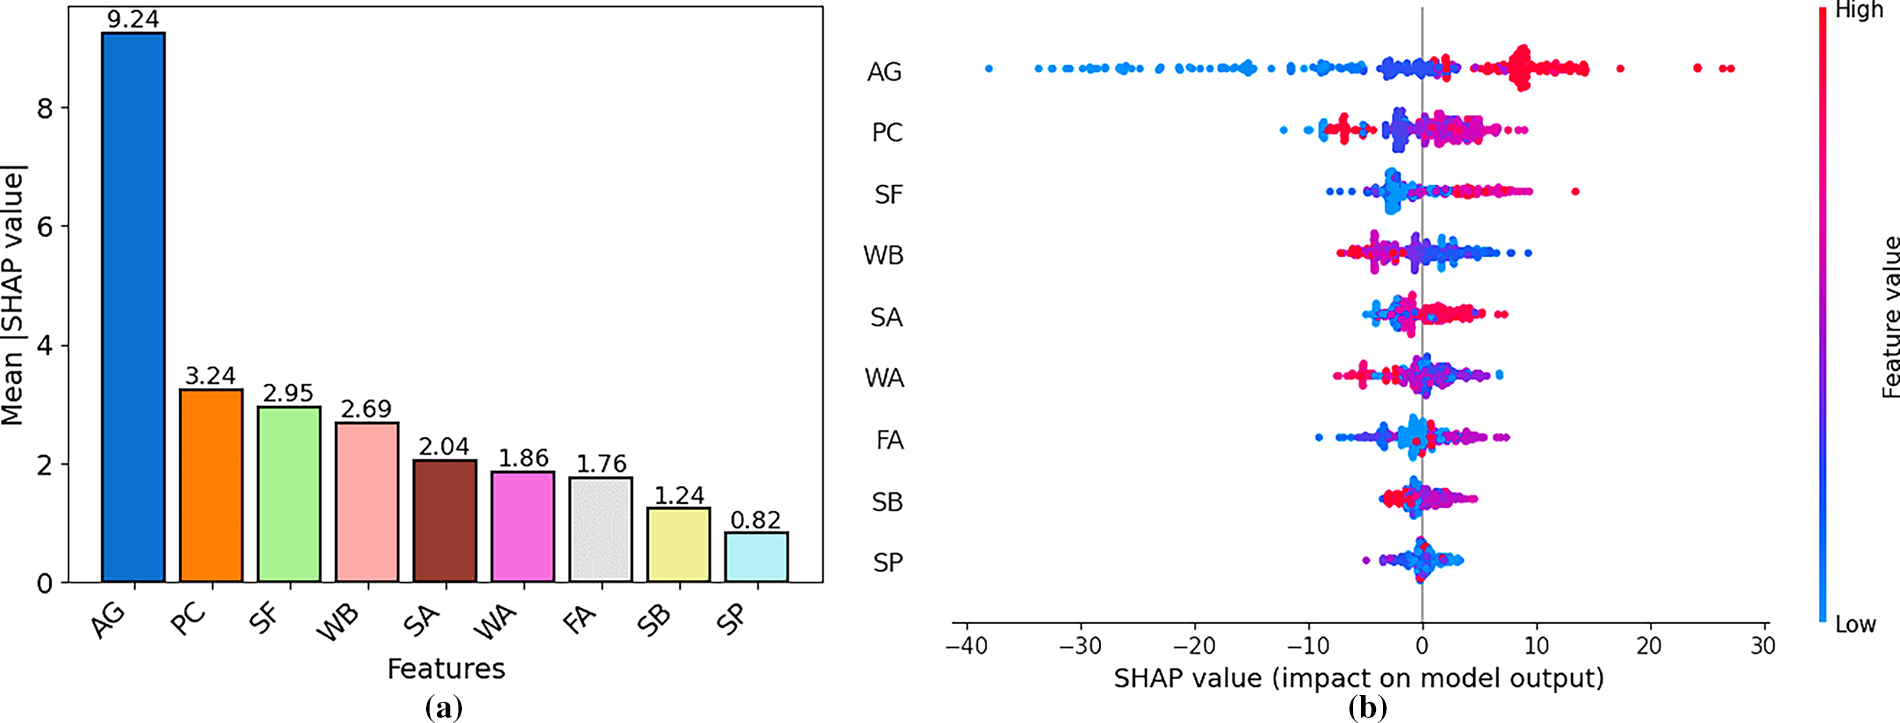
Figure 10: Feature importance assessment via: (a) mean absolute- and (b) true-SHAP contributions to model predictions
Following AG, PC, SF, and the WB were identified as the next most significant contributors. The dominant role of PC is anticipated, as it is the primary source of calcium silicate hydrate (C-S-H), the binding phase responsible for strength in hydrated cement systems. SF, a highly reactive SCM with ultra-fine particle size, improves packing density, enhances the interfacial bond between printed layers, and promotes the formation of additional C-S-H through its pozzolanic reaction [1]. Its contribution is particularly relevant in 3DPC, where layer adhesion and microstructural refinement are critical. Notably, WB exhibits a distinct inverse relationship with CS (as the WB ratio decreases, SHAP values increase, which indicates a favorable influence on strength). This reflects the reduced porosity and improved density achieved with lower water content, provided that sufficient workability is maintained to ensure printability.
Mid-tier contributors include SA, WA, and FA. While not as dominant, these features still play meaningful roles. SA influences rheological behavior and particle packing, which affect layer deposition and structural integrity in 3D printing. FA, depending on its class and fineness, may contribute to long-term strength development through pozzolanic activity, especially when adequate curing is provided [107]. However, its effect is less pronounced than that of SF, likely due to its lower reactivity.
At the lower end of the SHAP ranking are the SB and SP. While SP is essential for improving flowability, especially in low-WB mixtures, its impact on hardened strength is indirect. Overdosage may adversely affect setting characteristics or lead to segregation, which may explain its limited influence on the SHAP results. Similarly, variations in SB are more closely associated with printability and buildability than with strength outcomes [16].
The SHAP value distribution in Fig. 10b provides additional insight into how individual feature values affect model output. Higher AG and PC levels consistently lead to positive SHAP values, reinforcing their contribution to strength development. Conversely, elevated WB ratios are associated with negative SHAP values, reaffirming their detrimental effect on mechanical performance. These findings highlight the complex, interdependent nature of 3DPC, where material composition, mix proportions, and curing protocols interact to determine structural properties. Importantly, the SHAP-based analysis not only confirms existing empirical knowledge but also offers quantitative validation of key variables affecting 3DPC. These results are consistent with previous studies emphasizing the importance of mix design, interlayer bonding, and environmental curing conditions in shaping CS outcomes [106,108,109].
4.3.2 Analysis of Synergistic Effects
Synergistic Interactions between Binder Constituents
Fig. 11 displays 3D PDPs that capture the interactive effects of key binder constituents (PC, SF, and FA) on the CS of 3DPC. Within the context of ML, PDPs offer a powerful means of interpretability by isolating the influence of one or two selected input variables on a model’s output while marginalizing the contribution of all other features [104]. These visualizations are particularly useful for the recognition of non-linear or synergistic interactions that are not immediately apparent from feature importance rankings. To complement the multivariate insights presented here, individual one-dimensional PDPs for each feature are included in the Appendix A, which offers a complete view of how each input independently affects CS.

Figure 11: 3D PDPs illustrating the synergistic interactions between: (a) PC-SF, (b) PC-FA, and (c) SF-FA on model predictions
In Fig. 11a, the joint influence of PC and SF is characterized by a cooperative, non-linear interaction, where CS exceeds 50 MPa in regions where PC ranges between 600–800 kg/m3 and SF falls within 20–40 kg/m3. This compositional space appears to represent an optimal regime in which sufficient clinker supports robust hydration while SF promotes microstructural densification through both chemical and physical mechanisms. The fine SF particles not only enhance the packing density but also participate in pozzolanic reactions with CH, which forms additional C-S-H [110]. Their role as nucleation agents further accelerates hydration kinetics and improves the density of the interfacial transition zone [111]. However, the PDP also reveals a performance drop when SF content is insufficient relative to high PC levels, which highlights that binder quantity alone does not guarantee strength without microstructural optimization. Moreover, SF’s effect on rheology is noteworthy. Its ability to increase thixotropy and yield stress aids in maintaining print stability and interlayer cohesion [112], while its partial substitution for PC contributes to lower carbon emissions and improved sustainability profiles [113]. At very high dosages, however, SF may introduce workability issues or adverse shrinkage effects, especially when PC content is limited, indicating a diminishing returns threshold consistent with earlier findings [114].
Fig. 11b focuses on the interaction between PC and FA, which similarly displays a non-linear dependency. The most favorable strength outcomes (approaching 46 MPa) are observed when PC lies between 600–800 kg/m3 and FA does not exceed 200 kg/m3. In this regime, pozzolanic reactions between FA and CH result in the formation of additional C-S-H, contributing to a denser, more cohesive matrix [115]. Additionally, FA’s physicochemical characteristics, particularly its fineness and glassy phase content, control hydration kinetics and extend strength development [116]. Properly proportioned, FA also reduces the Ca/Si ratio of hydration products, enhancing dimensional stability and long-term durability. These benefits are well represented in the PDP, which aligns peak CS regions with balanced cementitious chemistry. Substituting approximately 20% of PC with FA has been shown to optimize mechanical performance while maintaining printability [117]. Beyond this optimal range, especially when PC falls below 400 kg/m3, strength markedly declines, which reflects a binder deficit detrimental to early-age performance, a critical factor in layer-by-layer construction. Notably, FA also enhances the fresh-state properties of 3DPC by improving flowability and reducing water demand due to its spherical morphology [118]. It often interacts synergistically with other SCMs such as SF or metakaolin, contributing to both rheological control and mechanical robustness [9]. Moreover, FA offers significant environmental and economic benefits, reducing clinker usage and associated CO2 emissions [113], while offering cost efficiency in large-scale additive manufacturing. Nonetheless, given the variability in FA sources, careful characterization and proportioning are essential to ensure consistent performance.
Fig. 11c presents the combined effect of SF and FA on CS, illustrating another distinct non-linear interaction. The optimal performance zone is evident when SF ranges from 100–200 kg/m3 and FA remains below 150 kg/m3, yielding predicted strengths above 50 MPa. The performance enhancement is attributable to the complementary pozzolanic activity of both materials, which intensifies CH consumption and promotes C-S-H formation [117]. SF’s ultrafine particles play a vital role in improving particle packing, occupying voids between coarser constituents, thereby reducing porosity and enhancing microstructural integrity [60]. Nevertheless, the PDP surface suggests that excessive SCM dosages result in a plateau or even a decline in performance, likely due to adverse effects on workability, delayed setting, or dilution of the primary binder phase. This is consistent with reports indicating that a blend of 15% SF and 20% FA achieves a favorable compromise between strength, flowability, and printability [117]. Effective activation of these materials, however, requires adequate curing conditions. Temperature and moisture control are essential to maximize the pozzolanic activity of FA and sustain the extended hydration process in SF-rich systems [119]. Suboptimal curing may prevent full exploitation of SCM reactivity, limiting mechanical gains. From a rheological standpoint, SF’s water demand can impair flow if not mitigated, whereas FA’s lubricating effect aids in maintaining workable consistency [111,120].
Combined Interactions between Cement-to-Sand and Cement-to-Mixture Ratios
Fig. 12 presents a series of 3D PDPs that reveal the coupled effects of PC with key mix design parameters (SA, WB, and SB) on the CS of 3DPC. These plots, derived from the trained ML model, allow for a robust understanding of how interactive features influence strength outcomes across a range of input conditions. Fig. 12a illustrates the interaction between PC and SA. The plotted surface reveals a complex, non-linear relationship, with maximum CS values occurring at PC dosages of 600–800 kg/m3 and SA levels of 600–900 kg/m3. This interaction highlights the critical role of binder-aggregate impact in 3DPC. While PC governs hydration and matrix formation via the production of C-S-H, SA contributes to the mechanical and rheological behavior of the fresh mix. Specifically, well-graded and angular fine aggregates promote better compaction and reduce water demand, which directly benefits strength development. By contrast, poorly graded or recycled sands may elevate plastic viscosity and entrap air, leading to reduced density and mechanical performance [121,122]. The PDP affirms that optimal strength is not a function of PC content alone but rather the result of complementary dosages that support matrix densification and efficient load transfer.
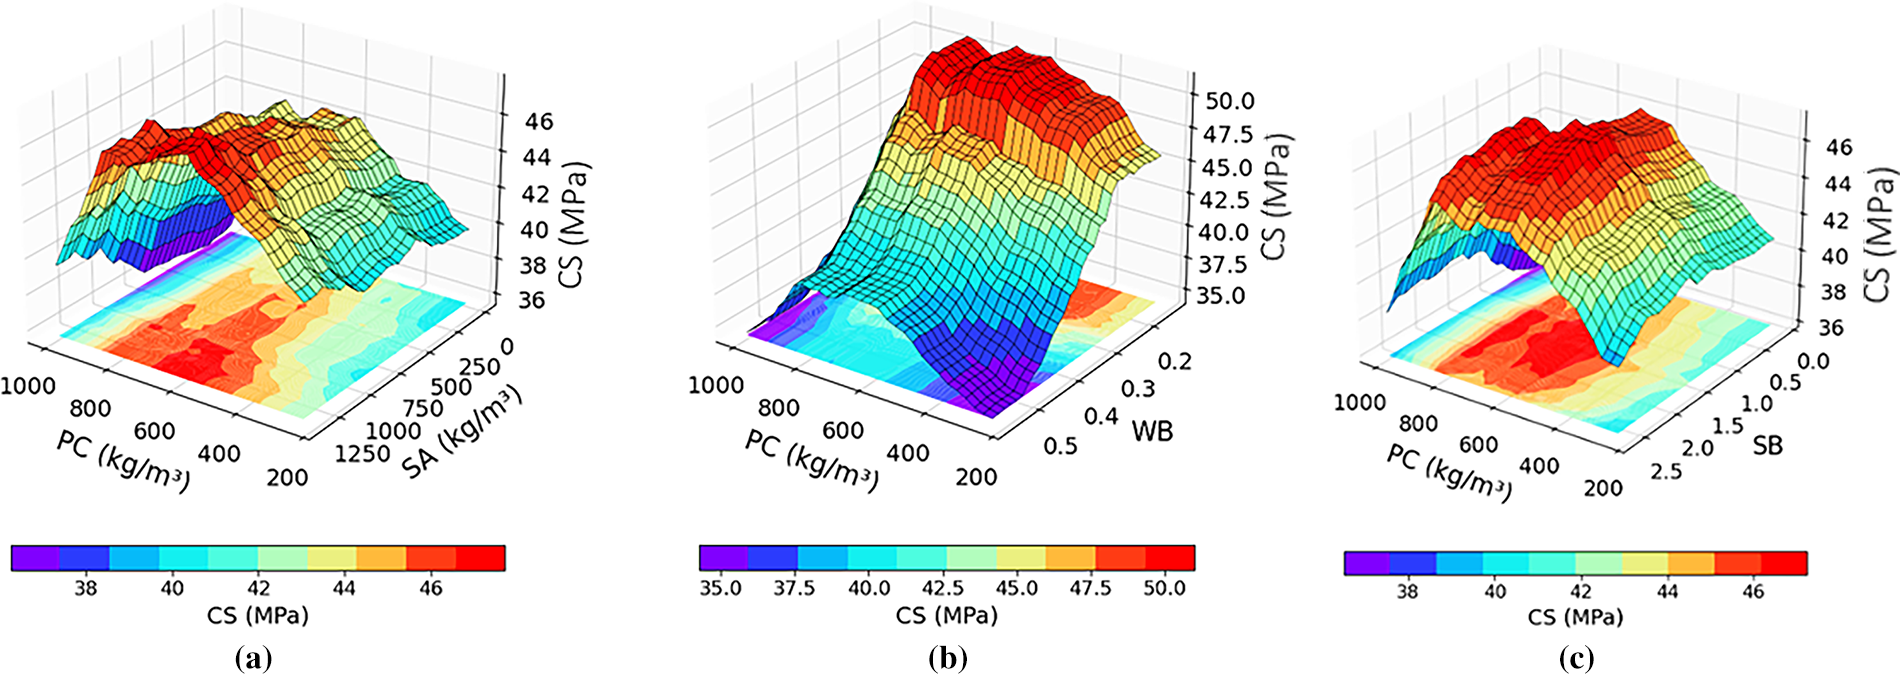
Figure 12: 3D PDPs illustrating the cooperative interactions between: (a) PC-SA, (b) PC-WB, and (c) PC-FA on model predictions
Fig. 12b focuses on the interaction between PC and WB. Here, the strength surface exhibits a pronounced ridge corresponding to high CS values (up to 50 MPa) when PC ranges from 600 to 900 kg/m3 and WB falls below 0.35. This interaction reflects fundamental cement chemistry (i.e., lower WB ratios decrease porosity and enable more complete hydration, while higher PC content increases the availability of reactive clinker phases). However, in 3D printing contexts, overly stiff mixes may compromise extrudability and layer adhesion. Therefore, the PC-WB interaction must be optimized not only for strength but also for printability and buildability. SP can address this challenge by improving flowability without increasing water content, while SCMs contribute additional C-S-H through pozzolanic reactions [113,123,124]. The observed PDP supports hydration theory and emphasizes the importance of mix balance in achieving high performance in printed elements, especially under anisotropic and layer-dependent stress distributions [125,126].
Fig. 12c details the synergy between PC and SB. The plotted interaction surface reveals that strength enhancement peaks when PC is maintained between 600 and 800 kg/m3 and SB lies in the 1.0–1.5 range. This range reflects a critical balance between binder volume and aggregate content, which promotes effective paste dispersion and minimizes voids. As shown by Shantanu et al. [127], an excessive SB reduces paste continuity and impairs interparticle bonding, while too little aggregate compromises buildability and shape stability. The PDP shows a sharp decline in CS for SB values exceeding 2.0, particularly at mid-range PC contents. These patterns are further shaped by the quality of sand and its grading profile, as well-packed aggregates yield better microstructural density and facilitate uniform stress transfer [128]. From rheology point of view, this balance also supports print-specific requirements such as layer retention, cohesion, and dimensional accuracy. Prior studies suggest that SB ratios between 0.5 and 0.6 offer an effective compromise for workability and strength, aligning with the plateau region identified in the current model output [118].
5 Conclusions and Future Directions
This research advances the predictive modeling of 3DPC by integrating interpretable ML techniques aimed at optimizing mix design and enhancing material performance. Central to the study is the implementation of explainability frameworks, specifically feature importance and PDPs, which provide actionable insights into the nonlinear, multivariate interactions that govern CS. By embedding transparency into the modeling process, the study promotes the development of data-driven strategies for sustainable, high-performance 3DPC mixtures. The findings of this research support the following conclusions:
(1) The Pareto-optimal models demonstrate a balanced trade-off between training accuracy and validation generalization, with the best configuration (depth = 20, leaves = 14, features = 4) achieving scores of 0.978 (train), 0.834 (validation), and 0.868 (test). These findings confirm the robustness and stability of performance across a well-bounded hyperparameter space.
(2) The optimized 100-DT model identifies AG, WA, and SP as dominant predictors of CS. Despite minor overfitting, the model exhibits strong generalization (R2 = 0.834–0.868), with low errors (MAE ≈ 5.1–5.8 MPa), which confirms its predictive reliability and interpretability.
(3) SHAP analysis ranked AG as the most influential predictor (mean SHAP = 9.24), confirming the pivotal role of curing in strength development. Other key contributors included PC, SF, and WB, with the latter exhibiting a clear inverse relationship with strength. The model emphasized synergistic effects across curing protocols, binder content, and mix proportions.
(4) PDPs showed CS exceeding 50 MPa in formulations where PC content ranged between 600–800 kg/m3, SF between 20–40 kg/m3, and FA remained below 200 kg/m3. These conditions favored optimal pozzolanic activity and packing density, while excessive SCM content yielded diminishing returns, reaffirming the importance of balance and curing.
(5) Further 3D PDP analysis revealed that strength was maximized when PC was paired with SA (600–900 kg/m3), WB < 0.35, and SB between 1.0 and 1.5. These interactive effects highlight the critical importance of jointly tuning binder content and mix ratios to achieve superior hydration, reduced porosity, and improved printability in additive manufacturing contexts.
Despite the methodological advancements presented, several knowledge gaps remain. Current models primarily target CS, while durability-related parameters such as permeability, shrinkage, and long-term performance remain underexplored. Additionally, the scarcity of open-access datasets limits the transferability of ML models across broader applications. Moving forward, greater emphasis should be placed on developing interpretable ML frameworks capable of capturing complex interdependencies among mix design variables, mechanical performance, and printing parameters. Future research may benefit from incorporating process-driven factors, such as layer orientation, nozzle geometry, and structural detailing, into predictive models to enhance their fidelity and field applicability. Future research should focus on uniting experimentally derived datasets with analytical and mechanistic models to explore the complex nonlinear relationships that govern material behavior. Establishing this synergy between data-driven intelligence and physics-informed modeling can significantly advance the clarity with which variable interactions are interpreted, while simultaneously reinforcing the reliability and adaptability of optimization-based mix design frameworks. Within these evolving methodological frameworks, Gene Expression Programming and MEP are emerging as powerful tools capable of formulating transparent, mathematically explicit representations of material systems without sacrificing predictive precision. The adoption of these hybrid explainable AI approaches promises to transform current practices by revealing the underlying physical principles embedded in ML outputs, thereby linking computational prediction with mechanistic understanding and enabling more rational, scientifically grounded material design.
Acknowledgement: The authors would like to thank Ongoing Research Funding Program (ORFFT-2025-025-4), King Saud University, Riyadh, Saudi Arabia for financial support.
Funding Statement: This work was supported by the Ongoing Research Funding Program (Grant No. ORFFT-2025-025-4) at King Saud University, Riyadh, Saudi Arabia. The grant was awarded to Yassir M. Abbas. The sponsor’s website is available at https://ksu.edu.sa/en (accessed on 01 Octorber 2025).
Author Contributions: The authors confirm contribution to the paper as follows: Conceptualization, Yassir M. Abbas; methodology, Yassir M. Abbas and Abdulaziz Alsaif; software, Yassir M. Abbas; formal analysis, Yassir M. Abbas and Abdulaziz Alsaif; investigation, Yassir M. Abbas and Abdulaziz Alsaif; resources, Yassir M. Abbas; data curation, Yassir M. Abbas and Abdulaziz Alsaif; writing—original draft preparation, Yassir M. Abbas and Abdulaziz Alsaif; writing—review and editing, Yassir M. Abbas and Abdulaziz Alsaif; visualization, Yassir M. Abbas; funding acquisition, Yassir M. Abbas. All authors reviewed the results and approved the final version of the manuscript.
Availability of Data and Materials: Data available on request from the authors.
Ethics Approval: Not applicable.
Conflicts of Interest: The authors declare that they have no conflicts of interest to report regarding the present study.
Appendix A Single-Feature Partial Dependence Plots

References
1. Alyami M, Khan M, Fawad M, Nawaz R, Hammad AWA, Najeh T, et al. Predictive modeling for compressive strength of 3D printed fiber-reinforced concrete using machine learning algorithms. Case Stud Constr Mater. 2024;20:e02728. doi:10.1016/j.cscm.2023.e02728. [Google Scholar] [CrossRef]
2. Xia Z, He Z, Wang Q, Wang Y. A new finite element model with manufactured error for additive manufacturing. Comput Model Eng Sci. 2020;124(2):703–20. doi:10.32604/cmes.2020.010368. [Google Scholar] [CrossRef]
3. Zhang J, Wang J, Dong S, Yu X, Han B. A review of the current progress and application of 3D printed concrete. Compos Part A Appl Sci Manuf. 2019;125(3):105533. doi:10.1016/j.compositesa.2019.105533. [Google Scholar] [CrossRef]
4. De Schutter G, Lesage K, Mechtcherine V, Nerella VN, Habert G, Agusti-Juan I. Vision of 3D printing with concrete—technical, economic and environmental potentials. Cem Concr Res. 2018;112:25–36. doi:10.1016/j.cemconres.2018.06.001. [Google Scholar] [CrossRef]
5. Ghasemi A, Naser MZ. Tailoring 3D printed concrete through explainable artificial intelligence. Structures. 2023;56:104850. doi:10.1016/j.istruc.2023.07.040. [Google Scholar] [CrossRef]
6. Weng Y, Lu B, Li M, Liu Z, Tan MJ, Qian S. Empirical models to predict rheological properties of fiber reinforced cementitious composites for 3D printing. Constr Build Mater. 2018;189:676–85. doi:10.1016/j.conbuildmat.2018.09.039. [Google Scholar] [CrossRef]
7. Lee MH, Chen SI, Chen WH, Mao Y. A layer-based mesh generator and scheme for 3D printing simulation. Comput Model Eng Sci. 2019;120(2):363–74. doi:10.32604/cmes.2019.06476. [Google Scholar] [CrossRef]
8. Weng Y, Li M, Tan MJ, Qian S. Design 3D printing cementitious materials via Fuller Thompson theory and Marson-Percy model. Constr Build Mater. 2018;163(3):600–10. doi:10.1016/j.conbuildmat.2017.12.112. [Google Scholar] [CrossRef]
9. Zaid O, El Ouni MH. Advancements in 3D printing of cementitious materials: a review of mineral additives, properties, and systematic developments. Constr Build Mater. 2024;427:136254. doi:10.1016/j.conbuildmat.2024.136254. [Google Scholar] [CrossRef]
10. Hassan H, Rodriguez-Ubinas E, Al Tamimi A, Trepci E, Mansouri A, Almehairbi K. Towards innovative and sustainable buildings: a comprehensive review of 3D printing in construction. Autom Constr. 2024;163:105417. doi:10.1016/j.autcon.2024.105417. [Google Scholar] [CrossRef]
11. Panda B, Ruan S, Unluer C, Tan MJ. Improving the 3D printability of high volume fly ash mixtures via the use of nano attapulgite clay. Compos Part B Eng. 2019;165(3):75–83. doi:10.1016/j.compositesb.2018.11.109. [Google Scholar] [CrossRef]
12. Zhuang Z, Xu F, Ye J, Hu N, Jiang L, Weng Y. A comprehensive review of sustainable materials and toolpath optimization in 3D concrete printing. npj Mater Sustain. 2024;2:12. doi:10.1038/s44296-024-00017-9. [Google Scholar] [CrossRef]
13. Perrot A, Pierre A, Nerella VN, Wolfs RJM, Keita E, Nair SAO, et al. From analytical methods to numerical simulations: a process engineering toolbox for 3D concrete printing. Cem Concr Compos. 2021;122:104164. doi:10.1016/j.cemconcomp.2021.104164. [Google Scholar] [CrossRef]
14. Buswell RA, Leal de Silva WR, Jones SZ, Dirrenberger J. 3D printing using concrete extrusion: a roadmap for research. Cem Concr Res. 2018;112:37–49. doi:10.1016/j.cemconres.2018.05.006. [Google Scholar] [CrossRef]
15. Wikipedia contributors. The free encyclopedia, D-Shape [Internet]. [cited 2025 Oct 1]. Available from: https://en.wikipedia.org/wiki/D-Shape. [Google Scholar]
16. Zhu R, Egbe KI, Salehi H, Shi Z, Jiao P. Eco-friendly 3D printed concrete with fine aggregate replacements: fabrication, characterization and machine learning prediction. Constr Build Mater. 2024;413:134905. doi:10.1016/j.conbuildmat.2024.134905. [Google Scholar] [CrossRef]
17. Arif M, Jan F, Rezzoug A, Ali Afridi M, Luqman M, Khan WA, et al. Data-driven models for predicting compressive strength of 3D-printed fiber-reinforced concrete using interpretable machine learning algorithms. Case Stud Constr Mater. 2024;21(4):e03935. doi:10.1016/j.cscm.2024.e03935. [Google Scholar] [CrossRef]
18. Yao X, Lyu X, Sun J, Wang B, Wang Y, Yang M, et al. AI-based performance prediction for 3D-printed concrete considering anisotropy and steam curing condition. Constr Build Mater. 2023;375(2):130898. doi:10.1016/j.conbuildmat.2023.130898. [Google Scholar] [CrossRef]
19. Malik UJ, Riaz RD, Rehman SU, Usman M, Riaz RE, Hamza R. Advancing mix design prediction in 3D printed concrete: predicting anisotropic compressive strength and slump flow. Case Stud Constr Mater. 2024;21:e03510. doi:10.1016/j.cscm.2024.e03510. [Google Scholar] [CrossRef]
20. Mütevelli Özkan İG, Aldemir A. Machine-learning networks to predict the ultimate axial load and displacement capacity of 3D printed concrete walls with different section geometries. Structures. 2024;66:106879. doi:10.1016/j.istruc.2024.106879. [Google Scholar] [CrossRef]
21. Uddin MN, Ye J, Deng B, Li LZ, Yu K. Interpretable machine learning for predicting the strength of 3D printed fiber-reinforced concrete (3DP-FRC). J Build Eng. 2023;72(24):106648. doi:10.1016/j.jobe.2023.106648. [Google Scholar] [CrossRef]
22. Rehman SU, Riaz RD, Usman M, Kim IH. Augmented data-driven approach towards 3D printed concrete mix prediction. Appl Sci. 2024;14(16):7231. doi:10.3390/app14167231. [Google Scholar] [CrossRef]
23. Izadgoshasb H, Kandiri A, Shakor P, Laghi V, Gasparini G. Predicting compressive strength of 3D printed mortar in structural members using machine learning. Appl Sci. 2021;11(22):10826. doi:10.3390/app112210826. [Google Scholar] [CrossRef]
24. Uddin MN, Ye J, Haque MA, Yu K, Li L. A novel compressive strength estimation approach for 3D printed fiber-reinforced concrete: integrating machine learning and gene expression programming. Multiscale Multidiscip Model Exp Des. 2024;7(5):4889–910. doi:10.1007/s41939-024-00439-x. [Google Scholar] [CrossRef]
25. Rasel RI, Hossain MM, Zubayer MH, Zhang C. Exploring the fresh and rheology properties of 3D printed concrete with fiber reinforced composites (3DP-FRCa novel approach using machine learning techniques. Mater Res Express. 2024;11(12):125502. doi:10.1088/2053-1591/ad9890. [Google Scholar] [CrossRef]
26. Hou D, Zhang Y, Wang P, Wang M, Wang X. Molecular dynamics and machine learning approaches for cementitious material design. In: Proceedings of the C3 Symposium 2025; 2025 Oct 2–5; Chicago, IL, USA: Purdue University. doi:10.5703/1288284317951. [Google Scholar] [CrossRef]
27. Wu S, Liu X, Fu B. Explainable automl and multi-objective optimization for sustainable high-performance geopolymer concrete. Sci Rep. 2025;15(1):33027. doi:10.1038/s41598-025-18666-8. [Google Scholar] [PubMed] [CrossRef]
28. Wang J, Deng J, Li S, Du W, Zhang Z, Liu X. Explainable machine learning for multicomponent concrete: predictive modeling and feature interaction insights. Materials. 2025;18(19):4456. doi:10.3390/ma18194456. [Google Scholar] [PubMed] [CrossRef]
29. Ali Shahmansouri A, Akbarzadeh Bengar H, Jahani E. Predicting compressive strength and electrical resistivity of eco-friendly concrete containing natural zeolite via GEP algorithm. Constr Build Mater. 2019;229:116883. doi:10.1016/j.conbuildmat.2019.116883. [Google Scholar] [CrossRef]
30. Feng DC, Liu ZT, Wang XD, Chen Y, Chang JQ, Wei DF, et al. Machine learning-based compressive strength prediction for concrete: an adaptive boosting approach. Constr Build Mater. 2020;230:117000. doi:10.1016/j.conbuildmat.2019.117000. [Google Scholar] [CrossRef]
31. Kang MC, Yoo DY, Gupta R. Machine learning-based prediction for compressive and flexural strengths of steel fiber-reinforced concrete. Constr Build Mater. 2021;266(6):121117. doi:10.1016/j.conbuildmat.2020.121117. [Google Scholar] [CrossRef]
32. Sharafati A, Haji Seyed Asadollah SB, Al-Ansari N. Application of bagging ensemble model for predicting compressive strength of hollow concrete masonry prism. Ain Shams Eng J. 2021;12(4):3521–30. doi:10.1016/j.asej.2021.03.028. [Google Scholar] [CrossRef]
33. Chourasia A, Pal B, Kapoor A. Influence of printing direction and interlayer printing time on the bond characteristics and hardened mechanical properties of agro-industrial waste-based 3D printed concrete. J Mater Civ Eng. 2025;37(4):04025065. doi:10.1061/jmcee7.mteng-18196. [Google Scholar] [CrossRef]
34. Şahin HG, Mardani-Aghabaglou A. Assessment of materials, design parameters and some properties of 3D printing concrete mixtures; a state-of-the-art review. Constr Build Mater. 2022;316:125865. doi:10.1016/j.conbuildmat.2021.125865. [Google Scholar] [CrossRef]
35. Huseien GF, Tan SQ, Saleh AT, Lim NHAS, Ghoshal SK. Test procedures and mechanical properties of three-dimensional printable concrete enclosing different mix proportions: a review and bibliometric analysis. Buildings. 2024;14(9):2667. doi:10.3390/buildings14092667. [Google Scholar] [CrossRef]
36. Le TT, Austin SA, Lim S, Buswell RA, Gibb AGF, Thorpe T. Mix design and fresh properties for high-performance printing concrete. Mater Struct. 2012;45(8):1221–32. doi:10.1617/s11527-012-9828-z. [Google Scholar] [CrossRef]
37. Rushing TS, Al-Chaar G, Eick BA, Burroughs J, Shannon J, Barna L, et al. Investigation of concrete mixtures for additive construction. Rapid Prototyp J. 2017;23(1):74–80. doi:10.1108/rpj-09-2015-0124. [Google Scholar] [CrossRef]
38. Bos F, Wolfs R, Ahmed Z, Salet T. Additive manufacturing of concrete in construction: potentials and challenges of 3D concrete printing. Virtual Phys Prototyp. 2016;11(3):209–25. doi:10.1080/17452759.2016.1209867. [Google Scholar] [CrossRef]
39. Khalil N, Aouad G, El Cheikh K, Rémond S. Use of calcium sulfoaluminate cements for setting control of 3D-printing mortars. Constr Build Mater. 2017;157(8):382–91. doi:10.1016/j.conbuildmat.2017.09.109. [Google Scholar] [CrossRef]
40. Kazemian A, Yuan X, Cochran E, Khoshnevis B. Cementitious materials for construction-scale 3D printing: laboratory testing of fresh printing mixture. Constr Build Mater. 2017;145:639–47. doi:10.1016/j.conbuildmat.2017.04.015. [Google Scholar] [CrossRef]
41. Panda B, Paul SC, Mohamed NAN, Tay YWD, Tan MJ. Measurement of tensile bond strength of 3D printed geopolymer mortar. Measurement. 2018;113:108–16. doi:10.1016/j.measurement.2017.08.051. [Google Scholar] [CrossRef]
42. Annapareddy A, Li M, Tan MJ, Ting AGH, Tay DYW. Effect of recycled glass gradation in 3D cementitious material printing. In: Proceedings of the 3rd International Conference on Progress in Additive Manufacturing (Pro-AM 2018). Singapore; 2018. p. 50–5. doi:10.25341/D4F59Z. [Google Scholar] [CrossRef]
43. Shakor P, Nejadi S, Paul G. A study into the effect of different nozzles shapes and fibre-reinforcement in 3D printed mortar. Materials. 2019;12(10):1708. doi:10.3390/ma12101708. [Google Scholar] [PubMed] [CrossRef]
44. Nerella VN, Mechtcherine V. Studying the printability of fresh concrete for formwork-free concrete onsite 3D printing technology (CONPrint3D). In: 3D concrete printing technology. Amsterdam, The Netherlands: Elsevier; 2019. p. 333–47. doi:10.1016/b978-0-12-815481-6.00016-6. [Google Scholar] [CrossRef]
45. Álvarez-Fernández MI, Prendes-Gero MB, González-Nicieza C, Guerrero-Miguel DJ, Martínez-Martínez JE. Optimum mix design for 3D concrete printing using mining tailings: a case study in Spain. Sustainability. 2021;13(3):1568. doi:10.3390/su13031568. [Google Scholar] [CrossRef]
46. Rahul AV, Santhanam M, Meena H, Ghani Z. 3D printable concrete: mixture design and test methods. Cem Concr Compos. 2019;97:13–23. doi:10.1016/j.cemconcomp.2018.12.014. [Google Scholar] [CrossRef]
47. Lee D, Yoo BH, Son HJ. Development of shrinkage reducing agent for 3D printing concrete. J Korea Acad-Ind Coop Soc. 2019;20(12):37–43. [Google Scholar]
48. Nerella VN, Hempel S, Mechtcherine V. Effects of layer-interface properties on mechanical performance of concrete elements produced by extrusion-based 3D-printing. Constr Build Mater. 2019;205:586–601. doi:10.1016/j.conbuildmat.2019.01.235. [Google Scholar] [CrossRef]
49. Baz B, Aouad G, Remond S. Effect of the printing method and mortar’s workability on pull-out strength of 3D printed elements. Constr Build Mater. 2020;230:117002. doi:10.1016/j.conbuildmat.2019.117002. [Google Scholar] [CrossRef]
50. Mechtcherine V, Nerella VN, Will F, Näther M, Otto J, Krause M. Large-scale digital concrete construction-CONPrint3D concept for on-site, monolithic 3D-printing. Autom Constr. 2019;107:102933. doi:10.1016/j.autcon.2019.102933. [Google Scholar] [CrossRef]
51. Cho S, Kruger PJ, Zeranka S. 3D printable concrete technology and mechanics. Concrete Beton. 2019;158:11–8. [Google Scholar]
52. Kruger J, Van den Heever M, Cho S, Zeranka S, Van Zijl GPAG. High-performance 3D printable concrete enhanced with nanomaterials. In: Proceedings of the International Conference on Sustainable Materials, Systems and Structures (SMSS 2019); 2019 Mar 20–22; Rovinj, Croatia. p. 533–40. [Google Scholar]
53. Chen Y, Li Z, Chaves Figueiredo S, Çopuroğlu O, Veer F, Schlangen E. Limestone and calcined clay-based sustainable cementitious materials for 3D concrete printing: a fundamental study of extrudability and early-age strength development. Appl Sci. 2019;9(9):1809. doi:10.3390/app9091809. [Google Scholar] [CrossRef]
54. Jo JH, Jo BW, Cho W, Kim JH. Development of a 3D printer for concrete structures: laboratory testing of cementitious materials. Int J Concr Struct Mater. 2020;14(1):13. doi:10.1186/s40069-019-0388-2. [Google Scholar] [CrossRef]
55. Long WJ, Tao JL, Lin C, Gu YC, Mei L, Duan HB, et al. Rheology and buildability of sustainable cement-based composites containing micro-crystalline cellulose for 3D-printing. J Clean Prod. 2019;239:118054. doi:10.1016/j.jclepro.2019.118054. [Google Scholar] [CrossRef]
56. Rahul AV, Santhanam M, Meena H, Ghani Z. Mechanical characterization of 3D printable concrete. Constr Build Mater. 2019;227:116710. doi:10.1016/j.conbuildmat.2019.116710. [Google Scholar] [CrossRef]
57. Shakor P, Nejadi S, Sutjipto S, Paul G, Gowripalan N. Effects of deposition velocity in the presence/absence of E6-glass fibre on extrusion-based 3D printed mortar. Addit Manuf. 2020;32:101069. doi:10.1016/j.addma.2020.101069. [Google Scholar] [CrossRef]
58. Hack N, Dressler I, Brohmann L, Gantner S, Lowke D, Kloft H. Injection 3D concrete printing (I3DCPbasic principles and case studies. Materials. 2020;13(5):1093. doi:10.3390/ma13051093. [Google Scholar] [PubMed] [CrossRef]
59. Dressler I, Freund N, Lowke D. The effect of accelerator dosage on fresh concrete properties and on interlayer strength in shotcrete 3D printing. Materials. 2020;13(2):374. doi:10.3390/ma13020374. [Google Scholar] [PubMed] [CrossRef]
60. Assaad JJ, Hamzeh F, Hamad B. Qualitative assessment of interfacial bonding in 3D printing concrete exposed to frost attack. Case Stud Constr Mater. 2020;13:e00357. doi:10.1016/j.cscm.2020.e00357. [Google Scholar] [CrossRef]
61. Joh C, Lee J, Bui TQ, Park J, Yang IH. Buildability and mechanical properties of 3D printed concrete. Materials. 2020;13(21):4919. doi:10.3390/ma13214919. [Google Scholar] [PubMed] [CrossRef]
62. Ding T, Xiao J, Zou S, Wang Y. Hardened properties of layered 3D printed concrete with recycled sand. Cem Concr Compos. 2020;113:103724. doi:10.1016/j.cemconcomp.2020.103724. [Google Scholar] [CrossRef]
63. Ding T, Xiao J, Qin F, Duan Z. Mechanical behavior of 3D printed mortar with recycled sand at early ages. Constr Build Mater. 2020;248:118654. doi:10.1016/j.conbuildmat.2020.118654. [Google Scholar] [CrossRef]
64. Kloft H, Krauss HW, Hack N, Herrmann E, Neudecker S, Varady PA, et al. Influence of process parameters on the interlayer bond strength of concrete elements additive manufactured by Shotcrete 3D Printing (SC3DP). Cem Concr Res. 2020;134:106078. doi:10.1016/j.cemconres.2020.106078. [Google Scholar] [CrossRef]
65. Rahul AV, Santhanam M. Evaluating the printability of concretes containing lightweight coarse aggregates. Cem Concr Compos. 2020;109(3):103570. doi:10.1016/j.cemconcomp.2020.103570. [Google Scholar] [CrossRef]
66. Rahul AV, Mohan MK, De Schutter G, Van Tittelboom K. 3D printable concrete with natural and recycled coarse aggregates: rheological, mechanical and shrinkage behaviour. Cem Concr Compos. 2022;125:104311. doi:10.1016/j.cemconcomp.2021.104311. [Google Scholar] [CrossRef]
67. Wang SR, Wu XG, Yang JH, Zhao JQ, Kong FL. Mechanical behavior of lightweight concrete structures subjected to 3D coupled static-dynamic loads. Acta Mech. 2020;231(11):4497–511. doi:10.1007/s00707-020-02739-y. [Google Scholar] [CrossRef]
68. Kaszyńska M, Skibicki S, Hoffmann M. 3D concrete printing for sustainable construction. Energies. 2020;13(23):6351. doi:10.3390/en13236351. [Google Scholar] [CrossRef]
69. Pham L, Lu G, Tran P. Influences of printing pattern on mechanical performance of three-dimensional-printed fiber-reinforced concrete. 3D Print Addit Manuf. 2022;9(1):46–63. doi:10.1089/3dp.2020.0172. [Google Scholar] [PubMed] [CrossRef]
70. Federowicz K, Kaszyńska M, Zieliński A, Hoffmann M. Effect of curing methods on shrinkage development in 3D-printed concrete. Materials. 2020;13(11):2590. doi:10.3390/ma13112590. [Google Scholar] [PubMed] [CrossRef]
71. Cui H, Yu S, Cao X, Yang H. Evaluation of printability and thermal properties of 3D printed concrete mixed with phase change materials. Energies. 2022;15(6):1978. doi:10.3390/en15061978. [Google Scholar] [CrossRef]
72. van den Heever M, Bester F, Kruger J, van Zijl G. Mechanical characterisation for numerical simulation of extrusion-based 3D concrete printing. J Build Eng. 2021;44:102944. doi:10.1016/j.jobe.2021.102944. [Google Scholar] [CrossRef]
73. Van Der Putten J, Snoeck D, Van Tittelboom K. 3D printing of cementitious materials with superabsorbent polymers. In: Proceedings of the Durable Concrete for Infrastructure under Severe Conditions-Smart Admixtures, Self-Responsiveness and Nano-Additions; 2019 Mar 20–22; Rovinj, Croatia. p. 86–9. [Google Scholar]
74. Meurer M, Classen M. Mechanical properties of hardened 3D printed concretes and mortars-development of a consistent experimental characterization strategy. Materials. 2021;14(4):752. doi:10.3390/ma14040752. [Google Scholar] [PubMed] [CrossRef]
75. Liu C, Zhang R, Liu H, He C, Wang Y, Wu Y, et al. Analysis of the mechanical performance and damage mechanism for 3D printed concrete based on pore structure. Constr Build Mater. 2022;314:125572. doi:10.1016/j.conbuildmat.2021.125572. [Google Scholar] [CrossRef]
76. Tao Y, Rahul AV, Lesage K, Van Tittelboom K, Yuan Y, De Schutter G. Mechanical and microstructural properties of 3D printable concrete in the context of the twin-pipe pumping strategy. Cem Concr Compos. 2022;125:104324. doi:10.1016/j.cemconcomp.2021.104324. [Google Scholar] [CrossRef]
77. Ye J, Cui C, Yu J, Yu K, Dong F. Effect of polyethylene fiber content on workability and mechanical-anisotropic properties of 3D printed ultra-high ductile concrete. Constr Build Mater. 2021;281:122586. doi:10.1016/j.conbuildmat.2021.122586. [Google Scholar] [CrossRef]
78. Ma L, Zhang Q, Jia Z, Liu C, Deng Z, Zhang Y. Effect of drying environment on mechanical properties, internal RH and pore structure of 3D printed concrete. Constr Build Mater. 2022;315:125731. doi:10.1016/j.conbuildmat.2021.125731. [Google Scholar] [CrossRef]
79. Baz B, Aouad G, Khalil N, Remond S. Inter-layer reinforcement of 3D printed concrete elements. Asian J Civ Eng. 2021;22(2):341–9. doi:10.1007/s42107-020-00317-0. [Google Scholar] [CrossRef]
80.. Ji G, Xiao J, Zhi P, Wu YC, Han N. Effects of extrusion parameters on properties of 3d printing concrete with coarse aggregates. SSRN J. 2021;12:261. doi:10.2139/ssrn.3974338. [Google Scholar] [CrossRef]
81. Yu K, McGee W, Ng TY, Zhu H, Li VC. 3D-printable engineered cementitious composites (3DP-ECCfresh and hardened properties. Cem Concr Res. 2021;143:106388. doi:10.1016/j.cemconres.2021.106388. [Google Scholar] [CrossRef]
82. Ding T, Qin F, Xiao J, Chen X, Zuo Z. Experimental study on the bond behaviour between steel bars and 3D printed concrete. J Build Eng. 2022;49:104105. doi:10.1016/j.jobe.2022.104105. [Google Scholar] [CrossRef]
83. Singh A, Liu Q, Xiao J, Lyu Q. Mechanical and macrostructural properties of 3D printed concrete dosed with steel fibers under different loading direction. Constr Build Mater. 2022;323:126616. doi:10.1016/j.conbuildmat.2022.126616. [Google Scholar] [CrossRef]
84. van Overmeir AL, Figueiredo SC, Šavija B, Bos FP, Schlangen E. Design and analyses of printable strain hardening cementitious composites with optimized particle size distribution. Constr Build Mater. 2022;324(3):126411. doi:10.1016/j.conbuildmat.2022.126411. [Google Scholar] [CrossRef]
85. Xiao J, Lv Z, Duan Z, Hou S. Study on preparation and mechanical properties of 3D printed concrete with different aggregate combinations. J Build Eng. 2022;51(8):104282. doi:10.1016/j.jobe.2022.104282. [Google Scholar] [CrossRef]
86. Wu YC, Li M. Effects of Early-Age rheology and printing time interval on Late-Age fracture characteristics of 3D printed concrete. Constr Build Mater. 2022;351(43):128559. doi:10.1016/j.conbuildmat.2022.128559. [Google Scholar] [CrossRef]
87. Pan Z, Si D, Tao J, Xiao J. Compressive behavior of 3D printed concrete with different printing paths and concrete ages. Case Stud Constr Mater. 2023;18(4):e01949. doi:10.1016/j.cscm.2023.e01949. [Google Scholar] [CrossRef]
88. Jiang X, Li Y, Yang Z, Li Y, Xiong B. Harnessing path optimization to enhance the strength of three-dimensional (3D) printed concrete. Buildings. 2024;14(2):455. doi:10.3390/buildings14020455. [Google Scholar] [CrossRef]
89. Cui W, Shen L, Ji D, Liu W, Wang T, Hou D, et al. Mechanical performance and permeability of low-carbon printable concrete. J Sustain Cem Based Mater. 2025;14(3):406–16. doi:10.1080/21650373.2024.2374839. [Google Scholar] [CrossRef]
90. Sheskin DJ. Multiple regression. In: Handbook of parametric and nonparametric statistical procedures. Abingdon, UK: Talylor Francis Group; 2020. p. 1445–93. doi:10.1201/9780429186196-45. [Google Scholar] [CrossRef]
91. Zhu H, Ibrahim JG, Cho H. Perturbation and scaled Cook’s distance. Ann Stat. 2012;40(2):785–811. doi:10.1214/12-aos978. [Google Scholar] [PubMed] [CrossRef]
92. Abbas YM, Khan MI. Robust machine learning framework for modeling the compressive strength of SFRC: database compilation, predictive analysis, and empirical verification. Materials. 2023;16(22):7178. doi:10.3390/ma16227178. [Google Scholar] [PubMed] [CrossRef]
93. Zhang G, Gionis A. Regularized impurity reduction: accurate decision trees with complexity guarantees. Data Min Knowl Discov. 2023;37(1):434–75. doi:10.1007/s10618-022-00884-7. [Google Scholar] [PubMed] [CrossRef]
94. El-Morr C, Jammal M, Ali-Hassan H. Decision trees. Int Ser Oper Res Manag Sci. 2022;334:251–78. doi:10.1007/978-3-031-16990-8_8/FIGURES/24. [Google Scholar] [CrossRef]
95. Costa VG, Pedreira CE. Recent advances in decision trees: an updated survey. Artif Intell Rev. 2023;56(5):4765–800. doi:10.1007/s10462-022-10275-5. [Google Scholar] [CrossRef]
96. Zhou H, Zhang J, Zhou Y, Guo X, Ma Y. A feature selection algorithm of decision tree based on feature weight. Expert Syst Appl. 2021;164(4):113842. doi:10.1016/j.eswa.2020.113842. [Google Scholar] [CrossRef]
97. Schonlau M. Trees. In: Applied statistical learning. Berlin/Heidelberg, Germany: Springer; 2023. p. 61–182. doi:10.1007/978-3-031-33390-3_9. [Google Scholar] [CrossRef]
98. Dietterich TG. Ensemble methods in machine learning. In: Multiple classifier systems. Berlin/Heidelberg, Germany: Springer; 2000. p. 1–15. doi:10.1007/3-540-45014-9_1. [Google Scholar] [CrossRef]
99. Breiman L. Random forests. Mach Learn. 2001;45(1):5–32. doi:10.1023/A:1010933404324. [Google Scholar] [CrossRef]
100. Zhang J, Ma G, Huang Y, sun J, Aslani F, Nener B. Modelling uniaxial compressive strength of lightweight self-compacting concrete using random forest regression. Constr Build Mater. 2019;210:713–9. doi:10.1016/j.conbuildmat.2019.03.189. [Google Scholar] [CrossRef]
101. Auret L, Aldrich C. Interpretation of nonlinear relationships between process variables by use of random forests. Miner Eng. 2012;35(11):27–42. doi:10.1016/j.mineng.2012.05.008. [Google Scholar] [CrossRef]
102. Oshiro TM, Perez PS, Baranauskas JA. How many trees in a random forest? In: Proceedings of the International Workshop on Machine Learning and Data Mining in Pattern Recognition. Berlin/Heidelberg, Germany: Springer; 2012. p. 154–68. doi:10.1007/978-3-642-31537-4_13. [Google Scholar] [CrossRef]
103. Khan Z, Gul N, Faiz N, Gul A, Adler W, Lausen B. Optimal trees selection for classification via out-of-bag assessment and sub-bagging. IEEE Access. 2021;9:28591–607. doi:10.1109/access.2021.3055992. [Google Scholar] [CrossRef]
104. Abellan-Garcia J, García-Castaño E, Fernández-Gómez J, Khan MI, Abbas YM. Modeling the ductility characteristics of ultrahigh-performance fiber-reinforced concrete using a precise, computation-efficient, and comprehensive data-driven random forests-based approach. Mater Today Commun. 2023;37:106953. doi:10.1016/j.mtcomm.2023.106953. [Google Scholar] [CrossRef]
105. Little MP, Rosenberg PS, Arsham A. Alternative stopping rules to limit tree expansion for random forest models. Sci Rep. 2022;12(1):15113. doi:10.1038/s41598-022-19281-7. [Google Scholar] [PubMed] [CrossRef]
106. Tarhan Y, Şahin R. The physicomechanical behavior and microstructure of air-entrained 3D printable concrete. J Mater Civ Eng. 2024;36:04023489. doi:10.1061/jmcee7.mteng-16224. [Google Scholar] [CrossRef]
107. Shen Y, Lin L, Wei S, Yan J, Xu T. Research on the preparation and mechanical properties of solidified 3D printed concrete materials. Buildings. 2022;12(12):2264. doi:10.3390/buildings12122264. [Google Scholar] [CrossRef]
108. Xiao J, Liu H, Ding T. Finite element analysis on the anisotropic behavior of 3D printed concrete under compression and flexure. Addit Manuf. 2021;39:101712. doi:10.1016/j.addma.2020.101712. [Google Scholar] [CrossRef]
109. To QB, Pham KVA, Lee G, Shin M, Shin DW, Lee K. Experimental and FEM evaluation of the influence of interlayer bonding strength in 3D printed concrete members under compressive and flexural loadings. J Build Eng. 2024;94:109979. doi:10.1016/j.jobe.2024.109979. [Google Scholar] [CrossRef]
110. Şahin HG, Mardani A, Beytekin HE. Effect of silica fume utilization on structural build-up, mechanical and dimensional stability performance of fiber-reinforced 3D printable concrete. Polymers. 2024;16(4):556. doi:10.3390/polym16040556. [Google Scholar] [PubMed] [CrossRef]
111. Cui W, Wang T, Chen X, Shen W, Shi X, Wang S, et al. Study of 3D printed concrete with low-carbon cementitious materials based on its rheological properties and mechanical performances. J Sustain Cem Based Mater. 2023;12(7):832–41. doi:10.1080/21650373.2023.2189172. [Google Scholar] [CrossRef]
112. Liu C, Wang X, Chen Y, Zhang C, Ma L, Deng Z, et al. Influence of hydroxypropyl methylcellulose and silica fume on stability, rheological properties, and printability of 3D printing foam concrete. Cem Concr Compos. 2021;122(6):104158. doi:10.1016/j.cemconcomp.2021.104158. [Google Scholar] [CrossRef]
113. Colyn M, van Zijl G, Babafemi AJ. Fresh and strength properties of 3D printable concrete mixtures utilising a high volume of sustainable alternative binders. Constr Build Mater. 2024;419(14):135474. doi:10.1016/j.conbuildmat.2024.135474. [Google Scholar] [CrossRef]
114. van Overmeir AL, Šavija B, Bos FP, Schlangen E. 3D printable strain hardening cementitious composites (3DP-SHCCtailoring fresh and hardened state properties. Constr Build Mater. 2023;403(3):132924. doi:10.1016/j.conbuildmat.2023.132924. [Google Scholar] [CrossRef]
115. Bhat R, Han T, Sant G, Neithalath N, Kumar A. A comprehensive analysis of hydration kinetics and compressive strength development of fly ash-Portland cement binders. J Build Eng. 2024;88:109191. doi:10.1016/j.jobe.2024.109191. [Google Scholar] [CrossRef]
116. Wang S, Gu X, Liu J, Zhu Z, Wang H, Ge X, et al. Modulation of the workability and Ca/Si/Al ratio of cement-metakaolin cementitious material system by using fly ash: synergistic effect and hydration products. Constr Build Mater. 2023;404(7):133300. doi:10.1016/j.conbuildmat.2023.133300. [Google Scholar] [CrossRef]
117. Wang B, Zhai M, Yao X, Wu Q, Yang M, Wang X, et al. Printable and mechanical performance of 3D printed concrete employing multiple industrial wastes. Buildings. 2022;12(3):374. doi:10.3390/buildings12030374. [Google Scholar] [CrossRef]
118. Zhu L, Yao J, Zhao Y, Ruan W, Ge Y, Guan X. Printability and early mechanical properties of material composition modified 3D printing engineered cementitious composites based on the response surface methodology. J Build Eng. 2023;79:107837. doi:10.1016/j.jobe.2023.107837. [Google Scholar] [CrossRef]
119. Sothornchaiwit K, Dokduea W, Tangchirapat W, Keawsawasvong S, Thongchom C, Jaturapitakkul C. Influences of silica fume on compressive strength and chemical resistances of high calcium fly ash-based alkali-activated mortar. Sustainability. 2022;14(5):2652. doi:10.3390/su14052652. [Google Scholar] [CrossRef]
120. Li LG, Fang ZQ, Chu SH, Kwan AKH. Improving mechanical properties of 3D printed mortar through synergistic effects of fly ash microspheres and nanosilica. Mag Concr Res. 2025;77(5–6):255–69. doi:10.1680/jmacr.24.00244. [Google Scholar] [CrossRef]
121. Vargas A, Robayo-Salazar R, Mejía de Gutiérrez R. Effects of incorporating fine aggregates and polypropylene microfibres on the cracking control of 3D printed cementitious mixtures. Buildings. 2025;15(1):55. doi:10.3390/buildings15010055. [Google Scholar] [CrossRef]
122. Yu S, Sanjayan J, Du H. Effects of cement mortar characteristics on aggregate-bed 3D concrete printing. Addit Manuf. 2022;58(1):103024. doi:10.1016/j.addma.2022.103024. [Google Scholar] [CrossRef]
123. Suryanto B, Higgins J, Aitken MW, Tambusay A, Suprobo P. Developments in Portland cement/GGBS binders for 3D printing applications: material calibration and structural testing. Constr Build Mater. 2023;407:133561. doi:10.1016/j.conbuildmat.2023.133561. [Google Scholar] [CrossRef]
124. Perrot A, Jacquet Y, Caron JF, Mesnil R, Ducoulombier N, De Bono V, et al. Snapshot on 3D printing with alternative binders and materials: earth, geopolymers, gypsum and low carbon concrete. Cem Concr Res. 2024;185:107651. doi:10.1016/J.CEMCONRES.2024.107651. [Google Scholar] [CrossRef]
125. Abdeldjalil M, Chouicha K. Effect of the cement-to-water ratio and fractal granular model on the prediction of concretes compressive strength. Int J Concr Struct Mater. 2022;16:43. doi:10.1186/s40069-022-00526-8. [Google Scholar] [CrossRef]
126. Hambach M, Volkmer D. Properties of 3D-printed fiber-reinforced Portland cement paste. Cem Concr Compos. 2017;79:62–70. doi:10.1016/j.cemconcomp.2017.02.001. [Google Scholar] [CrossRef]
127. Shantanu B, Smrati J, Manu S. Criticality of binder-aggregate interaction for buildability of 3D printed concrete containing limestone calcined clay. Cem Concr Compos. 2023;136:104853. doi:10.1016/j.cemconcomp.2022.104853. [Google Scholar] [CrossRef]
128. Pierre A, Weger D, Perrot A, Lowke D. Penetration of cement pastes into sand packings during 3D printing: analytical and experimental study. Mater Struct. 2018;51(1):22. doi:10.1617/s11527-018-1148-5. [Google Scholar] [CrossRef]
Cite This Article
 Copyright © 2025 The Author(s). Published by Tech Science Press.
This work is licensed under a Creative Commons Attribution 4.0 International License , which permits unrestricted use, distribution, and reproduction in any medium, provided the original work is properly cited.
 Downloads
 Citation Tools