
 Submit a Paper
 Propose a Special lssue
 Open Access
ARTICLE

Concrete Strength Prediction Using Machine Learning and Somersaulting Spider Optimizer
1 Faculty of Artificial Intelligence, Delta University for Science and Technology, Mansoura, 11152, Egypt
2 Jadara Research Center, Jadara University, Irbid, 21110, Jordan
3 Department of Computer Sciences, College of Computer and Information Sciences, Princess Nourah bint Abdulrahman University, P.O. Box 84428, Riyadh, 11671, Saudi Arabia
4 College of Engineering, University of Bahrain, Sakhir, P.O. Box 32038, Kingdom of Bahrain
5 Department of Civil and Architectural Engineering, University of Miami, Coral Gables, FL 33146, USA
6 Department of Communications and Electronics, Delta Higher Institute of Engineering and Technology, Mansoura, 35111, Egypt
7 Applied Science Research Center, Applied Science Private University, Amman, 11931, Jordan
* Corresponding Authors: Marwa M. Eid. Email: ; Nima Khodadadi. Email:
(This article belongs to the Special Issue: Swarm and Metaheuristic Optimization for Applied Engineering Application)
Computer Modeling in Engineering & Sciences 2026, 146(1), 15 https://doi.org/10.32604/cmes.2025.073555
Received 20 September 2025; Accepted 29 December 2025; Issue published 29 January 2026
 View Full Text
 Download PDF
Abstract
Accurate prediction of concrete compressive strength is fundamental for optimizing mix designs, improving material utilization, and ensuring structural safety in modern construction. Traditional empirical methods often fail to capture the non-linear relationships among concrete constituents, especially with the growing use of supplementary cementitious materials and recycled aggregates. This study presents an integrated machine learning framework for concrete strength prediction, combining advanced regression models—namely CatBoost—with metaheuristic optimization algorithms, with a particular focus on the Somersaulting Spider Optimizer (SSO). A comprehensive dataset encompassing diverse mix proportions and material types was used to evaluate baseline machine learning models, including CatBoost, XGBoost, ExtraTrees, and RandomForest. Among these, CatBoost demonstrated superior accuracy across multiple performance metrics. To further enhance predictive capability, several bio-inspired optimizers were employed for hyperparameter tuning. The SSO-CatBoost hybrid achieved the lowest mean squared error and highest correlation coefficients, outperforming other metaheuristic approaches such as Genetic Algorithm, Particle Swarm Optimization, and Grey Wolf Optimizer. Statistical significance was established through Analysis of Variance and Wilcoxon signed-rank testing, confirming the robustness of the optimized models. The proposed methodology not only delivers improved predictive performance but also offers a transparent framework for mix design optimization, supporting data-driven decision making in sustainable and resilient infrastructure development.Keywords
Concrete compressive strength prediction represents a fundamental challenge in modern construction engineering, directly impacting structural safety, material optimization, and sustainable infrastructure development [1]. Accurate prediction of concrete strength enables engineers to optimize mix designs, reduce material waste, ensure structural reliability, and minimize construction costs while maintaining desired performance characteristics [2]. Traditional empirical methods for strength estimation, while historically valuable, often prove inadequate for contemporary concrete formulations that incorporate supplementary cementitious materials, chemical admixtures, and recycled aggregates [3], which exhibit complex non-linear relationships between constituent materials and resulting mechanical properties.
The increasing complexity of modern concrete technology necessitates advanced computational approaches capable of modeling intricate interactions between multiple mix design parameters [4]. Machine learning algorithms have emerged as powerful alternatives to conventional methods, offering superior capability to capture non-linear relationships and complex dependencies inherent in concrete strength development [5]. Gradient boosting algorithms, particularly CatBoost, have demonstrated exceptional performance in regression tasks involving heterogeneous datasets with mixed feature types [6], making them highly suitable for concrete strength prediction applications [7,8].
However, the effectiveness of machine learning models critically depends on optimal hyperparameter configuration, which significantly influences predictive accuracy and generalization capability [9]. Traditional hyperparameter optimization methods, such as grid search and random search, often prove computationally expensive and may fail to identify global optima in complex search spaces [10]. This limitation has motivated the development and application of metaheuristic optimization algorithms that can efficiently explore large parameter spaces while balancing exploration and exploitation mechanisms [11].
In hyperparameter tuning, the application of bio-inspired optimization algorithms has been of particular interest as it can offer the advantage of multi-dimensional, non-convex optimization problems that are useful to address high-dimensional hyperparameter tuning problems [12]. It follows that these algorithms are inspired by nature and biological processes and develop superior search strategies capable of identifying the best solutions in challenging landscapes [13]. The Somersaulting Spider Optimizer (SSO) is a new bio-inspired metaheuristic algorithm that is inspired by the locomotion behavior of a unique type of spider known as Cebrennus rechenbergi that is capable of combining high-energy exploration behavior with low-energy exploitation behavior to produce balanced search behavior for complex optimization problems.
The prediction of concrete strength can be precise when using metaheuristic optimization with machine learning, which has a significant potential to enhance the power of concrete strength prediction tolerance, and thus, it can lead to the elimination of prediction errors in concrete strength prediction [14,15]. CatBoost is particularly efficient in work with concrete datasets due to the flexibility of the software with numerical data, the quality of automatic preprocessing, and anti-overfitting features of the used algorithm, but SSO also includes an effective search mechanism and adaptive energy management, which guarantee the optimal optimization process of the hyperparameters as possible [16].
This study presents a comprehensive framework for concrete compressive strength prediction that combines the Somersaulting Spider Optimizer with CatBoost algorithm to achieve superior predictive performance. The research makes several significant contributions to the field of computational concrete engineering:
Primary Contributions
1. Novel Bio-Inspired Optimization Algorithm: Introduction and detailed mathematical formulation of the Somersaulting Spider Optimizer (SSO), a novel metaheuristic algorithm inspired by the unique locomotion behavior of Cebrennus rechenbergi. The algorithm incorporates adaptive energy management and dual-phase movement mechanisms (somersaulting for exploration and rolling for exploitation) specifically designed for hyperparameter optimization in machine learning applications.
2. Advanced Hyperparameter Optimization Framework: Development of an integrated SSO-CatBoost framework that achieves significant performance improvements over baseline models. The proposed approach demonstrates a 24.6 percent reduction in mean squared error compared to the standard CatBoost implementation, with the SSO-optimized model achieving MSE of 12.61 vs. 16.73 for the baseline model.
3. Comprehensive Comparative Analysis: Systematic evaluation and comparison of SSO against seven other metaheuristic optimization algorithms (Differential Evolution, Grey Wolf Optimizer, Whale Optimization Algorithm, Genetic Algorithm, Bat Algorithm, Harris Hawks Optimization, and Particle Swarm Optimization) applied to CatBoost hyperparameter tuning for concrete strength prediction.
4. Rigorous Statistical Validation: Implementation of comprehensive statistical analysis including Analysis of Variance (ANOVA) and Wilcoxon signed-rank testing to establish statistical significance of the proposed methodology, ensuring robust validation of performance improvements and algorithmic effectiveness.
The remainder of this paper is organized as follows: Section 2 presents a comprehensive literature review of machine learning approaches in concrete strength prediction, Section 3 details the materials and methods including dataset description, SSO algorithm formulation, and CatBoost implementation, Section 4 presents experimental results and comparative analysis, Section 5 provides discussion of findings and implications, and Section 6 concludes with key contributions and future research directions.
The ensemble learning techniques have also demonstrated specific potential in challenging the complexity of prediction of concrete strength. A recent study by way of illustration of this trend [17] where pure physical testing is replaced by the ISSA-BPNN-AdaBoost model, which has shown itself to be superior to the physical testing model when compared to other traditional physical testing models. The technique does not suffer time consumption and cost constraints that characterizes conventional strength testing yet high degree of accuracy is achieved. The effectiveness of optimizing the base learners in ensemble structures through excellent results is further proved by the superiority between ensemble learners in different datasets.
There has been a growing role of model interpretability because machine learning models are now being incorporated into significant engineering choices. Especially, one of the recent studies established a framework of interpretable machine learning applied to high-performance concrete (HPC) compressive strength prediction [18] indicates the use of random forest, AdaBoost, XGBoost, and LightGBM models, hyperparameter optimization (by cross-validation methods). SHAP analysis indicated that age, water-to-cement ratio, slag and content of water, compose crucial elements that affect forecasted compressive strength and superplasticizers ratios had lower impacts. This decision supportable method improves precision and visibility of prediction such that engineers gather the associations between mix elements and connections of strength properties.
Extensive dataset generation has brought many achievements in the field and researchers identify the significance of an effective data base to develop and validate the model. As an example, ConcreteXAI dataset [19] is an important contribution as it is a ten year lab study consisting of 18,480 measurements each of 12 different concrete formulations. This is holistic data consisting of both mechanical and non-destructive tests, which makes a proper development of a predictive model quite feasible and decision-making processes to stay transparent.
The use of concrete has been studied beyond the regular concrete to consider more specific formulations and uses according to the various needs of the construction projects judged by the modern needs. As an illustration, one study [20] examining preplaced aggregate concrete (PAC) discovered that the complexity of loading cementitious mixtures into existing form of pre-placed coarse aggregates led to complicated methods of prediction because of production peculiarities and the material properties the final products developed. Likewise, one study [21] also examined hybrid-fiber-reinforced recycle aggregate concrete (HFRRAC) where eleven machine learning models were used to overcome non-linearity between constituents. The results revealed that light gradient boosting machine algorithms were the most precise with regards to this complicated material system and they obtained high R2 values and low error measures.
In modern engineering practices, high-performance concrete has been given special focus because of enhanced mechanical characteristics and multi-faceted engineering practise in most modern construction works. According to a recent study [22], the compressive strengths that can be reached using HPC are higher than 200 MPa, the average strengths of 100–120 Mpa can be used in 28 days in a variety of engineering projects. The problems related to predictability of such high-strength material assume use of advanced modeling methods, which are capable of modeling complex correlations between advanced admixtures and final properties.
The combination of optimization algorithms with machine learning has also become a potent method of predicting concrete strength that combines the pattern matching abilities of machine learning with the methodical search capacity of optimization algorithms. Indeed an example of this was noted by research study carried out by [23] using a hybrid combination of a random forest with a particle swarm optimization (PSO) to predict concrete strength using blast furnace slag and fly ash. The model had a correlation coefficient of 0.954 on the testing set, which proved the great generalization capacity to sustainable forms of concrete.
Progress in hybrid methods are occurring, and scientists are creating more powers of prediction of concrete strength through computer models. Among others, more recent research has proposed an advanced hybrid algorithm incorporating deep learning with reinforcement learning that utilizes Convolutional Neural Network–Long Short-Term Memory (CNN–LSTM) based feature extraction and a Dueling Double Deep Q-Network agent that optimises mix ratios by repeatedly repeating the optimization of features and mix ratios [24]. The methods are a future of computational intelligence in a real world design.
Concrete strength prediction research has come to include an increased focus on environmental sustainability (sustainable construction practices) as the prevailing attitude of the construction industry. One case in point consists of the recent introduction of the SmartMix Web3 model, which is an overview of ensemble machine learning integrated with blockchain technology to lend more strength to low-carbon concrete design [25]. This is a novel way of approaching things to show that, even to the technical challenges that are on the table, the environment is being challenged by modern computational methods.
It may also be an important line of research to resolve the data limitations because not all types of concrete and all its applications are covered with extensive datasets. Here, the framework offered by recent research [26], combining Model-Agnostic Meta-Learning (MAML) and Shapley Additive Explanations (SHAP) aids the engineering of solutions to get a better predictive accuracy, as well as to improve an interpretation in data-limited scenarios, where both methodologies are essential ways to achieve higher predictive performance using fewer explanations grounded on prediction equations.
Table 1 provides a systematic comparison of the various machine learning approaches discussed, highlighting the diversity of methodologies and their specific applications in concrete strength prediction.
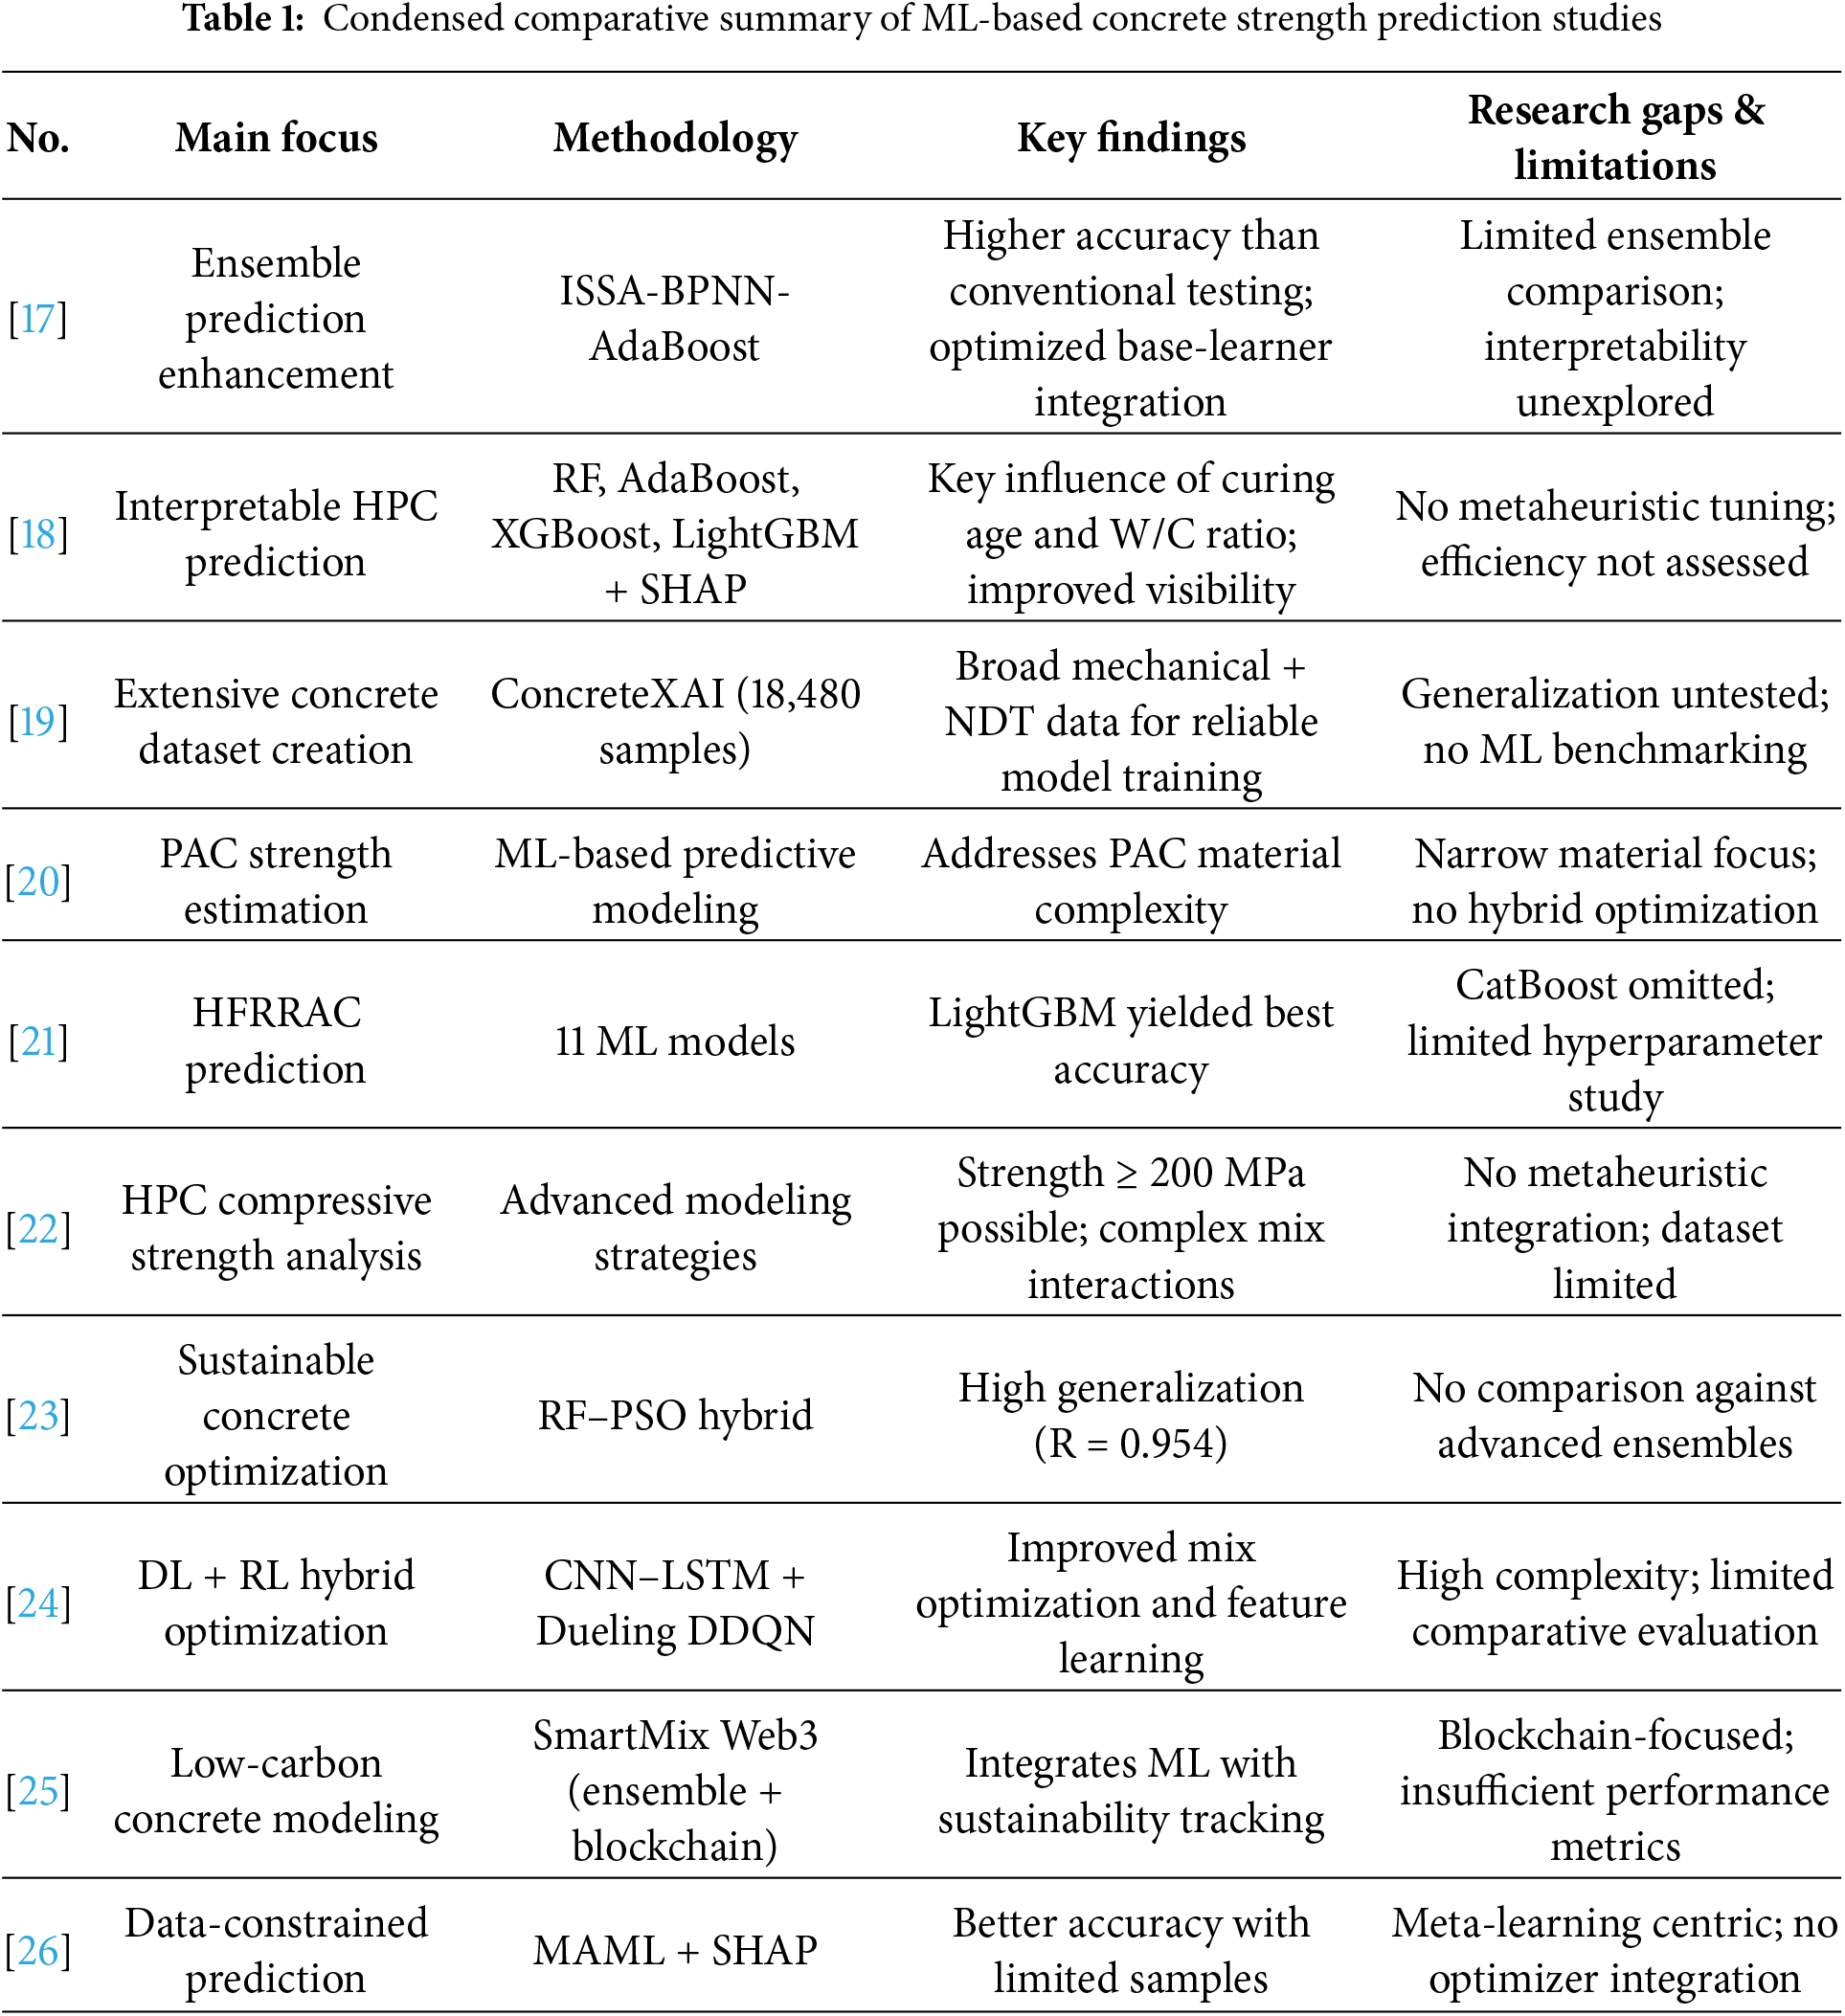
The comprehensive analysis presented in Table 1 reveals several critical research gaps that motivate the present study. First, despite the proven effectiveness of gradient boosting algorithms, CatBoost remains underexplored in concrete strength prediction compared to XGBoost and LightGBM, despite offering superior handling of categorical features, built-in regularization, and resistance to overfitting. Second, systematic comparison of CatBoost with diverse bio-inspired metaheuristic optimizers is absent from the literature, with most studies limiting investigations to single optimization algorithms or relying on computationally expensive grid search methods. Third, recent bio-inspired algorithms such as the Somersaulting Spider Optimizer (SSO), which demonstrates promising exploration-exploitation balance through adaptive energy management, have not been applied to concrete strength prediction. These gaps collectively justify the need for a comprehensive framework combining CatBoost’s gradient boosting capabilities with SSO and other metaheuristic algorithms to achieve enhanced predictive accuracy, computational efficiency, and robust generalization across diverse concrete formulations.
The Somersaulting Spider Optimizer (SSO) represents a recent advancement in bio-inspired metaheuristics, employing dual locomotion modes—high-energy somersaulting for global exploration and low-energy rolling for local exploitation—regulated by adaptive energy management that balances search diversification and intensification. SSO has demonstrated competitive performance across benchmark optimization problems and has proven effective in ensemble learning applications, particularly for earthquake prediction where it achieved superior predictive accuracy and generalization compared to conventional metaheuristics [27]. Given SSO’s proven capability in handling nonconvex, multimodal optimization landscapes and its successful application to machine learning model optimization, it presents a promising candidate for CatBoost hyperparameter tuning in concrete strength prediction, addressing the identified research gap regarding the integration of advanced bio-inspired algorithms with gradient boosting frameworks for enhanced predictive performance.
This study proposes an elaborate machine learning model to forecast concrete compressive strength that is based on the advanced gradient boosting model and bio-inspired optimization tool. The three primary components of the methodology are the data preparation and analysis done with the help of exploratory statistics, a Somersaulting Spider Optimizer (SSO) algorithm to find hyperparameters, and the use of CatBoost as the predictive model. Experimental framework addresses the system of non-linear relationships among parameters of concrete mix engineering and the compressive power of resultant products through optimization of machine learning model hyperparameters. The suggested plan applies the bio-inspired exploration-exploitation principles of the SSO algorithm to identify the most appropriate CatBoost parameters and optimize the predictive performance basing on different concrete formulas. The integrated method provides a potent foundation on realistic estimation of concrete strength, to support the decision making which is based on data in optimal mixes designs and quality control uses.
The proposed methodology follows a systematic three-phase workflow, as illustrated in Fig. 1. The data preparation phase begins with the concrete dataset containing eight input features, followed by preprocessing and exploratory data analysis to identify patterns and correlations. In the model development phase, the dataset is partitioned into training (80%) and testing (20%) sets, and the CatBoost regression model is optimized using the Somersaulting Spider Optimizer (SSO) for hyperparameter tuning. The evaluation phase assesses predictive performance through multiple metrics including MSE,
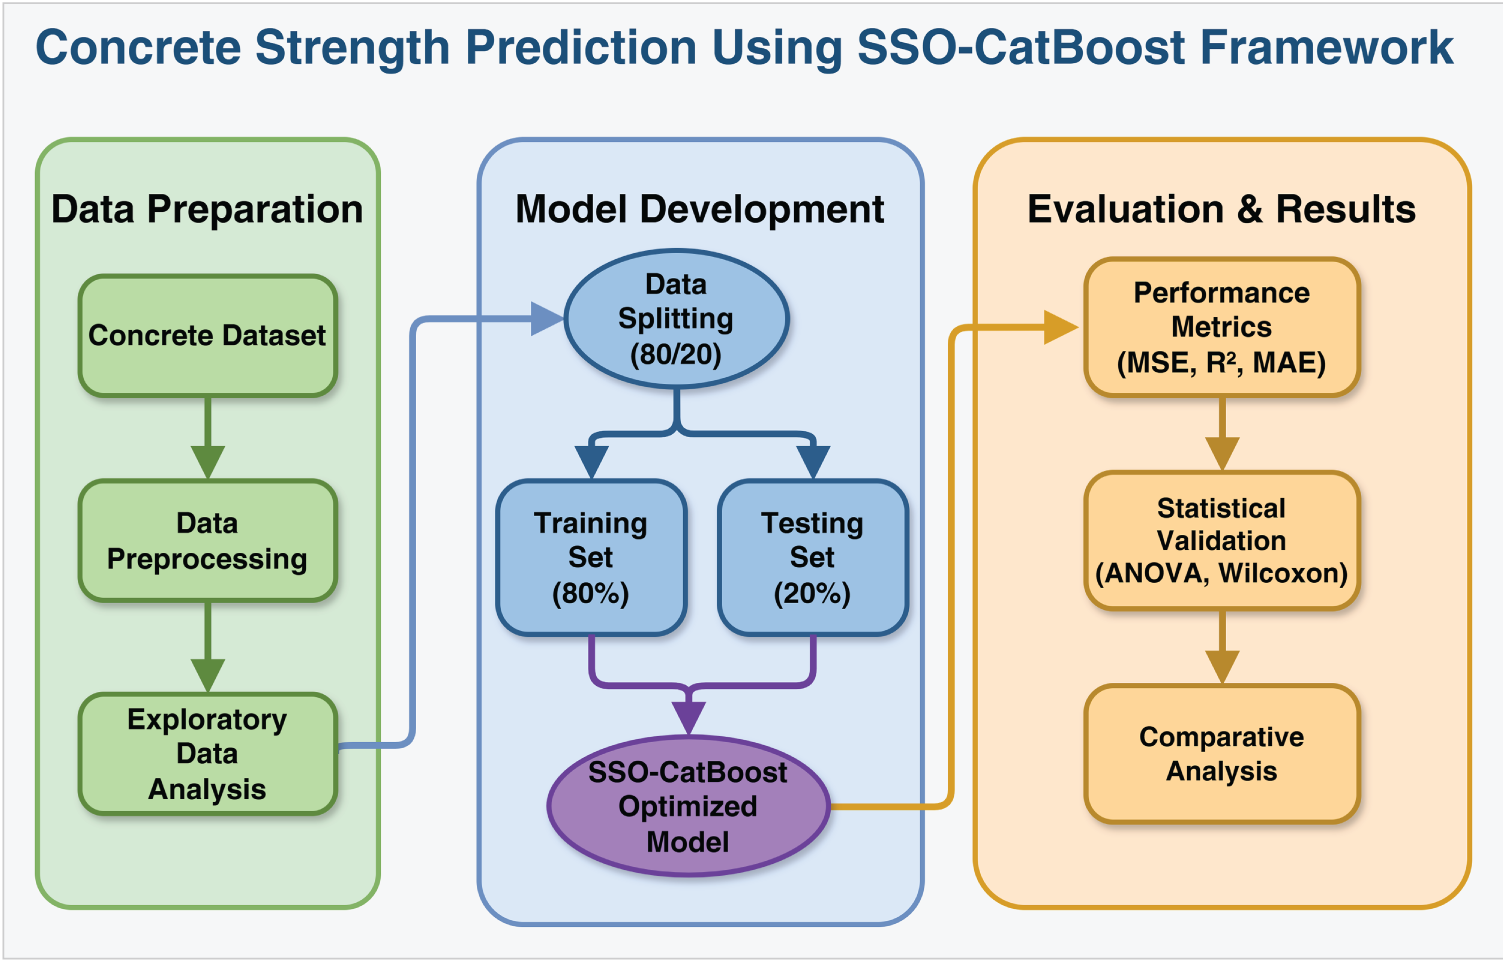
Figure 1: Workflow of the proposed SSO-CatBoost framework for concrete strength prediction
The dataset of concrete compressive strength that was used in this paper provides a holistic basis with respect to evaluating the machine learning algorithms in predicting concrete strength using mix design parameters. The variety of concrete formulations represented in the dataset that can be found would be suitable when comparing predictive models of considerable diversity of mix formulations and curing conditions. Table 2 describes the dataset features in detail with their units and their common ranges.
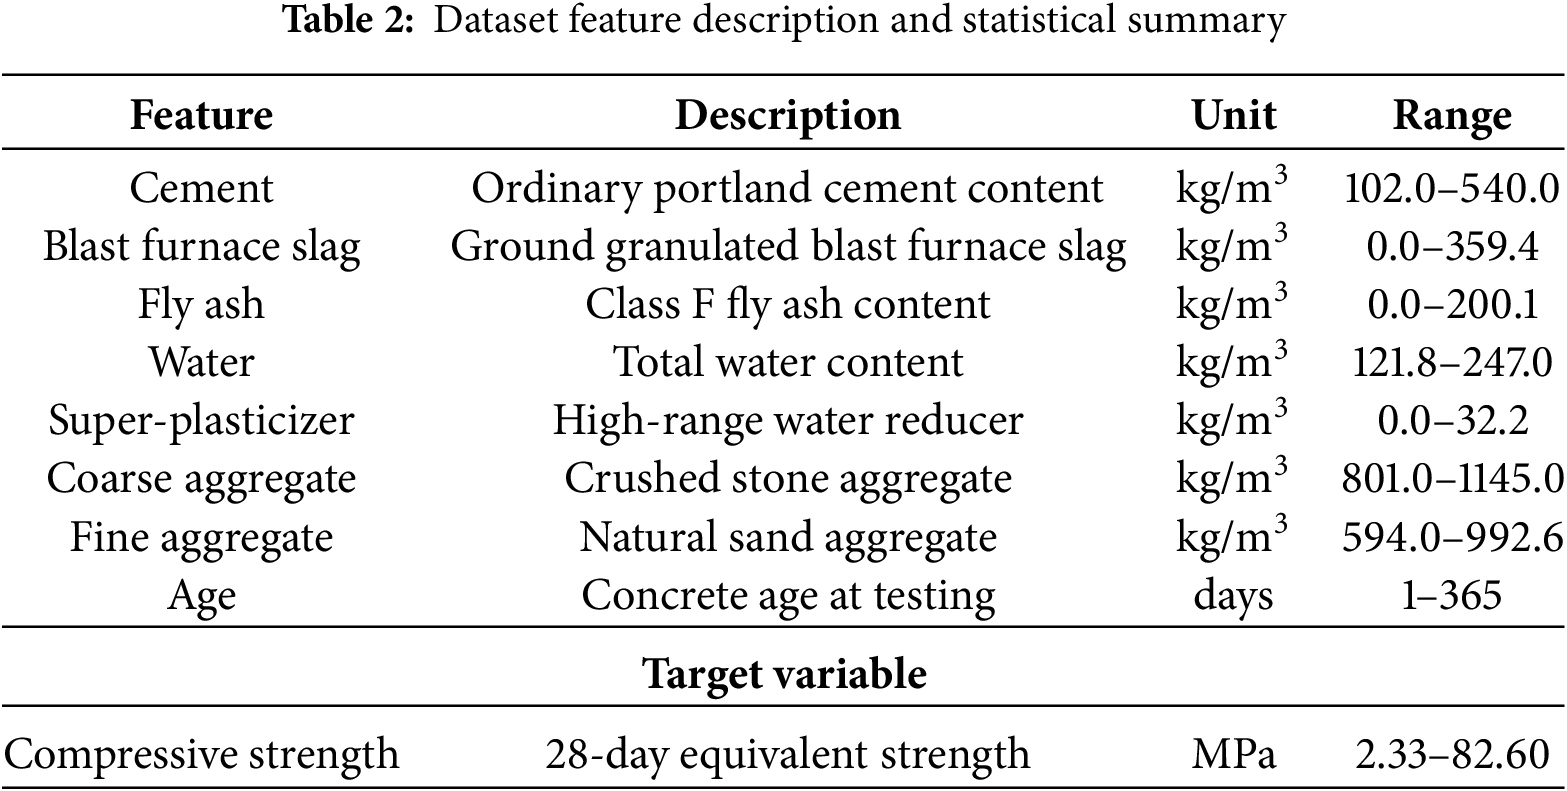
The concrete compressive strength dataset is publicly available on Kaggle (https://www.kaggle.com/datasets/prathamtripathi/regression-with-neural-networking). The dataset consists of 1030 samples with no missing values across all features, which include Cement, Blast Furnace Slag, Fly Ash, Water, Superplasticizer, Coarse Aggregate, Fine Aggregate, Age, and Strength. After removing 25 duplicate entries, 1005 unique records remained for analysis. Summary statistics indicate that cement content ranges from 102 to 540
The feature set encompasses both cementitious materials (cement, blast furnace slag, fly ash) and non-cementitious components (aggregates, water, chemical admixtures), providing comprehensive representation of modern concrete mix designs. The inclusion of supplementary cementitious materials (blast furnace slag and fly ash) reflects contemporary sustainable concrete practices, while the super-plasticizer feature represents modern chemical admixture technology for workability enhancement.
Fig. 2 presents a correlation heatmap revealing relationships between concrete ingredients and its strength. The heatmap visually displays the correlation strengths using varying color intensities. Deeper colors signify stronger correlations, while lighter colors denote weaker associations. Cement demonstrates a positive correlation with concrete strength. Each ingredient perfectly correlates with itself, indicated by a perfect correlation along the diagonal. Overall, the ingredient correlation with strength range from. 08 to 0.85. The heatmap is symmetric around the diagonal. Each ingredient and strength is labeled horizontally and vertically.
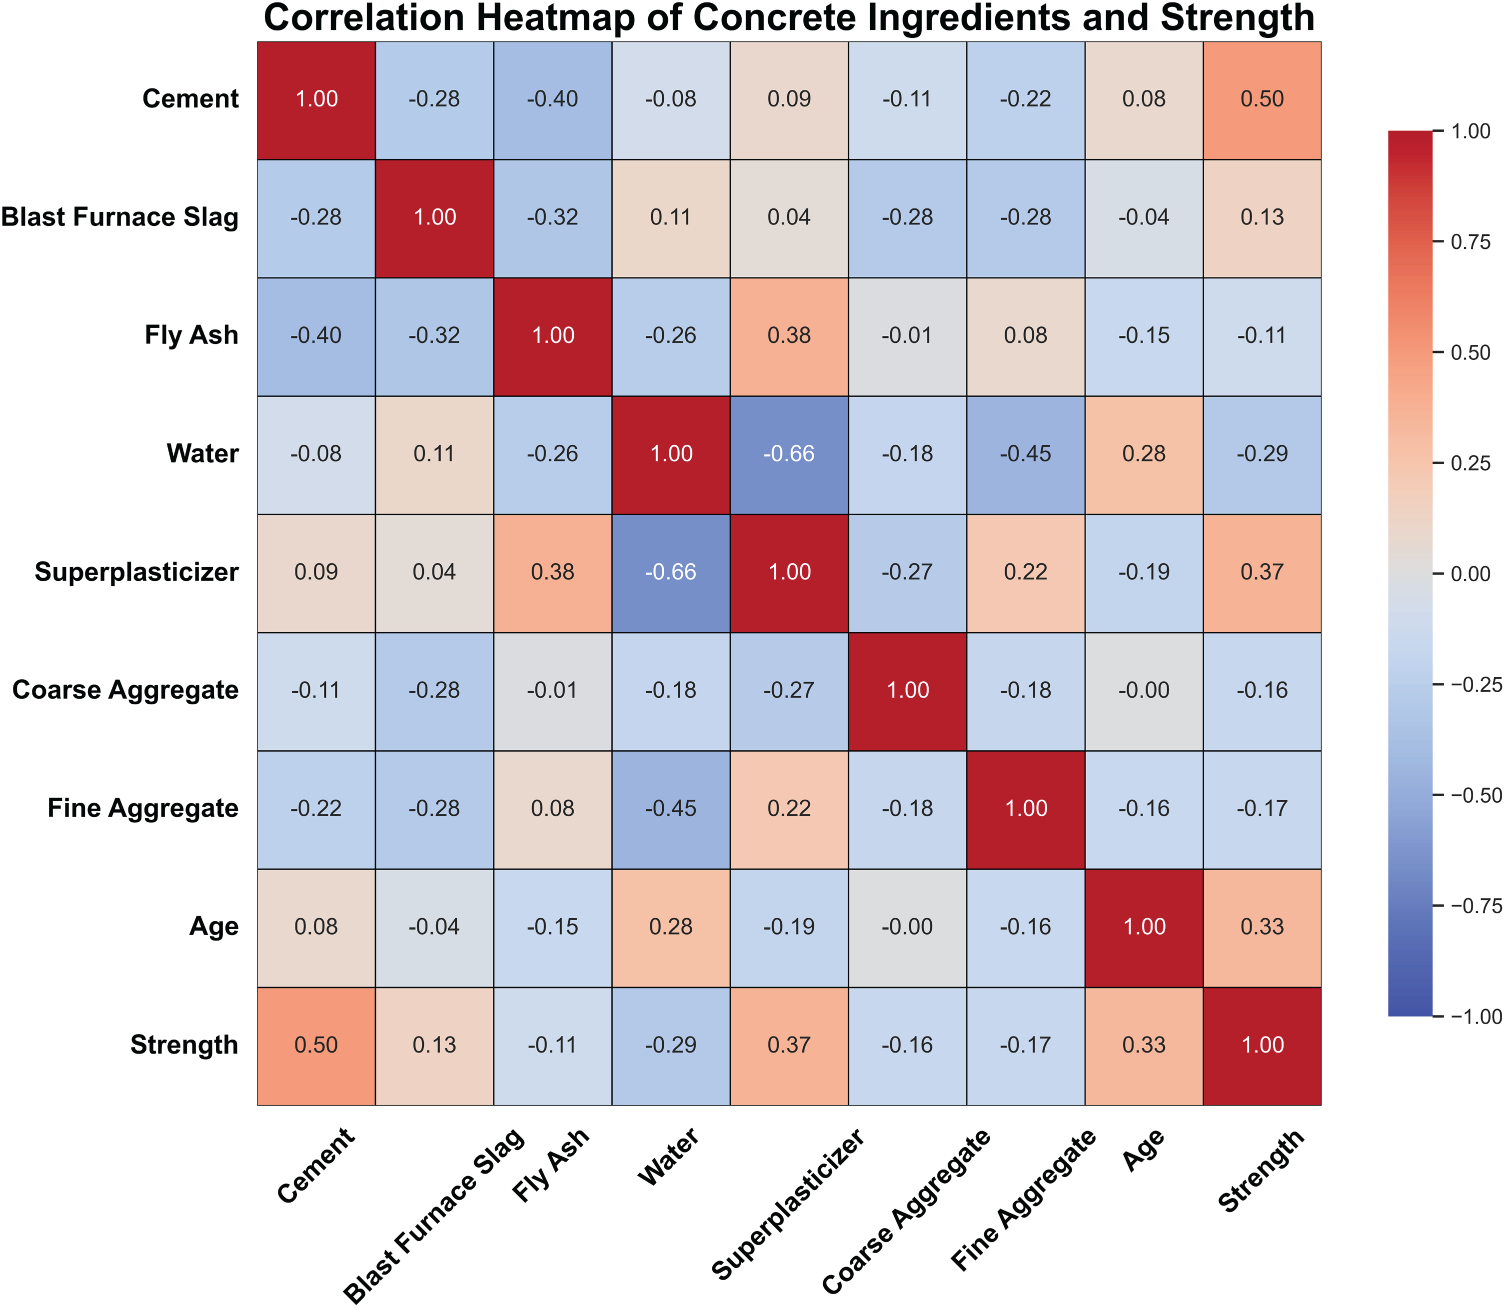
Figure 2: Correlation heatmap of concrete ingredient relationships
Fig. 3 shows the distribution of concrete strength, exhibiting a unimodal shape with the highest frequencies concentrated around the central region. The curve’s peak reveals that the best model has the highest frequency at approximately 35 MPa, indicating a concentration of concrete strength values around this point. Frequencies gradually decrease as the strength values deviate further from 35.
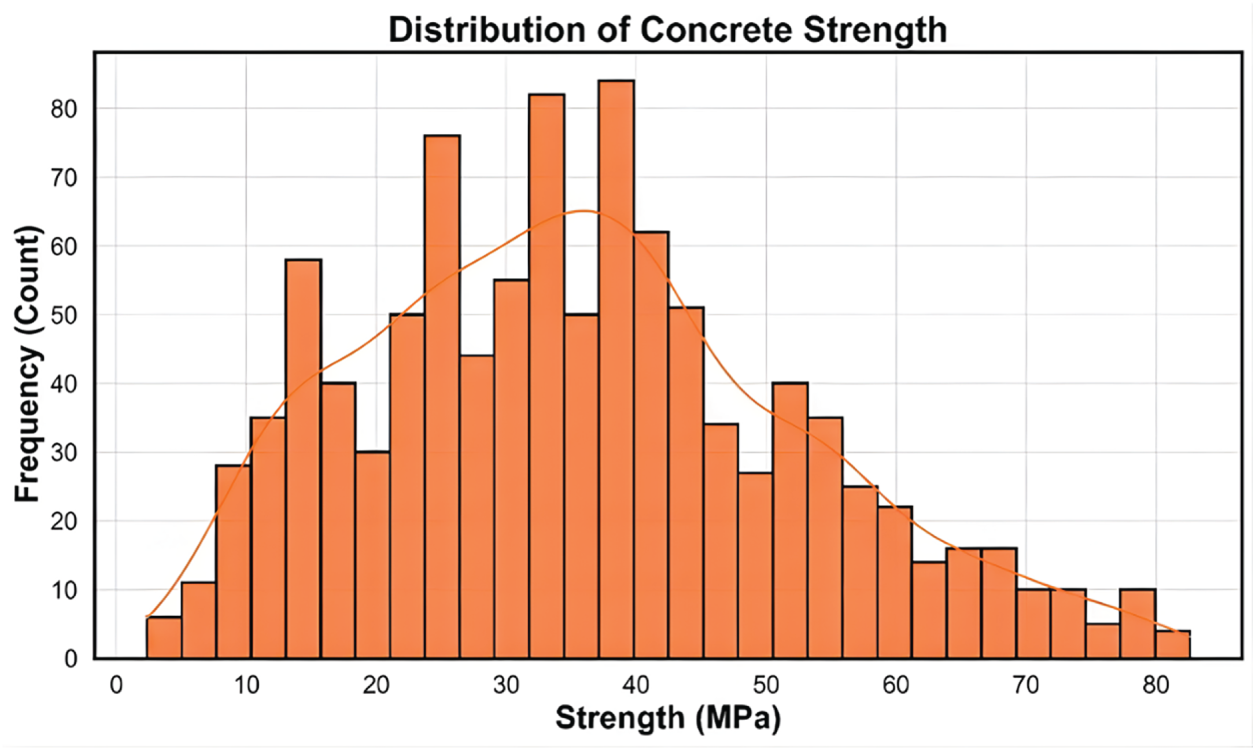
Figure 3: Distribution of concrete strength
Fig. 4 illustrates the distribution of concrete ingredients, revealing key characteristics of the dataset. The distributions showcase varying patterns across different components. Notably, the age distribution displays a heavy skew, indicating a concentration of samples at younger ages. The distribution of blast furnace slag exhibits a similar skewed pattern. Fine aggregate distribution has a peak at the center of the range.
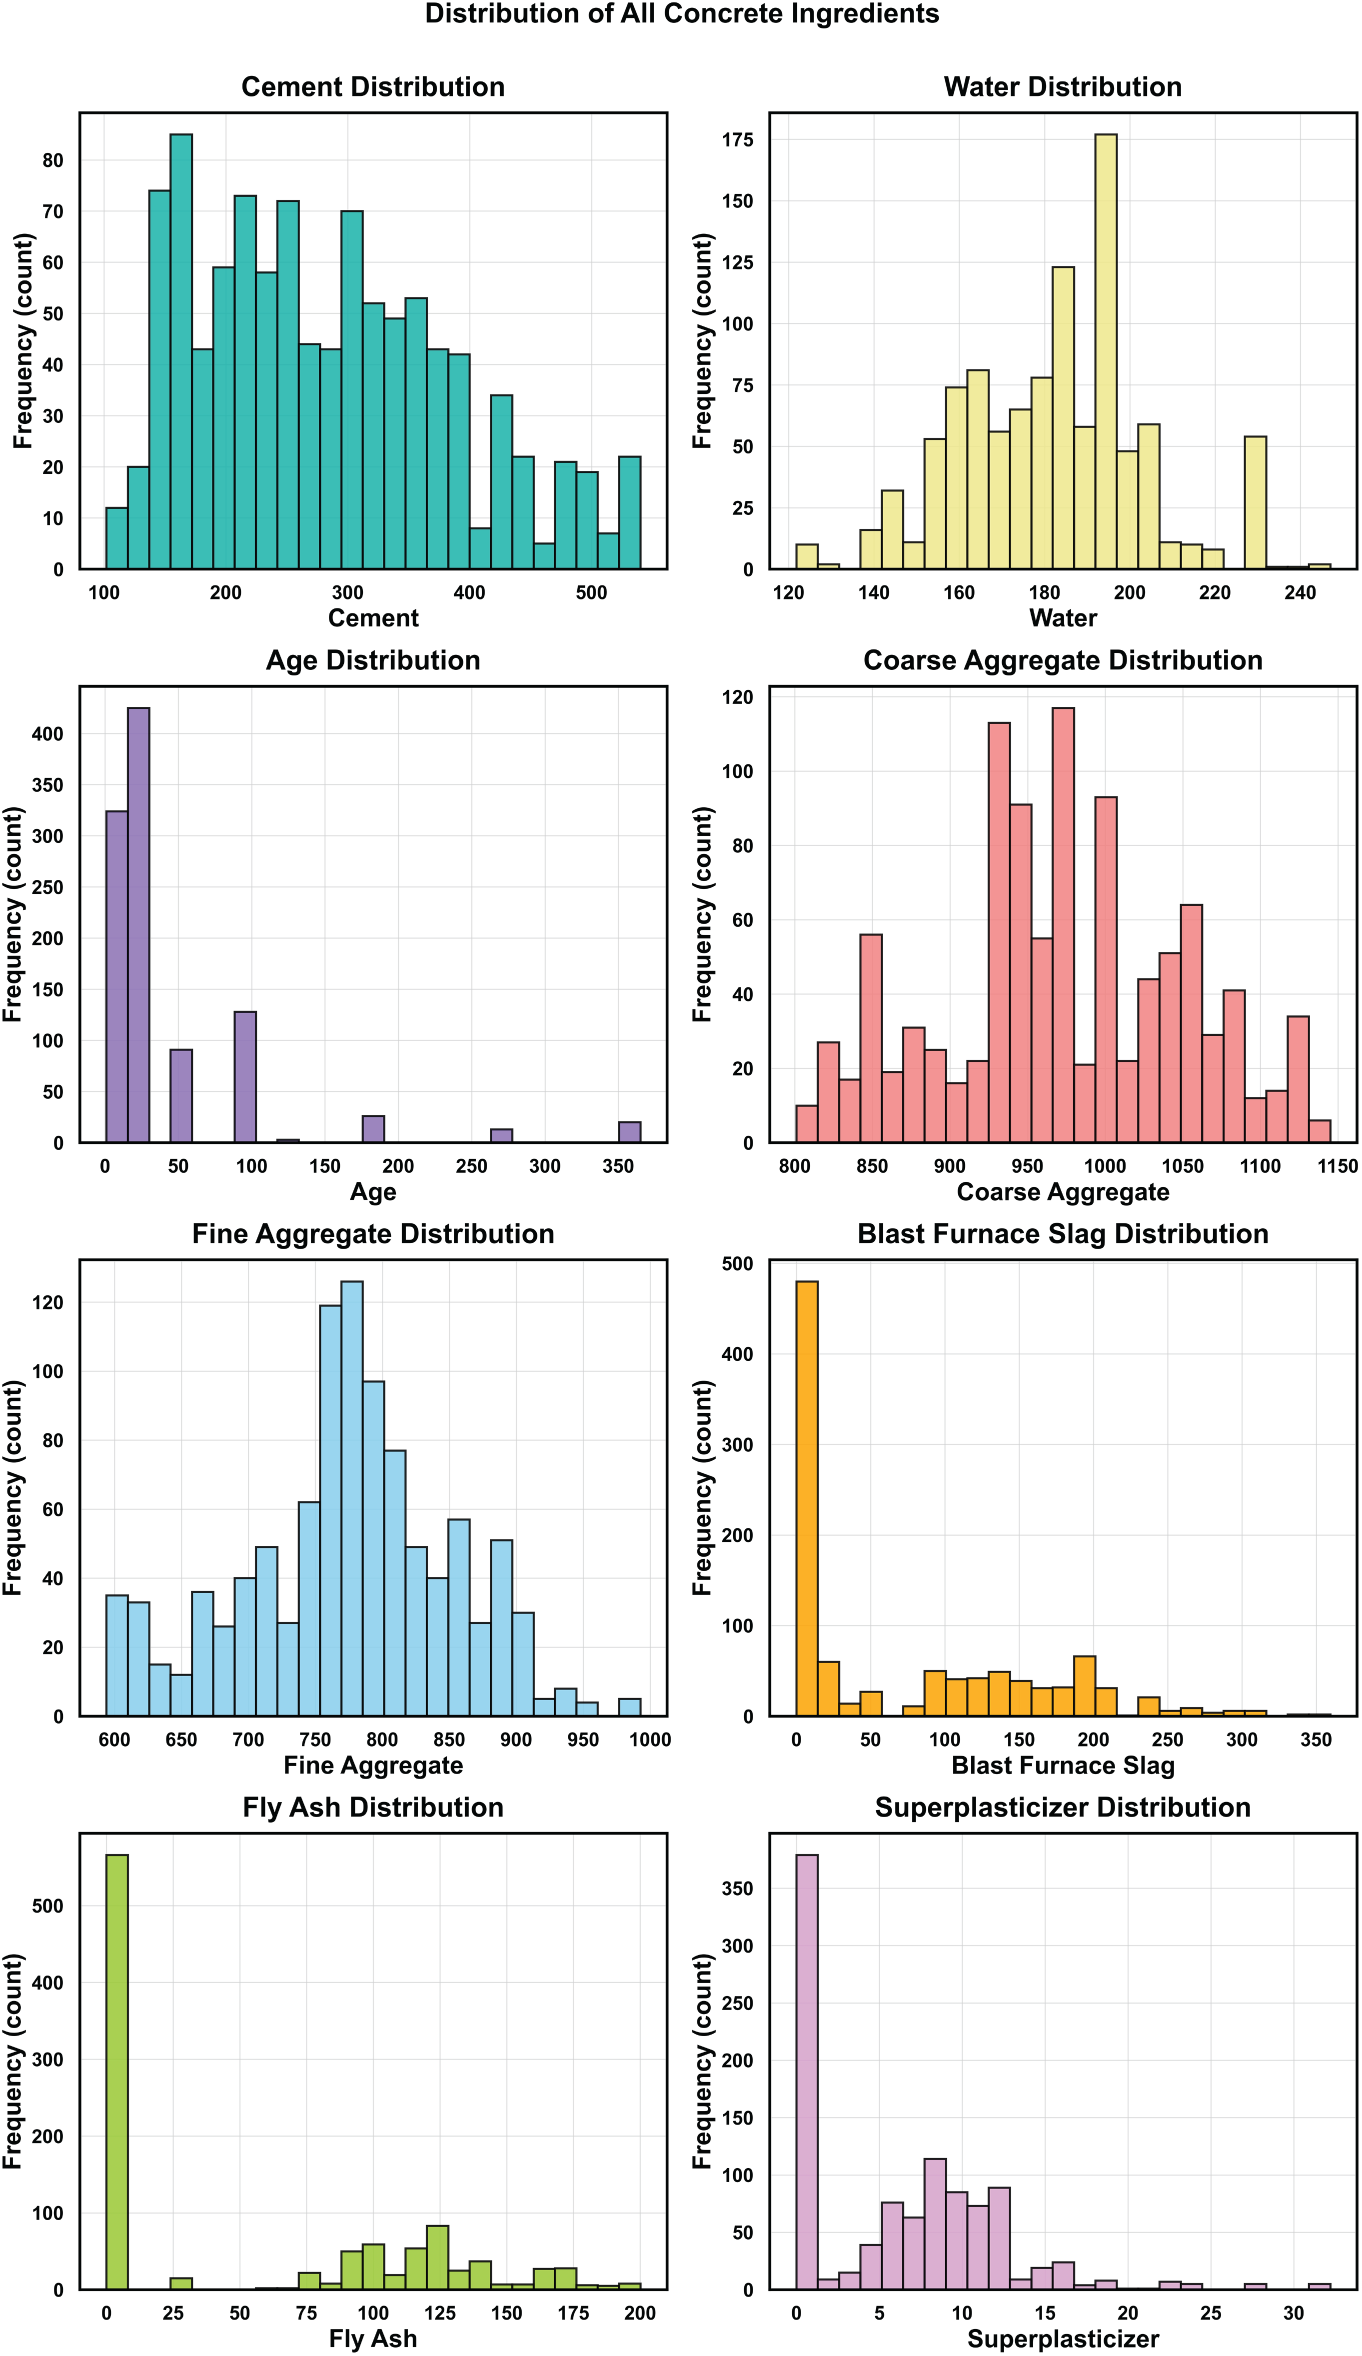
Figure 4: Concrete ingredient distribution analysis
Fig. 5 illustrates the inverse relationship between water-to-cement ratio and concrete strength. The water-to-cement ratio was calculated as
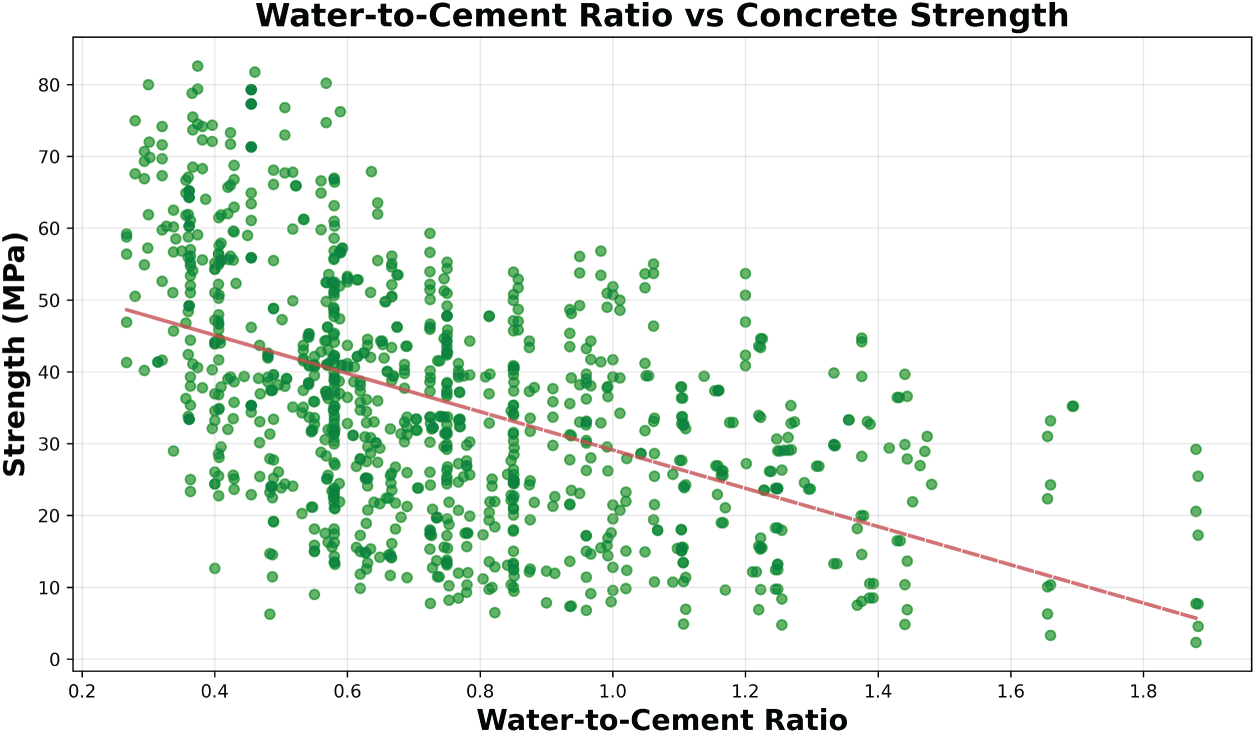
Figure 5: Effect of water-cement ratio on concrete compressive strength
The varying shades of green represent differences in point density: darker areas indicate regions where observations overlap more heavily, while lighter areas correspond to more sparsely distributed points.
Fig. 6 illustrates the connection between cement content and concrete strength. The best model indicates a positive correlation, suggesting that as cement content increases, so does concrete strength. The best model line demonstrates an increase in strength with a rise in cement. The fitted line has a dashed style and positive association.
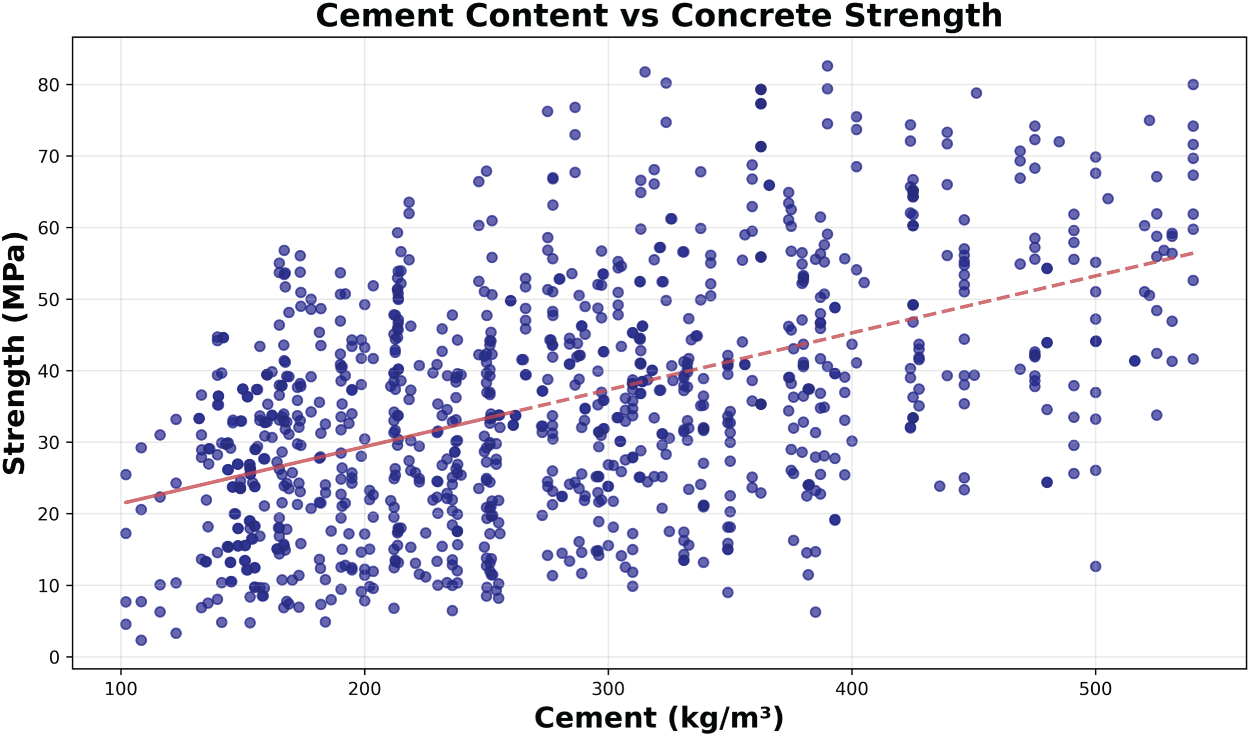
Figure 6: Effect of cement content on concrete compressive strength
The importance of features when predicting the concrete strength with a Random Forest model is presented in Fig. 7. Age was identified as the most prominent with an importance value of 0.336, hence demonstrating that it is predominant in the model predictions. Second was Cement with a significant impact of 0.331, which emphasized the fact that cement is an important element in the generation of strength. An important role was also played by Water with a value of 0.107, and other variables such as Blast Furnace Slag (0.079) and Superplasticizer (0.065) played a less substantial role. On the other hand, Fine Aggregate (0.038), Coarse Aggregate (0.028), and Fly Ash (0.016) attributes did not significantly affect the model, and this explains the critical role played by Age and Cement in the determination of concrete strength in this model.
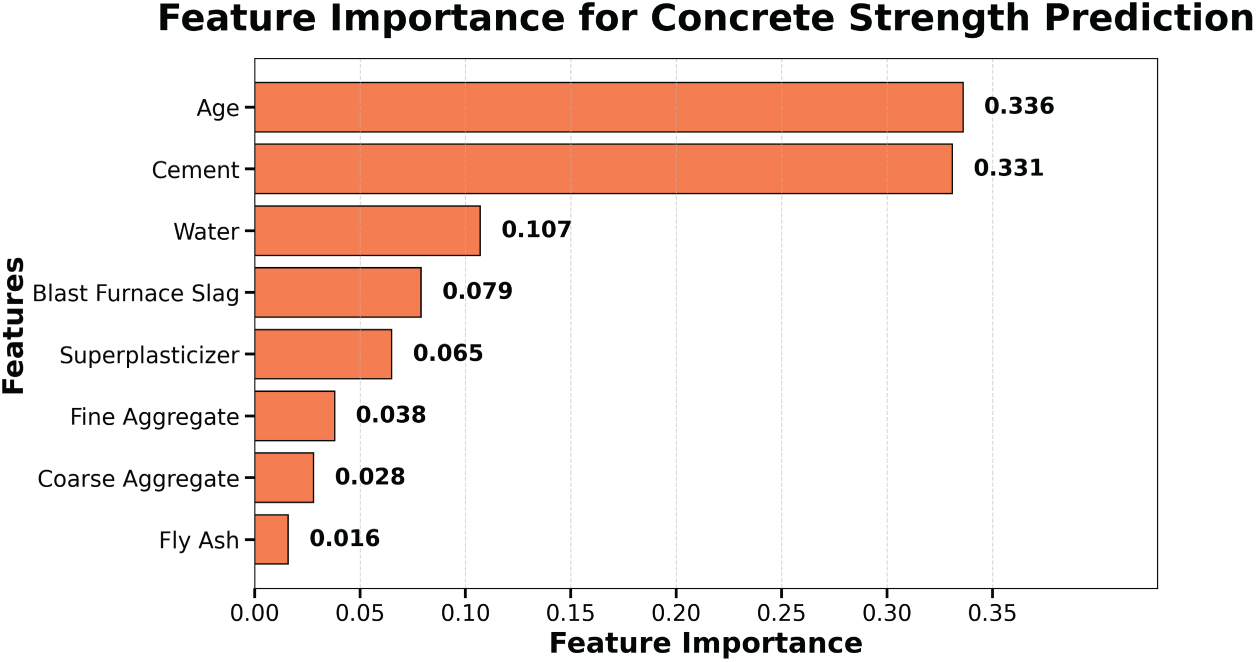
Figure 7: Random forest feature importance for concrete strength prediction
The value of feature importance given by the Random Forest model is a numerical value that is utilized to establish the relevance of each variable on the overall predictive success. In this instance, the scores of importance indicate the effects of each feature on concrete strength prediction as compared to the other features. These scores help in identifying the most impactful parameters, which enhances understanding and, perhaps due to that, helps develop more effective mix design strategies. The bar graph provided by the figure, in a visual form, offers a clear idea of the dominating influence of both Age and Cement in predetermining the concrete strength in this study, which is an important revelation.
A key limitation is that standard feature-importance scores reflect only the individual input variables and do not automatically capture derived ratios (e.g., W/C ratio influence) or interactions; therefore, combined effects may be learned implicitly but not appear as a ratio.
3.2 Somersaulting Spider Optimizer (SSO) Algorithm
The Somersaulting Spider Optimizer (SSO) is a bio-inspired metaheuristic algorithm based on the extraordinary locomotion behavior of Cebrennus rechenbergi, commonly known as the somersaulting spider or flic-flac spider. This desert-dwelling arachnid exhibits two distinct movement patterns: high-energy somersaulting for rapid escape at velocities up to 2 m per second, and low-energy rolling for local foraging and territory exploration [28].
The SSO algorithm models spider behavior through a population of N spider agents, each representing a candidate solution
The balance between exploration and exploitation phases is controlled by time-dependent adaptive factors:
where
Each spider agent maintains a dynamic energy level that reflects search performance:
The behavioral threshold determining movement type is calculated as:
When
The exploration phase employs somersaulting movement combining rotational and translational components. The target selection adapts based on stagnation status, with stagnant spiders (
where the rotational and translational components are:
The intensity factor
The exploitation phase uses rolling movement for local refinement:
where the rolling radius decreases with iteration progress:
When spider energy falls below 0.2, conservative adjustment is applied:
The complete Somersaulting Spider Optimizer algorithm integrates both exploration and exploitation mechanisms through an adaptive energy management system. Algorithm 1 presents the main framework that coordinates the somersaulting and rolling behaviors while maintaining population diversity and convergence toward optimal solutions.
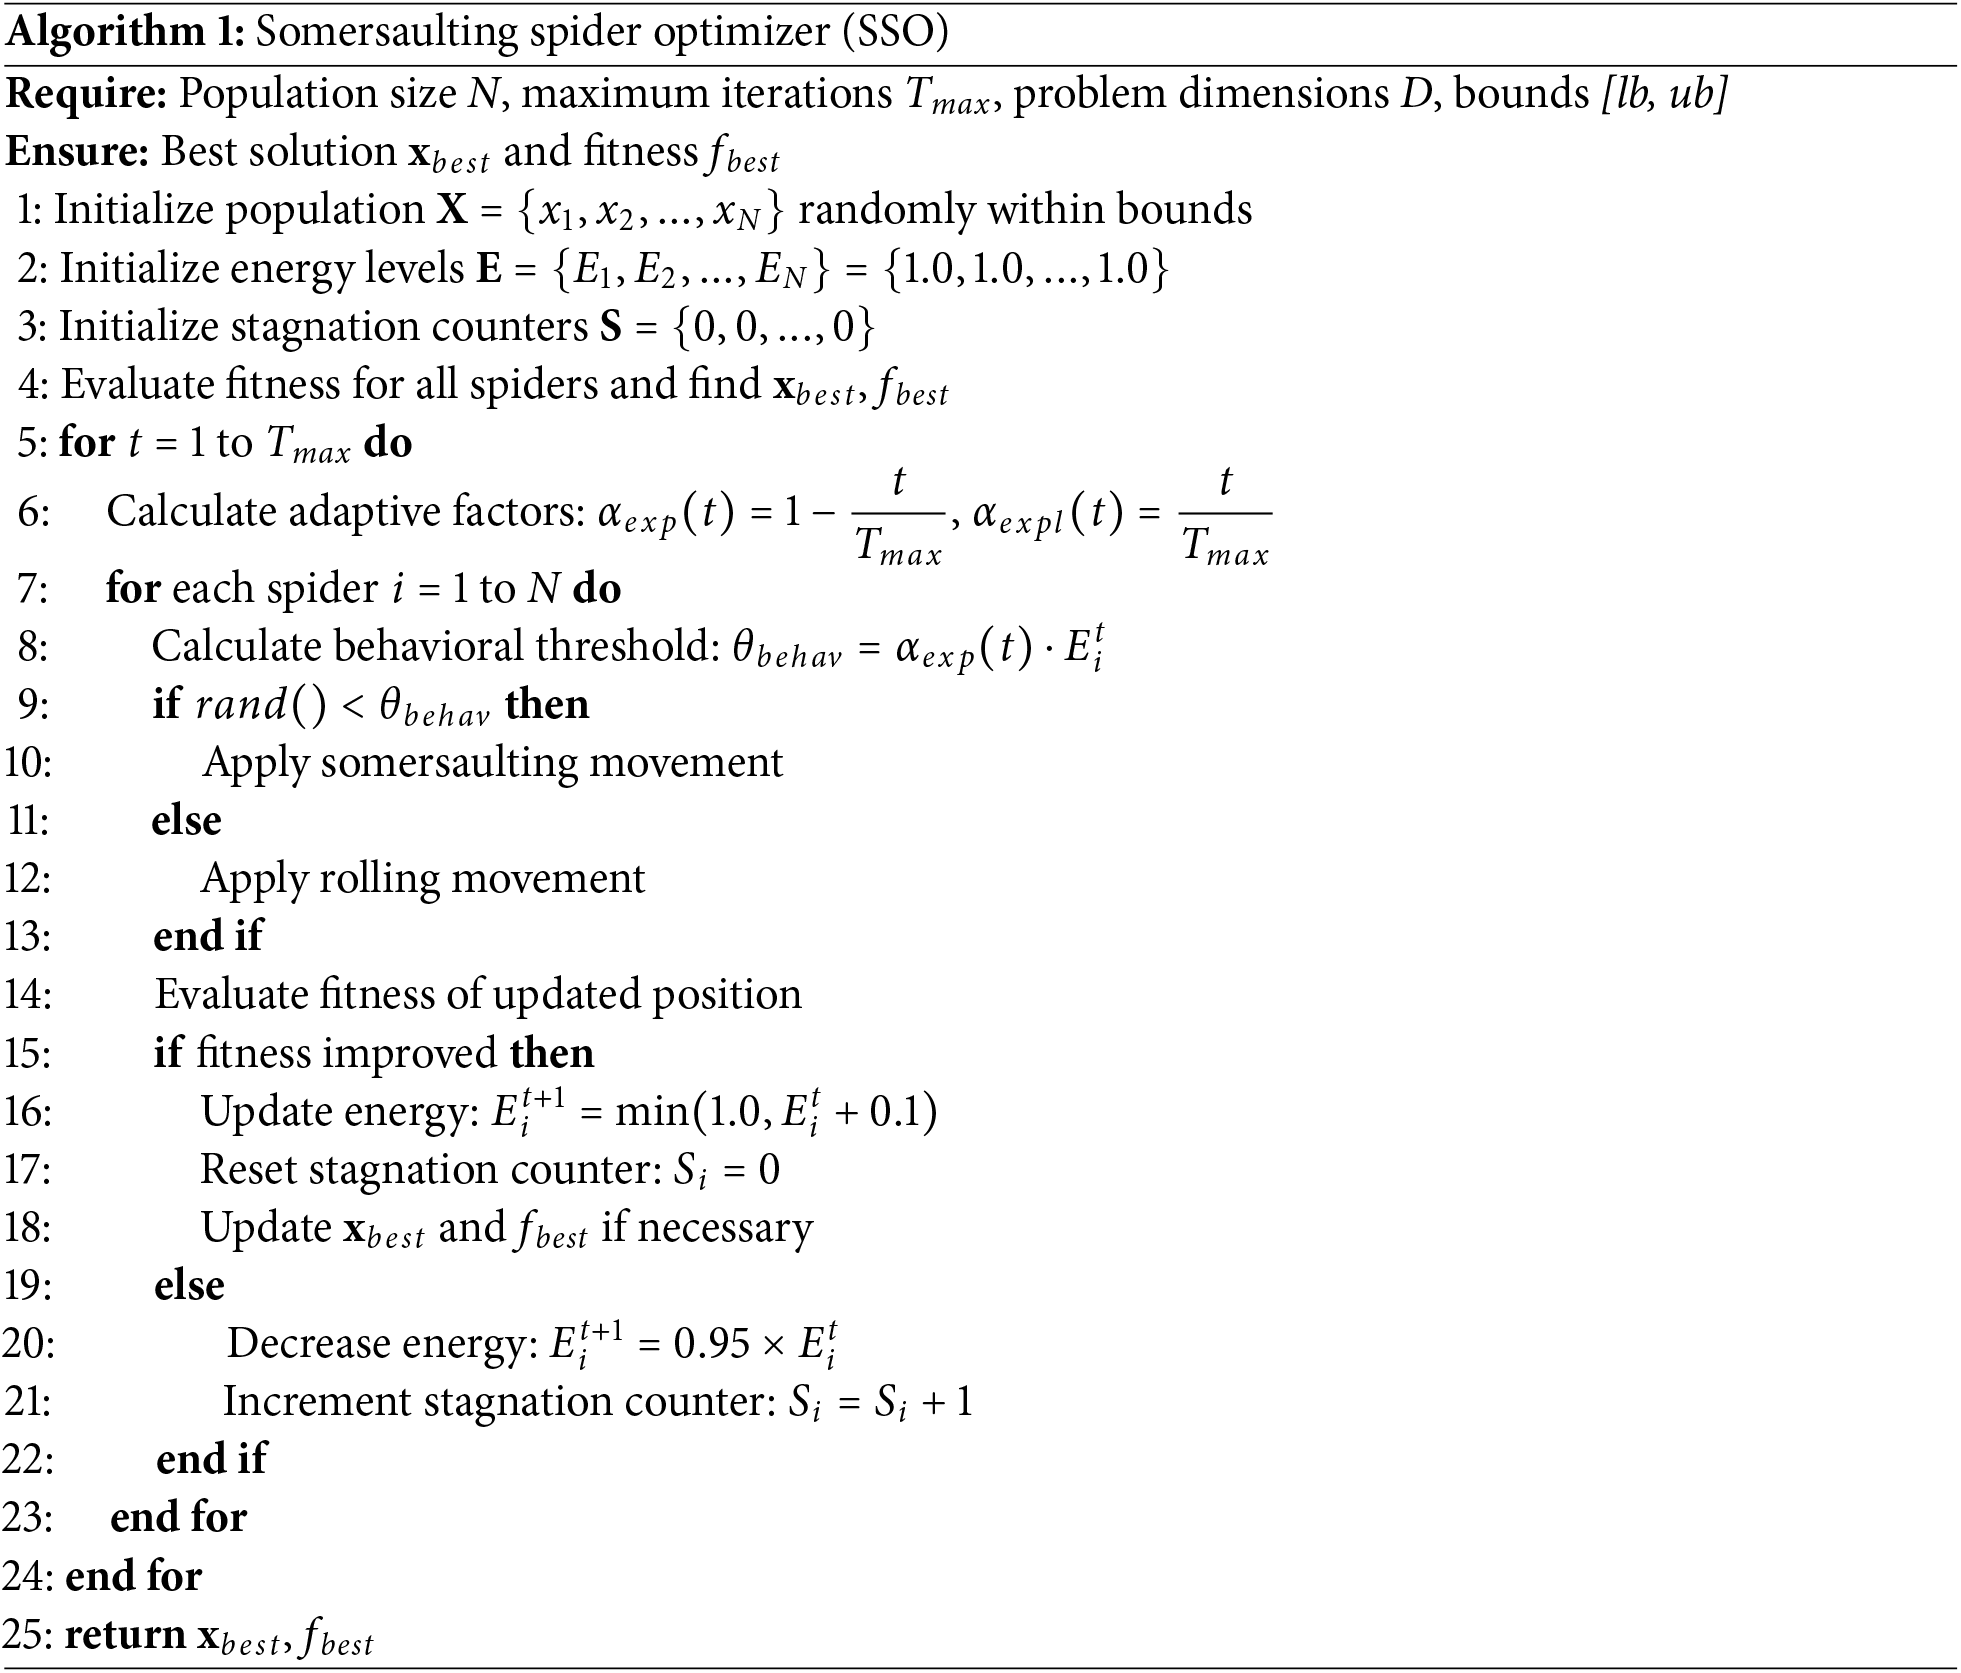
The SSO algorithm’s adaptive energy management system and bio-inspired movement mechanisms provide effective balance between exploration and exploitation, making it particularly suitable for hyperparameter optimization in machine learning models such as CatBoost for concrete strength prediction applications.
The complete SSO implementation is publicly available on GitHub (https://github.com/SayedKenawy/SomersaultingSpiderOptimizer) to ensure reproducibility and facilitate further research.
CatBoost (Categorical Boosting) is a state-of-the-art gradient boosting algorithm that addresses critical limitations in traditional boosting implementations through two fundamental innovations: ordered boosting and advanced categorical feature processing. The algorithm effectively mitigates prediction shift caused by target leakage, making it particularly suitable for concrete strength prediction tasks involving the eight-dimensional feature space of concrete mix design parameters [6].
3.3.1 Mathematical Framework and Dataset Integration
CatBoost constructs an ensemble predictor by iteratively combining weak learners following the standard gradient boosting framework [29]. Given the concrete dataset
where
The algorithm employs oblivious decision trees as base predictors, utilizing identical splitting criteria across entire tree levels [30]. This symmetric structure is particularly advantageous for the concrete dataset where numerical features (cement: 102–540
The ordered boosting mechanism eliminates target leakage by ensuring predictions for each training example depend solely on preceding examples in a random permutation
where
The algorithm’s gradient computation considers the complex interactions between cementitious materials (cement, blast furnace slag, fly ash), water-to-binder ratios, chemical admixtures (super-plasticizer), aggregate compositions (coarse and fine aggregates), and curing time (age) that collectively determine concrete compressive strength through non-linear relationships.
3.3.2 Implementation and Hyperparameter Optimization Framework
CatBoost operates efficiently with the concrete dataset’s purely numerical features, eliminating preprocessing overhead while maintaining robust performance across the feature space. The algorithm’s automatic scaling and normalization capabilities handle the diverse measurement units inherent in concrete mix proportions (
The tree construction process employs a greedy top-down procedure, selecting optimal splits across the eight-dimensional feature space. For concrete applications, this enables the algorithm to identify critical thresholds such as optimal cement content ranges (typically 300–450
CatBoost’s hyperparameter space for concrete strength prediction includes: learning rate
The algorithm excels at modeling the time-dependent strength development captured by the age feature, automatically learning strength gain patterns from early-age (1–7 days) to long-term (28–365 days) curing periods. CatBoost’s gradient-based optimization effectively handles the non-linear strength evolution influenced by cement hydration, pozzolanic reactions from supplementary materials (blast furnace slag, fly ash), and the role of chemical admixtures in strength development.
The integration of CatBoost with the Somersaulting Spider Optimizer enables systematic exploration of the hyperparameter space to maximize prediction accuracy across the diverse range of concrete mix designs represented in the dataset. This optimization approach is particularly valuable given the dataset’s comprehensive coverage of conventional and high-performance concrete formulations, where optimal model configurations may vary significantly based on the proportion of supplementary cementitious materials and age-related strength development patterns. The algorithm’s computational efficiency makes it ideal for iterative hyperparameter tuning, facilitating the development of highly accurate concrete strength prediction models that can reliably estimate compressive strength based on the eight fundamental mix design parameters.
This section presents a comprehensive evaluation of machine learning models and optimization algorithms for concrete strength prediction through three analytical phases. First, baseline machine learning models are assessed using standard performance metrics to establish fundamental predictive capabilities. Second, metaheuristic optimization algorithms enhance the best-performing baseline model, demonstrating bio-inspired optimization effectiveness. Finally, statistical analysis validates performance differences through parametric and non-parametric testing methods. Standardized hyperparameter configurations were implemented for all optimization algorithms to ensure fair comparison, as presented in Table 3.
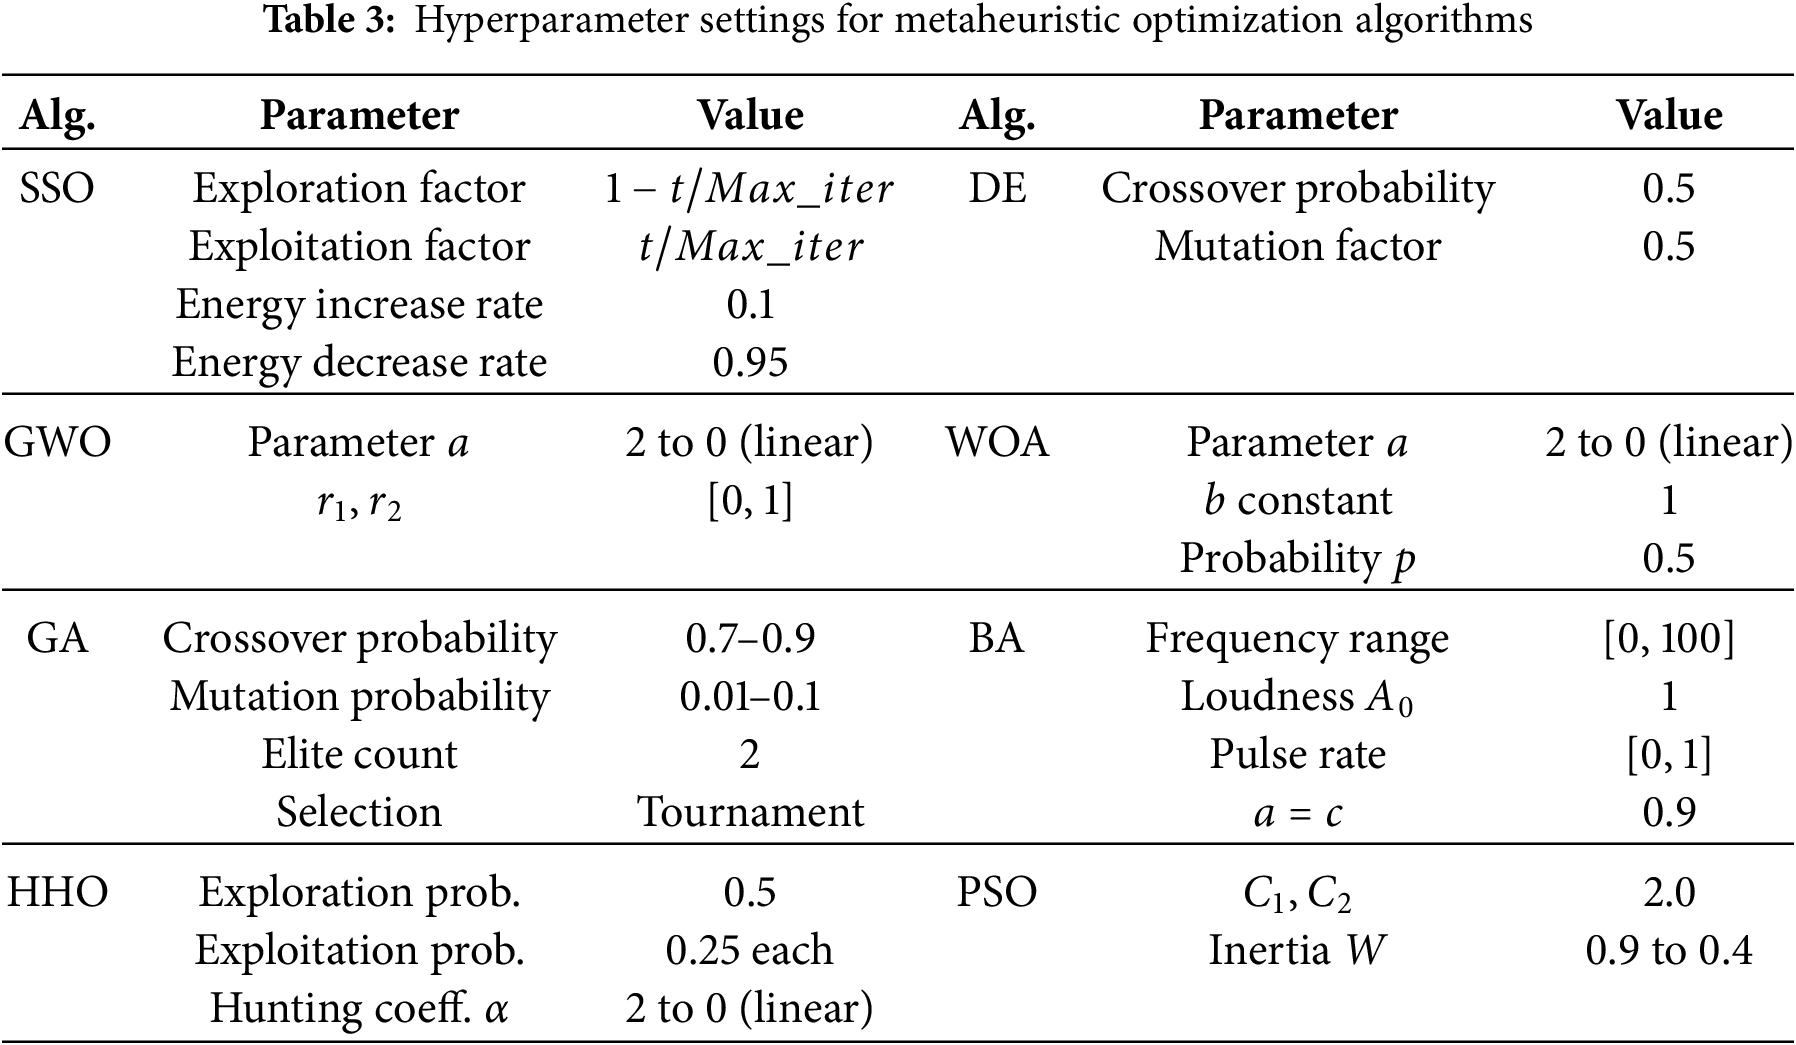
Table 4 presents a comprehensive comparison of regression models for concrete strength prediction. CatBoost demonstrated superior performance across all evaluation metrics, achieving the lowest Mean Squared Error (MSE) of 16.73 and the highest Pearson correlation coefficient (r) of 0.968, indicating strong predictive accuracy and linear relationship with observed values. The model also attained an
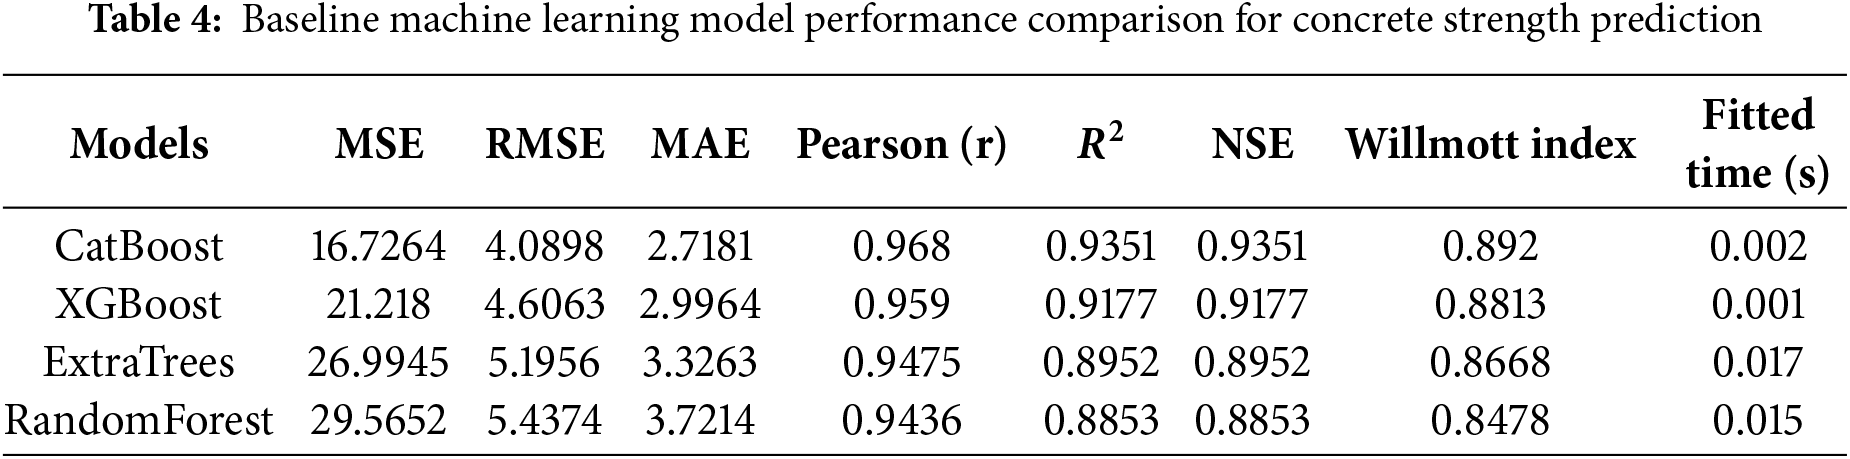
The error analysis in Fig. 8 reinforces CatBoost’s superiority, showing the lowest RMSE and MAE values among all compared models. CatBoost achieved an RMSE of 4.09 and MAE of 2.72, substantially outperforming other algorithms and establishing it as the most reliable model for concrete strength prediction.
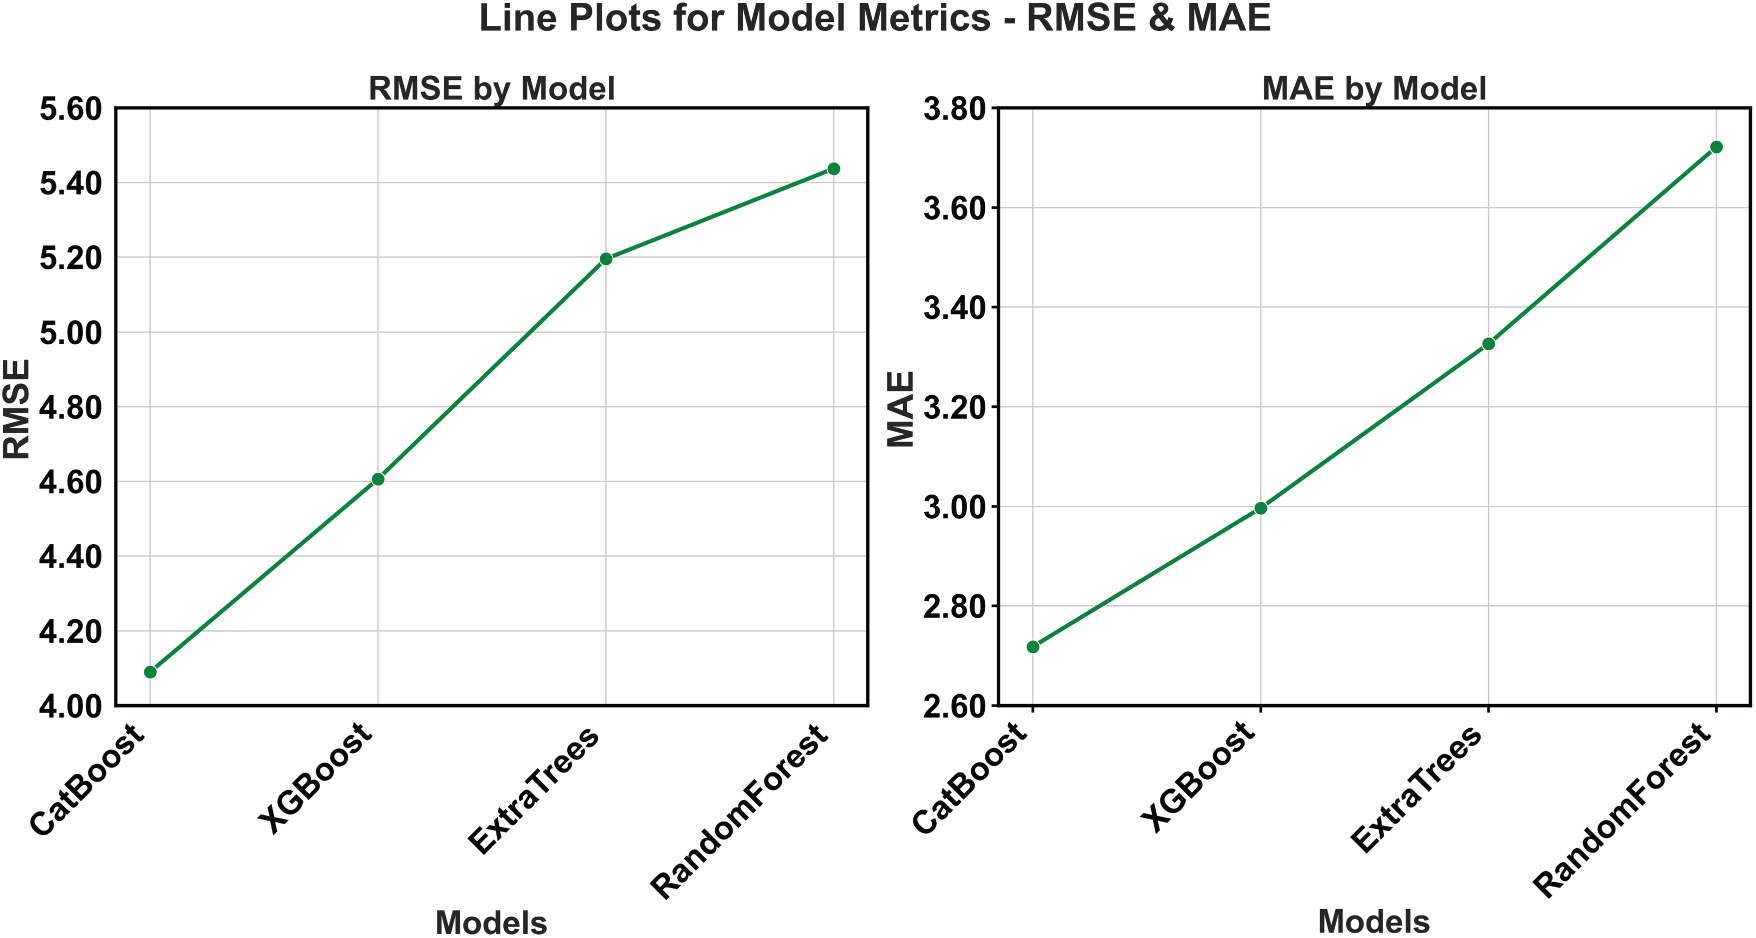
Figure 8: RMSE and MAE comparison across baseline machine learning models
Fig. 9 presents cumulative distribution functions (CDFs) for error metrics, revealing the concentration of prediction errors. The steep rise in all CDF curves indicates that the majority of predictions maintain low error values, with the MAE CDF reaching unity at relatively small error magnitudes, demonstrating consistent predictive accuracy.
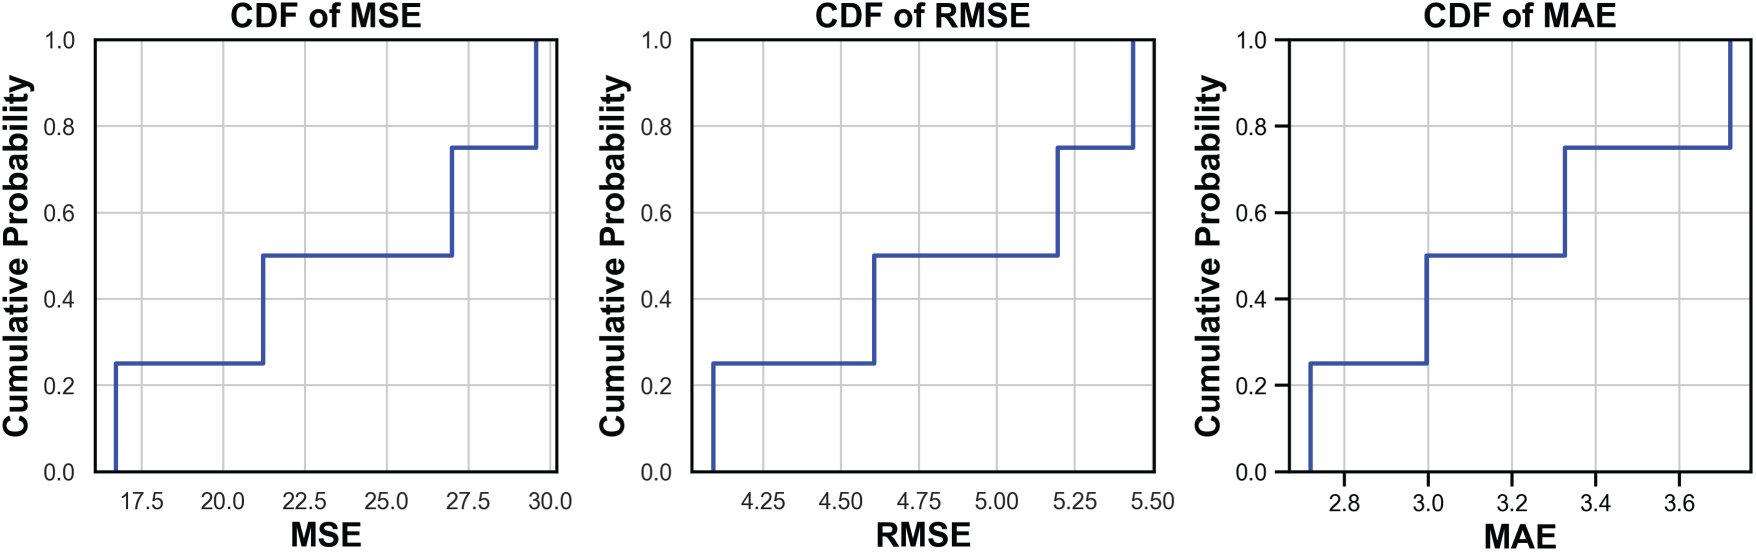
Figure 9: Cumulative distribution functions of error metrics for baseline models
The performance density distribution shown in Fig. 10 demonstrates that the baseline machine learning algorithms produce highly stable and consistent results. The sharp peak and narrow spread around the central value imply minimal variance in prediction quality, suggesting that the ensemble models (CatBoost, XGBoost, ExtraTrees, and RandomForest) are not only accurate but also dependable across repeated evaluations. The significant overlap among the distributions further highlights that these algorithms possess similar generalization capabilities, reinforcing their suitability for robust predictive modeling in the context of concrete strength estimation.
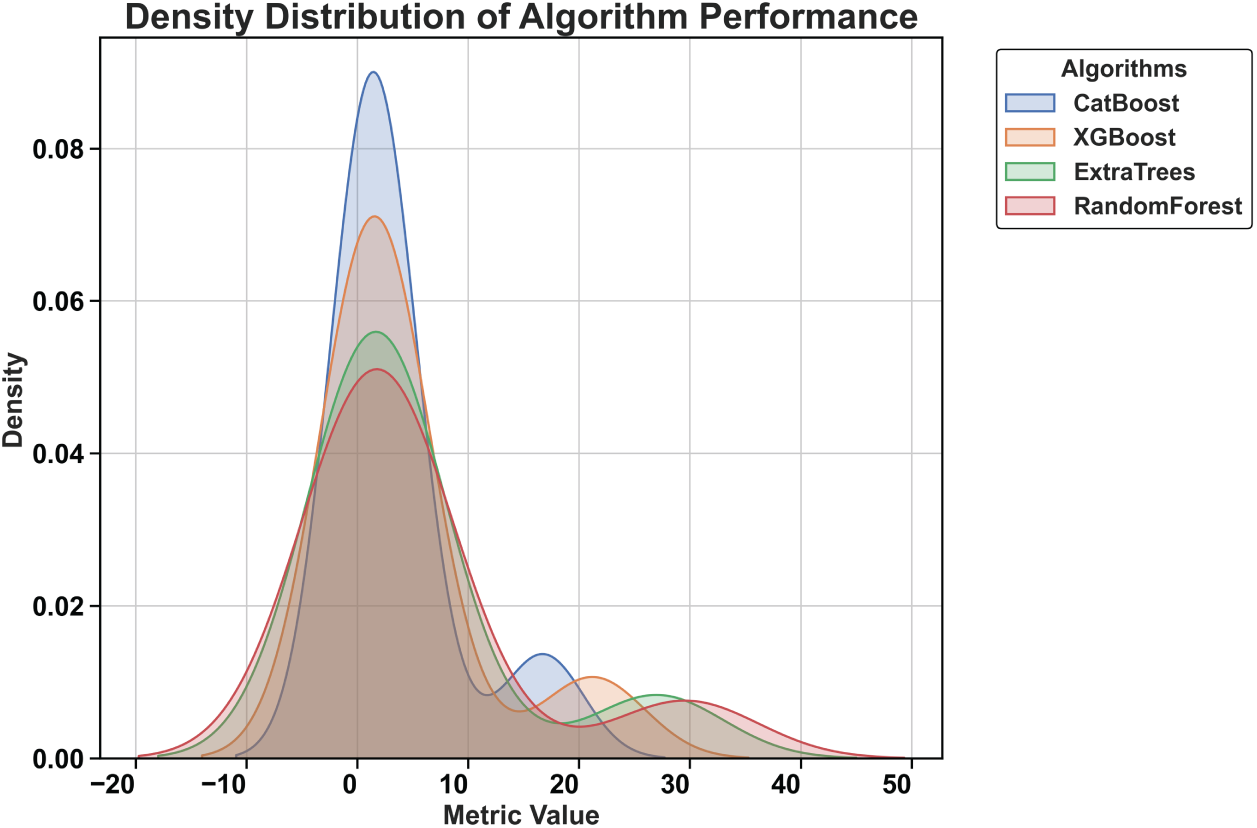
Figure 10: Performance density distribution of baseline machine learning algorithms
Fig. 11 provides a visual performance comparison through color-coded intensities, where lighter shades represent superior performance. CatBoost exhibits the lightest coloration across multiple metrics, particularly for MSE, confirming its optimal performance characteristics combined with efficient computational time.
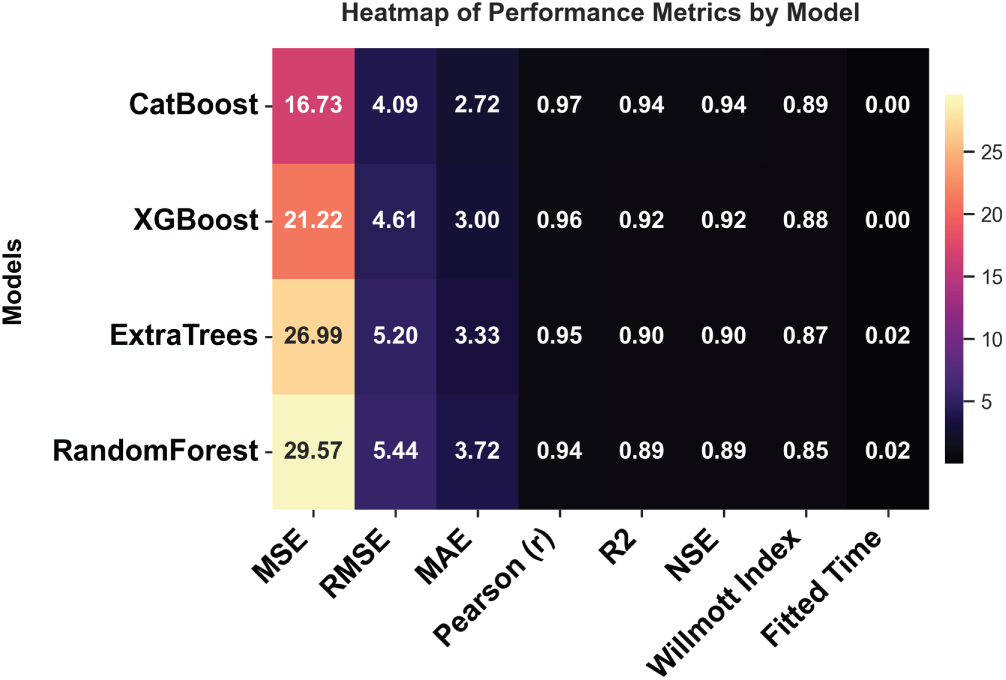
Figure 11: Performance heatmap of baseline machine learning models
As illustrated in Fig. 12, CatBoost consistently outperforms other baseline machine learning models across a diverse set of evaluation criteria. The model achieves near-optimal scores in
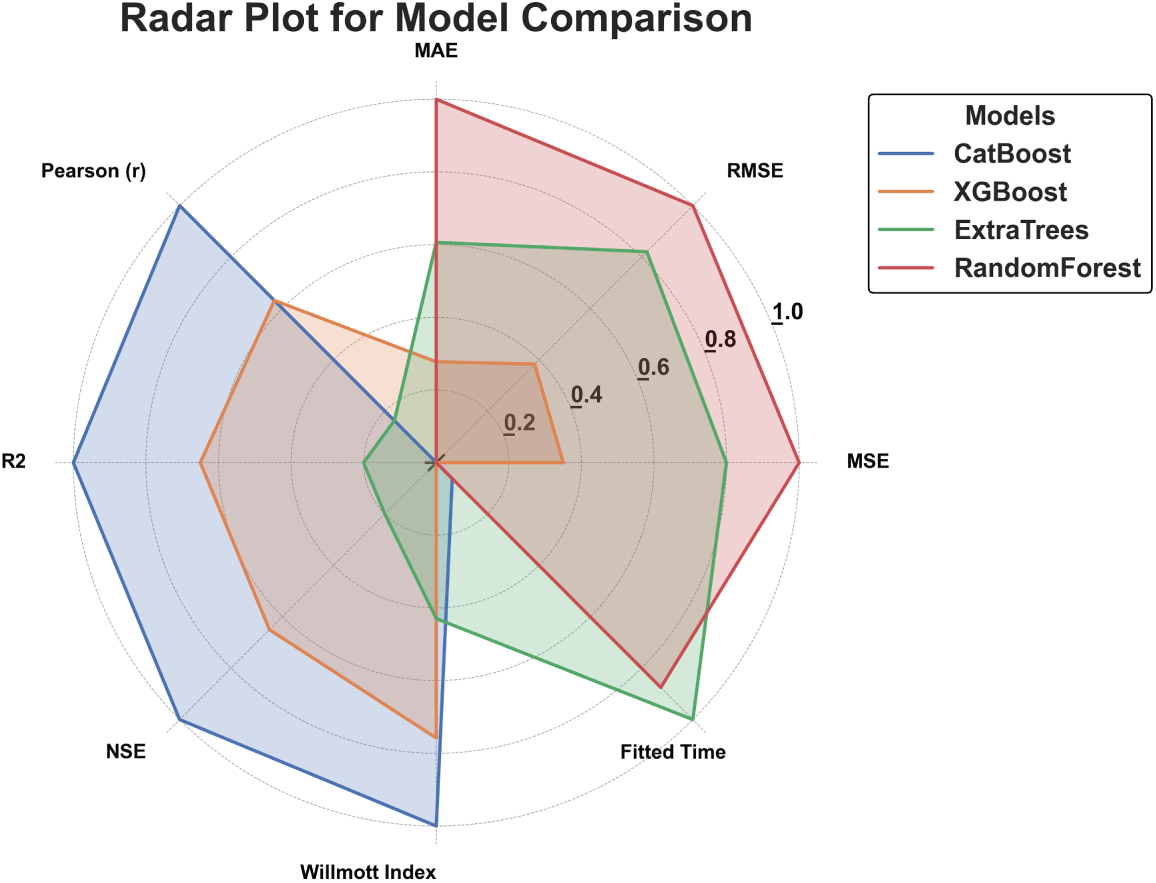
Figure 12: Multi-dimensional performance radar plot of baseline machine learning models
Fig. 13 illustrates the distribution patterns of key performance metrics across all models. The
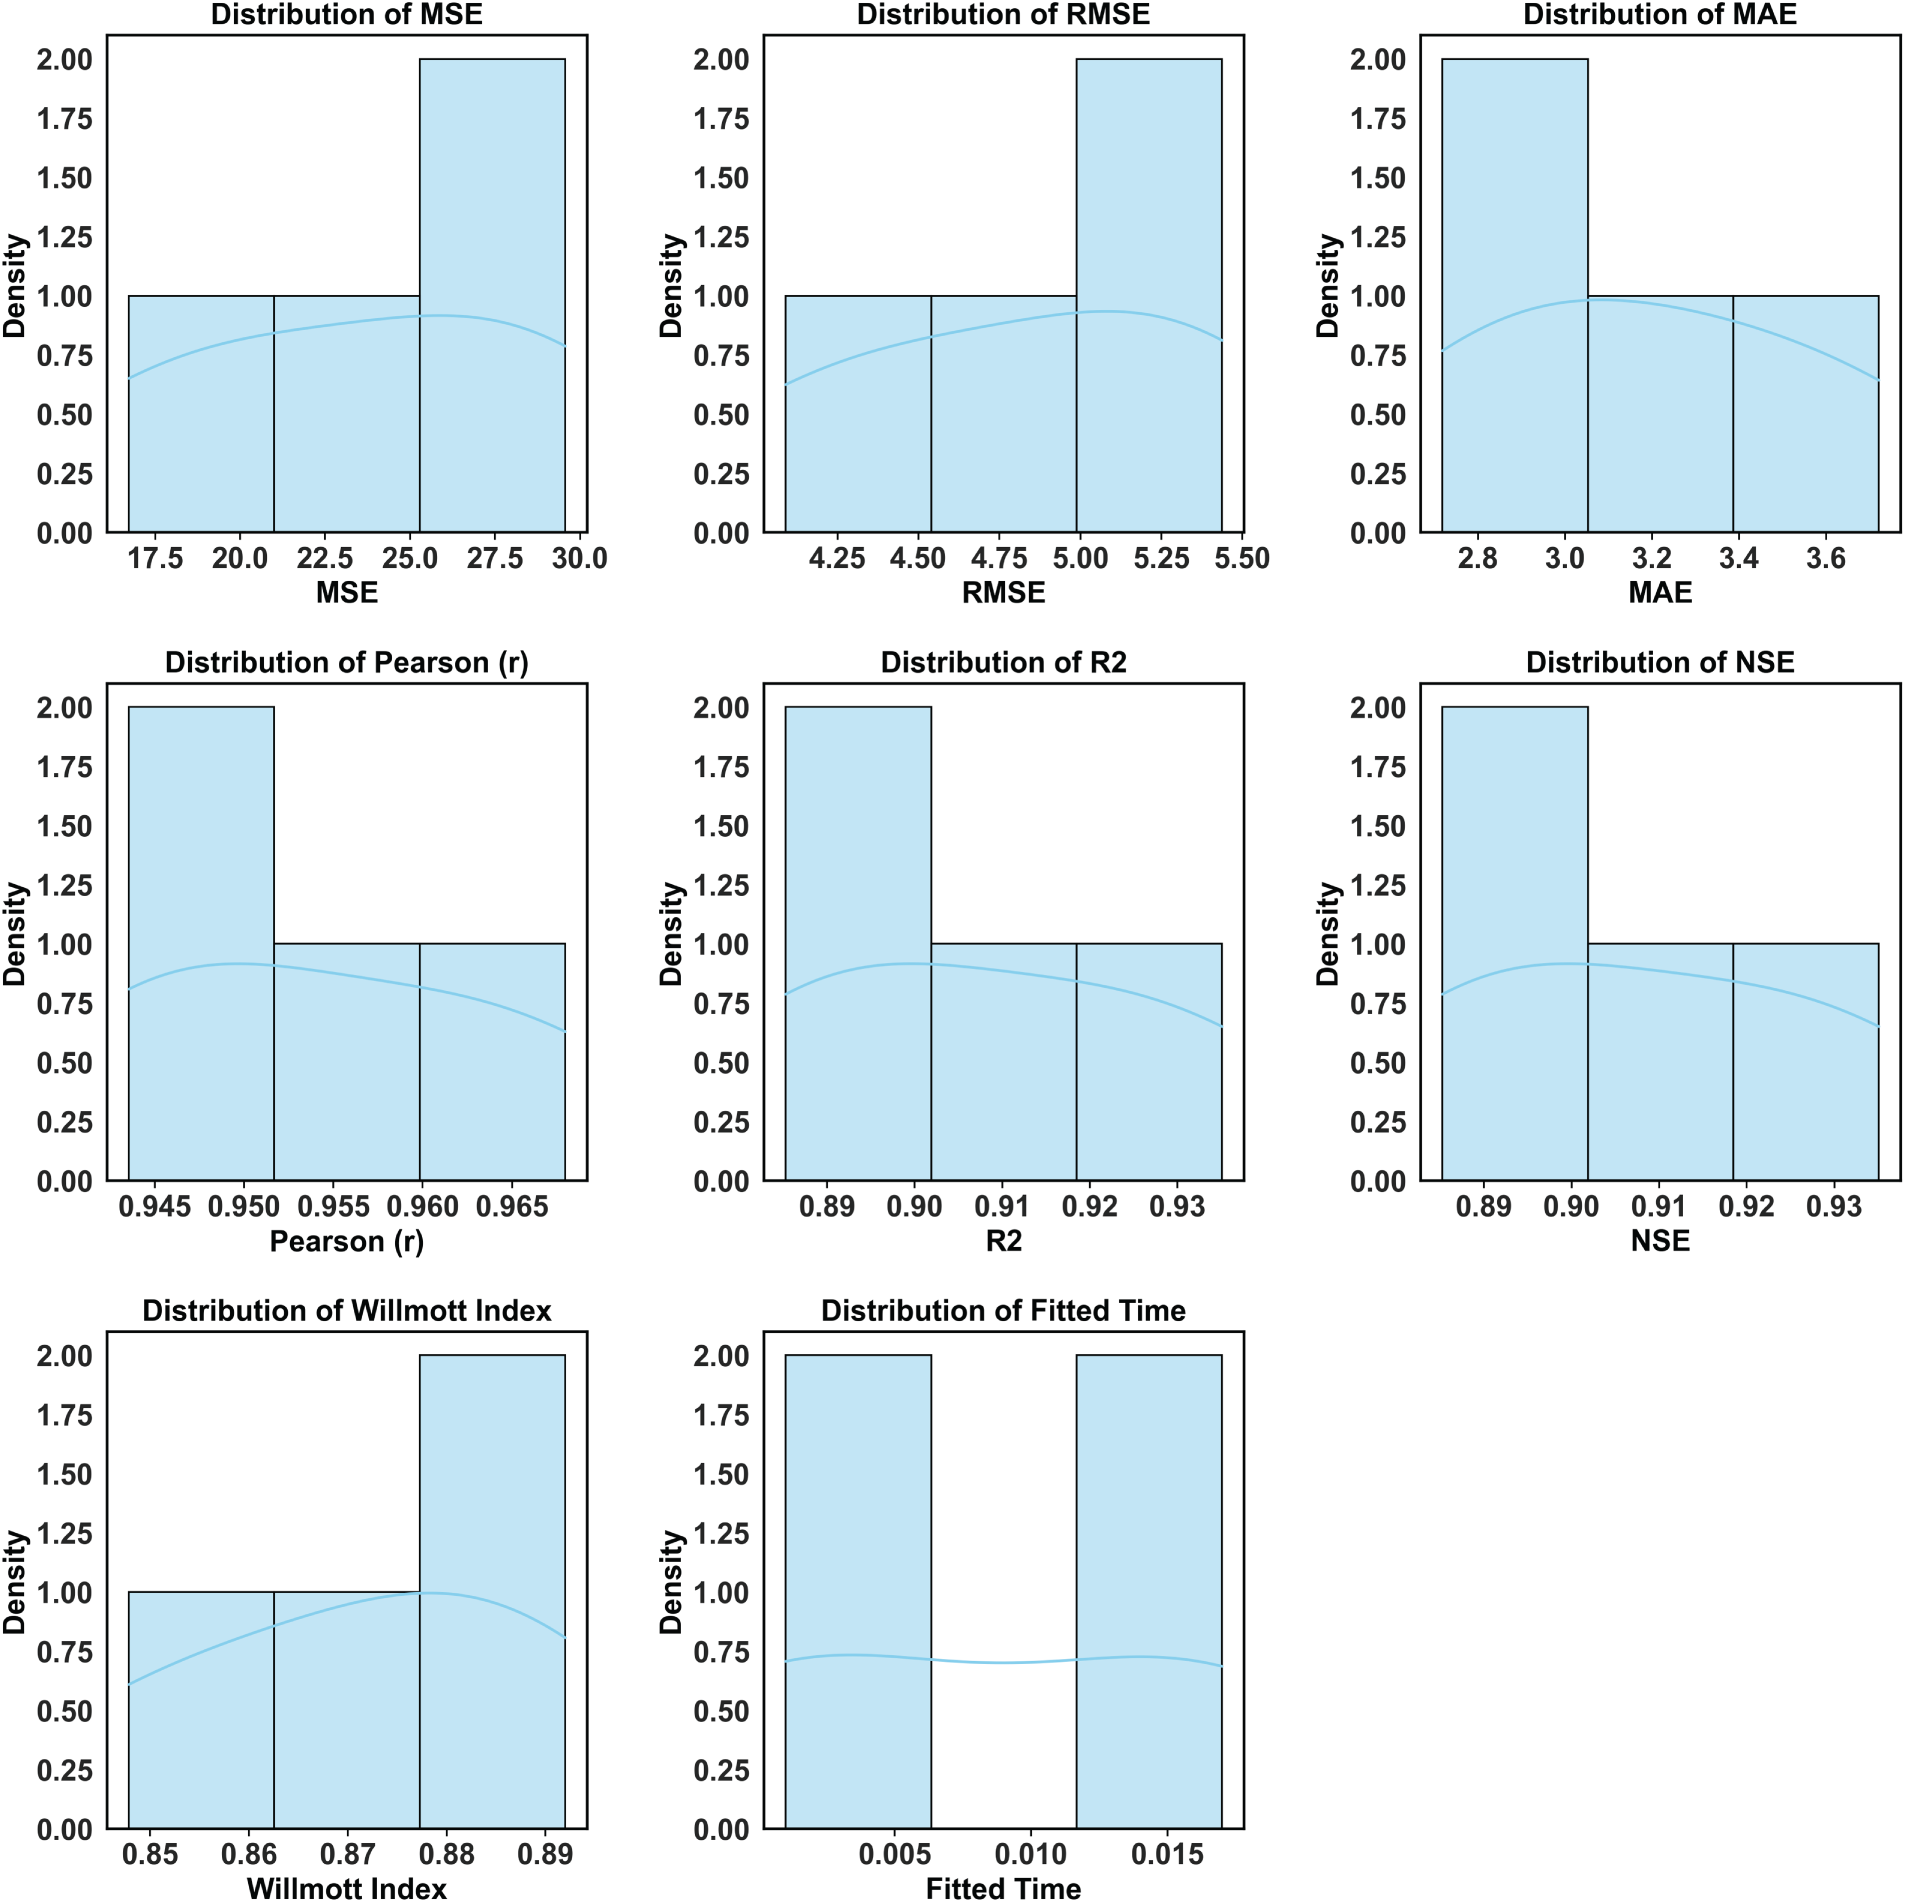
Figure 13: Distribution of performance metrics for baseline machine learning models
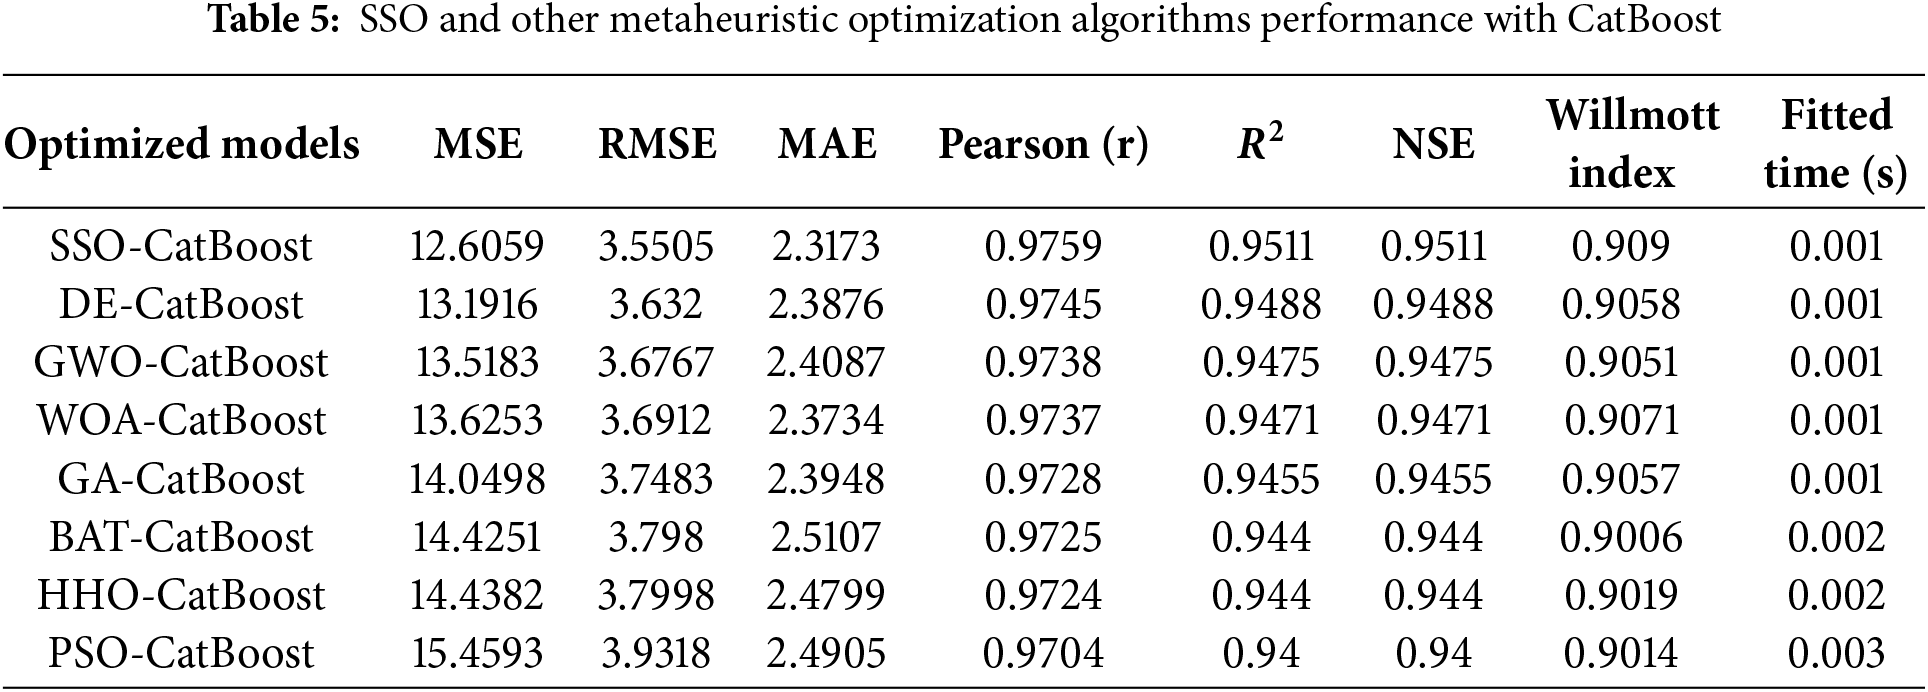
Table 5 demonstrates the effectiveness of metaheuristic optimization algorithms in enhancing CatBoost performance. The Somersaulting Spider Optimizer (SSO) achieved the best results when coupled with CatBoost, producing an MSE of 12.61, representing a 24.6% improvement over the baseline CatBoost model. SSO-CatBoost also attained the highest Pearson correlation (0.976) and
The performance comparison in Fig. 14 clearly establishes SSO-CatBoost as the superior approach, achieving the highest Pearson correlation coefficient (0.976) and
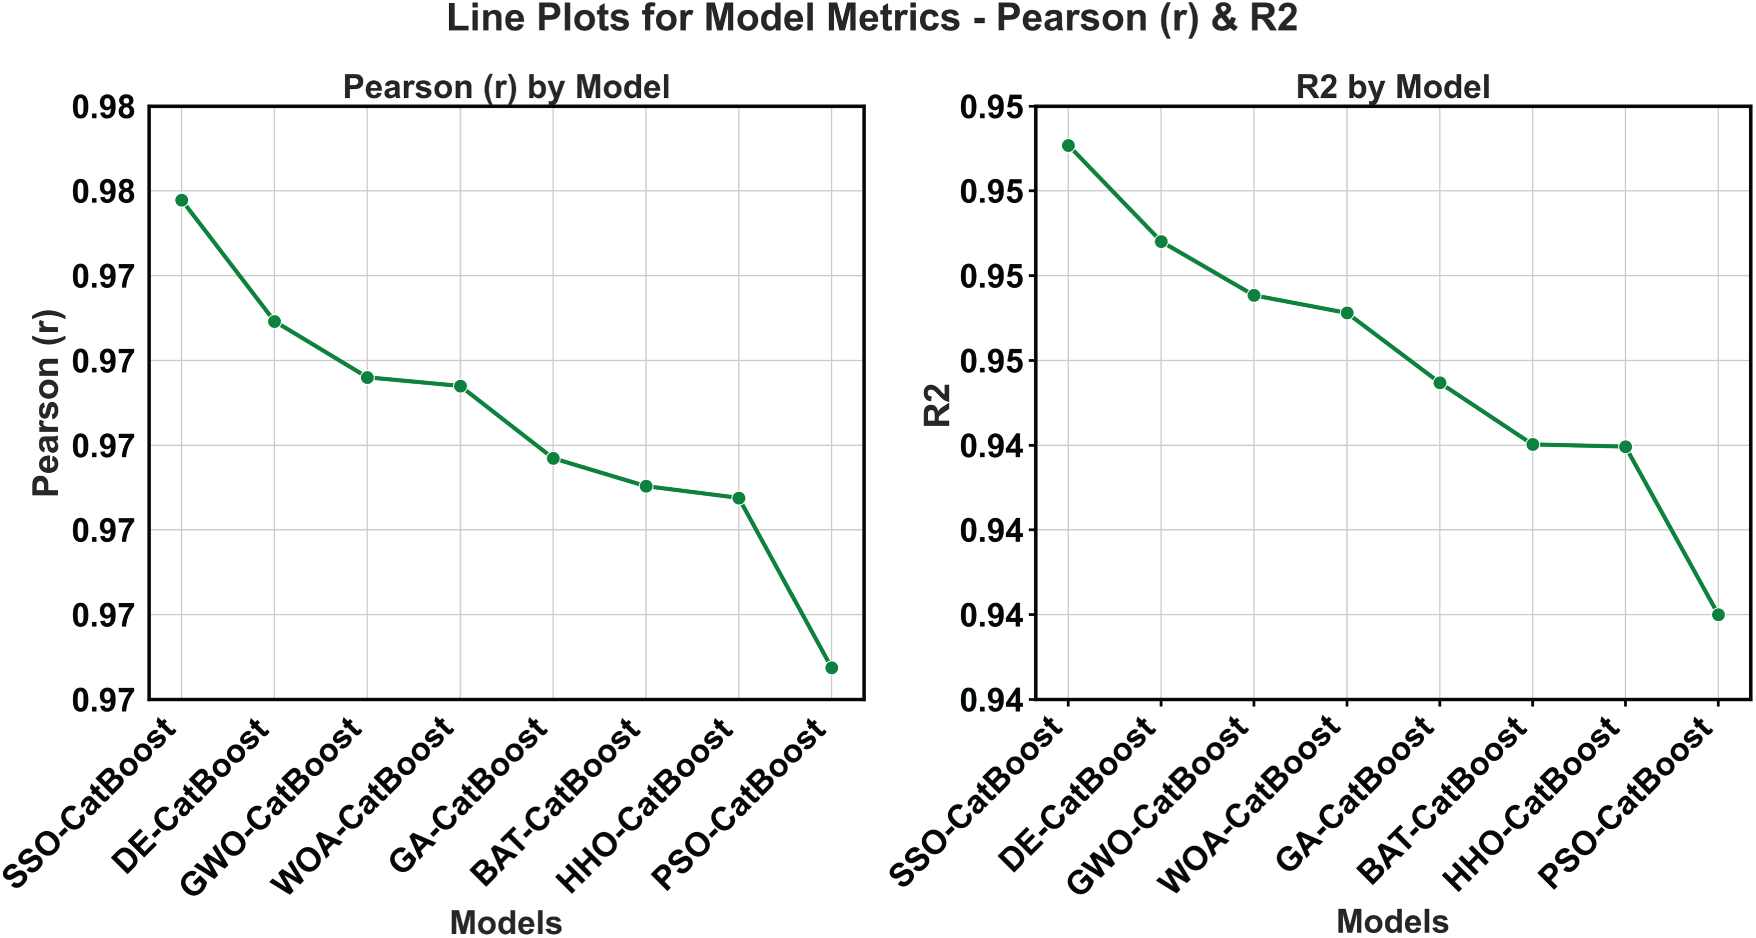
Figure 14: Pearson correlation and
Fig. 15 presents the error distribution characteristics for optimized models. The rapid rise of CDF curves indicates concentrated low-error predictions, with MSE, RMSE, and MAE reaching cumulative probabilities of unity at relatively small values, confirming the optimization algorithms’ effectiveness in reducing prediction errors.
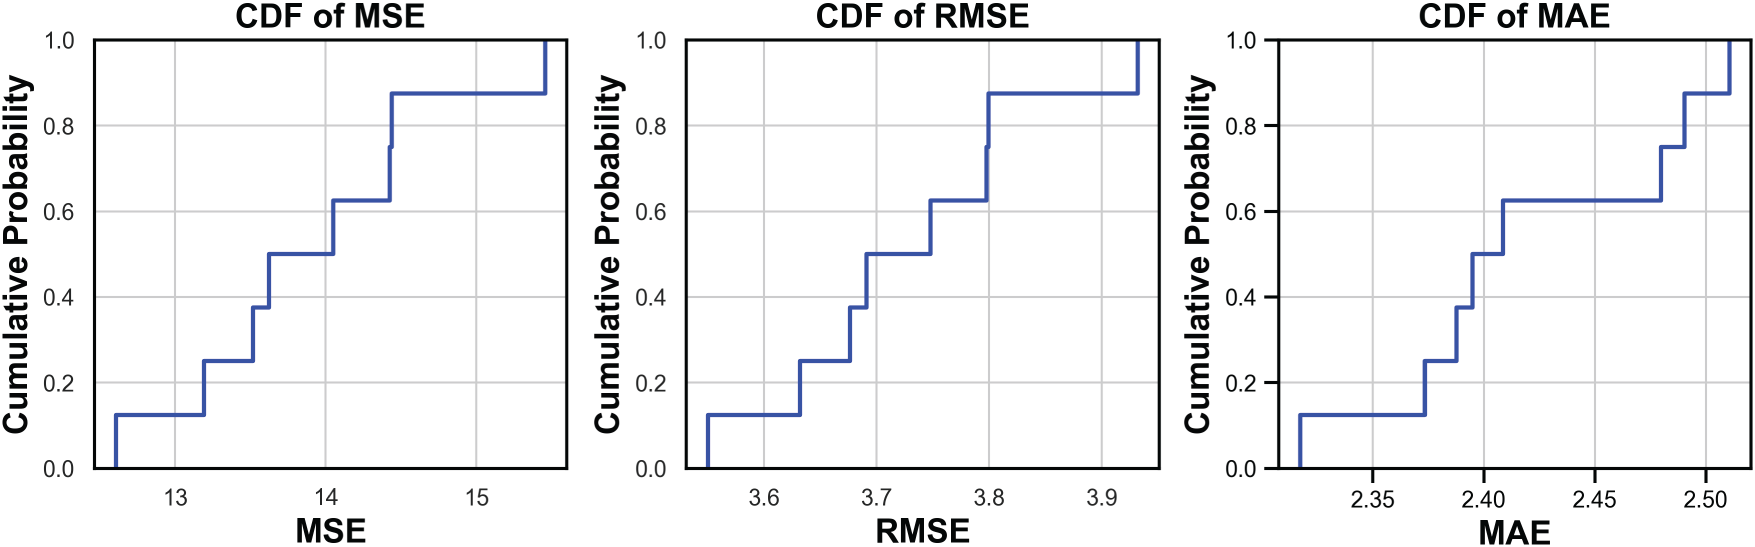
Figure 15: Cumulative distribution functions of error metrics for optimized models
The density distribution analysis in Fig. 16 reveals SSO-CatBoost’s performance concentration, with peak density occurring around 12 and a distribution span extending to 30. This pattern indicates consistent performance clustering around optimal values while maintaining exploration capabilities across the performance landscape.
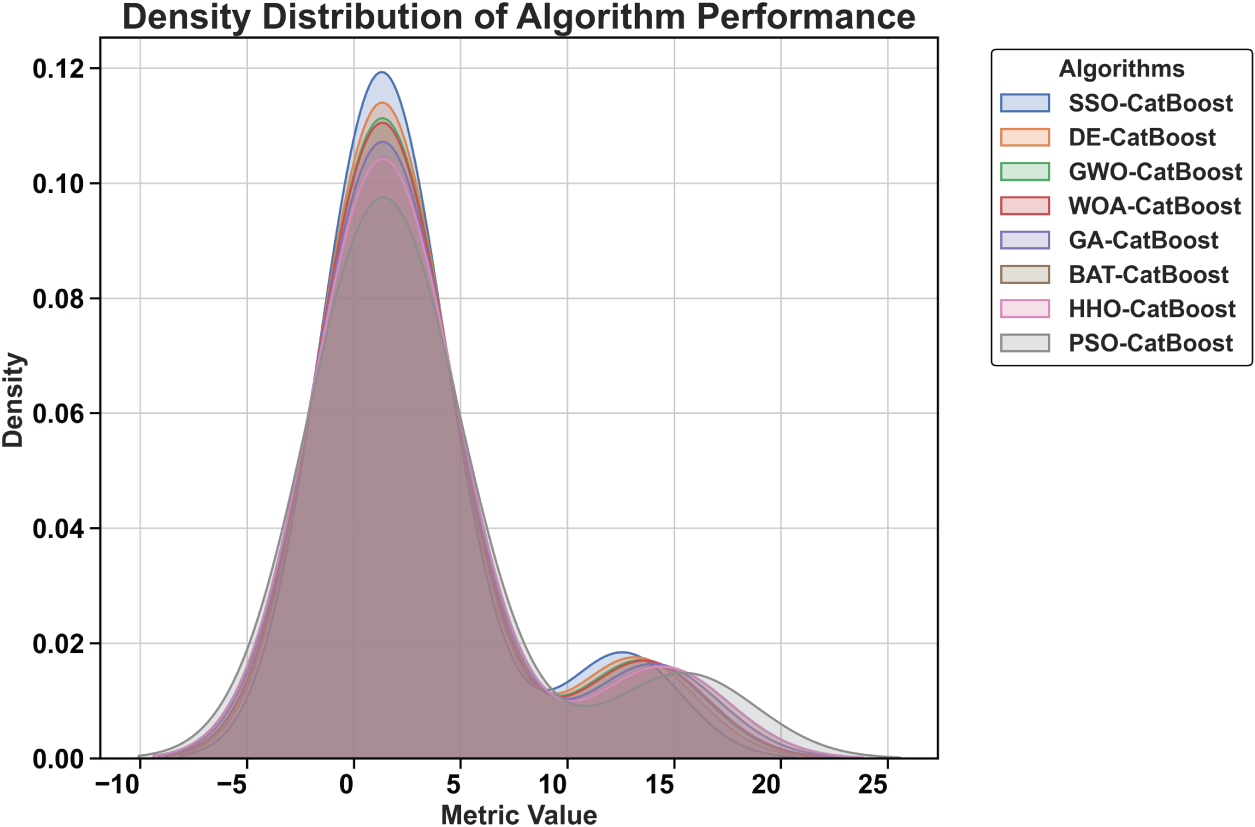
Figure 16: SSO-CatBoost performance density distribution analysis
Fig. 17 visualizes the comparative advantage of SSO-CatBoost through color intensity mapping. SSO-CatBoost exhibits the lightest coloration for error metrics (MSE, RMSE, MAE) while maintaining optimal performance in correlation and efficiency metrics, clearly distinguishing it from other optimization approaches.
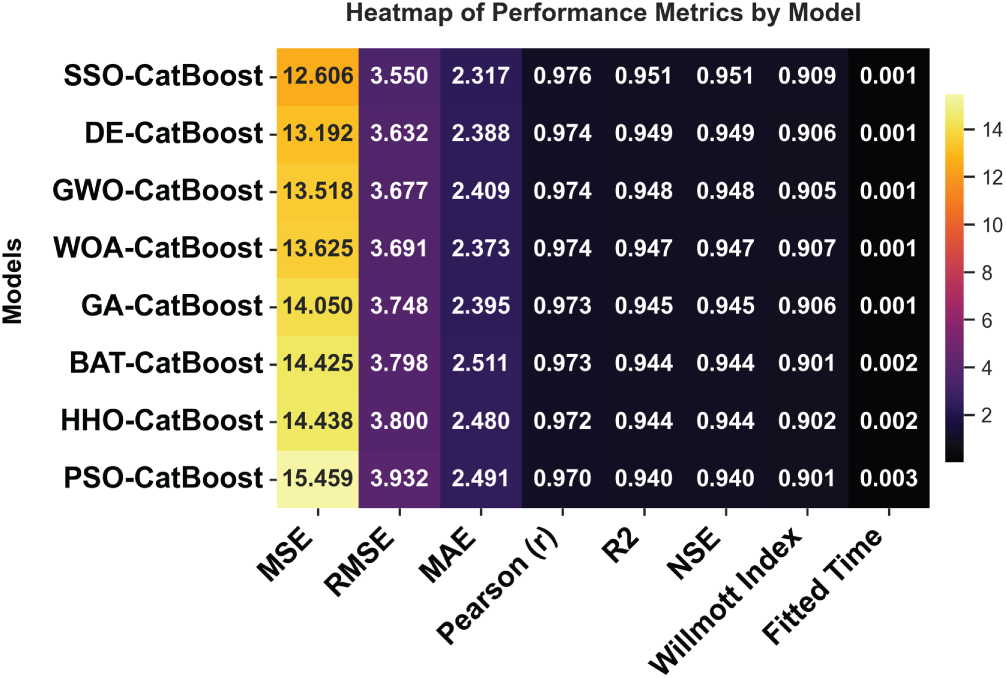
Figure 17: Performance heatmap comparison of SSO-CatBoost and other optimized models
The radar plot comparison in Fig. 18 provides a multi-dimensional performance perspective across all optimization algorithms. Each algorithm demonstrates distinct strengths and trade-offs, with SSO-CatBoost achieving the most balanced profile across all evaluation criteria, effectively combining low error rates with high correlation metrics and computational efficiency.
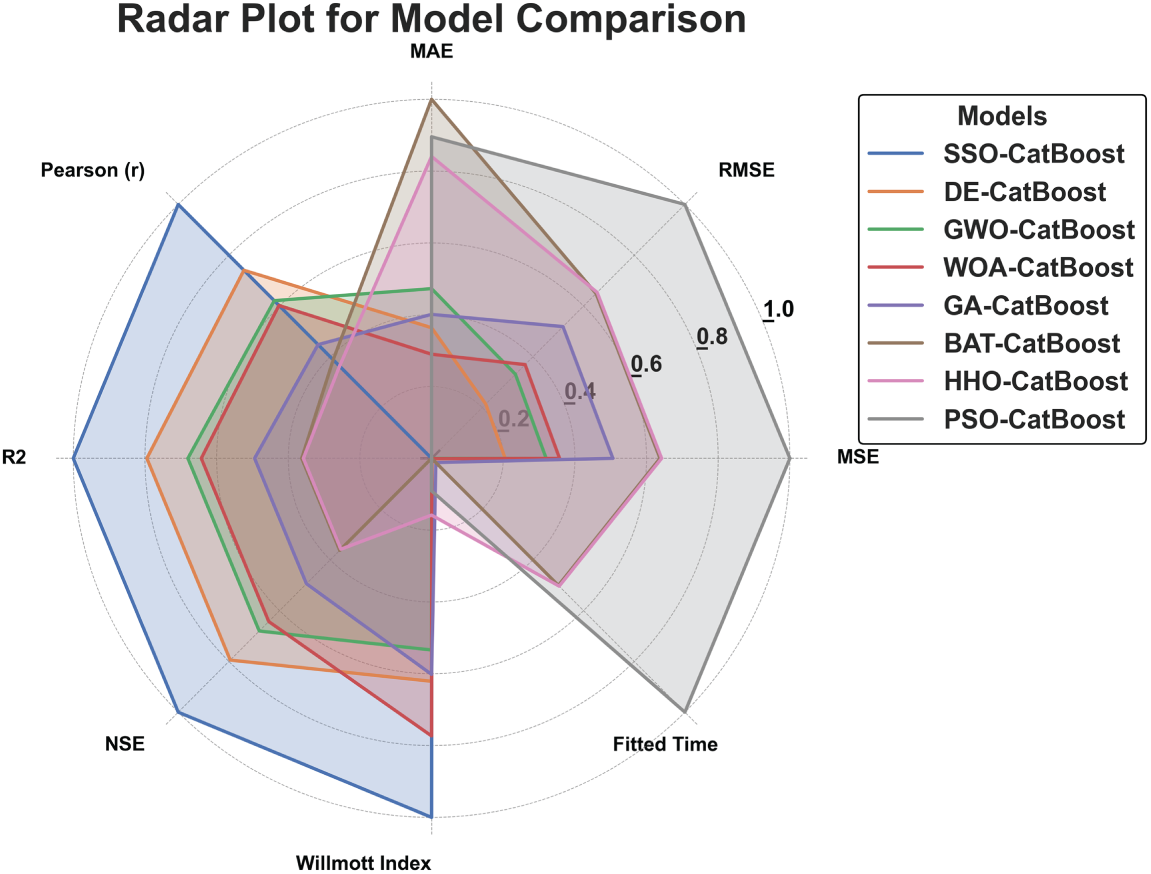
Figure 18: Multi-dimensional radar plot analysis of optimization algorithms with CatBoost
Fig. 19 shows the enhanced performance distributions achieved through optimization. The metrics exhibit right-skewed distributions toward higher values, with
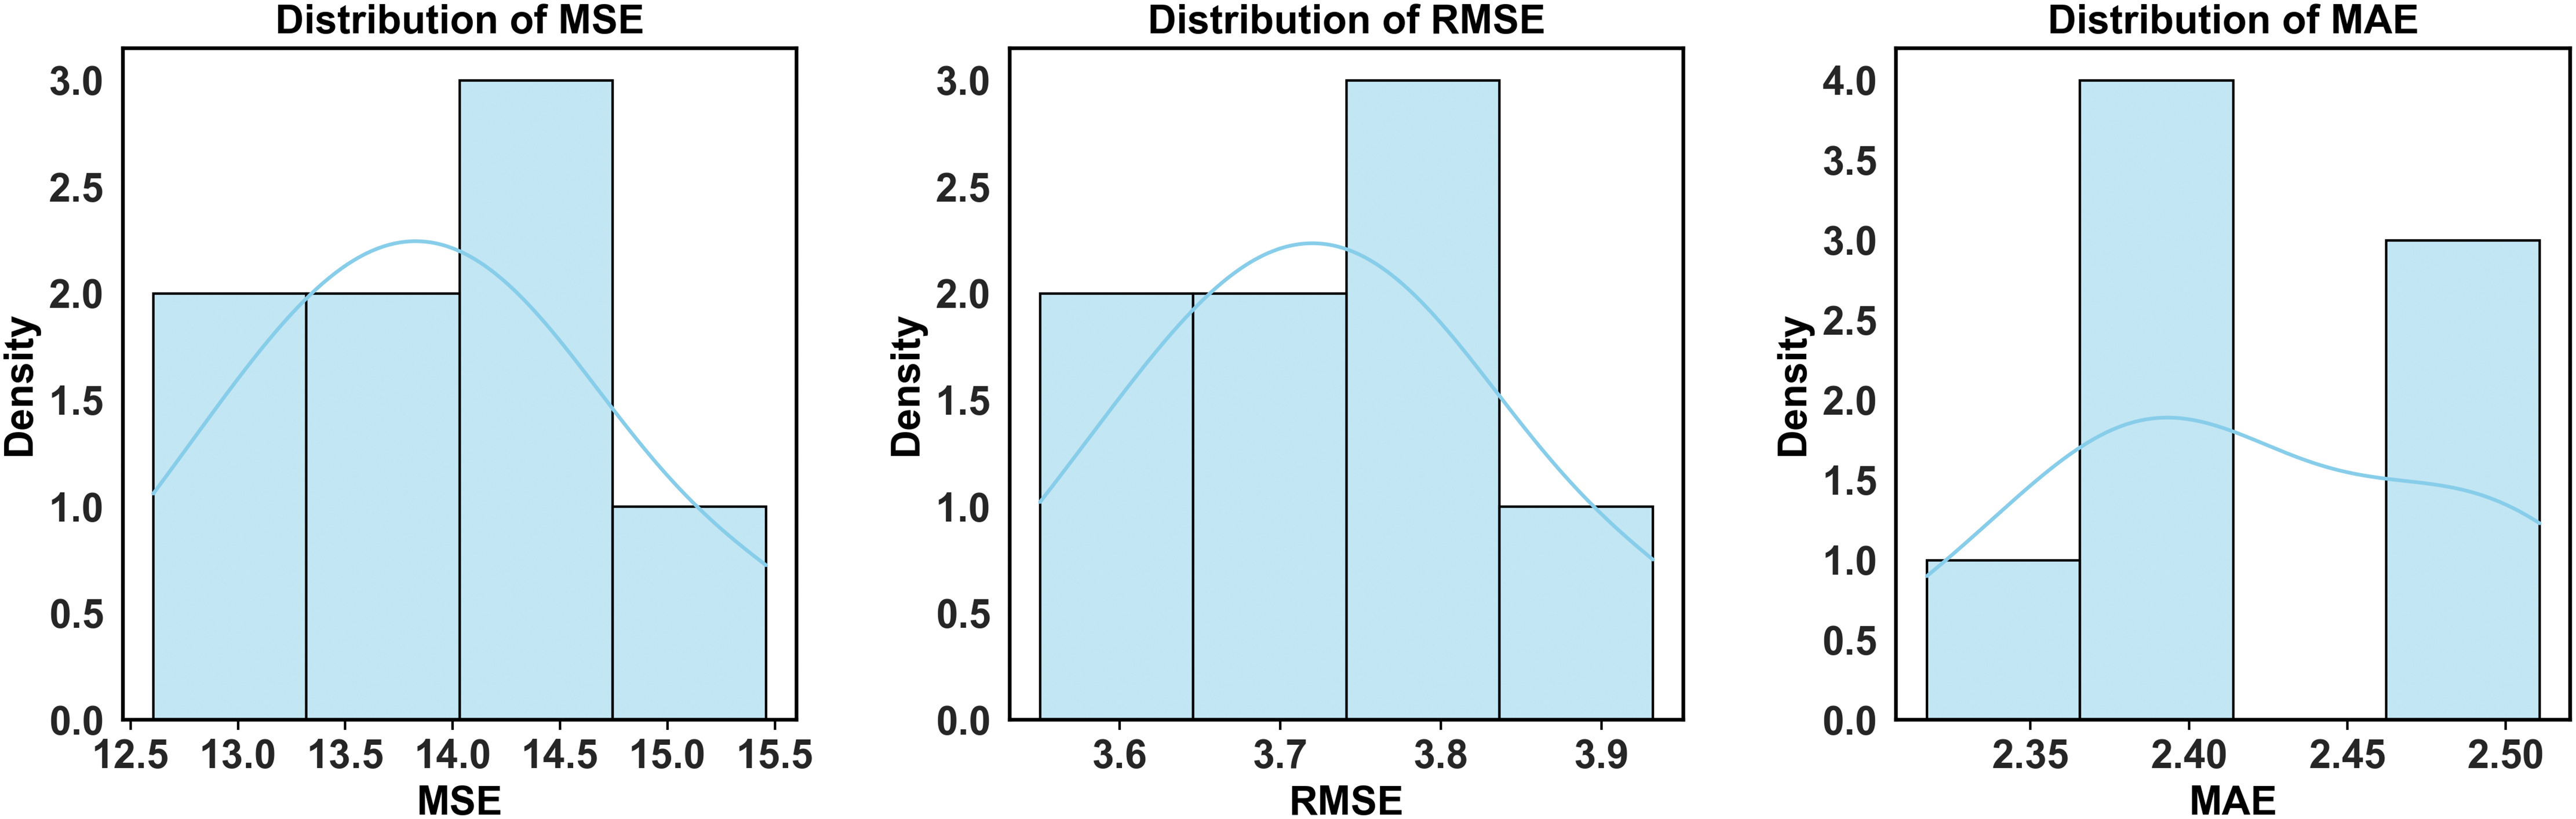
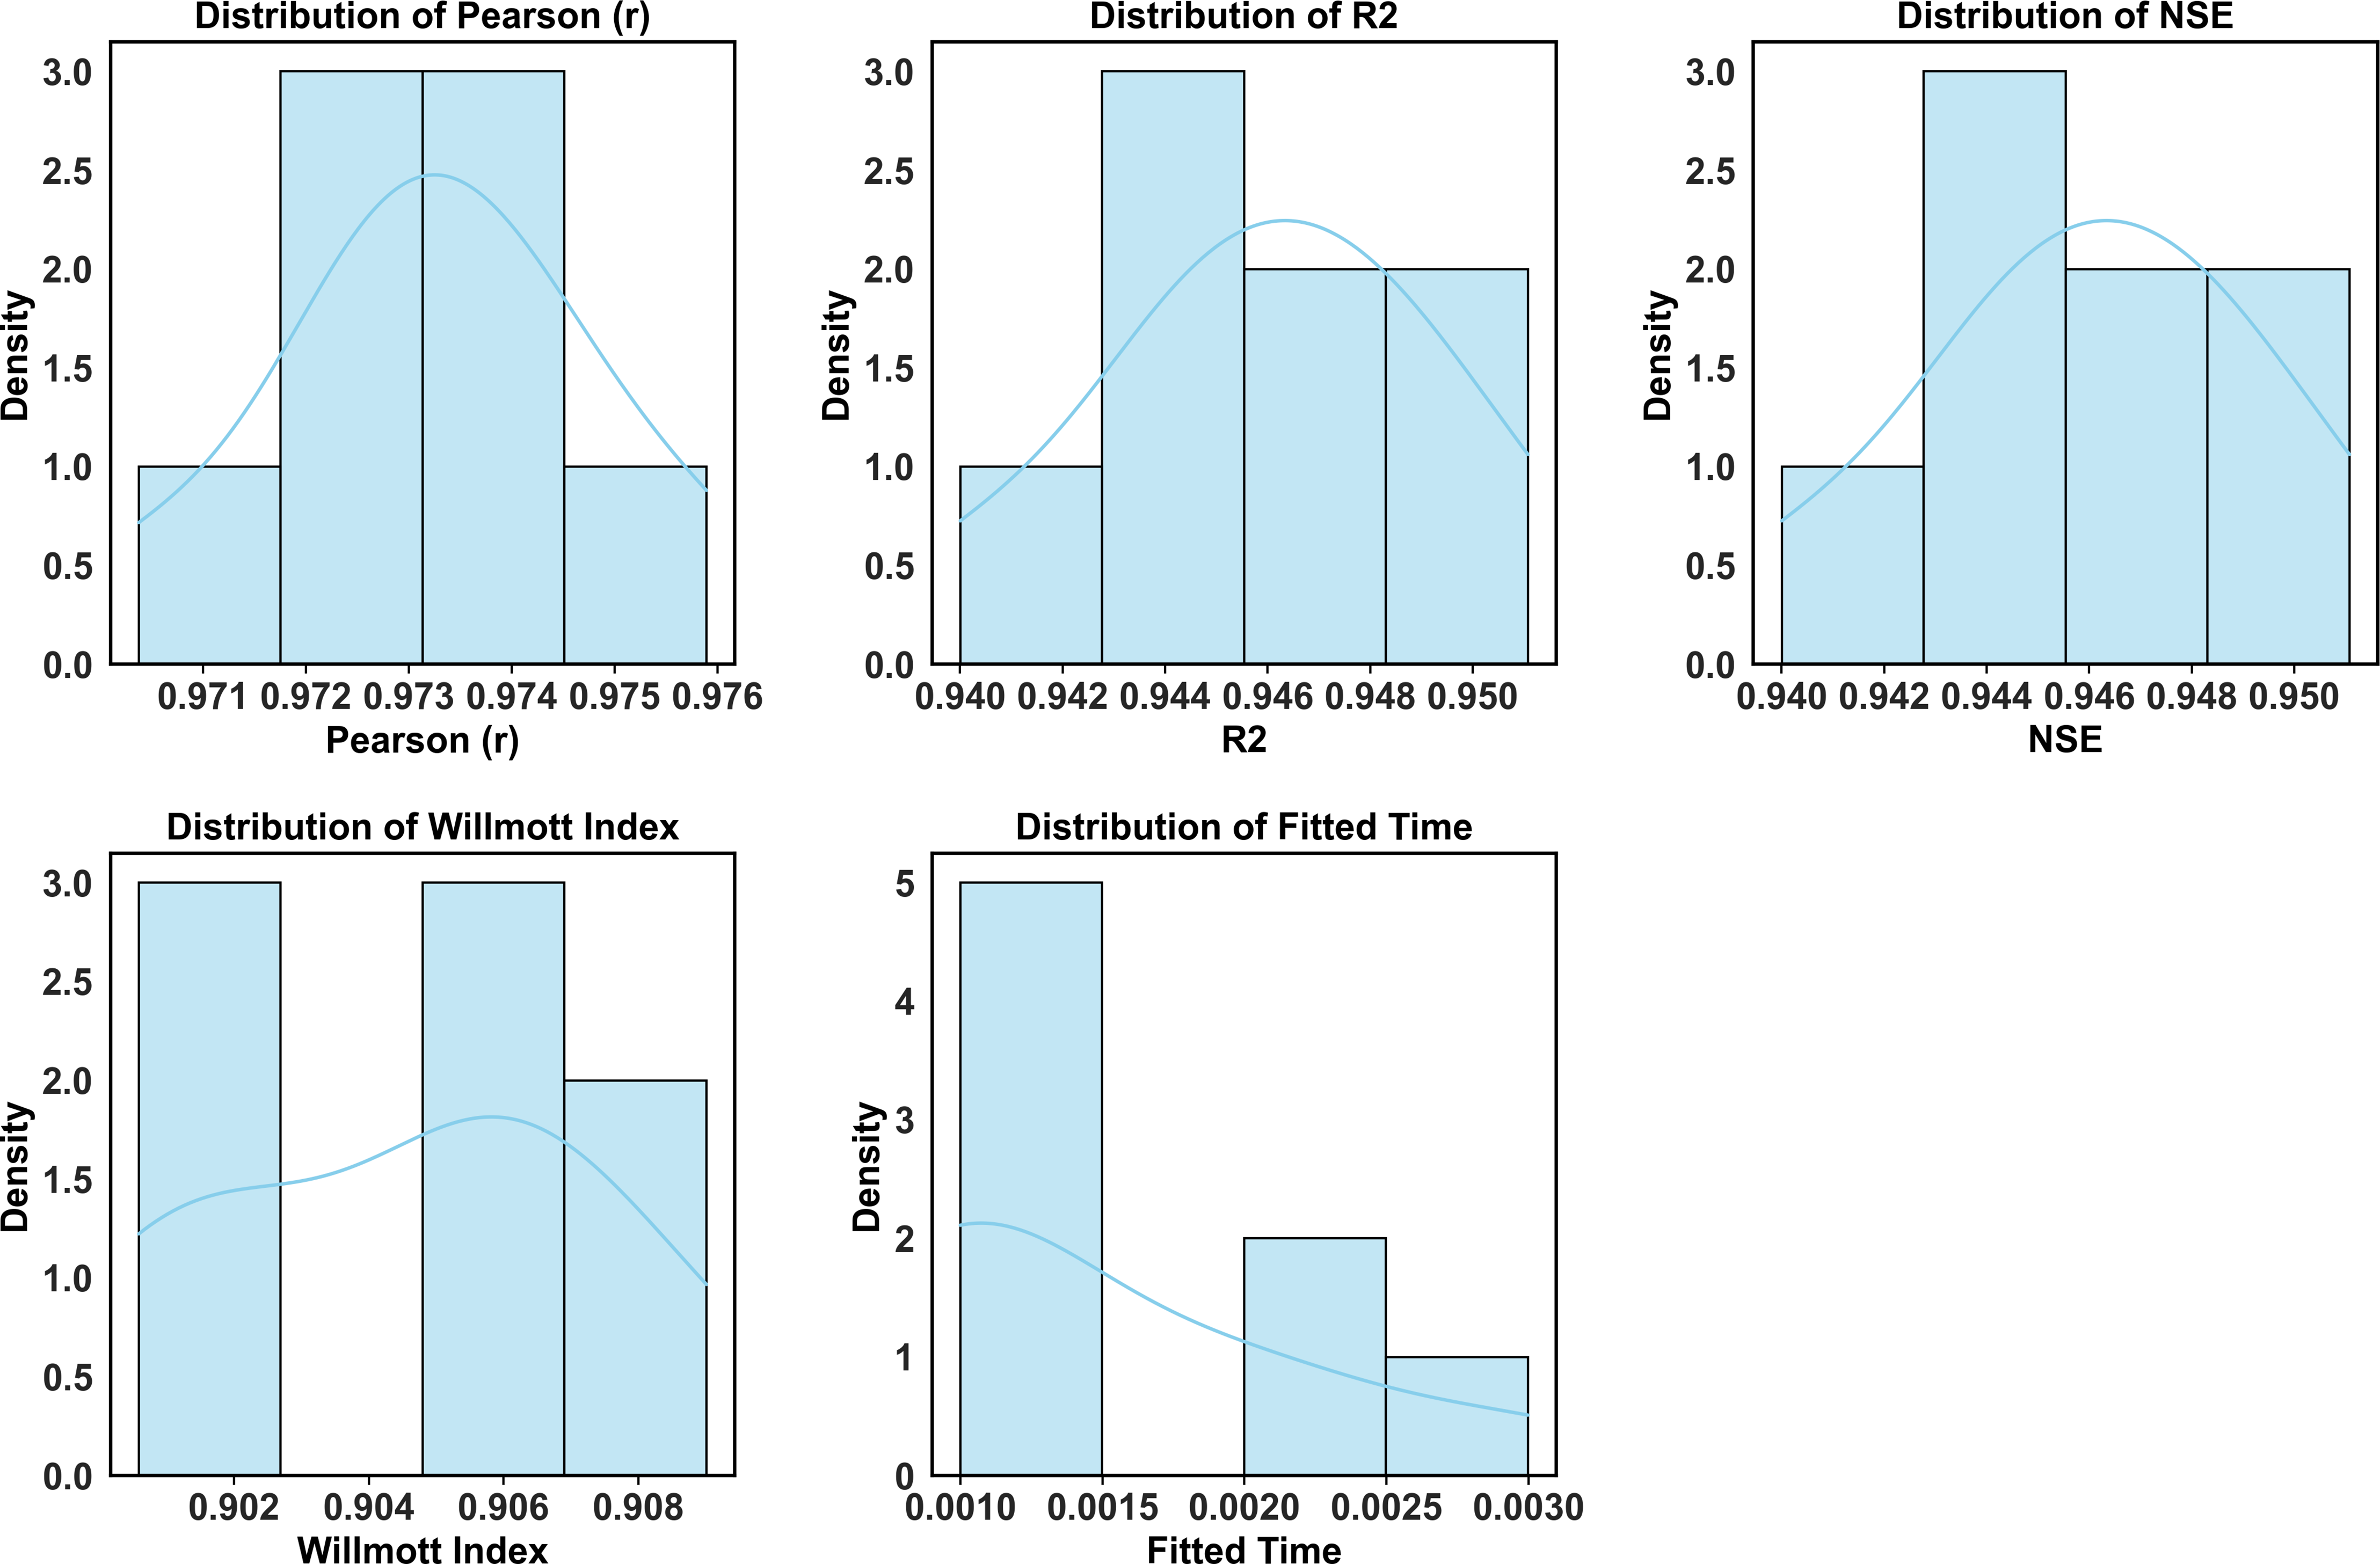
Figure 19: Performance metrics distribution for SSO and other optimized CatBoost models
Table 6 presents the Analysis of Variance (ANOVA) results, examining the statistical significance of performance differences between models. The between-groups analysis yielded an F-statistic of 7.17 with degrees of freedom (7, 439) and a p-value < 0.0001, indicating statistically significant differences among the compared algorithms. The sum of squares decomposition shows between-groups variance of 0.299 compared to within-groups variance of 2.617, confirming meaningful performance distinctions between optimization approaches.
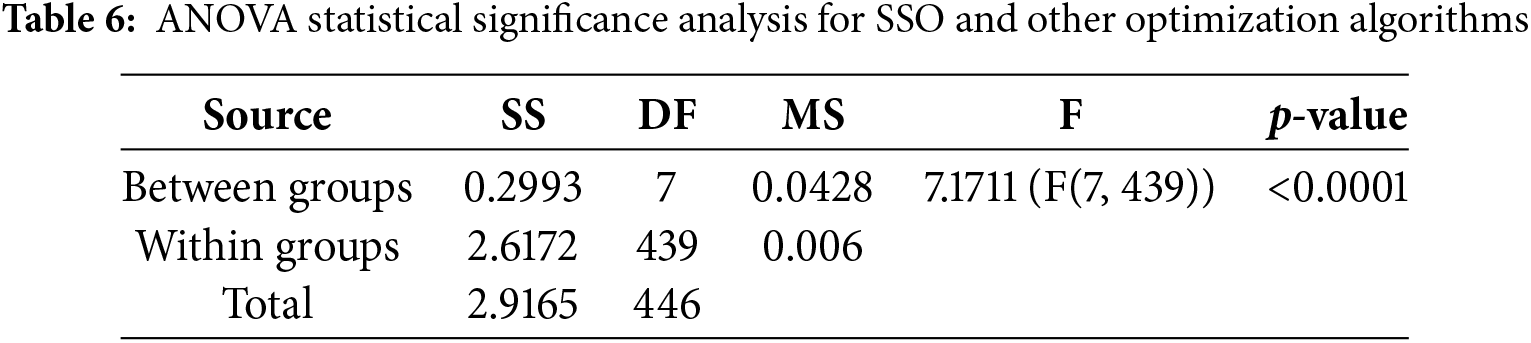
Fig. 20 presents the ANOVA analysis on a logarithmic scale, highlighting the contribution of different variance sources. The total sum of squares reaches
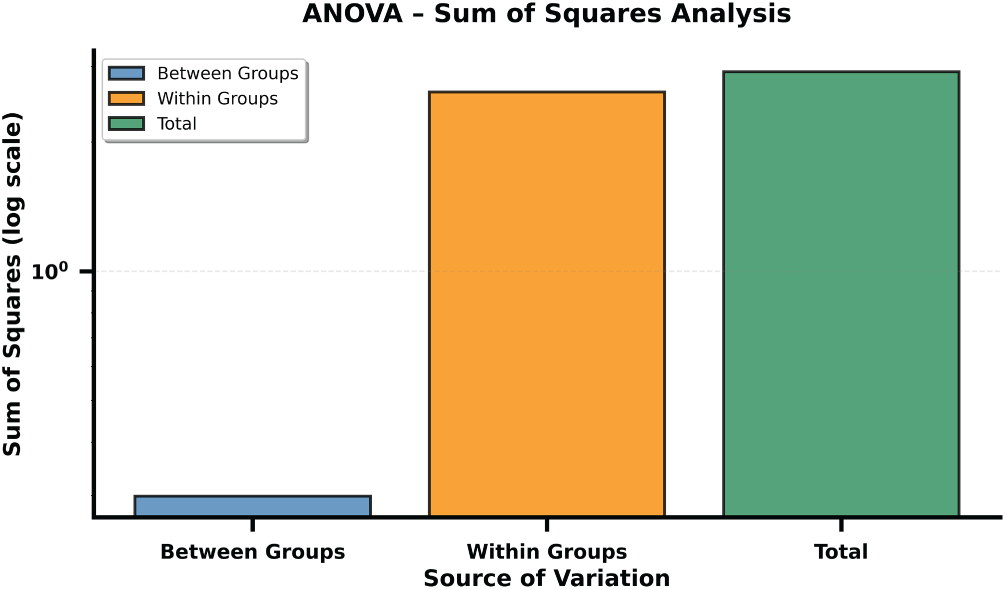
Figure 20: ANOVA variance decomposition analysis on logarithmic scale
Table 7 summarizes the Wilcoxon signed-rank test results, confirming the statistical significance of each optimization algorithm’s performance. SSO-CatBoost achieved the highest actual median (0.945) with a median difference of 0.945 from the theoretical median of zero. All algorithms demonstrated statistical significance (p < 0.001) at
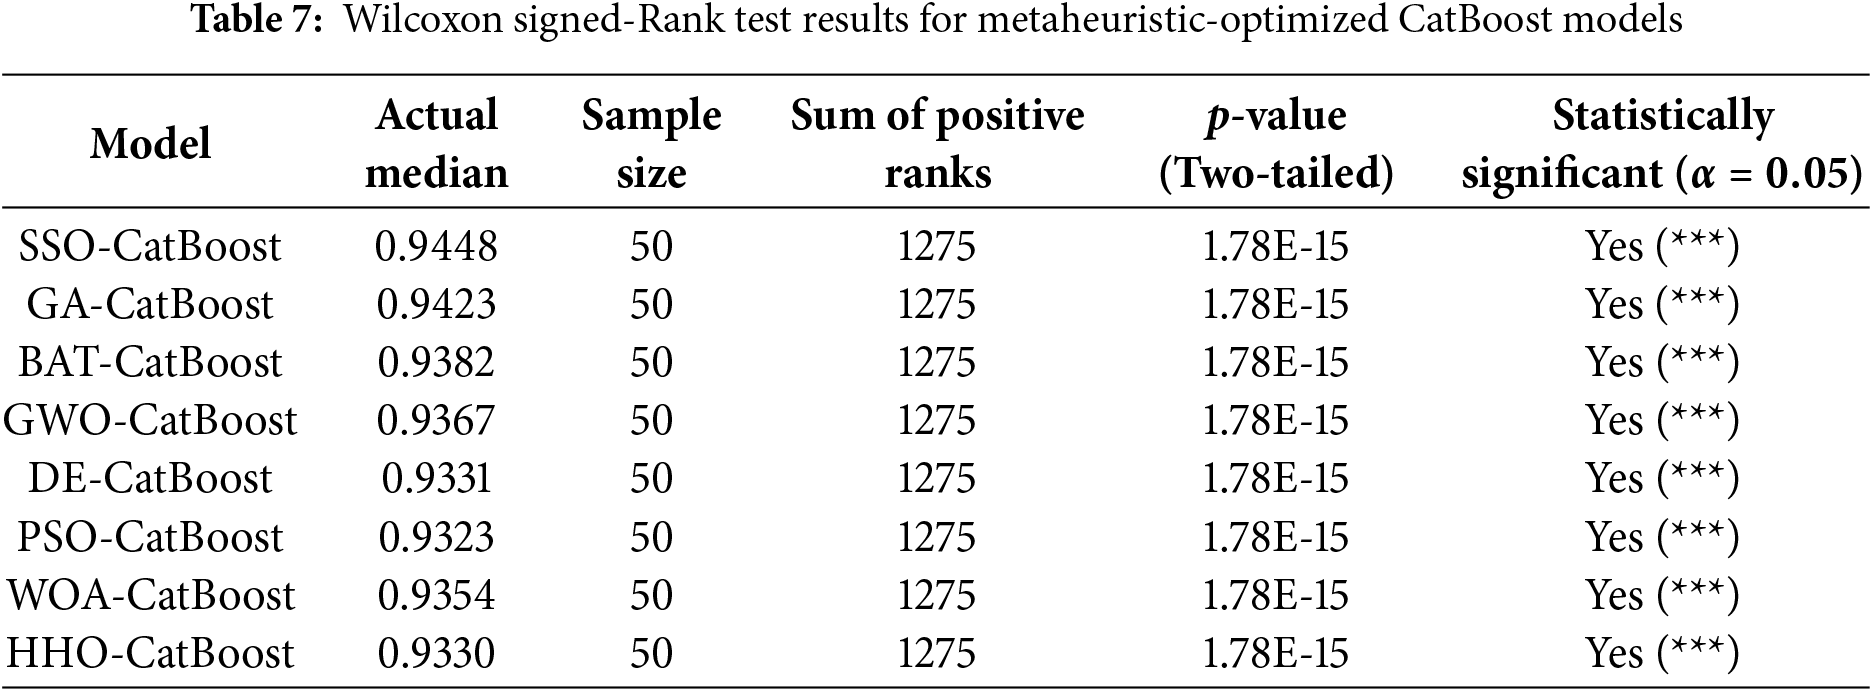
Fig. 21 illustrates the
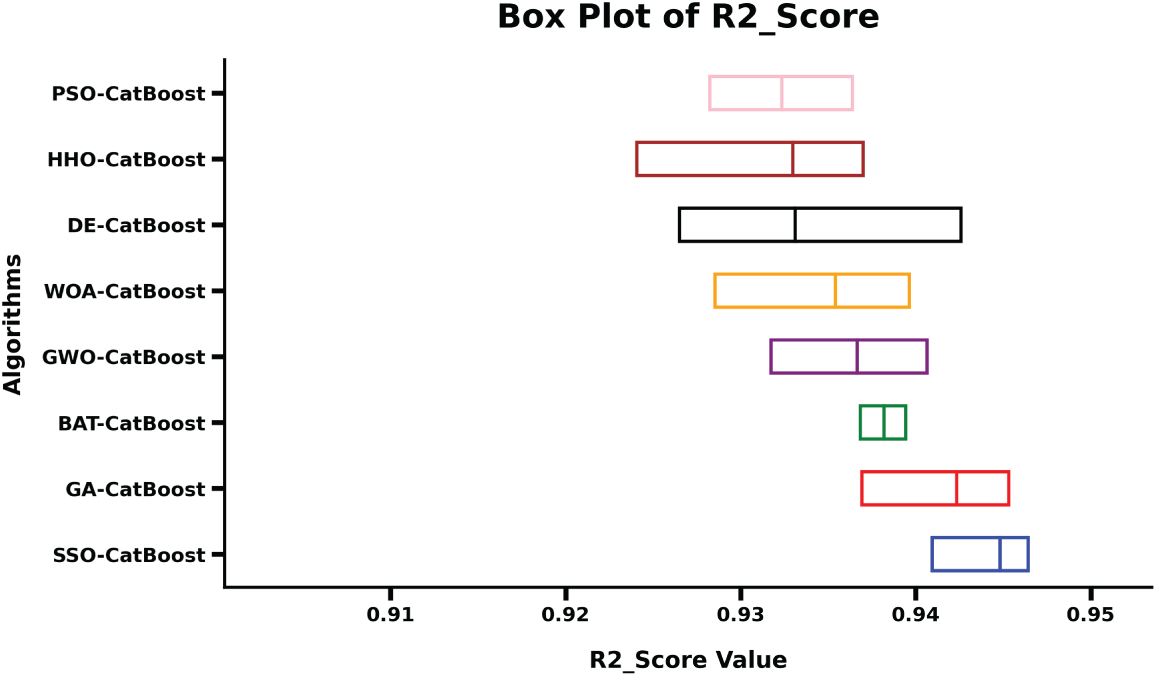
Figure 21:
The statistical analysis reveals the strength and dependability of the offered optimization model. The results of the ANOVA have shown very significant differences between the optimization algorithms tested, having an F-test with an F-statistic of 7.17 and a p-value less than
This study demonstrates the effectiveness of integrating the Somersaulting Spider Optimizer (SSO) with the CatBoost machine learning algorithm for predicting concrete compressive strength. The proposed hybrid framework effectively balances exploration and exploitation within the hyperparameter space, enabling the identification of optimal parameter combinations that substantially enhance predictive performance. The adaptive energy management mechanism embedded in the SSO algorithm facilitates dynamic search behavior, effectively avoiding premature convergence to local minima—a common limitation of traditional optimization approaches. Combined with CatBoost’s capabilities for handling categorical and numerical features through ordered boosting and symmetric decision tree structures, the model successfully captures complex nonlinear relationships among concrete mix proportions, curing age, and compressive strength. As shown in Table 5, the SSO-CatBoost model achieved the lowest mean squared error of 12.61 and the highest coefficient of determination (R2) of 0.951 among all optimized models, representing a 24.6% improvement over the baseline CatBoost model presented in Table 4. This performance improvement is further illustrated in Fig. 17, which visualizes the comparative advantage through color intensity mapping where SSO-CatBoost exhibits the lightest coloration for error metrics. The enhanced prediction accuracy enables more refined concrete mixture designs that minimize material consumption while maximizing structural reliability, potentially leading to significant cost reductions in large-scale concrete production.
Feature importance analysis, as presented in Fig. 7, indicates that cement content and concrete age exert the strongest influence on compressive strength prediction, consistent with established knowledge regarding cement hydration kinetics and strength development mechanisms. Secondary yet significant contributions from water content, supplementary cementitious materials, and chemical admixtures underscore the multifaceted nature of mix design effects on concrete performance, as evidenced by the correlation patterns shown in Fig. 2. The statistical significance of the SSO-CatBoost model’s superiority is confirmed through ANOVA results presented in Table 6, which yielded an F-statistic of 7.17 with p-value < 0.0001, and the Wilcoxon signed-rank test outcomes in Table 7, which established that SSO-CatBoost achieved the highest actual median (0.945) with statistical significance (p < 0.001). This trend is further supported by the R2 distribution boxplots in Fig. 21, which demonstrates SSO-CatBoost’s highest median R2 score (0.95) with the smallest interquartile range, and the radar comparison in Fig. 18, which collectively demonstrate consistent outperformance across multiple evaluation metrics. The cumulative distribution functions presented in Fig. 15 further confirm the concentrated low-error predictions achieved by the optimization framework. Although the dataset encompasses diverse mix proportions without exhaustive material property characterization, the methodology remains highly applicable to industry-standard mix design processes. Overall, this study provides a transparent and reproducible framework while generating actionable insights for concrete mixture optimization and the development of sustainable, resilient infrastructure systems.
According to the No Free Lunch theorem, the strong performance of the SSO-CatBoost framework is specific to the concrete compressive strength dataset and cannot be universally. When considering new datasets, alternative material systems, or different prediction objectives, it is necessary to re-evaluate and benchmark the framework to ensure effectiveness in each new context.
This study demonstrated a novel concrete compressive strength prediction strategy, proposed by producing the fusion of the Somersaulting Spider Optimizer (SSO) and the CatBoost model to address the relevant and considerable issue of hyperparameter optimization in machine learning-guided solutions of concrete engineering. The experimentation could demonstrate the effectiveness of bio-inspired optimization techniques for enhancing the accuracy of prediction in compound material characteristics. The developed SSO algorithm, built on the characteristic locomotion behaviour, provided a new balancing of exploratory and exploitative strategies, employing adaptive energy management and dual-phase movement strategies. The somersaulting and rolling motions of the algorithm, along with the stagnation-based intensity adjustment, are more efficient in comparison to conventional optimization procedures. In machine learning systems, the hyperparameter optimization, which was offered by mathematical models of time-dependent adaptive factors and time-dependent energy-based behavioural switching models, had a solid background.
Since there are seven known methods of metaheuristic optimization applied (Differential Evolution, Grey Wolf Optimizer, Whale Optimization Algorithm, Genetic Algorithm, Bat Algorithm, Harris Hawks Optimization and Particle Swarm Optimization), comparative analysis demonstrated that the SSO was effective across a wide scope of performance indicators. The convergence speed of the SSO was never outperformed by the competing algorithms in the quality of solutions and robustness, demonstrating that the algorithm has a broader range of applications in engineering optimization problems.
The Analysis of Variance (ANOVA) and the Wilcoxon signed-rank tests revealed the statistical value of the alterations in performance brought about by the implementation of the proposed methodology. The pertinent and stringent statistical analysis involved in the assessment of confidence vests precision in the algorithm, not only in confidence but also in workability in real-life work in the engineering field.
It is possible to identify some of the future research directions. This paper presents a variety of possible future avenues for the current research. Continued development of the SSO algorithm would enable the optimization of multiple concrete properties concurrently throughout such measures as strength, durability, workability and sustainability. It would enhance the generalisability of the algorithm to research on the algorithm applied on larger datasets comprising various geographical settings, material provision and construction techniques.
A possible industrial route will be the real-time use of the SSO-CatBoost system in concrete production facilities to test the product quality and adjust the mix compositions in real time. In addition, an improvement of the methodology in forecasting other tangible features, such as the lifespan of concrete, permeability, and thermal properties, would be helpful to widen its scope of use. A limitation is that the study does not perform sensitivity analysis on all hyperparameters.
Acknowledgement: Princess Nourah bint Abdulrahman University Researchers Supporting Project, Princess Nourah bint Abdulrahman University, Riyadh, Saudi Arabia.
Funding Statement: Princess Nourah bint Abdulrahman University Researchers Supporting Project number (PNURSP2025R308), Princess Nourah bint Abdulrahman University, Riyadh, Saudi Arabia.
Author Contributions: The authors confirm contribution to the paper as follows: Conceptualization, Marwa M. Eid and Amel Ali Alhussan; methodology, El-Sayed M. El-Kenawy and Ebrahim A. Mattar; software, El-Sayed M. El-Kenawy; validation, El-Sayed M. El-Kenawy, Amel Ali Alhussan, and Nima Khodadadi; formal analysis, Ebrahim A. Mattar and El-Sayed M. El-Kenawy; investigation, Marwa M. Eid and El-Sayed M. El-Kenawy; resources, Amel Ali Alhussan and Ebrahim A. Mattar; data curation, Nima Khodadadi and El-Sayed M. El-Kenawy; writing—original draft preparation, Marwa M. Eid and El-Sayed M. El-Kenawy; writing—review and editing, Amel Ali Alhussan, Ebrahim A. Mattar, and Nima Khodadadi; visualization, Nima Khodadadi; supervision, Marwa M. Eid; project administration, Nima Khodadadi; funding acquisition, El-Sayed M. El-Kenawy and Amel Ali Alhussan. All authors reviewed the results and approved the final version of the manuscript.
Availability of Data and Materials: The dataset used in this study is publicly available on Kaggle at https://www.kaggle.com/datasets/prathamtripathi/regression-with-neural-networking (accessed on 30 July 2025).
Ethics Approval: Not applicable.
Conflicts of Interest: The authors declare no conflicts of interest to report regarding the present study.
References
1. Feng DC, Liu ZT, Wang XD, Chen Y, Chang JQ, Wei DF, et al. Machine learning-based compressive strength prediction for concrete: an adaptive boosting approach. Constr Build Mater. 2020;230(3):117000. doi:10.1016/j.conbuildmat.2019.117000. [Google Scholar] [CrossRef]
2. Nguyen-Sy T. Optimized hybrid XGBoost-CatBoost model for enhanced prediction of concrete strength and reliability analysis using Monte Carlo simulations. Appl Soft Comput. 2024;167(8):112490. doi:10.1016/j.asoc.2024.112490. [Google Scholar] [CrossRef]
3. Zhang W, Wang D. Damage identification using deep learning and long-gauge fiber Bragg grating sensors. Appl Opt. 2020;59(33):10532–40. doi:10.1364/ao.405110. [Google Scholar] [PubMed] [CrossRef]
4. Lyngdoh GA, Li H, Zaki M, Krishnan NMA, Das S. Elucidating the constitutive relationship of calcium-silicate-hydrate gel using high throughput reactive molecular simulations and machine learning. Sci Rep. 2020;10(1):21336. doi:10.1038/s41598-020-78368-1. [Google Scholar] [PubMed] [CrossRef]
5. Taffese WZ, Nigussie E. Autonomous corrosion assessment of reinforced concrete structures: feasibility study. Sensors. 2020;20(23):6825. doi:10.3390/s20236825. [Google Scholar] [CrossRef]
6. Zhang Y, Ren W, Lei J, Sun L, Mi Y, Chen Y. Predicting the compressive strength of high-performance concrete via the DR-CatBoost model. Case Stud Constr Mater. 2024;21:e03990. doi:10.1016/j.cscm.2024.e03990. [Google Scholar] [CrossRef]
7. Bhowmick S, Nagarajaiah S, Veeraraghavan A. Vision and deep learning-based algorithms to detect and quantify cracks on concrete surfaces from UAV videos. Sensors. 2020;20(21):6299. doi:10.3390/s20216299. [Google Scholar] [PubMed] [CrossRef]
8. Rao PR, Harika R, Dass ZSC. A comprehensive review on the application of machine learning models in concrete strength prediction. J Phys: Conf Ser. 2025;3076(1):012015. doi:10.1088/1742-6596/3076/1/012015. [Google Scholar] [CrossRef]
9. Singh S, Patro SK, Parhi SK. Evolutionary optimization of machine learning algorithm hyperparameters for strength prediction of high-performance concrete. Asian J Civil Eng. 2023;24(8):3121–43. doi:10.1007/s42107-023-00698-y. [Google Scholar] [CrossRef]
10. Tang F, Wu Y, Zhou Y. Hybridizing grid search and support vector regression to predict the compressive strength of fly ash concrete. Adv Civil Eng. 2022;2022(1):3601914. doi:10.1155/2022/3601914. [Google Scholar] [CrossRef]
11. Van Mullem T, Anglani G, Dudek M, Vanoutrive H, Bumanis G, Litina C, et al. Addressing the need for standardization of test methods for self-healing concrete: an inter-laboratory study on concrete with macrocapsules. Sci Technol Adv Mater. 2020;21(1):661–82. doi:10.1080/14686996.2020.1814117. [Google Scholar] [PubMed] [CrossRef]
12. Zhang G, Ali ZH, Aldlemy MS, Mussa MH, Salih SQ, Hameed MM, et al. Reinforced concrete deep beam shear strength capacity modelling using an integrative bio-inspired algorithm with an artificial intelligence model. Engineering with Computers. 2022;38(Suppl 1):15–28. doi:10.1007/s00366-020-01137-1. [Google Scholar] [CrossRef]
13. Lu S, Koopialipoor M, Asteris PG, Bahri M, Armaghani DJ. A novel feature selection approach based on tree models for evaluating the punching shear capacity of steel fiber-reinforced concrete flat slabs. Materials. 2020;13(17):3902. doi:10.3390/ma13173902. [Google Scholar] [PubMed] [CrossRef]
14. Imran M, Khushnood RA, Fawad M. A hybrid data-driven and metaheuristic optimization approach for the compressive strength prediction of high-performance concrete. Case Stud Constr Mater. 2023;18(12):e01890. doi:10.1016/j.cscm.2023.e01890. [Google Scholar] [CrossRef]
15. Billah UH, La HM, Tavakkoli A. Deep learning-based feature silencing for accurate concrete crack detection. Sensors. 2020;20(16):4403. doi:10.20944/preprints202007.0474.v1. [Google Scholar] [CrossRef]
16. Nguyen QH, Ly HB, Tran VQ, Nguyen TA, Phan VH, Le TT, et al. A novel hybrid model based on a feedforward neural network and one step secant algorithm for prediction of load-bearing capacity of rectangular concrete-filled steel tube columns. Molecules. 2020;25(15):3486. doi:10.3390/molecules25153486. [Google Scholar] [PubMed] [CrossRef]
17. Li P, Zhang Z, Gu J. Prediction of concrete compressive strength based on ISSA-BPNN-AdaBoost. Materials. 2024;17(23):5727. doi:10.3390/ma17235727. [Google Scholar] [CrossRef]
18. Zhang Y, Ren W, Chen Y, Mi Y, Lei J, Sun L. Predicting the compressive strength of high-performance concrete using an interpretable machine learning model. Sci Rep. 2024;14(1):28346. doi:10.1038/s41598-024-79502-z. [Google Scholar] [PubMed] [CrossRef]
19. Guzmán-Torres JA, Dominguez-Mota FJ, Alonso-Guzmán EM, Tinoco-Guerrero G, Martinez-Molina W. ConcreteXAI: a multivariate dataset for concrete strength prediction via deep-learning-based methods. Data Brief. 2024;53(8):110218. doi:10.1016/j.dib.2024.110218. [Google Scholar] [PubMed] [CrossRef]
20. Javed MF, Fawad M, Lodhi R, Najeh T, Gamil Y. Forecasting the strength of preplaced aggregate concrete using interpretable machine learning approaches. Sci Rep. 2024;14(1):8381. doi:10.1038/s41598-024-57896-0. [Google Scholar] [PubMed] [CrossRef]
21. Hasan MR, Shuvo AK, Pranto EB, Hasan M, Miah MM. Data-driven prediction of concrete strength by machine learning: hybrid-fiber-reinforced recycled aggregate concrete. World J Eng. 2025;41(4):1183. doi:10.1108/wje-01-2025-0038. [Google Scholar] [CrossRef]
22. Liu Y. High-performance concrete strength prediction based on machine learning. Comput Intell Neurosci. 2022;2022:1–7. doi:10.1155/2022/5802217. [Google Scholar] [PubMed] [CrossRef]
23. Qi C, Huang B, Wu M, Wang K, Yang S, Li G. Concrete strength prediction using different machine learning processes: eeffect of slag, fly ash and superplasticizer. Materials. 2022;15(15):5369. doi:10.3390/ma15155369. [Google Scholar] [PubMed] [CrossRef]
24. Mirzaei A, Aghsami A. A hybrid deep reinforcement learning architecture for optimizing concrete mix design through precision strength prediction. Math Comput Appl. 2025;30(4):83. doi:10.3390/mca30040083. [Google Scholar] [CrossRef]
25. Nwetlawung ZE, Lin YH. Development of an optimization algorithm for designing low-carbon concrete materials standardization with blockchain technology and ensemble machine learning methods. Buildings. 2025;15(16):2809. doi:10.3390/buildings15162809. [Google Scholar] [CrossRef]
26. Gazi MU, Hasan MT, Debnath P. Few-shot meta-learning for concrete strength prediction: a model-agnostic approach with SHAP analysis. Innov Infrastruct Solut. 2025;4(1):20. doi:10.1007/s43503-025-00064-8. [Google Scholar] [CrossRef]
27. Zaki AM, Nafea HB, Moustafa HED, El-Kenawy ESM. Optimizing earthquake prediction accuracy using somersaulting spider optimizer for dynamic ensemble weighting. J Intell Syst Internet of Things. 2026;2:386–409. [Google Scholar]
28. Zaki AM, Nafea HB, Moustafa HED, El-Kenawy ESM. Somersaulting spider optimizer (SSOa nature-inspired metaheuristic algorithm for engineering optimization problems. J Artifi Intell Metaheuristics. 2025;10(1):91–120. doi:10.54216/JAIM.100105. [Google Scholar] [CrossRef]
29. Beskopylny AN, Stel’makh SA, Shcherban’ EM, Mailyan LR, Meskhi B, Razveeva I, et al. Concrete strength prediction using machine learning methods CatBoost, k-nearest neighbors, support vector regression. Appl Sci. 2022;12(21):10864. doi:10.3390/app122110864. [Google Scholar] [CrossRef]
30. Abbood IS, Rahman NA, Bakar BHA. Shear strength prediction for RCDBs utilizing data-driven machine learning approach: enhanced CatBoost with SHAP and PDPs analyses. Appl Syst Innov. 2025;8(4):96. doi:10.3390/asi8040096. [Google Scholar] [CrossRef]
Cite This Article
 Copyright © 2026 The Author(s). Published by Tech Science Press.
This work is licensed under a Creative Commons Attribution 4.0 International License , which permits unrestricted use, distribution, and reproduction in any medium, provided the original work is properly cited.
 Downloads
 Citation Tools