
 Submit a Paper
 Propose a Special lssue
 Open Access
ARTICLE

Noninvasive Radar Sensing Augmented with Machine Learning for Reliable Detection of Motor Imbalance
1 Department of Mathematical Sciences, College of Science, Princess Nourah Bint Abdulrahman University, P.O. Box 84428, Riyadh, 11671, Saudi Arabia
2 Institute of Computer Science, Khwaja Fareed University of Engineering and Information Technology, Abu Dhabi Road, Rahim Yar Khan, 64200, Pakistan
3 Artificial Intelligence & Data Analytics Lab, CCIS, Prince Sultan University, P.O. Box 11586, Riyadh, 11671, Saudi Arabia
* Corresponding Author: Amjad Rehman. Email:
Computer Modeling in Engineering & Sciences 2026, 146(1), 23 https://doi.org/10.32604/cmes.2025.074679
Received 15 October 2025; Accepted 20 November 2025; Issue published 29 January 2026
 View Full Text
 Download PDF
Abstract
Motor imbalance is a critical failure mode in rotating machinery, potentially causing severe equipment damage if undetected. Traditional vibration-based diagnostic methods rely on direct sensor contact, leading to installation challenges and measurement artifacts that can compromise accuracy. This study presents a novel radar-based framework for non-contact motor imbalance detection using 24 GHz continuous-wave radar. A dataset of 1802 experimental trials was sourced, covering four imbalance levels (0, 10, 20, 30 g) across varying motor speeds (500–1500 rpm) and load torques (0–3 Nm). Dual-channel in-phase and quadrature radar signals were captured at 10,000 samples per second for 30-s intervals, preserving both amplitude and phase information for analysis. A multi-domain feature extraction methodology captured imbalance signatures in time, frequency, and complex signal domains. From 65 initial features, statistical analysis using Kruskal–Wallis tests identified significant descriptors, and recursive feature elimination with Random Forest reduced the feature set to 20 dimensions, achieving 69% dimensionality reduction without loss of performance. Six machine learning algorithms, Random Forest, Extra Trees Classifier, Extreme Gradient Boosting, Categorical Boosting, Support Vector Machine with radial basis function kernel, and k-Nearest Neighbors were evaluated with grid-search hyperparameter optimization and five-fold cross-validation. The Extra Trees Classifier achieved the best performance with 98.52% test accuracy, 98% cross-validation accuracy, and minimal variance, maintaining per-class precision and recall above 97%. Its superior performance is attributed to its randomized split selection and full bootstrapping strategy, which reduce variance and overfitting while effectively capturing the nonlinear feature interactions and non-normal distributions present in the dataset. The model’s average inference time of 70 ms enables near real-time deployment. Comparative analysis demonstrates that the radar-based framework matches or exceeds traditional contact-based methods while eliminating their inherent limitations, providing a robust, scalable, and noninvasive solution for industrial motor condition monitoring, particularly in hazardous or space-constrained environments.Keywords
Rotating electrical machines play a pivotal role in industrial processes, transportation systems, and energy applications, where their reliability and operational efficiency are critical for productivity and safety. Among the various mechanical faults affecting rotating machinery, imbalance remains one of the most prevalent and detrimental, often manifesting as excessive vibrations, accelerated component wear, reduced efficiency, and in severe cases, catastrophic failures. Early detection of imbalance is therefore essential to prevent unplanned downtime, reduce maintenance costs, and ensure safe operation.
Traditional fault detection techniques primarily rely on vibration sensors, current signature analysis, and displacement measurements [1–5]. Although effective, these approaches present inherent limitations, including invasive installation requirements, susceptibility to environmental noise, and high deployment costs, particularly when scaling to large industrial systems. To address these challenges, recent studies have explored advanced diagnostic techniques such as electrostatic sensing [6–9], machine learning-based vibration analysis [10–12], and signal decomposition methods [13–17]. While these approaches demonstrate promise, their effectiveness can be constrained under non-stationary operating conditions, and the reliance on direct mechanical or electrical contact reduces flexibility for wide-scale industrial integration.
Emerging noncontact sensing modalities, such as antenna- and radar-based measurements, have shown potential for reliable and cost-efficient machine health monitoring. Recent works utilizing antenna-based reflection coefficients have demonstrated accurate fault detection capabilities [14,18,19], while vibration-sensor-driven deep learning (DL) frameworks have achieved high accuracies for imbalance classification [20–23]. However, these methods often require complex signal acquisition hardware or large-scale datasets, and their performance can degrade when applied to dynamic industrial environments with varying load conditions. Moreover, limited efforts have been directed toward exploiting radar sensing for imbalance detection, despite its inherent advantages of robustness, noninvasiveness, and adaptability to non-stationary loads.
To address these research gaps, this study proposes a radar-based framework for imbalance detection that combines noncontact sensing with machine learning techniques. The approach leverages advanced signal processing to extract informative features from radar measurements and applies systematic feature selection to enhance discriminative capability while reducing redundancy. Multiple state-of-the-art classifiers are evaluated to determine the most effective model for reliable fault identification. Experimental validation confirms that the proposed method achieves higher accuracy and efficiency compared to conventional techniques, offering a practical pathway toward robust and real-time industrial fault monitoring.
The contributions of this study are:
This work makes several key contributions to motor fault diagnosis and radar-based condition monitoring:
• Development of a standoff radar system for motor imbalance detection, eliminating mechanical coupling effects and installation complexity of traditional sensors.
• Extraction of 65 features from time, frequency, complex, and envelope domains to comprehensively capture imbalance signatures.
• Integration of Kruskal-Wallis testing with recursive feature elimination, yielding an optimal 20-feature subset with 69% dimensionality reduction and 98.52% accuracy.
• Comparative analysis of six machine learning algorithms with hyperparameter optimization, identifying Extra Trees Classifier (ETC) as the optimal model.
This work establishes a novel pathway for scalable, noninvasive, and computationally efficient imbalance diagnosis, contributing to the advancement of intelligent predictive maintenance strategies in modern industrial systems.
Induction motor fault diagnosis has long been a critical research area due to its importance in ensuring reliable and efficient industrial operations. Traditional approaches have predominantly relied on vibration signal analysis combined with machine learning (ML) and deep learning (DL) models to detect and classify motor faults under varying operating conditions. For example, a study by [24] developed a defective induction motor model to collect vibration signals under five operating states and different load conditions. Using convolutional neural networks (CNNs), they achieved high accuracy (95%–96%) with balanced datasets; however, performance declined significantly under imbalanced data conditions. To mitigate this, deep convolutional generative adversarial networks (DCGANs) were employed for data augmentation, which generated realistic samples with 80% similarity and improved accuracy to 90%. The pro-balanced method further enhanced cross-load testing performance to 85%. Similarly, reference [25] combined residual networks (ResNet) with CNNs to detect shaft unbalance using accelerometer data. By training on vibration signatures transformed using short-time Fourier transform (STFT), they achieved accuracies of 99.23% for binary classification (balanced vs. unbalanced) and 95.15% for multiclass classification (five unbalance levels).
Other works have explored alternative sensing approaches. For instance, reference [26] proposed a noninvasive, low-cost method for induction motor fault detection using an antenna to measure time-varying reflection coefficient (S11). Distinct fault signatures were validated via fast Fourier transform (FFT) analysis, and a DL model classified faults with up to 98.2% accuracy using both magnitude and phase information. Similarly, reference [27] introduced a generative adversarial network (GAN)-based data generation method to address imbalance in harmonic drive fault diagnosis. After transforming vibration signals using FFT and filtering synthetic spectra through a data selection module (DSM), they combined real and generated data into a balanced dataset. Classification using a multiscale convolutional neural network (MSCNN) achieved 98.49% accuracy.
For incipient stator faults, reference [28] developed a wavelet-based denoising technique using stationary wavelet transform (SWT) to extract weak features from noisy current signals. Statistical norms of error signals were used as discriminative indicators, and an ensemble AdaBoost decision tree (EADT) was adopted for classification, achieving 98.48% accuracy even with imbalanced datasets. In another study, reference [29] addressed rotor unbalance in a two-mass permanent magnet synchronous motor (PMSM) drive system using the reference current signal from the field-oriented control (FOC) speed controller. Features were extracted using STFT and classified using a multilayer perceptron (MLP) neural network, yielding over 95% detection accuracy and 93% unbalance level estimation.
A vibration dataset for unbalance detection was also introduced by [30], where different unbalance levels were induced on a rotating shaft and recorded across speeds from 630–2330 RPM using three vibration sensors at 4096 Hz. Multiple algorithms—including fully connected neural networks (FCNNs), CNNs, hidden Markov models (HMMs), and random forests—were tested, with the FCNN using FFT-transformed data achieving the highest accuracy of 98.6%. Similarly, reference [31] addressed electric vehicle (EV) motor unbalance under non-stationary load conditions using local iterative filter decomposition. Their method improved classification of load-varying signals and successfully detected even low-speed unbalances, achieving over 80% accuracy. A novel noncontact approach was proposed by [32], which introduced an electrostatic sensing system for continuous displacement measurement of rotary shafts under imbalance faults. Both simulations and experimental tests validated the system’s effectiveness, yielding a relative error within
Despite the significant progress achieved in fault diagnosis of induction motors and rotating machinery, several limitations persist in the existing body of work. Most studies rely heavily on vibration or current sensors, which, although effective, require physical contact or close proximity to the machine, thereby increasing system complexity, installation cost, and limiting applicability in sealed or harsh industrial environments. Furthermore, many of these approaches are sensitive to variations in operating conditions such as fluctuating loads, speed variations, and external noise, which can reduce diagnostic accuracy, particularly in non-stationary or low-speed regimes. Another challenge lies in the availability and quality of fault data, where class imbalance often necessitates the use of data augmentation techniques, yet the synthetic data generated may not fully capture the variability of real-world conditions. Finally, existing feature extraction and classification methods, while achieving high reported accuracies, often demonstrate limited robustness and generalizability when applied across different operating environments or fault severities.
To address these limitations, this study proposes a radar-based framework for detecting motor imbalance faults, providing a noncontact, robust, and cost-effective alternative to conventional sensing approaches. The framework is designed around a structured multi-phase process that includes signal preprocessing, comprehensive feature extraction across multiple domains, feature selection to retain the most informative indicators, and supervised machine learning for fault classification. By combining radar sensing with advanced data-driven analysis, the proposed approach enhances the reliability of imbalance detection while reducing dependency on traditional vibration or current sensors. This integration enables accurate, generalizable, and efficient diagnosis of motor imbalance under diverse operating conditions, offering a practical pathway for improving the robustness of fault detection in real-world applications.
The proposed framework as shown in Fig. 1 for radar-based motor imbalance detection consists of a structured multi-phase process, including signal preprocessing, multi-domain feature extraction, feature selection, and supervised classification. Raw in-phase (I) and quadrature (Q) radar signals are initially preprocessed to ensure uniform length and signal integrity. Complex representation of the signals is constructed to extract amplitude and phase characteristics, which are subsequently decomposed into time-domain, spectral, and envelope-based features.
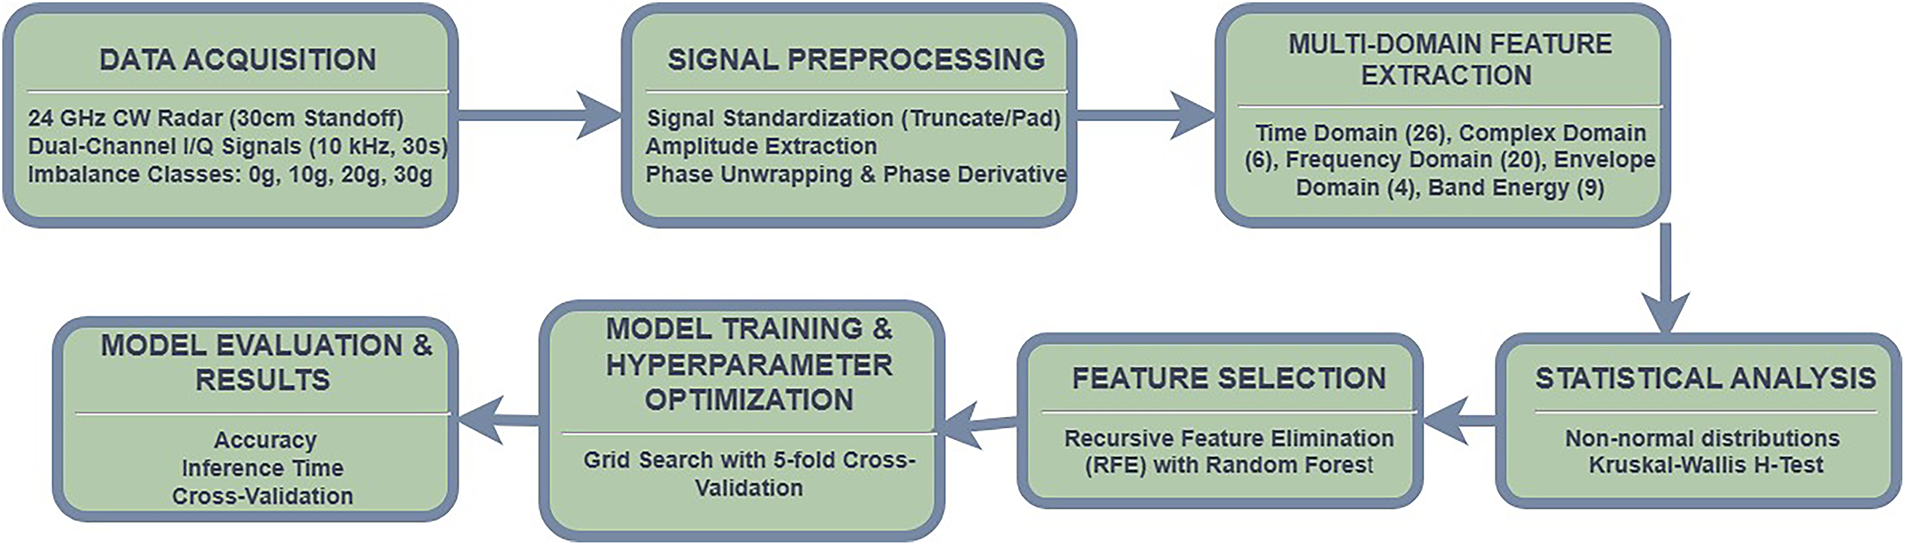
Figure 1: Proposed frame work
To identify the most informative features, statistical analyses, including the Kruskal–Wallis test and Recursive Feature Elimination (RFE), are applied, reducing the dimensionality to a subset of 20 features that effectively capture imbalance-induced variations. Supervised ML models including RF, ETC, XGBoost, CatBoost, K-Nearest Neighbors (KNN), and Support Vector Machine with RBF (SVM-RBF) kernel are then trained and validated to classify the severity of motor imbalance. Hyperparameter optimization is performed using grid search to ensure optimal predictive performance while maintaining generalizability.
The experimental investigations presented in this work utilize a comprehensive radar-based vibration monitoring dataset [33] developed by the Selcuk University Remote Sensing Laboratory. This dataset represents a systematic collection of continuous-wave (CW) radar measurements designed specifically for the characterization and detection of rotational mass imbalance in rotating machinery.
4.2 Data Acquisition Framework
The dataset comprises 1802 independent experimental trials, each conducted under controlled laboratory conditions with a standardized sensor-to-target configuration as shown in Fig. 2. The radar system operates at 24 GHz in continuous-wave mode, positioned at a fixed standoff distance of 30 cm from the target motor assembly. This non-contact sensing approach enables vibration monitoring without mechanical coupling, thereby eliminating potential measurement artifacts associated with traditional accelerometer-based methods.
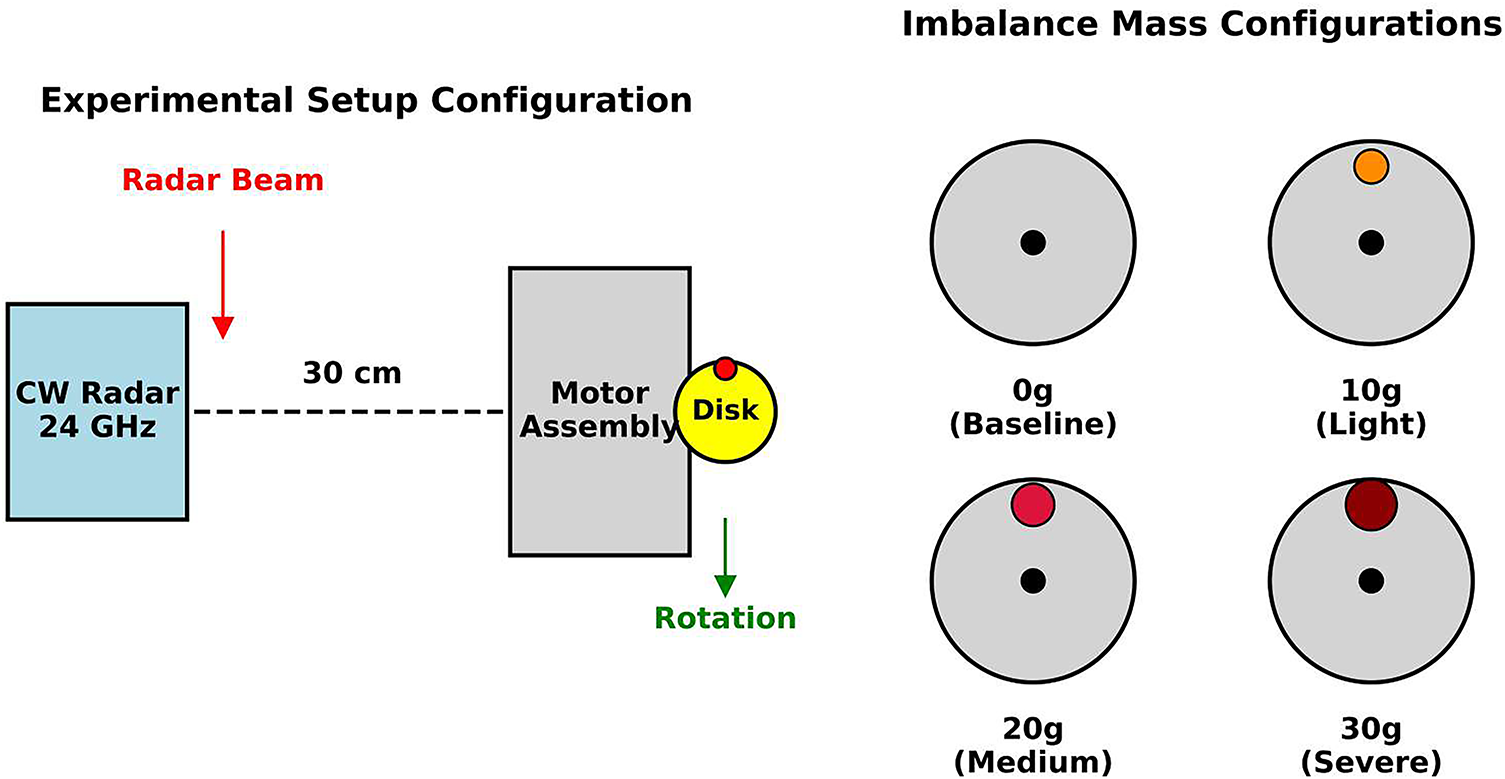
Figure 2: Experimental setup configuration showing the CW radar, motor assembly, and imbalance disk with added mass
Each experimental trial captures 30 s of baseband radar returns, sampled simultaneously on in-phase (I) and quadrature (Q) channels at 10 kHz, yielding 300,000 discrete samples per channel. The extended measurement duration ensures adequate spectral resolution for frequency-domain analysis while providing sufficient temporal data for advanced signal processing techniques. The dual-channel I/Q configuration preserves both amplitude and phase information of the radar returns, enabling comprehensive characterization of the target’s vibrational dynamics.
4.3 Experimental Design and Operating Conditions
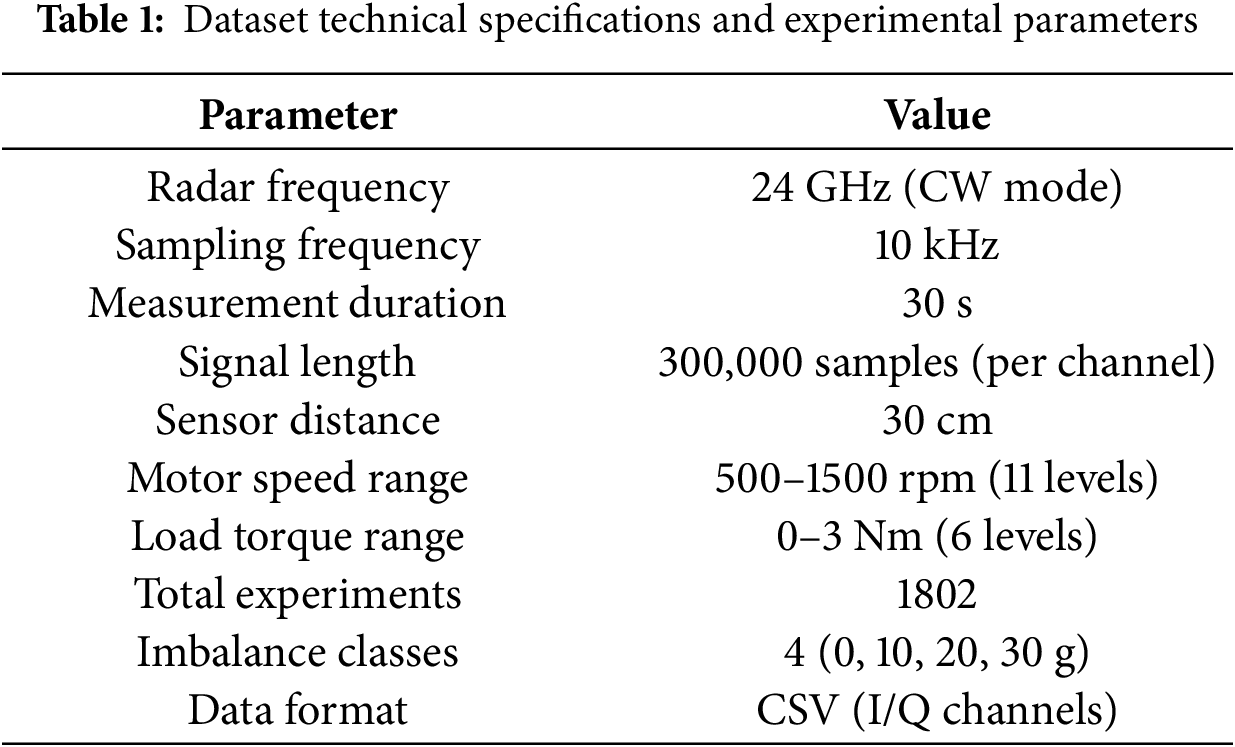
The experimental matrix encompasses a broad range of realistic operating conditions to ensure dataset representativeness as shown in Table 1. Motor rotational speeds span from 500 to 1500 rpm across 11 equally distributed levels, providing coverage of typical industrial machinery operating ranges. Applied load torque varies from 0 to 3 Nm through 6 discrete levels, representing both unloaded and loaded operational scenarios commonly encountered in practical applications.
During each measurement, both rotational speed and applied torque remain constant to ensure steady-state conditions and minimize confounding variables. This controlled approach facilitates the isolation of imbalance-induced vibration signatures from other potential sources of mechanical variation.
4.4 Fault Simulation and Classification Framework
Controlled rotational imbalance conditions were systematically introduced through the attachment of discrete masses to a coupling disk mounted on the motor shaft. This methodology enables precise control over imbalance magnitude while maintaining repeatability across experimental trials. Four distinct imbalance classifications were established based on attached mass:
• Baseline condition: 0 g additional mass (balanced rotor)
• Light imbalance: 10 g additional mass
• Medium imbalance: 20 g additional mass
• Severe imbalance: 30 g additional mass
The dataset exhibits balanced class representation with 462, 464, 413, and 463 experimental trials corresponding to baseline, light, medium, and severe imbalance conditions, respectively as shown in Fig. 3. This distribution ensures adequate statistical power for supervised learning approaches while minimizing potential class imbalance effects on classification performance.
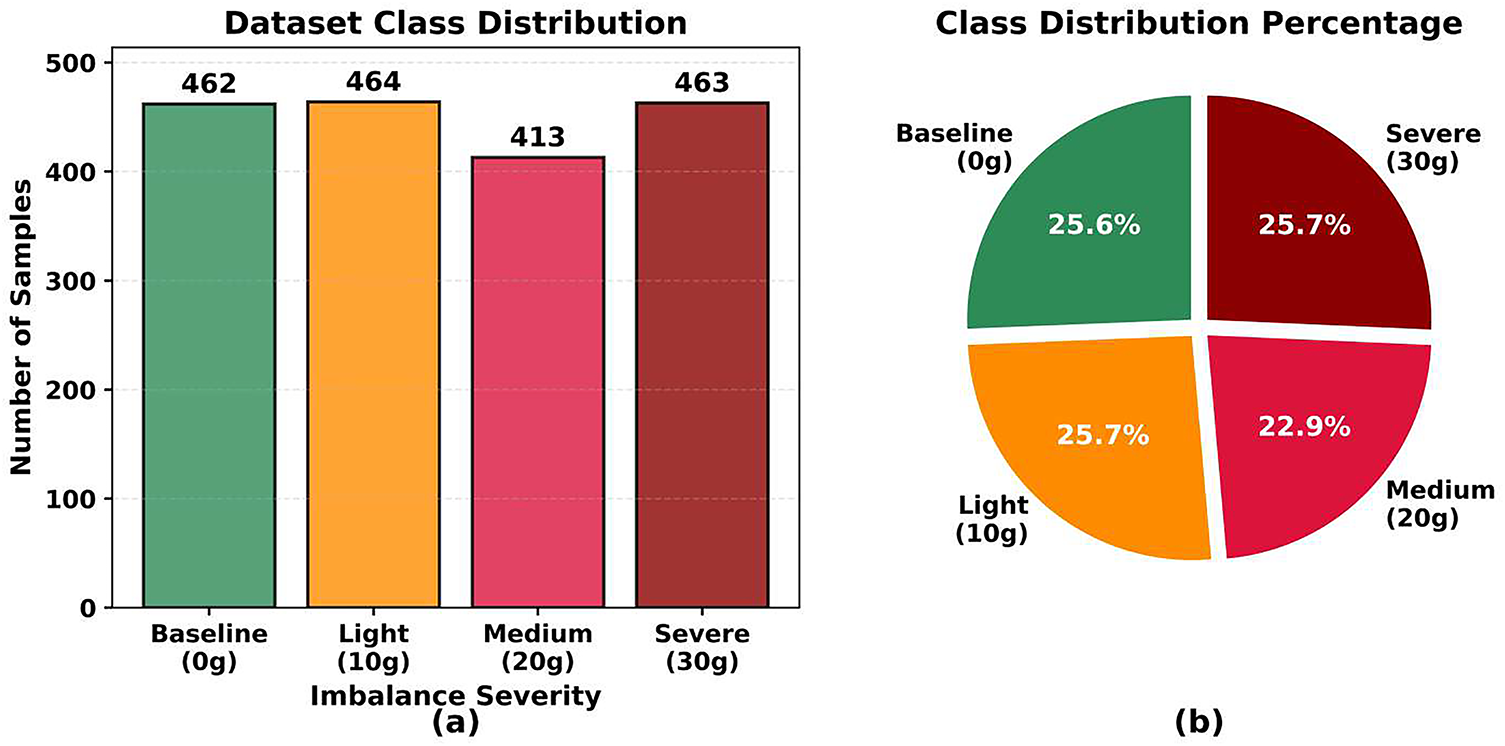
Figure 3: Distribution of dataset samples across different imbalance severity levels (a) Bar Chart (b) Pie Chart
The complete dataset is structured as a compressed archive containing four class-specific subdirectories corresponding to each imbalance severity level. Individual experimental trials are stored in CSV format, preserving both I and Q channel data in a readily accessible tabular structure. This organization facilitates efficient data loading and preprocessing for various analytical frameworks and ML pipelines.
Fig. 4 presents representative frequency domain characteristics of the acquired CW radar signals across different mass imbalance conditions. The baseline condition (Fig. 4a) exhibits a dominant spectral peak at approximately 150 Hz with minimal harmonic content, indicating normal motor operation.
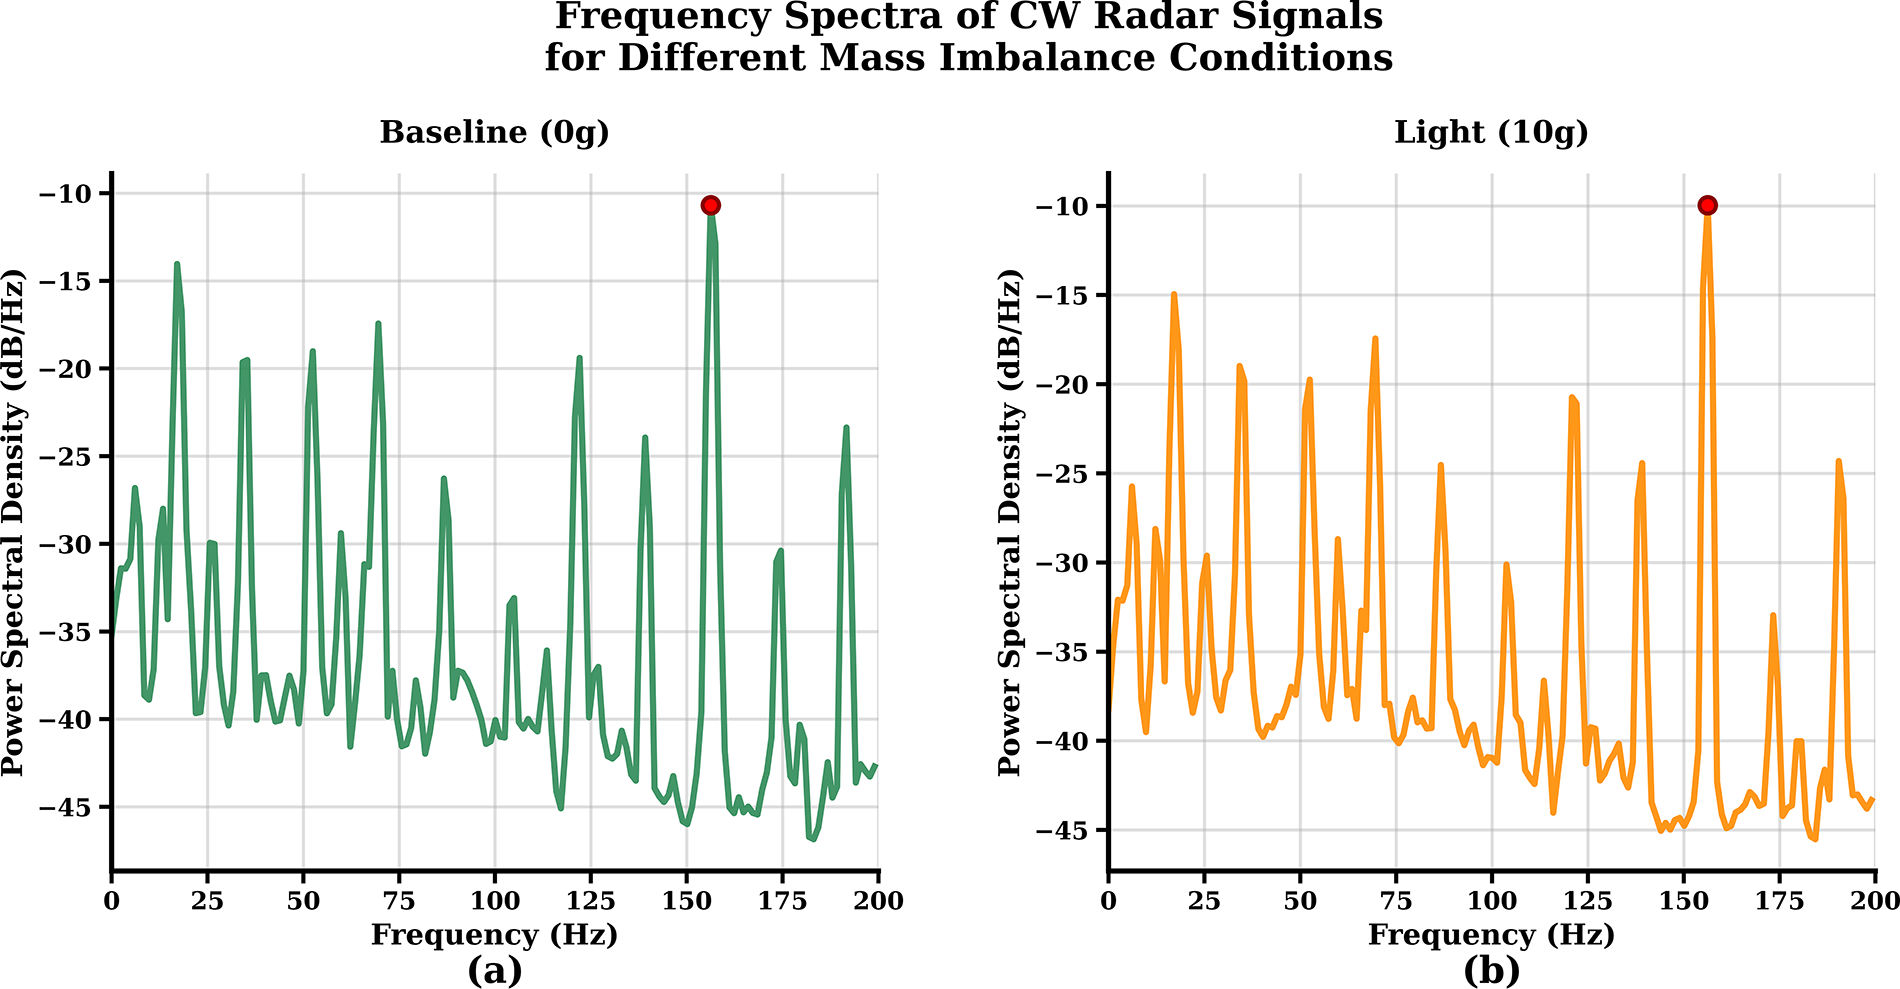
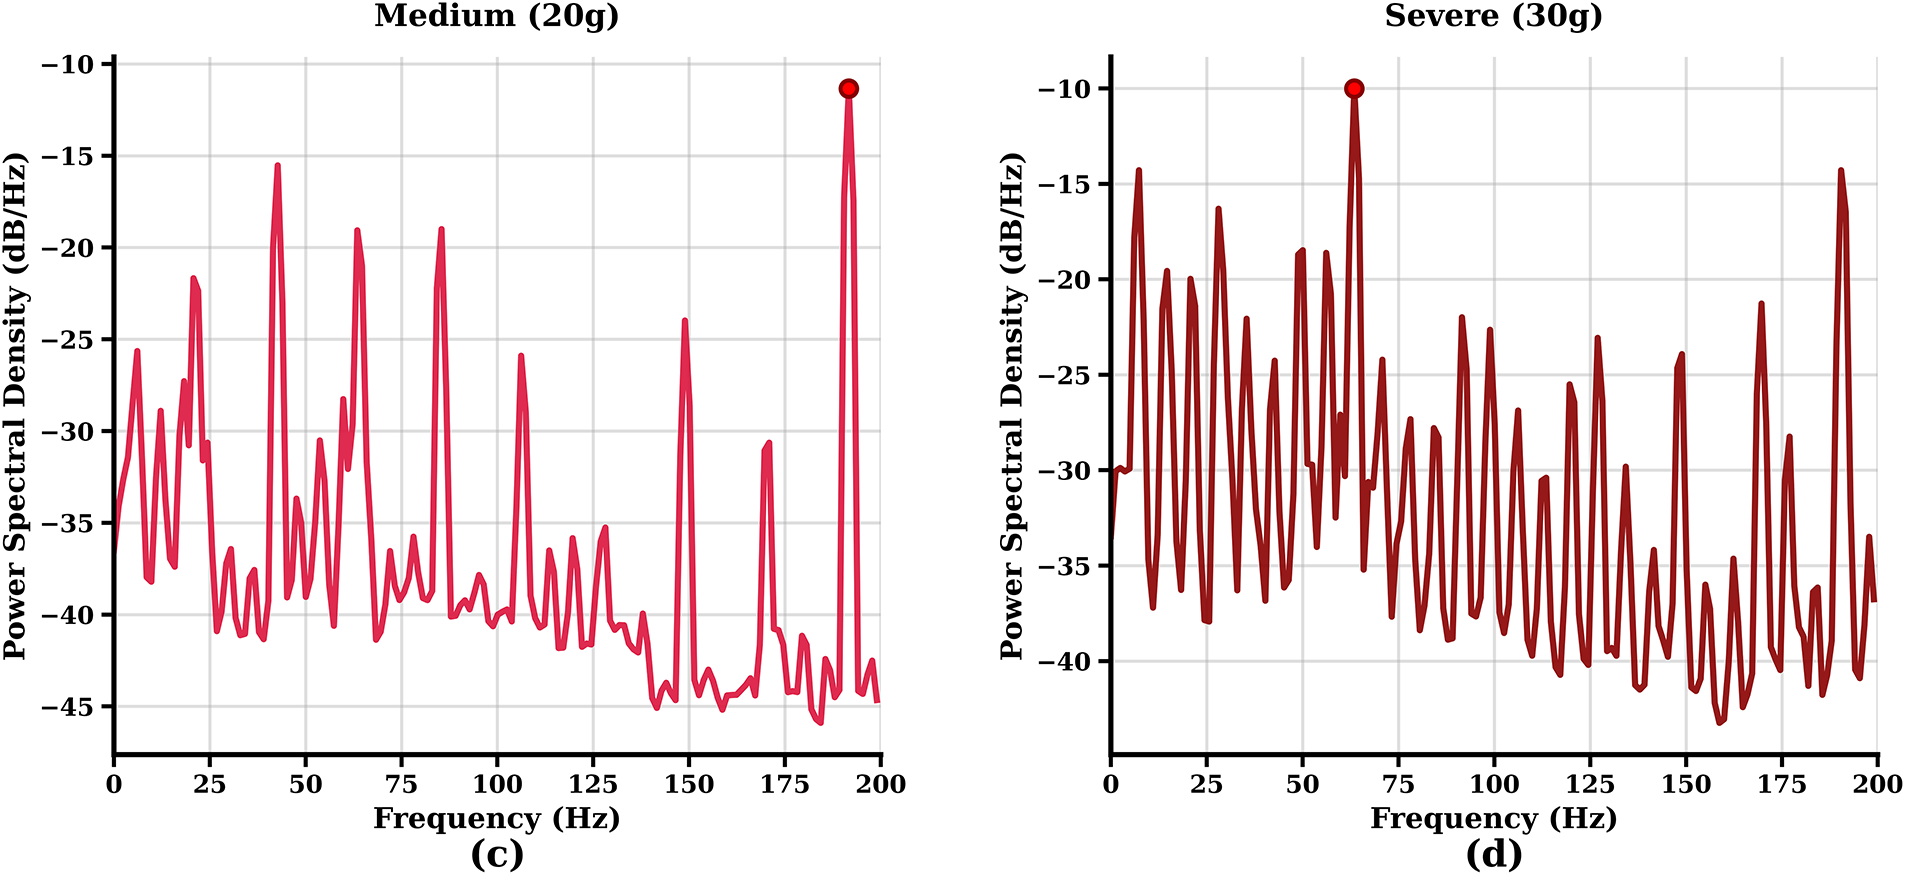
Figure 4: Frequency spectra of CW radar signals acquired from motor vibrations under different mass imbalance conditions. (a) Baseline condition (0 g), (b) Light imbalance (10 g), (c) Medium imbalance (20 g), (d) Severe imbalance (30 g)
As imbalance severity increases, distinct spectral patterns emerge. The light imbalance condition (Fig. 4b) introduces additional frequency components while maintaining the primary operational frequency. Medium imbalance (Fig. 4c) demonstrates increased spectral complexity with emerging harmonics around 175 Hz, characteristic of mechanical irregularities. The severe imbalance condition (Fig. 4d) shows the most pronounced spectral modifications, with multiple prominent peaks and elevated harmonic content throughout the frequency range.
These spectral variations provide clear discrimination features for classification algorithms, as each imbalance level produces unique frequency signatures that correlate with the mechanical condition severity. The consistent presence of dominant peaks across all conditions ensures signal detectability, while the progressive spectral changes enable effective condition monitoring through radar-based vibration analysis.
5 Preprocessing and Feature Extraction
The acquired CW radar signals undergo systematic preprocessing to ensure data quality and consistency across all imbalance measurements. Each recorded signal comprises I and Q components sampled at
from which instantaneous amplitude and unwrapped phase are derived as:
Phase unwrapping was applied to eliminate artificial
A comprehensive 65-feature vector was designed to capture the multi-domain manifestations of motor imbalance in CW radar signatures, combining time-domain statistical descriptors (e.g., skewness, kurtosis of I/Q signals), frequency-domain spectral characteristics (e.g., harmonic energy, spectral centroid and spread), and advanced signal processing features such as Hilbert envelope statistics and unwrapped phase derivatives that reflect amplitude and Doppler modulations induced by rotor eccentricity. The feature extraction pipeline is shown in Fig. 5. Time-domain features provide fundamental characterization of amplitude variations induced by periodic imbalance forces, with thirteen statistical descriptors computed for each I and Q channel. The mean values
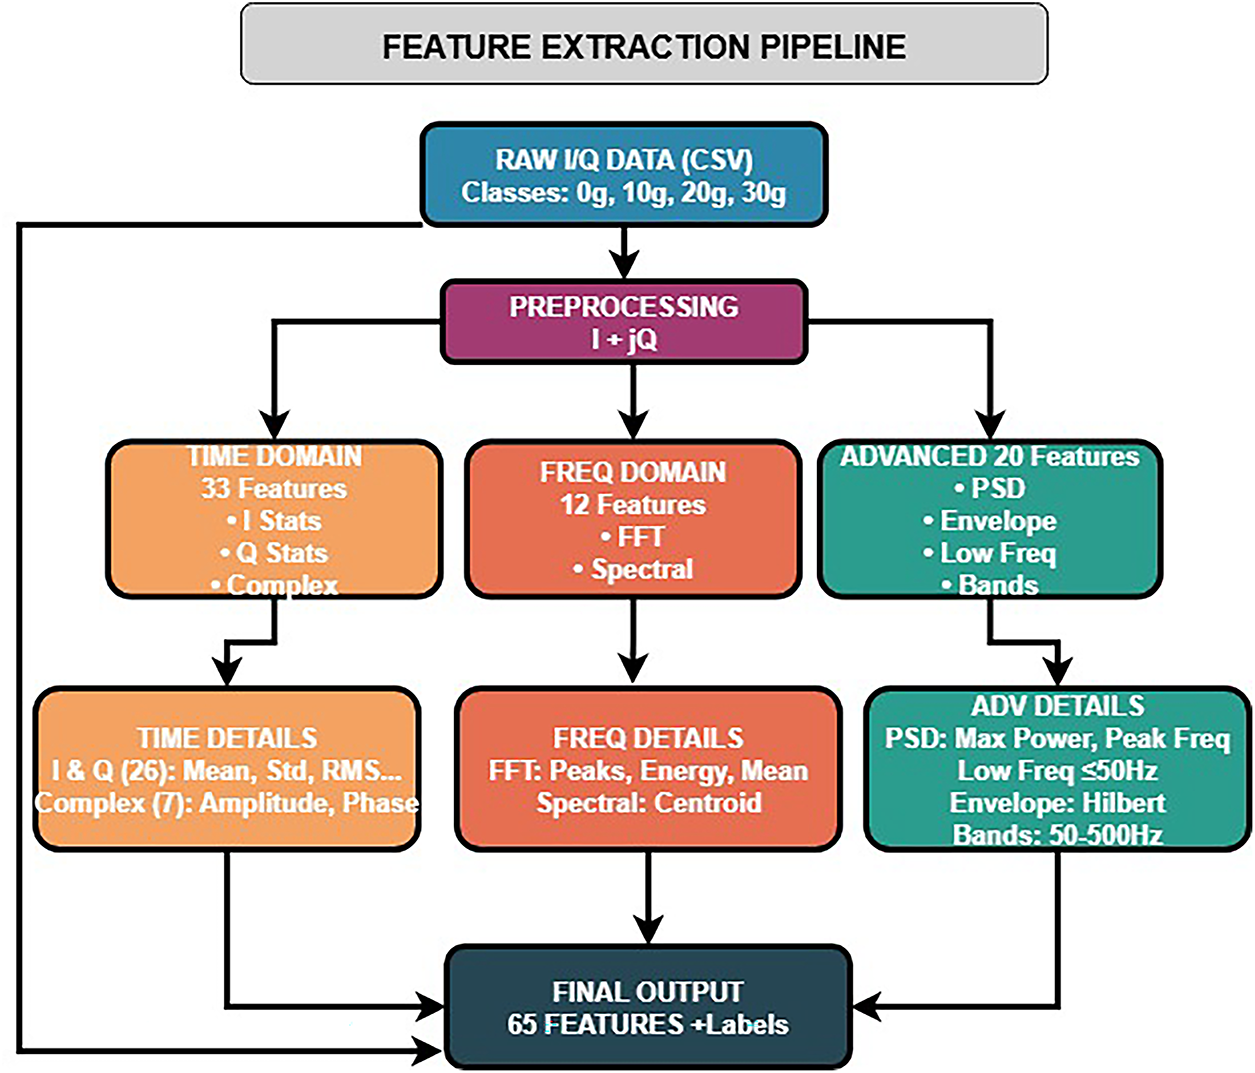
Figure 5: Feature extraction pipeline
Complex signal features exploit the coherent nature of CW radar returns to capture amplitude and phase modulation effects characteristic of rotating machinery imbalance. Statistical moments of instantaneous amplitude
Frequency-domain analysis reveals spectral signatures associated with rotational imbalance through Fast Fourier Transform processing
Low-frequency spectral analysis specifically targets the 0–50 Hz band where motor imbalance signatures predominantly manifest, as industrial motors typically operate at rotation frequencies below 30 Hz (1800 RPM) with primary imbalance components appearing at 1
Envelope analysis through Hilbert transform processing
Band-specific energy analysis employs fourth-order Butterworth bandpass filtering [37] to isolate frequency components relevant to different mechanical phenomena, with energy calculated as
All computations were performed in Python 3.10 using the NumPy, SciPy, and scikit-learn libraries. Statistical descriptors (mean, variance, skewness, kurtosis) were computed via numpy and scipy.stats, while FFT and Hilbert transforms utilized scipy.fft and scipy.signal.hilbert, respectively. The complete feature extraction process was implemented as a reproducible class-based pipeline and validated on CW radar datasets sampled at 10 kHz for 30 s per trial. The comprehensive 65-dimensional feature set systematically captures amplitude, frequency, and modulation characteristics that vary predictably with motor imbalance conditions, forming the foundation for robust ML based classification between normal operation (0 g), mild imbalance (10 g), moderate imbalance (20 g), and severe imbalance (30 g) conditions through exploitation of both linear amplitude relationships and nonlinear harmonic generation mechanisms inherent in rotating machinery dynamics.
To assess the statistical suitability of the extracted features for subsequent modeling, a series of normality tests was performed across all 65 non-categorical features. Specifically, the Shapiro–Wilk [38,39], Jarque–Bera [40,41], and Anderson–Darling [42–44] tests were employed to evaluate deviations from Gaussianity. The results consistently indicated that none of the features adhered to the null hypothesis of normality at either the 5% or 1% significance levels. Complementary distributional analysis further revealed that 12.3% of the features (8 out of 65) exhibited substantial skewness (absolute skewness
In light of the observed deviations from normality, non-parametric approaches were deemed appropriate for assessing the discriminative capacity of individual features across the four imbalance classes. Accordingly, the Kruskal–Wallis H-test [45–47] was applied to all 66 features, complemented by the computation of
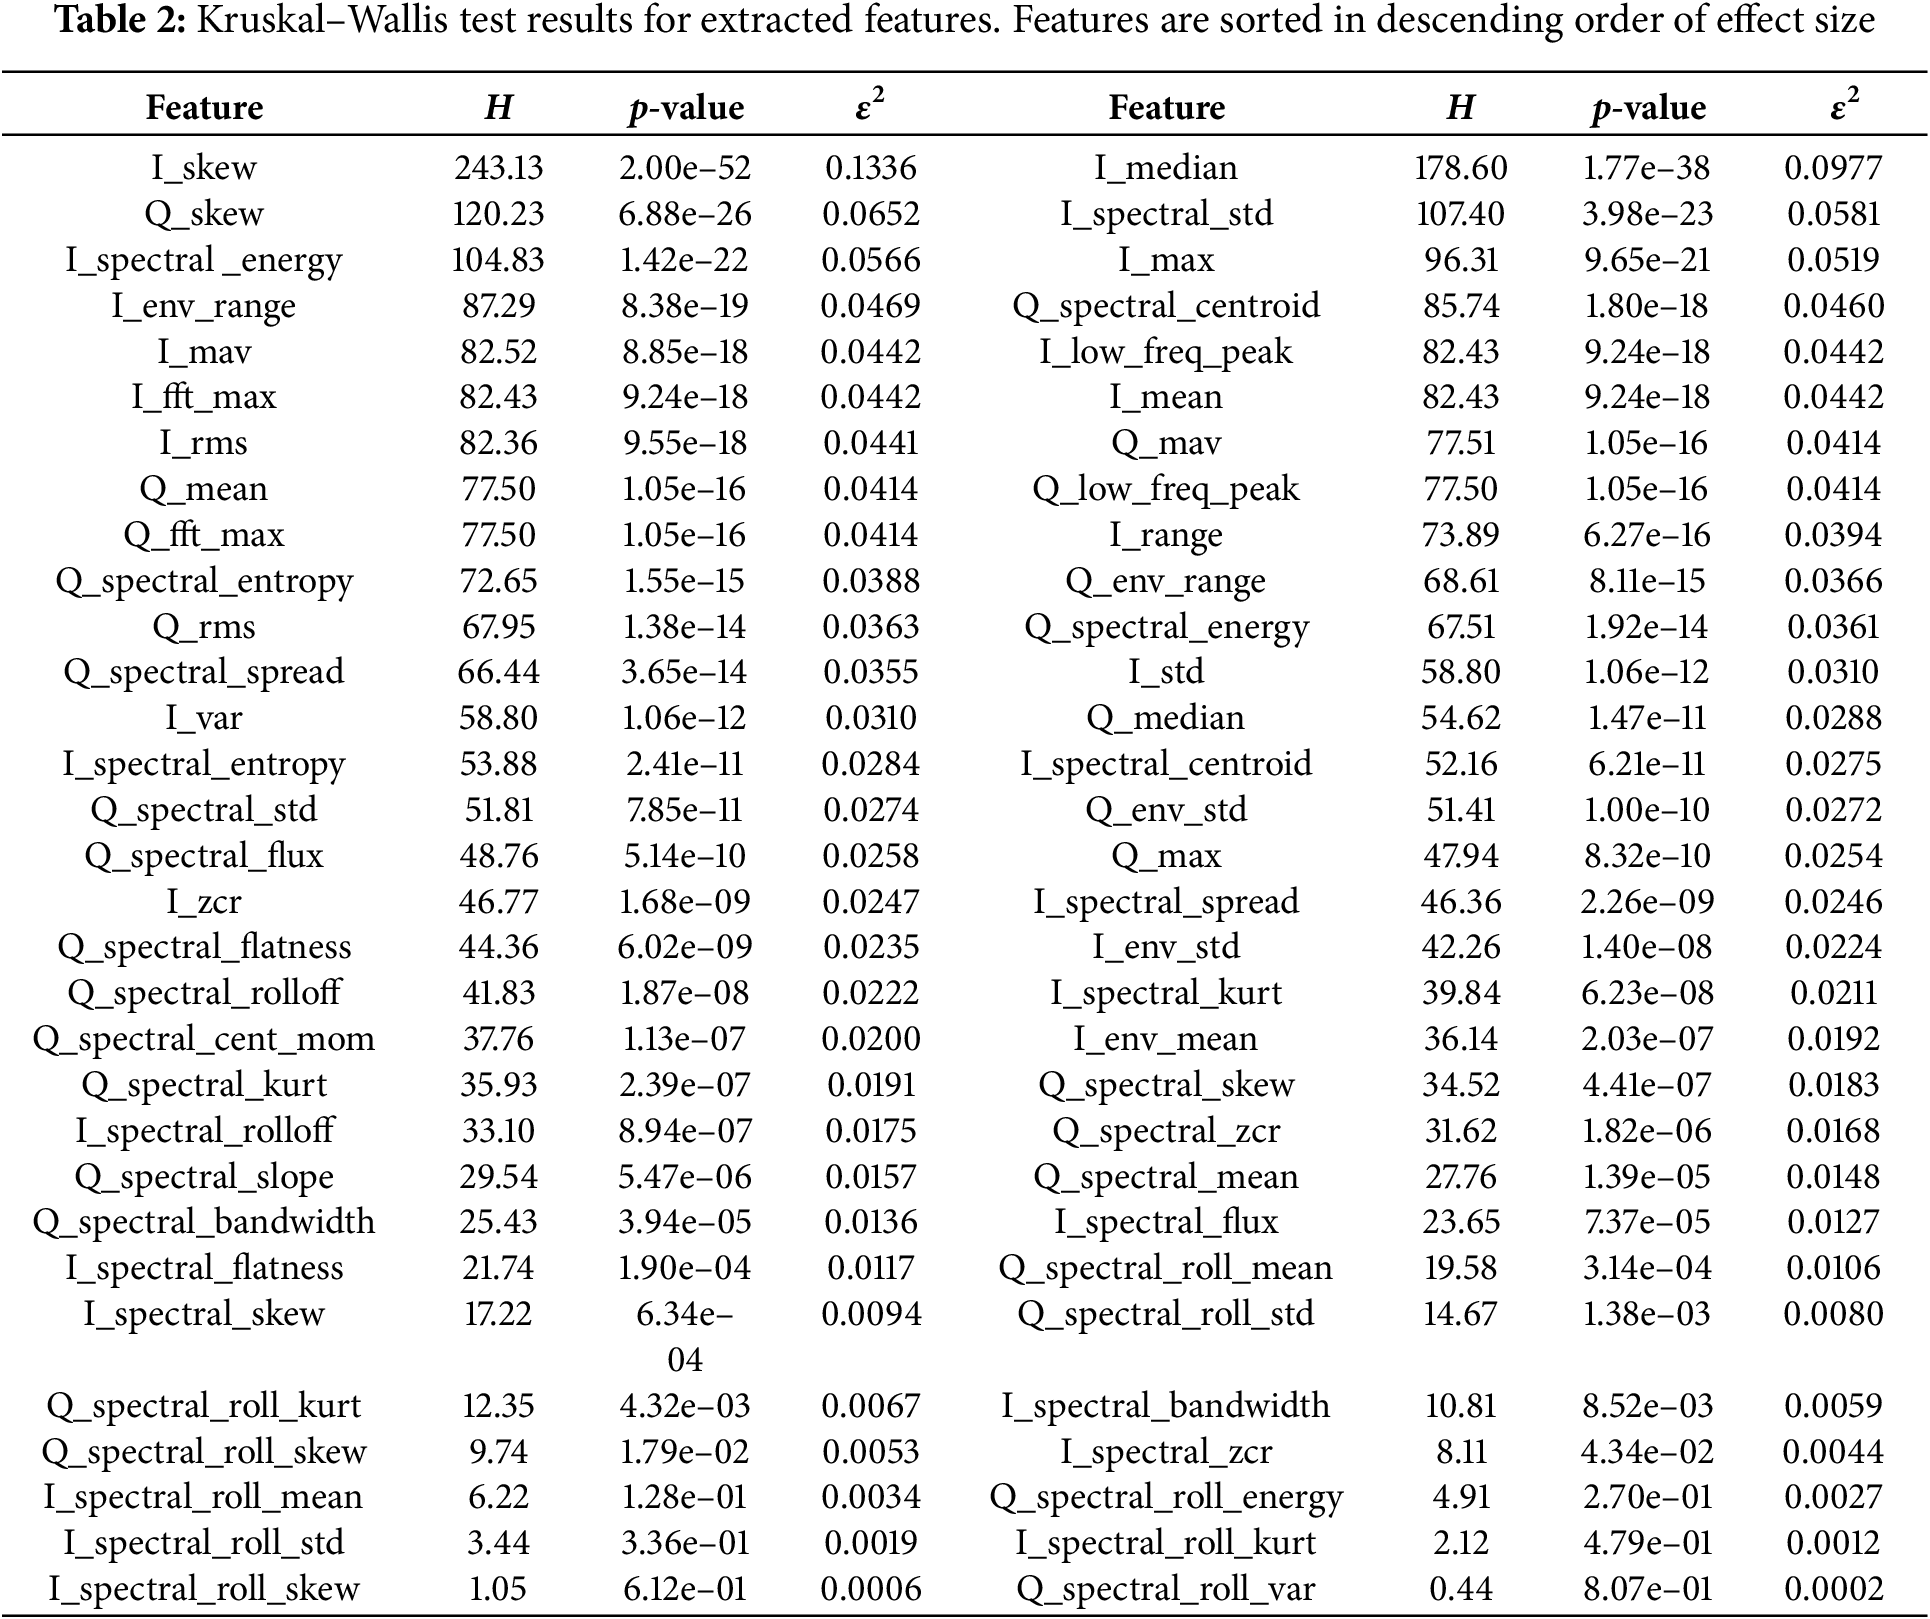
The most discriminative features, including current-domain descriptors such as
These findings corroborate the hypothesis that imbalance manifests in both linear amplitude shifts and nonlinear spectral signatures. The ranked feature importance derived from the Kruskal–Wallis analysis provides a principled basis for feature selection and dimensionality reduction, while also motivating the integration of robust machine learning classifiers capable of exploiting the identified discriminative patterns.
The post-hoc pairwise comparisons summarized in Table 3 reveal significant differences in features across the experimental groups (10gr, 20gr, 30gr, and normal). Only comparisons with FDR-adjusted p-values less than 0.05 are considered, highlighting the features most sensitive to group differences.
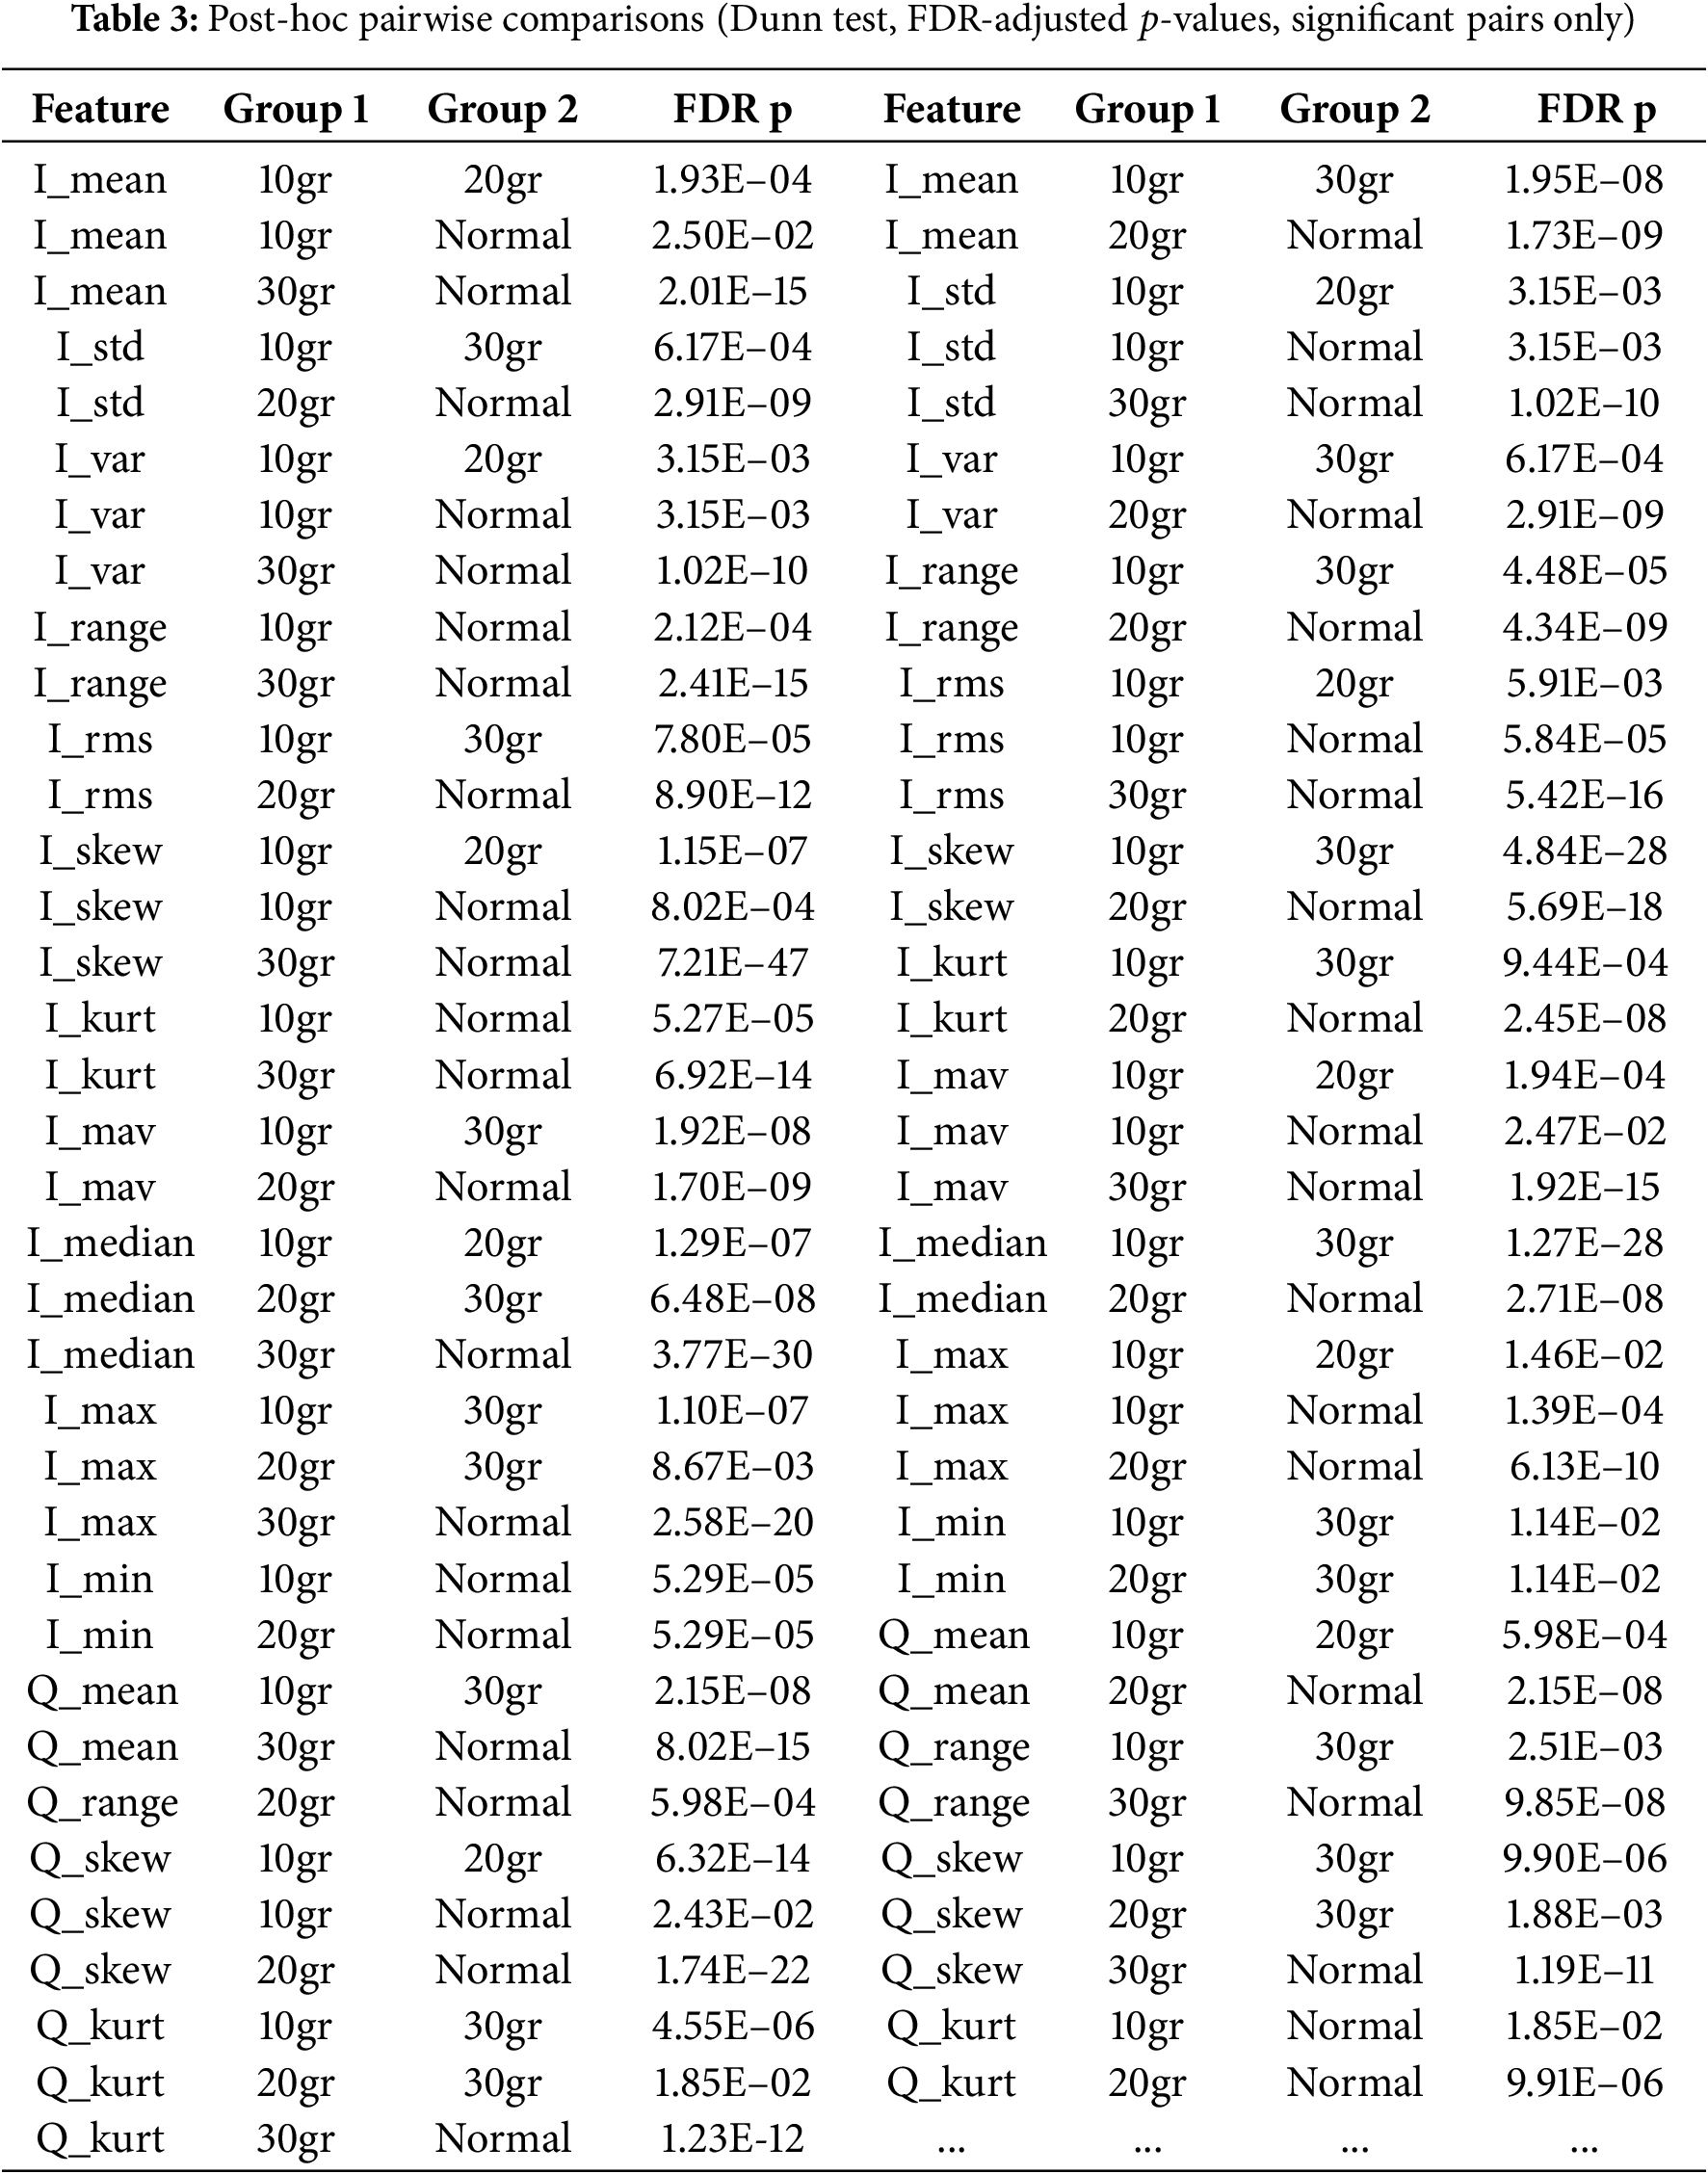
Time-domain features such as I_mean, I_std, I_var, I_range, I_rms, I_skew, I_kurt, I_mav, I_median, I_max, and I_min exhibit significant differences across most group pairs. Notably, comparisons involving the 10gr and 30gr groups, as well as between the normal and experimental groups, show highly significant changes, indicating that both the central tendency and variability of the signals are strongly affected by the experimental conditions. Shape-related features such as I_skew and I_kurt demonstrate extremely low p-values, reflecting alterations in signal asymmetry and peakedness under higher loads.
Quadrature-domain features (Q_mean, Q_range, Q_skew, Q_kurt, Q_mav, Q_median, Q_max, and Q_min) show a pattern similar to the in-phase features, with strong differences particularly in comparisons involving the 30gr group. These results indicate that both amplitude and distribution changes occur in the quadrature component under experimental manipulation.
Spectral features, including I_spectral_energy, I_spectral_sum, I_spectral_std, and their quadrature counterparts, reveal significant group differences, highlighting that the power and variability of the frequency content are strongly modulated. Band-specific measures (I_band_50_100 Hz, I_band_100_500 Hz, Q_band_100_500 Hz) demonstrate selective sensitivity, suggesting that certain frequency ranges are more affected by the experimental conditions than others.
Envelope and peak features (I_env_mean, I_env_std, amp_mean, amp_max, I_peak_freq, I_low_freq_peak, Q_low_freq_peak) also display significant differences. These results indicate that both the amplitude envelope and peak intensities, as well as the spectral peak locations, are strongly modulated by the experimental manipulations.
It is evident from results that, the 30gr group exhibits the most pronounced differences across almost all features, suggesting a dose-dependent effect of the experimental conditions. Features capturing amplitude, variability, distribution shape, and spectral content appear to be the most sensitive indicators of group differences. These findings highlight the robustness of multi-domain signal features in differentiating experimental conditions and support their potential use in classification.
The statistical evaluation established that the extracted features systematically deviate from Gaussian assumptions, thereby justifying the use of non-parametric methods. The Kruskal–Wallis tests, complemented by
Building on the insights from the statistical analysis, the identified discriminative features provide a natural foundation for feature selection. Features exhibiting both significant group differences and meaningful effect sizes are prioritized to reduce dimensionality, minimize redundancy, and enhance the predictive performance of ML models. Consequently, the subsequent feature selection process focuses on systematically ranking and selecting the most informative features across time-, quadrature-, and spectral-domains, thereby ensuring that the predictive models leverage the strongest indicators of imbalance severity.
The results (Table 2) indicate that a substantial subset of features exhibits highly significant variation across imbalance classes, with
To complement the statistical analysis, a model-driven feature selection was conducted using RFE with a RF classifier (100 estimators, random state = 42) as the base estimator. RF was selected due to its robustness to outliers, ability to model non-linear relationships, and provision of impurity-based importance scores for feature ranking. Feature subsets ranging from 65 down to 5 were evaluated using a 70–30 stratified train-test split, with accuracy on the test set serving as the primary performance metric.
The RFE evaluation (Fig. 6) revealed that the baseline 65-feature set achieved 0.9630 accuracy. Performance remained stable above 0.96 for subsets of 50–65 features, with peak accuracy of 0.9667 observed at both 55 and 39 features. A 20-feature subset preserved the baseline performance (0.9630) while achieving a 69% reduction in dimensionality, representing the optimal trade-off between accuracy, computational efficiency, and interpretability. Accuracy degraded more noticeably below 20 features, reaching 0.9353 at 5 features.
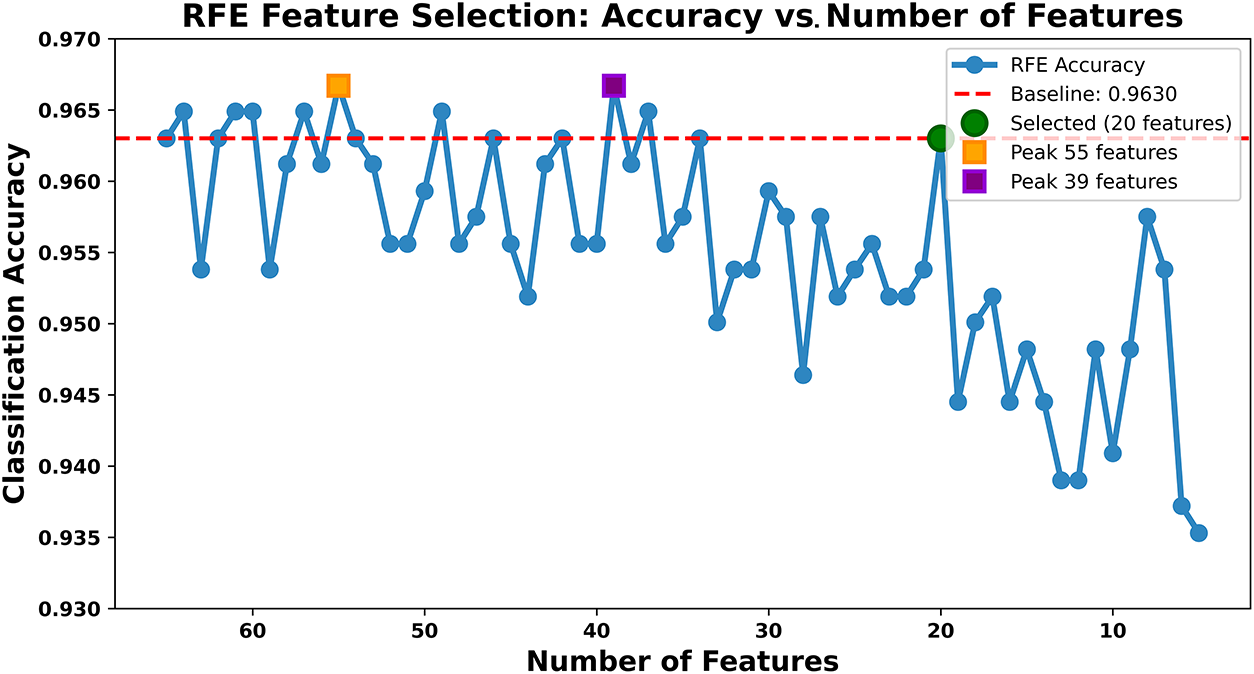
Figure 6: Classification accuracy across feature subset sizes obtained via RFE with Random Forest
To consolidate insights from both approaches, the top 20 features were ranked by combining (i) their statistical discriminative power (
Table 4 presents the integrated ranking. Features such as
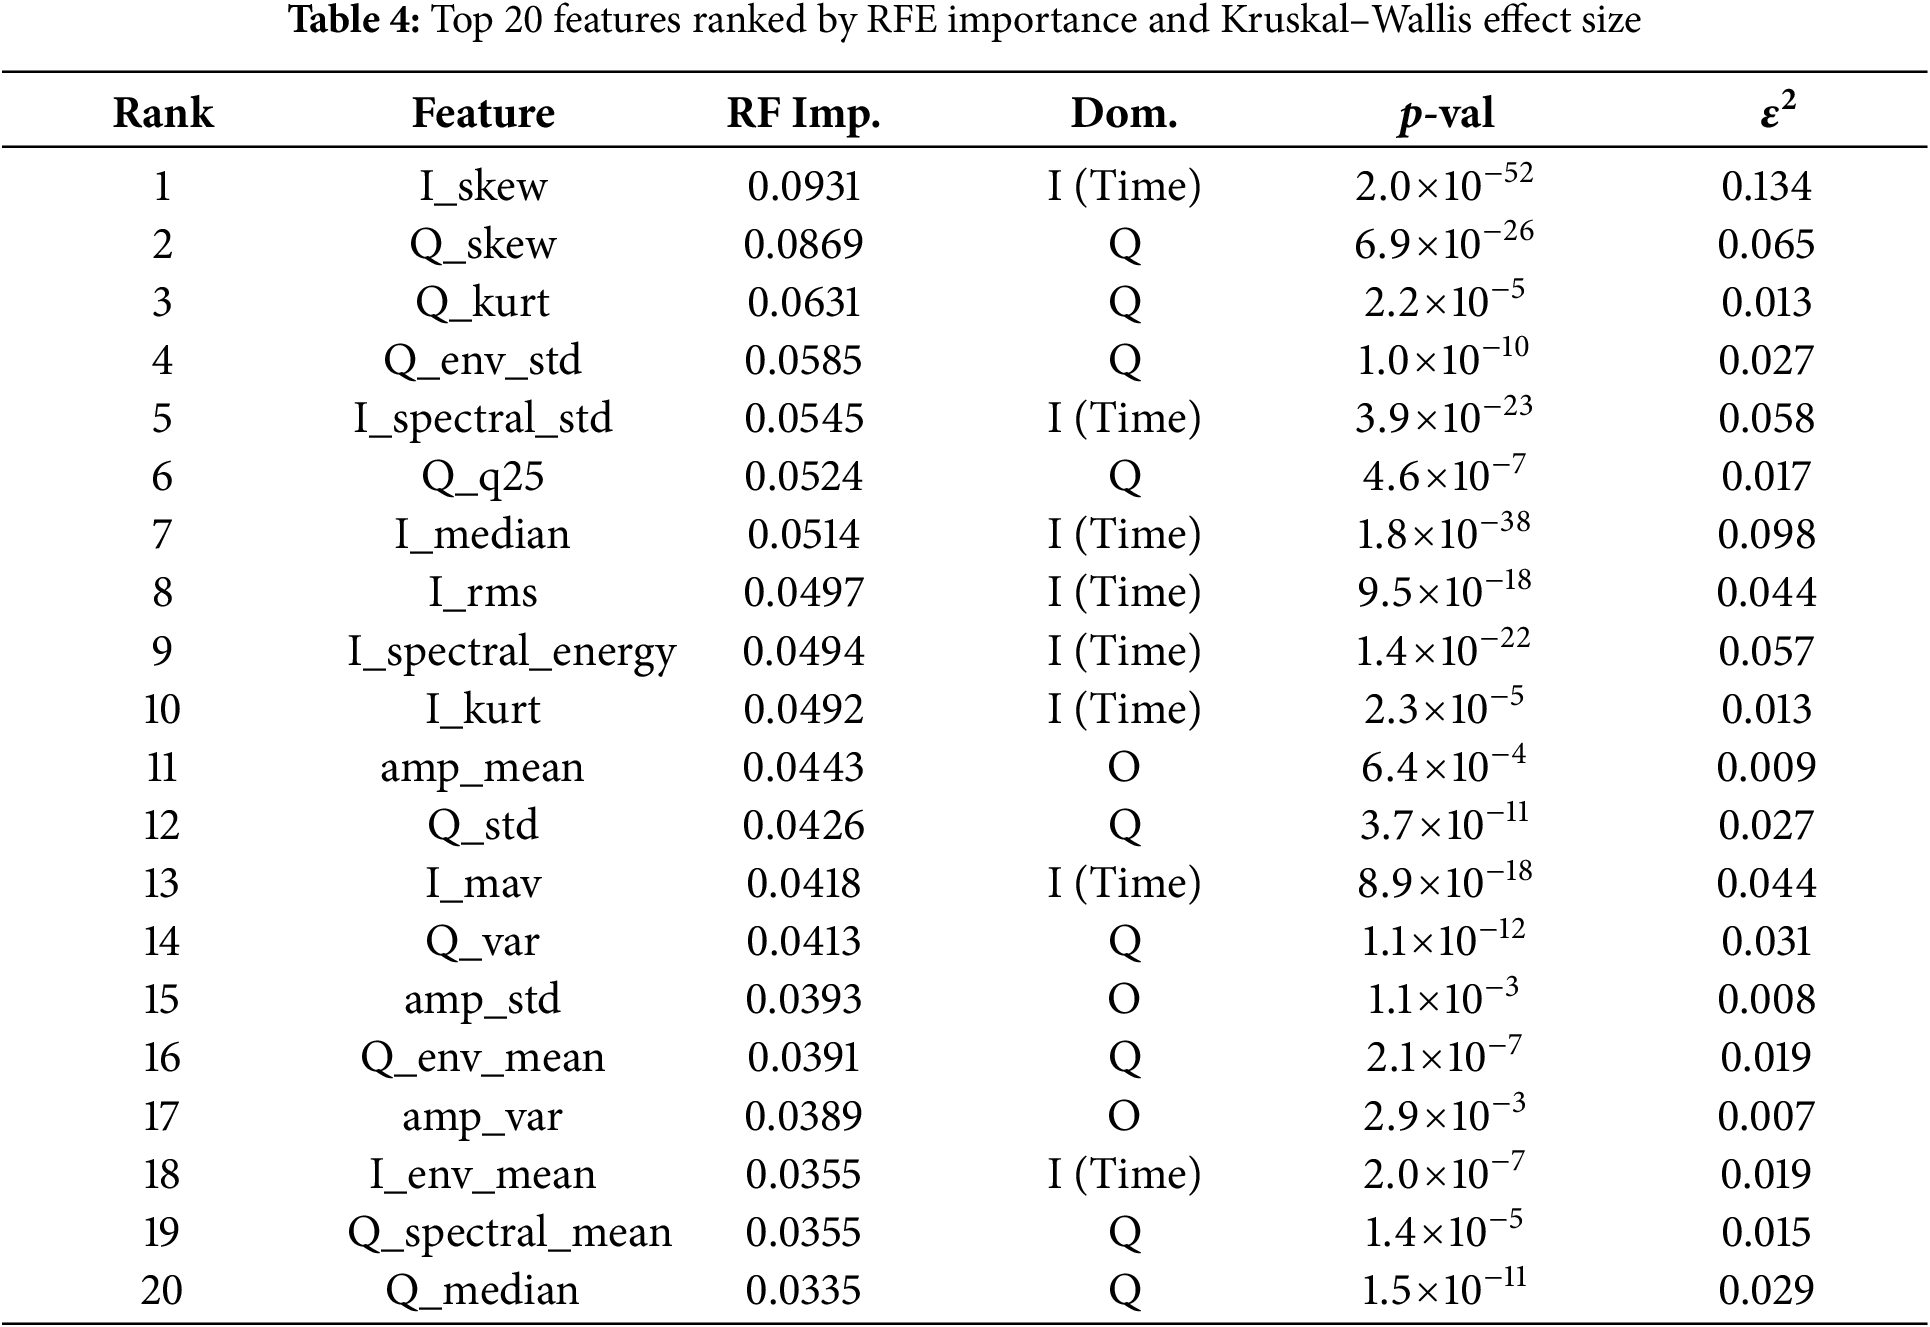
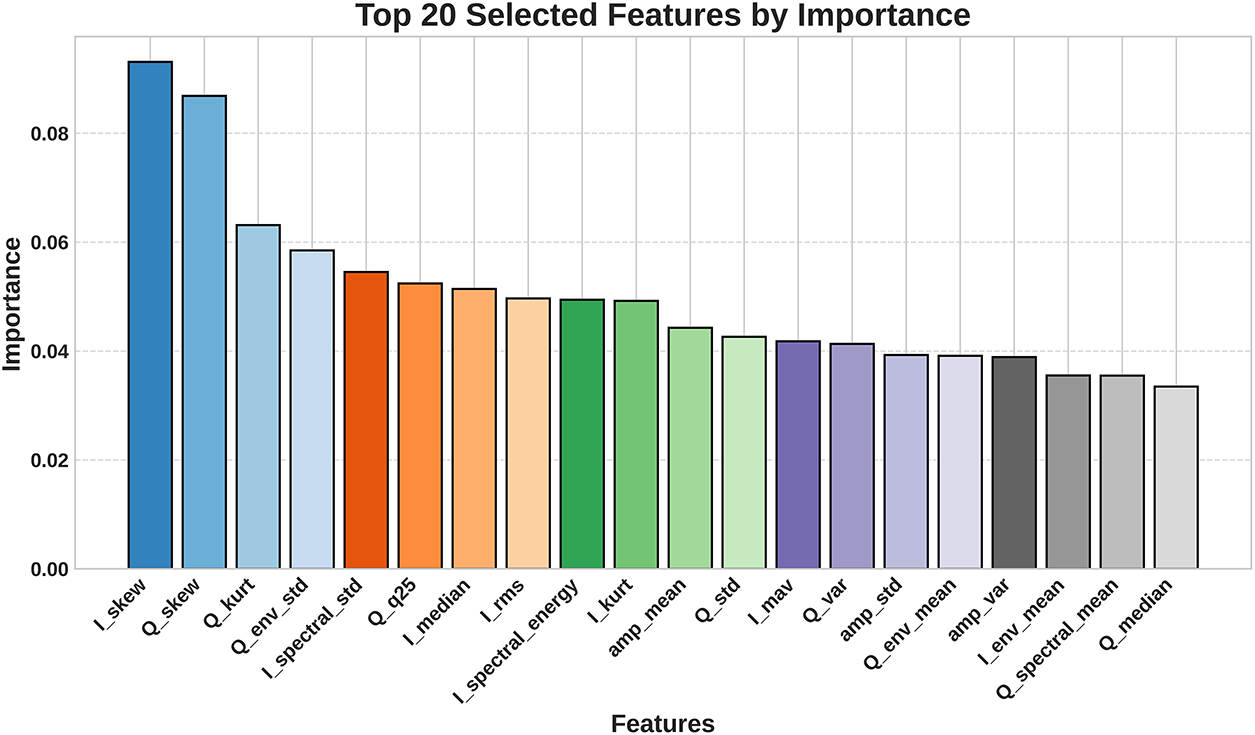
Figure 7: RF feature importance scores for the top 20 features selected by RFE
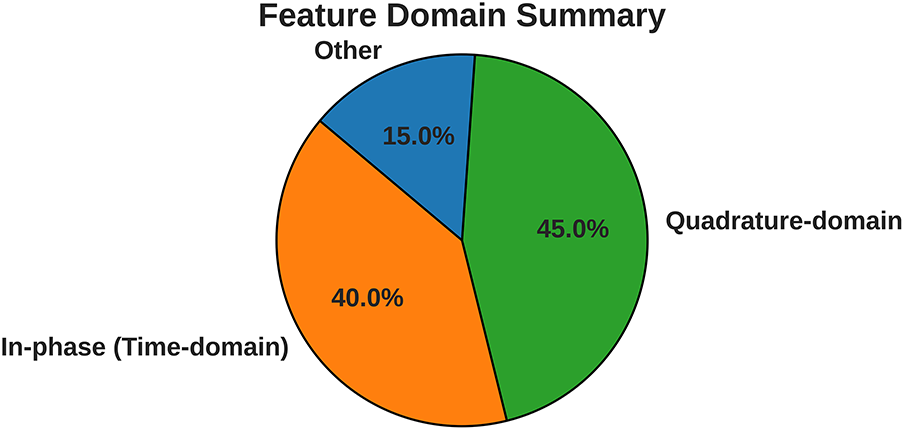
Figure 8: Domain distribution of the top 20 most important features
The convergence between Kruskal–Wallis effect sizes and RFE-based Random Forest importance confirms the robustness of the identified feature set. The selected 20 features are both statistically discriminative and practically effective in driving classification accuracy, supporting their use for efficient and interpretable imbalance detection.
7.1 Model Selection and Hyperparameter Optimization
The classification of motor imbalance was approached using multiple supervised learning algorithms trained on 20 discriminative features obtained through RFE. The models were selected to represent diverse learning paradigms, ensuring coverage of ensemble-based, boosting-based, kernel-based, and instance-based methods. Specifically, the algorithms considered were Random Forest (RF), ETC, Extreme Gradient Boosting (XGBoost), CatBoost, Support Vector Machine (SVM) with a radial basis function (RBF) kernel, and
RF and ETC are tree-ensemble methods that construct multiple decision trees, differing in their introduction of randomness: RF employs bootstrap sampling, while ETC introduces random feature splits. XGBoost and CatBoost are boosting algorithms that sequentially correct errors from prior learners, with XGBoost utilizing gradient-based optimization and regularization, and CatBoost incorporating ordered boosting with efficient handling of categorical features. The SVM with an RBF kernel was employed for its ability to model complex nonlinear class boundaries by projecting data into a higher-dimensional space. KNN, on the other hand, is a non-parametric method that classifies based on neighborhood proximity, providing a complementary baseline perspective.
Hyperparameter tuning for each algorithm was performed using grid search with 5-fold cross-validation to ensure robust parameter estimation. Table 5 presents the key hyperparameters explored and the selected values. The grid search was designed to balance model complexity, predictive accuracy, and computational efficiency.
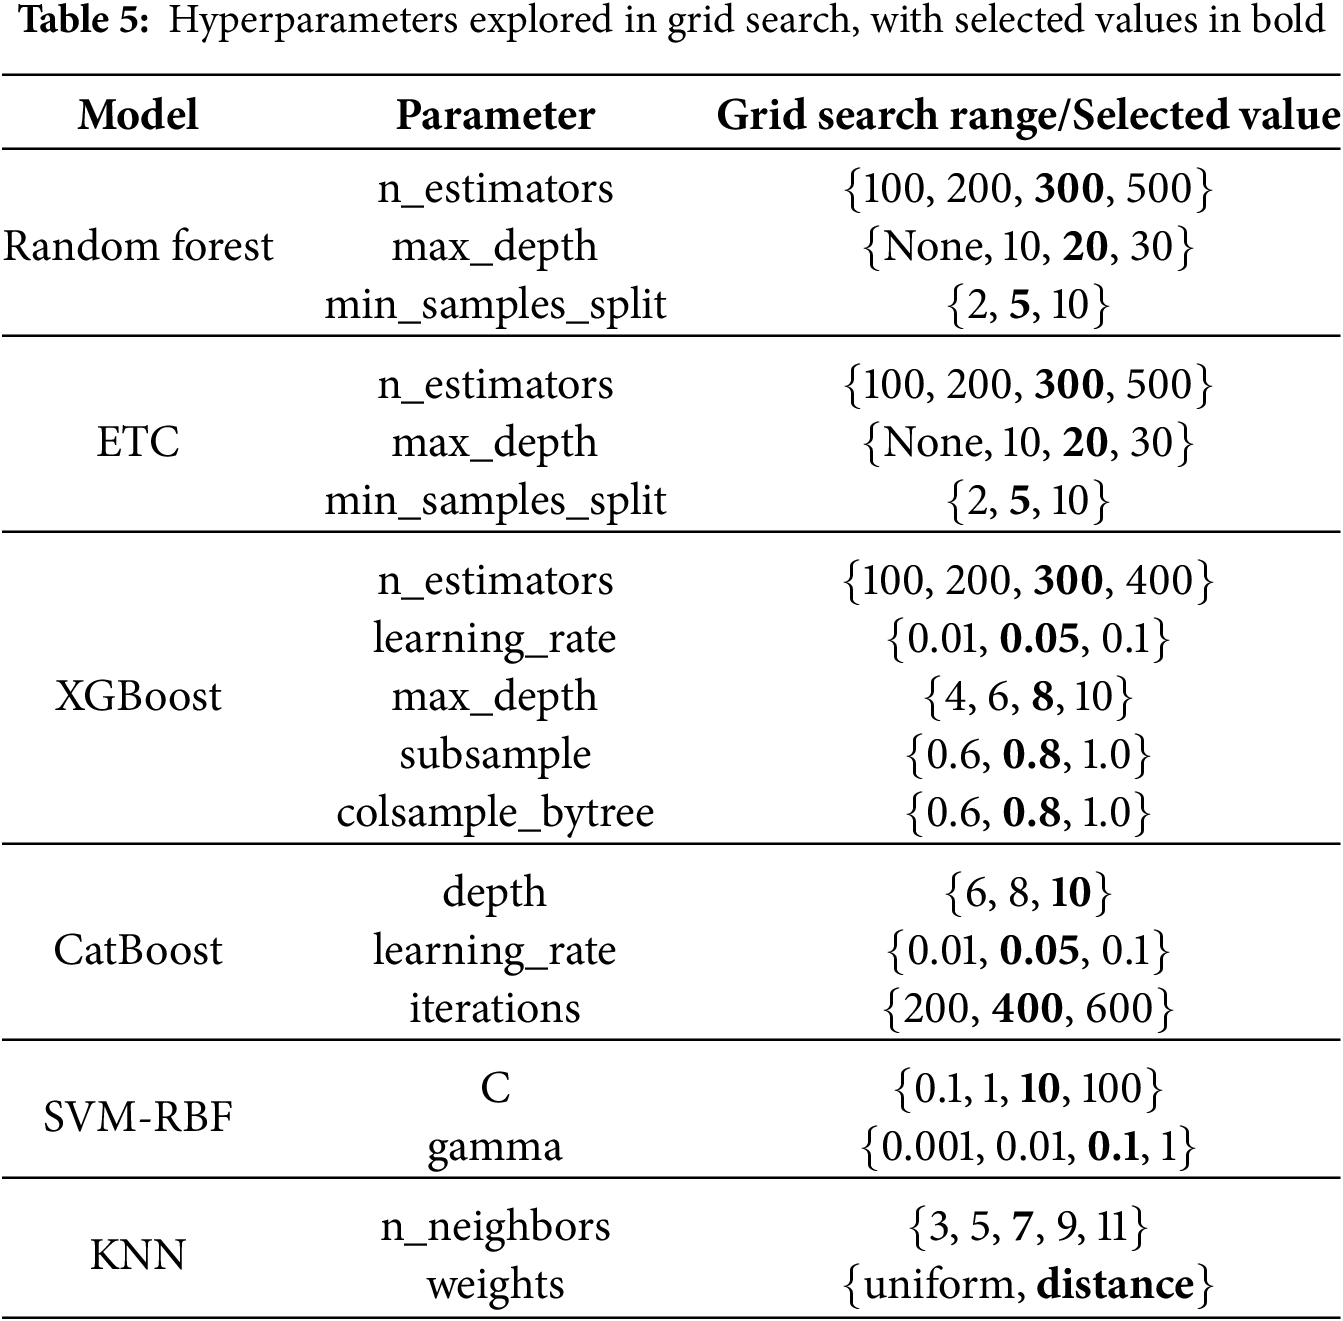
The hyperparameters serve distinct roles in shaping model behavior. For ensemble methods, the number of estimators defines the size of the forest, while maximum depth and minimum samples per split regulate tree complexity and generalization. In boosting algorithms, learning rate controls the contribution of each tree, while subsampling parameters in XGBoost mitigate overfitting through stochasticity. CatBoost’s depth parameter manages the bias-variance trade-off, with iterations determining boosting rounds. For SVM, the regularization constant C adjusts the trade-off between margin maximization and misclassification, while
The grid search procedure ensured that each model was configured at near-optimal settings, thereby enhancing the reliability of classification performance for motor imbalance detection.
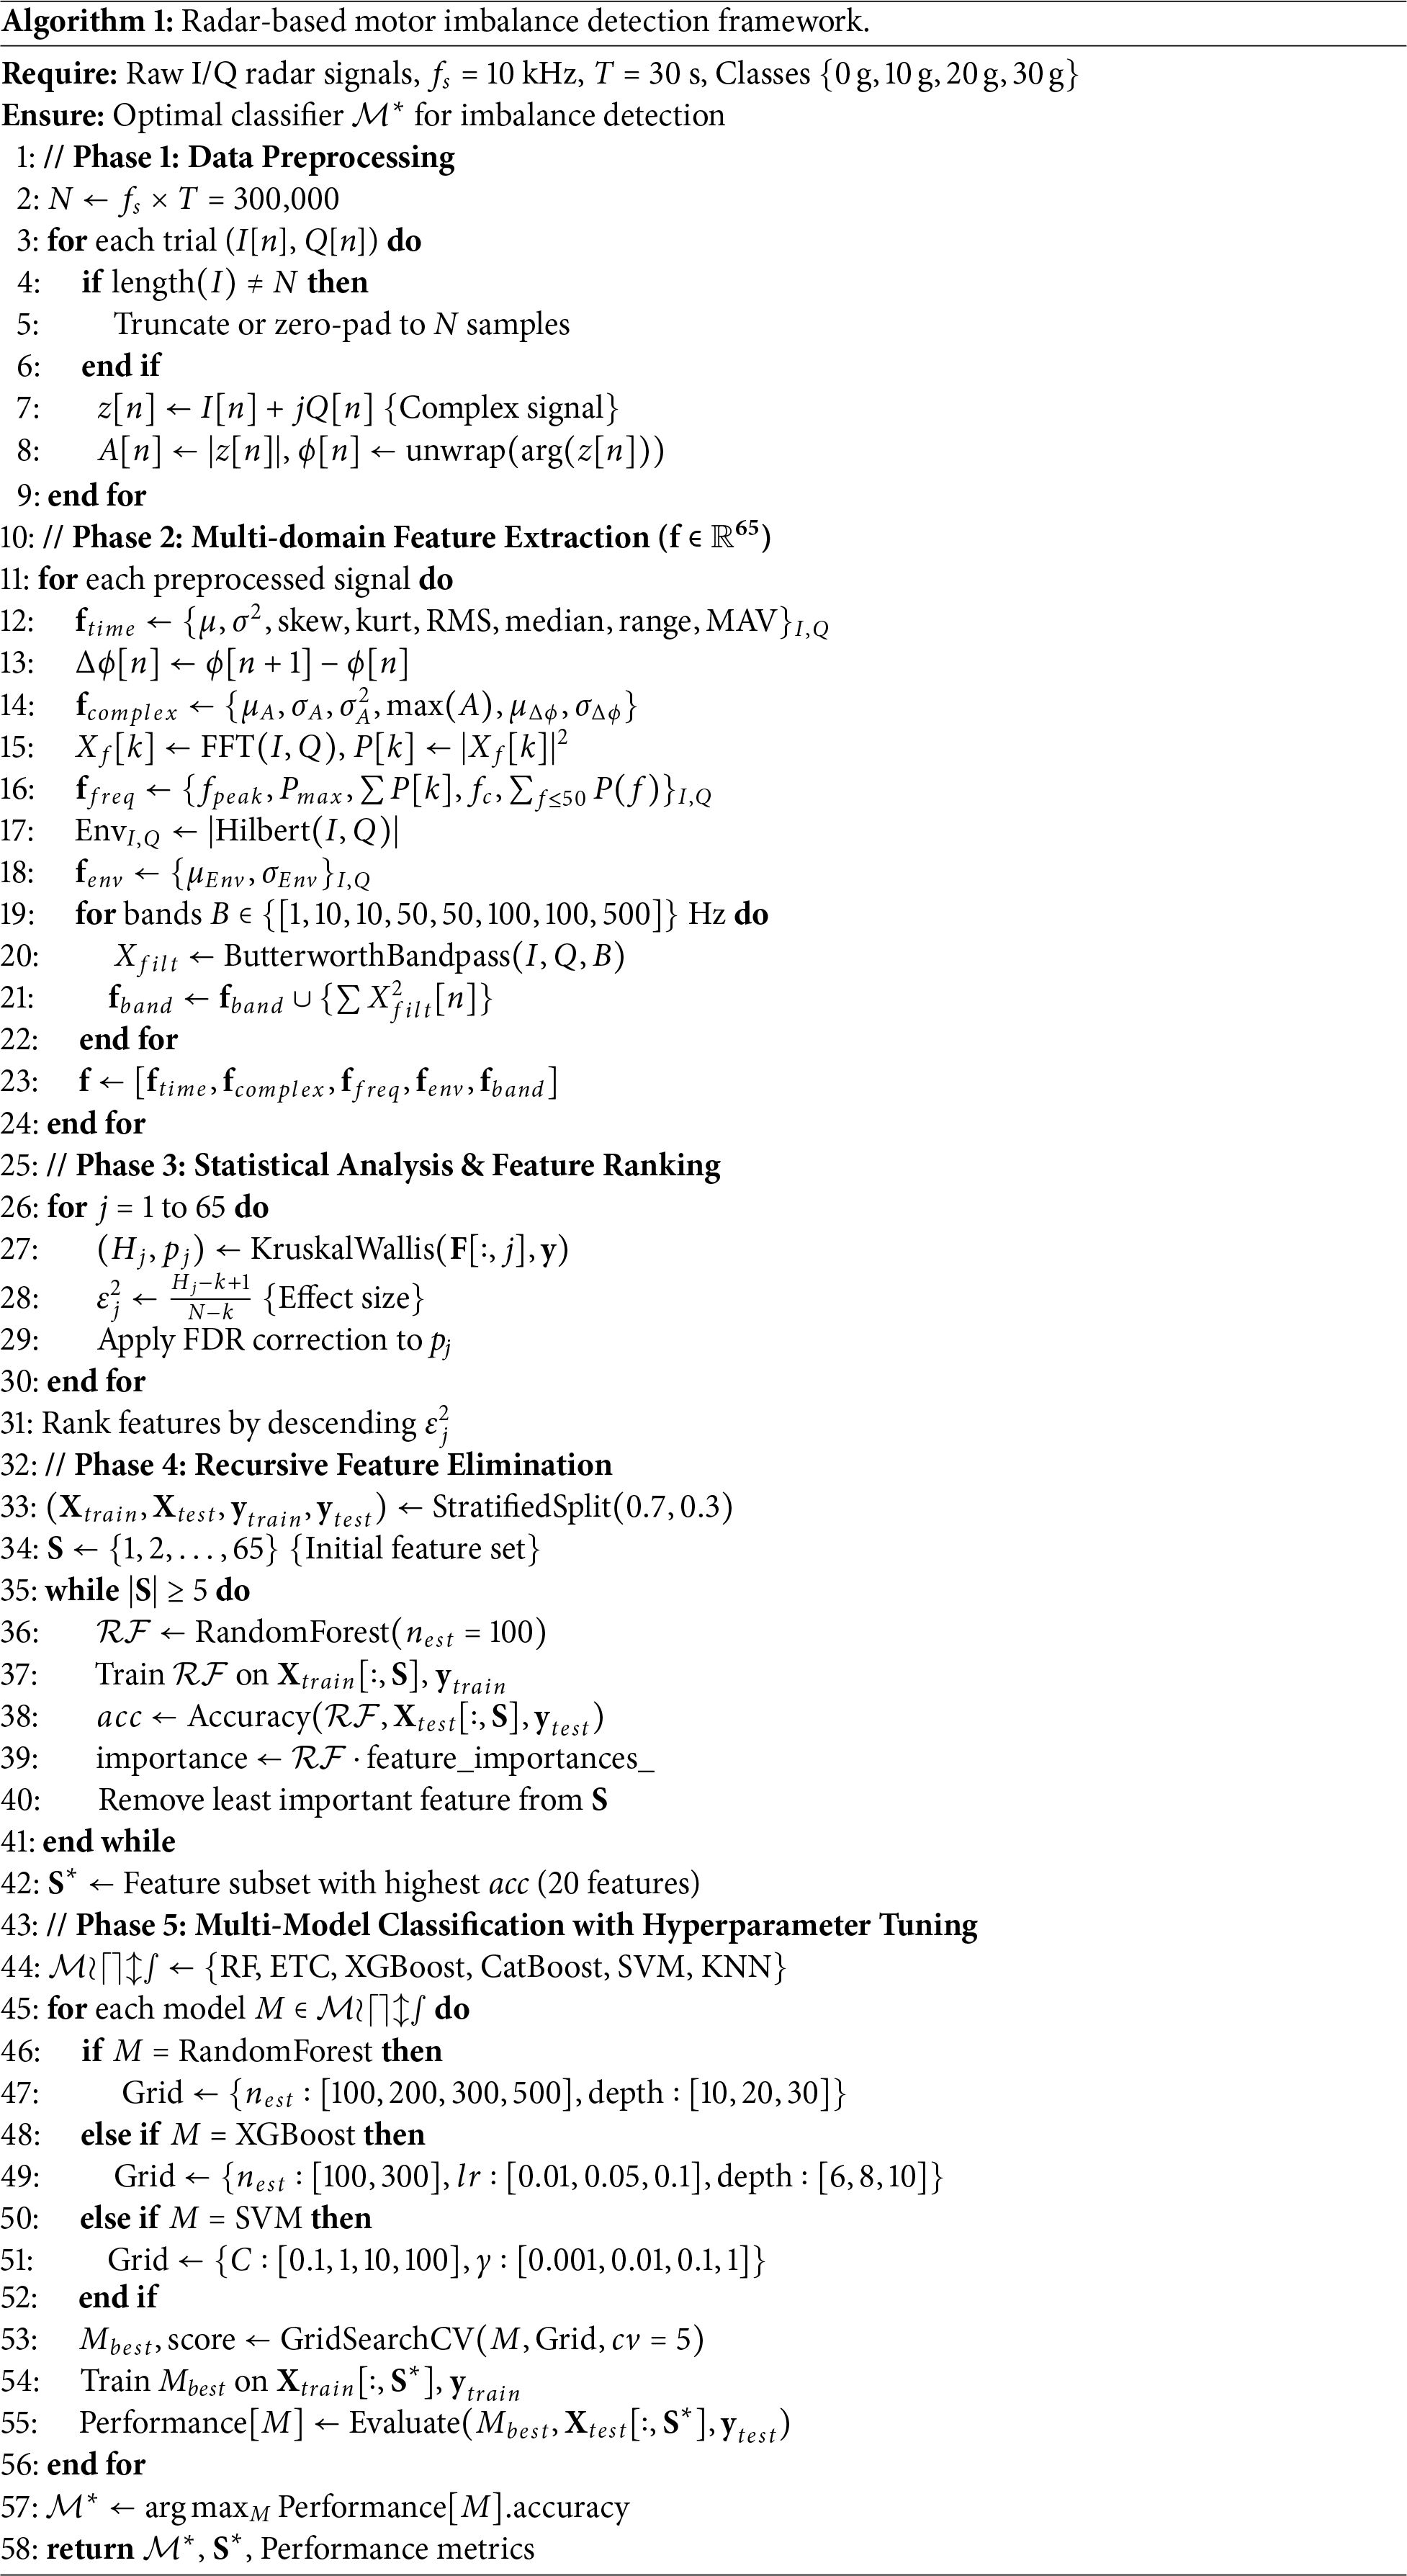
7.2 Algorithmic Framework for Radar-Based Motor Fault Classification
The complete framework for motor imbalance detection using radar signals is summarized in Algorithm 1. The process begins with data preprocessing, where raw in-phase (I) and quadrature (Q) signals are standardized to a fixed duration of
From each signal, 65 features are computed across multiple domains. Time-domain statistics such as mean, variance, skewness, kurtosis, RMS, median, and MAV are extracted for both I and Q. Complex features include amplitude statistics and phase-difference measures, while frequency-domain descriptors are obtained from the Fourier spectrum, including peak frequency, spectral centroid, and band-limited energy. Envelope features are derived using the Hilbert transform, and additional energy measures are extracted from band-pass filtered signals in the range of
To assess feature relevance, the Kruskal–Wallis test is applied across classes, with effect sizes and false discovery rate correction providing a ranked importance order. A recursive feature elimination strategy using Random Forest further refines the feature set by iteratively removing the least important features while monitoring classification accuracy. This process results in an optimal subset of 20 features that balances discriminative ability and dimensionality.
The reduced feature set is then used to train several ML models, including RF, ETC, XGBoost, CatBoost, SVM-RBF, and
The performance evaluation of the proposed radar-based motor imbalance detection framework was conducted using a stratified 70-30 train-test split to ensure representative class distribution across both training and testing sets. This partitioning strategy maintained the original class balance (0 g: 462 samples, 10 g: 464 samples, 20 g: 413 samples, 30 g: 463 samples) while providing sufficient training data for robust model development and adequate testing samples for reliable performance assessment.
Six ML algorithms were systematically evaluated using the optimal 20-feature subset identified through recursive feature elimination: RF, ETC, XGBoost, CatBoost, SVM-RBF, and KNN. Each model underwent hyperparameter optimization via grid search with 5-fold cross-validation to ensure fair comparison under optimal configurations.
8.1 Classification Performance Analysis
Table 6 presents the comprehensive performance evaluation across all tested algorithms. The results demonstrate substantial variation in both predictive accuracy and computational efficiency, with test accuracies ranging from 0.7002 to 0.9852.
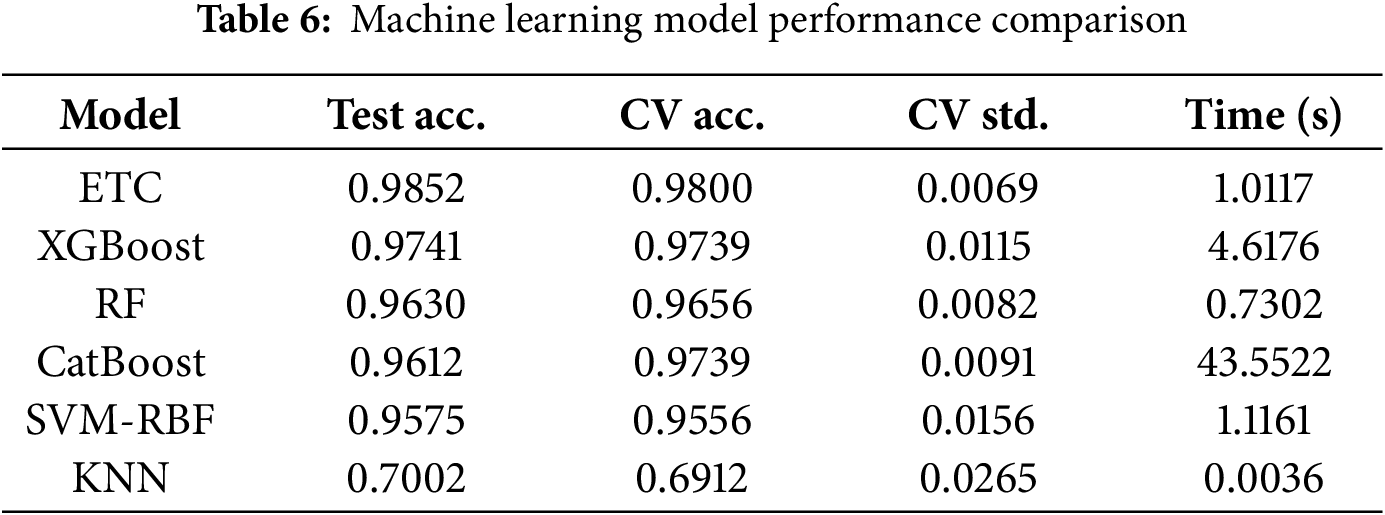
ETC emerged as the superior performer, achieving the highest test accuracy of 98.52% and cross-validation accuracy of 98.00% with low standard deviation (0.0069), indicating consistent performance across different data partitions. The model demonstrated exceptional computational efficiency with a training time of only 1.01 s, making it highly suitable for real-time industrial applications. XGBoost secured the second-best performance with test accuracy of 97.41% and cross-validation accuracy of 97.39%. While exhibiting slightly higher variance (0.0115) than ETC, XGBoost maintained strong predictive consistency. However, its training time of 4.62 s represents a 4.5
RF achieved competitive performance with 96.30% test accuracy and 96.56% cross-validation accuracy, coupled with the fastest training time (0.73 s). The model’s moderate variance (0.0082) and computational efficiency make it an attractive alternative for resource-constrained environments. Catboost demonstrated solid predictive capability (96.12% test accuracy, 97.39% CV accuracy) with the lowest cross-validation variance (0.0091), indicating highly stable performance. However, its training time of 43.55 s represents a significant computational burden, limiting practical deployment feasibility. SVM with RBF kernel achieved 95.75% test accuracy with 95.56% cross-validation performance. While computationally reasonable (1.12 s training time), the model exhibited the highest variance among competitive algorithms (0.0156), suggesting potential sensitivity to data variations.
KNN significantly underperformed with only 70.02% test accuracy and 69.12% cross-validation accuracy, accompanied by the highest variance (0.0265). Despite minimal training time (0.0036 s), the algorithm’s inability to effectively capture the complex patterns in radar-based imbalance signatures renders it unsuitable for this application.
ETC is selected as the optimal model based on its superior performance across multiple evaluation criteria. ETC achieved the highest test accuracy (98.52%) with a substantial 1.11 percentage point margin over the second-best XGBoost (97.41%). The cross-validation accuracy of 98.00% with low standard deviation (0.0069) demonstrates consistent performance across different data subsets, indicating robust generalization capability essential for industrial applications. The model’s training time of 1.01 s provides an optimal balance between accuracy and computational efficiency. While Random Forest achieves faster training (0.73 s), the 1.22 percentage point accuracy improvement justifies the marginal computational overhead. Compared to other high-performing models like XGBoost (4.62 s) and CatBoost (43.55 s), ETC offers significant time advantages.
8.2 Classification Performance of Top Models
The classification performance of the top three models, RF, XGBoost, and ETC, was evaluated using per-class precision, recall, and F1-score in addition to overall accuracy. These results provide a comprehensive assessment of each model’s ability to discriminate between imbalance severities and the normal condition. As shown in Table 7, all models demonstrate strong classification performance, with accuracies above 96%.
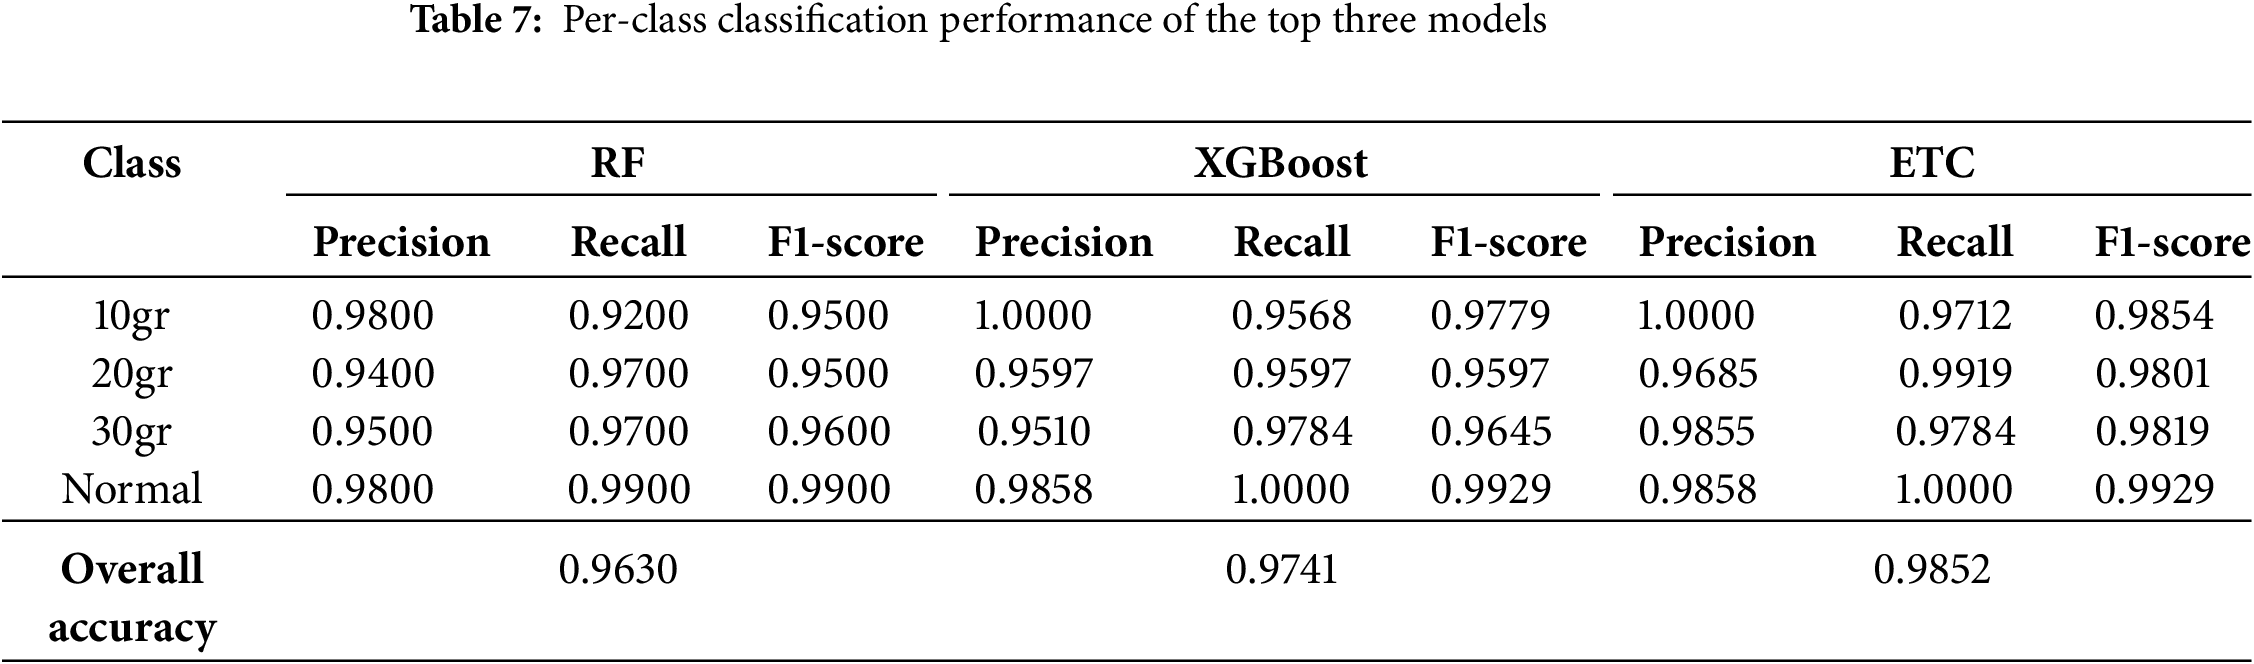
Among the evaluated models, ETC achieved the highest accuracy of 98.52% and exhibited the most balanced per-class metrics. Notably, ETC maintained precision and recall values above 97% across all classes, reflecting its robustness in identifying both mild and severe imbalance conditions without class-specific bias. This superior stability and consistency highlight its suitability for real-world deployment in industrial monitoring systems.
The performance of the top three classifiers is summarized in Fig. 9. For the RF model, the total number of correct predictions across all classes is 521, with 20 misclassifications distributed among the classes. Specifically, the 10gr class had 128 correct and 11 incorrect predictions, the 20gr class had 120 correct and 4 incorrect, the 30gr class had 135 correct and 4 incorrect, and the normal class had 138 correct and 1 incorrect prediction. XGBoost improved the overall accuracy, yielding 527 correct predictions with 14 misclassifications. The 10gr class had 133 correct predictions, 20gr had 119, 30gr had 136, and normal achieved 139 correct predictions. The ETC demonstrated the highest performance, with 533 correct predictions and only 8 misclassifications. Notably, the ETC achieved nearly perfect recognition for the normal class and consistently high performance for all imbalance levels, confirming its suitability as the optimal model for this radar-based motor imbalance detection task.
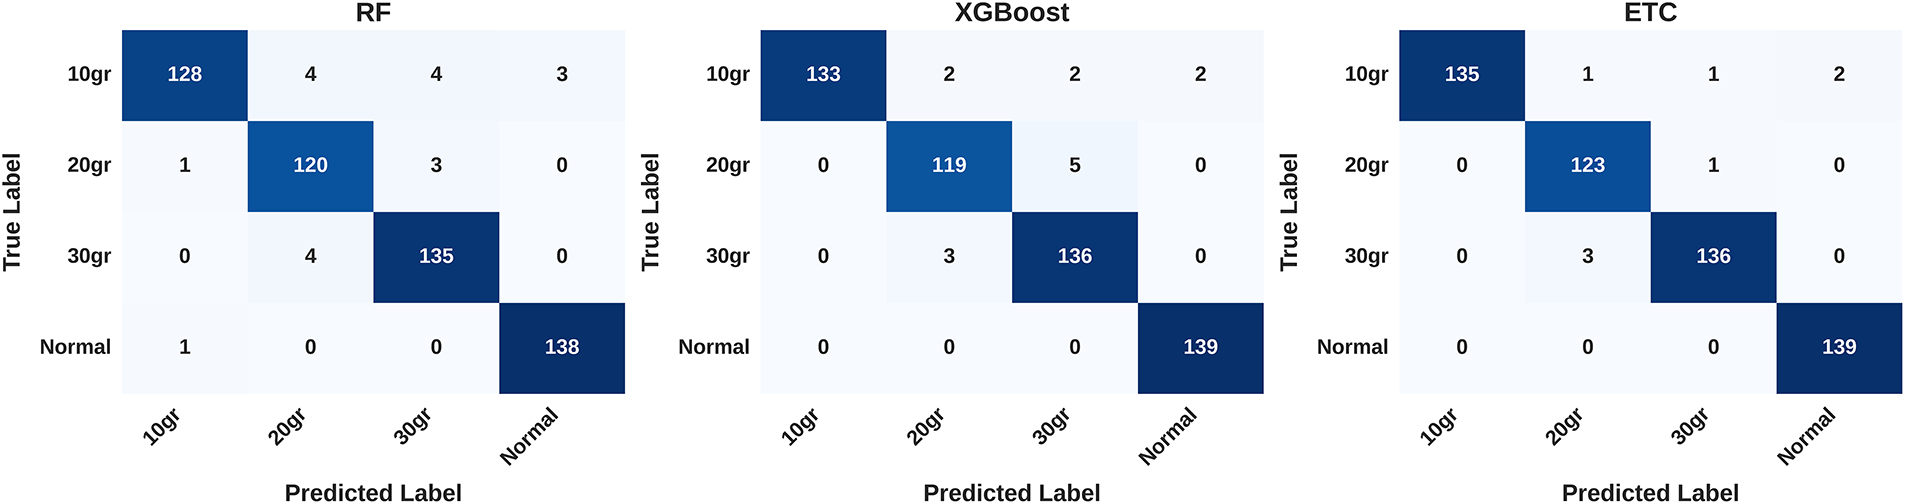
Figure 9: Confusion matrices of the top three classifiers RF, XGBoost and ETC
The diagonal dominance in ETC’s confusion matrix indicates robust classification capability, while the sparse off-diagonal entries show that misclassifications are minimal and mostly limited to adjacent imbalance levels. This observation highlights ETC’s reliability for industrial deployment where precise discrimination between motor imbalance severity levels is crucial for predictive maintenance, operational safety, and cost optimization.
8.4 Comparison with Deep Learning Baseline
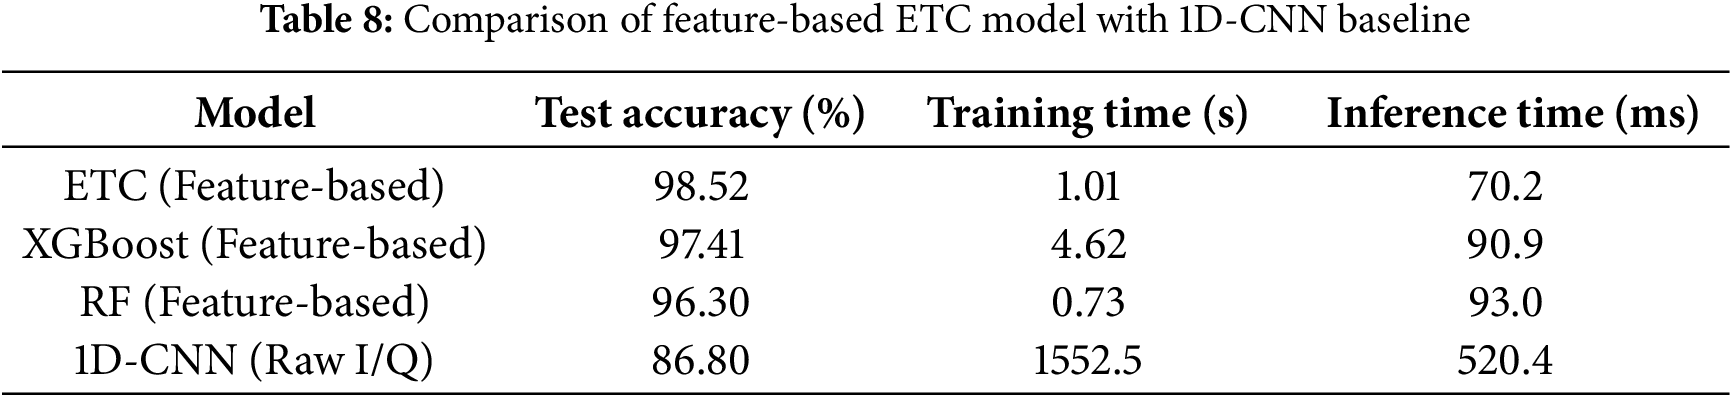
To validate the competitiveness of the proposed feature-based method, a one-dimensional convolutional neural network (1D-CNN) was trained directly on raw I/Q radar signals. The 1D-CNN consisted of three convolutional layers with ReLU activations, max-pooling layers, a fully connected layer, and a softmax output for the four imbalance classes. The network was trained using the same stratified 70-30 train-test split and preprocessing as the feature-based models.
Table 8 summarizes the performance of the 1D-CNN in comparison with the top feature-based models. The 1D-CNN achieved a test accuracy of 86.8%, which is slightly lower than the 98.52% achieved by the feature-based ETC model. While the CNN can automatically learn signal representations, the feature-based approach demonstrates superior accuracy and considerably faster training and inference times, highlighting its suitability for real-time industrial deployment.
8.5 Statistical Significance and Confidence Intervals
To substantiate the observed performance differences among the top feature-based models, we conducted statistical significance testing and computed confidence intervals. Paired t-tests were performed on the test accuracies and macro-averaged F1-scores obtained from five repeated stratified 70-30 train-test splits for the ETC, XGBoost, and RF models. The results indicate that the superior performance of ETC over XGBoost and RF is statistically significant (
Additionally, 95% confidence intervals were estimated using the bootstrap method with 1,000 resamples. Table 9 summarizes the mean test accuracy and macro F1-score along with their 95% confidence intervals for the top models. The results confirm that ETC consistently outperforms the other models, and the observed performance differences are statistically robust.
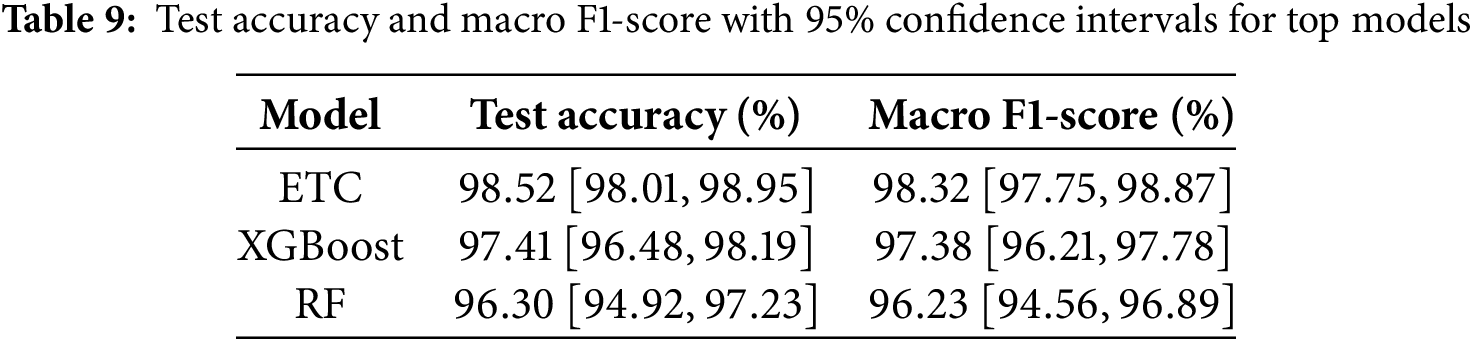
The confidence intervals clearly demonstrate that ETC’s superior performance is statistically significant compared to XGBoost and RF, reinforcing its suitability for reliable real-time radar-based motor imbalance detection.
An ablation study was conducted to assess the impact of distinct feature groups on classification performance for RF, XGBoost, and ETC. I and Q features, as well as other statistical or envelope-derived features, were evaluated individually and in combination. Using individual groups resulted in decreased accuracy; for instance, time-domain features alone yielded 0.8965 (RF), 0.9094 (XGBoost), and 0.9168 (ETC). Quadrature-domain features performed slightly better, whereas other features alone showed limited discriminative power.
Combining multiple feature groups significantly improved results. The combination of time- and quadrature-domain features achieved 0.9578 (RF), 0.9741 (XGBoost), and 0.9795 (ETC), while the complete 20-feature set produced the highest accuracy, with ETC reaching 0.9852. These results, illustrated in Fig. 10, confirm that integrating complementary feature domains enhances motor imbalance detection and that the selected 20-feature subset provides a balanced and discriminative representation.
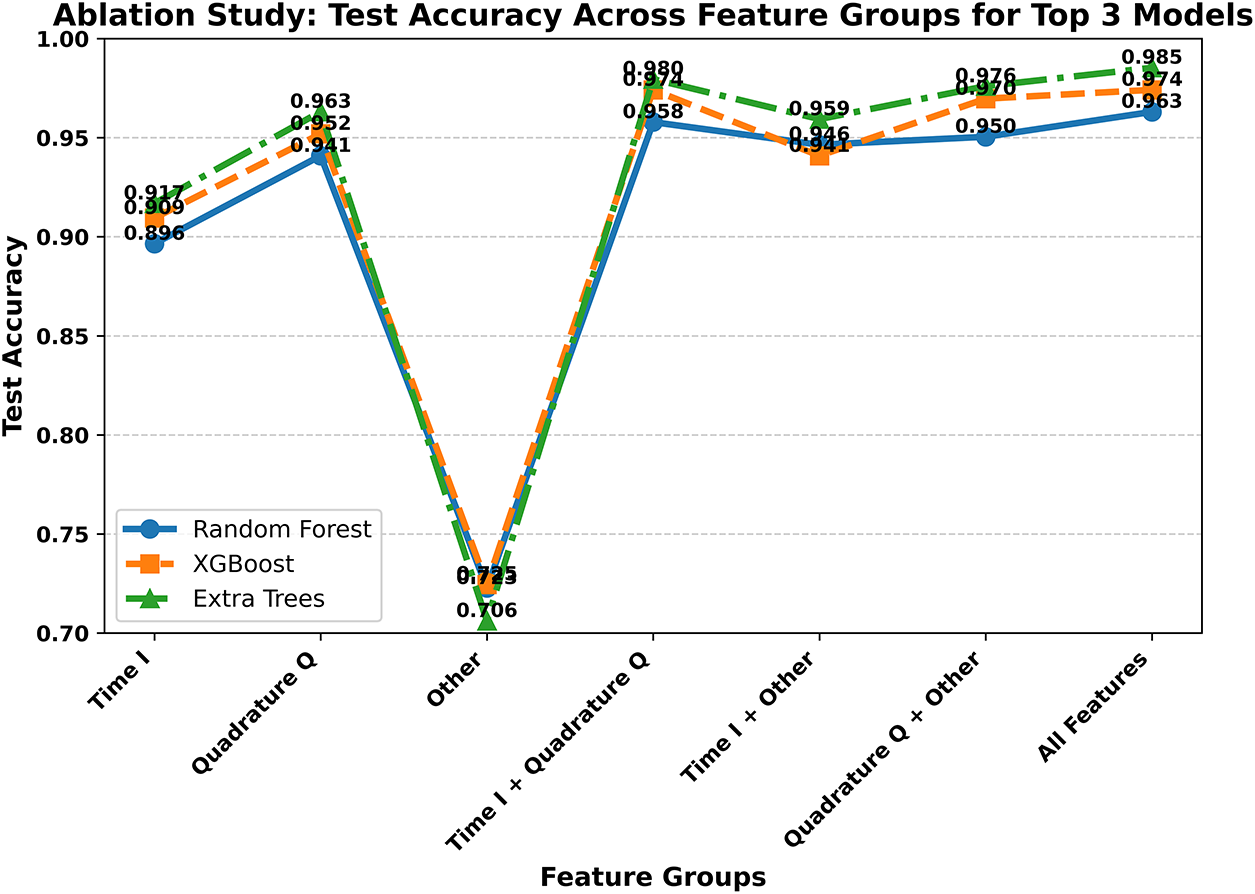
Figure 10: Ablation study showing test accuracy of top three classifiers on different feature groups
The inference time of the proposed models was measured by randomly selecting five signal trials from the dataset and results are visualized in Fig. 11. For each trial, the complete pipeline from feature extraction to classification was executed on the top three models. The ETC demonstrated the fastest performance with an average inference time of 70.176 ms per trial, followed by XGBoost at 90.941 ms, and RF at 92.990 ms. These results indicate that the ETC can provide near real-time imbalance detection, with offering the most computationally efficient solution while maintaining high classification accuracy.
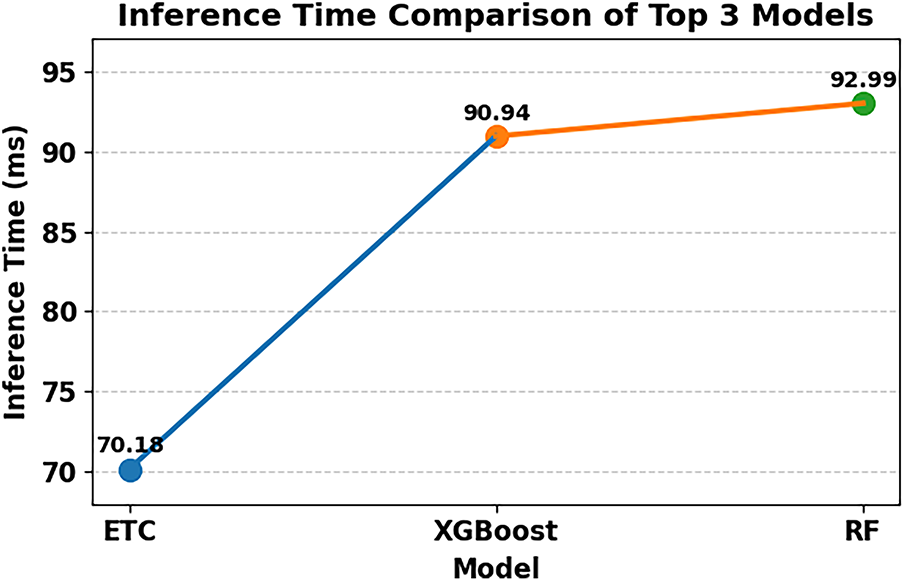
Figure 11: Comparison of inference times for the top three classification models
8.8 Comparison with Existing Studies
A comparative analysis (Table 10) of the proposed radar-based motor imbalance detection framework with existing studies in the literature highlights its advantages in terms of diagnostic accuracy, robustness, and practicality. Traditional vibration- and current-based approaches have reported high classification performance; however, they often require direct-contact sensors, are sensitive to noise and load variations, and face challenges with data imbalance. For example, CNN-based vibration analysis in [24] achieved 95%–96% accuracy with balanced data, but performance declined under imbalanced datasets, even after augmentation with deep DCGANs, which improved accuracy only to 90%. Similarly, the ResNet-CNN method in [25] reached 99.23% for binary classification but dropped to 95.15% for multiclass unbalance levels.
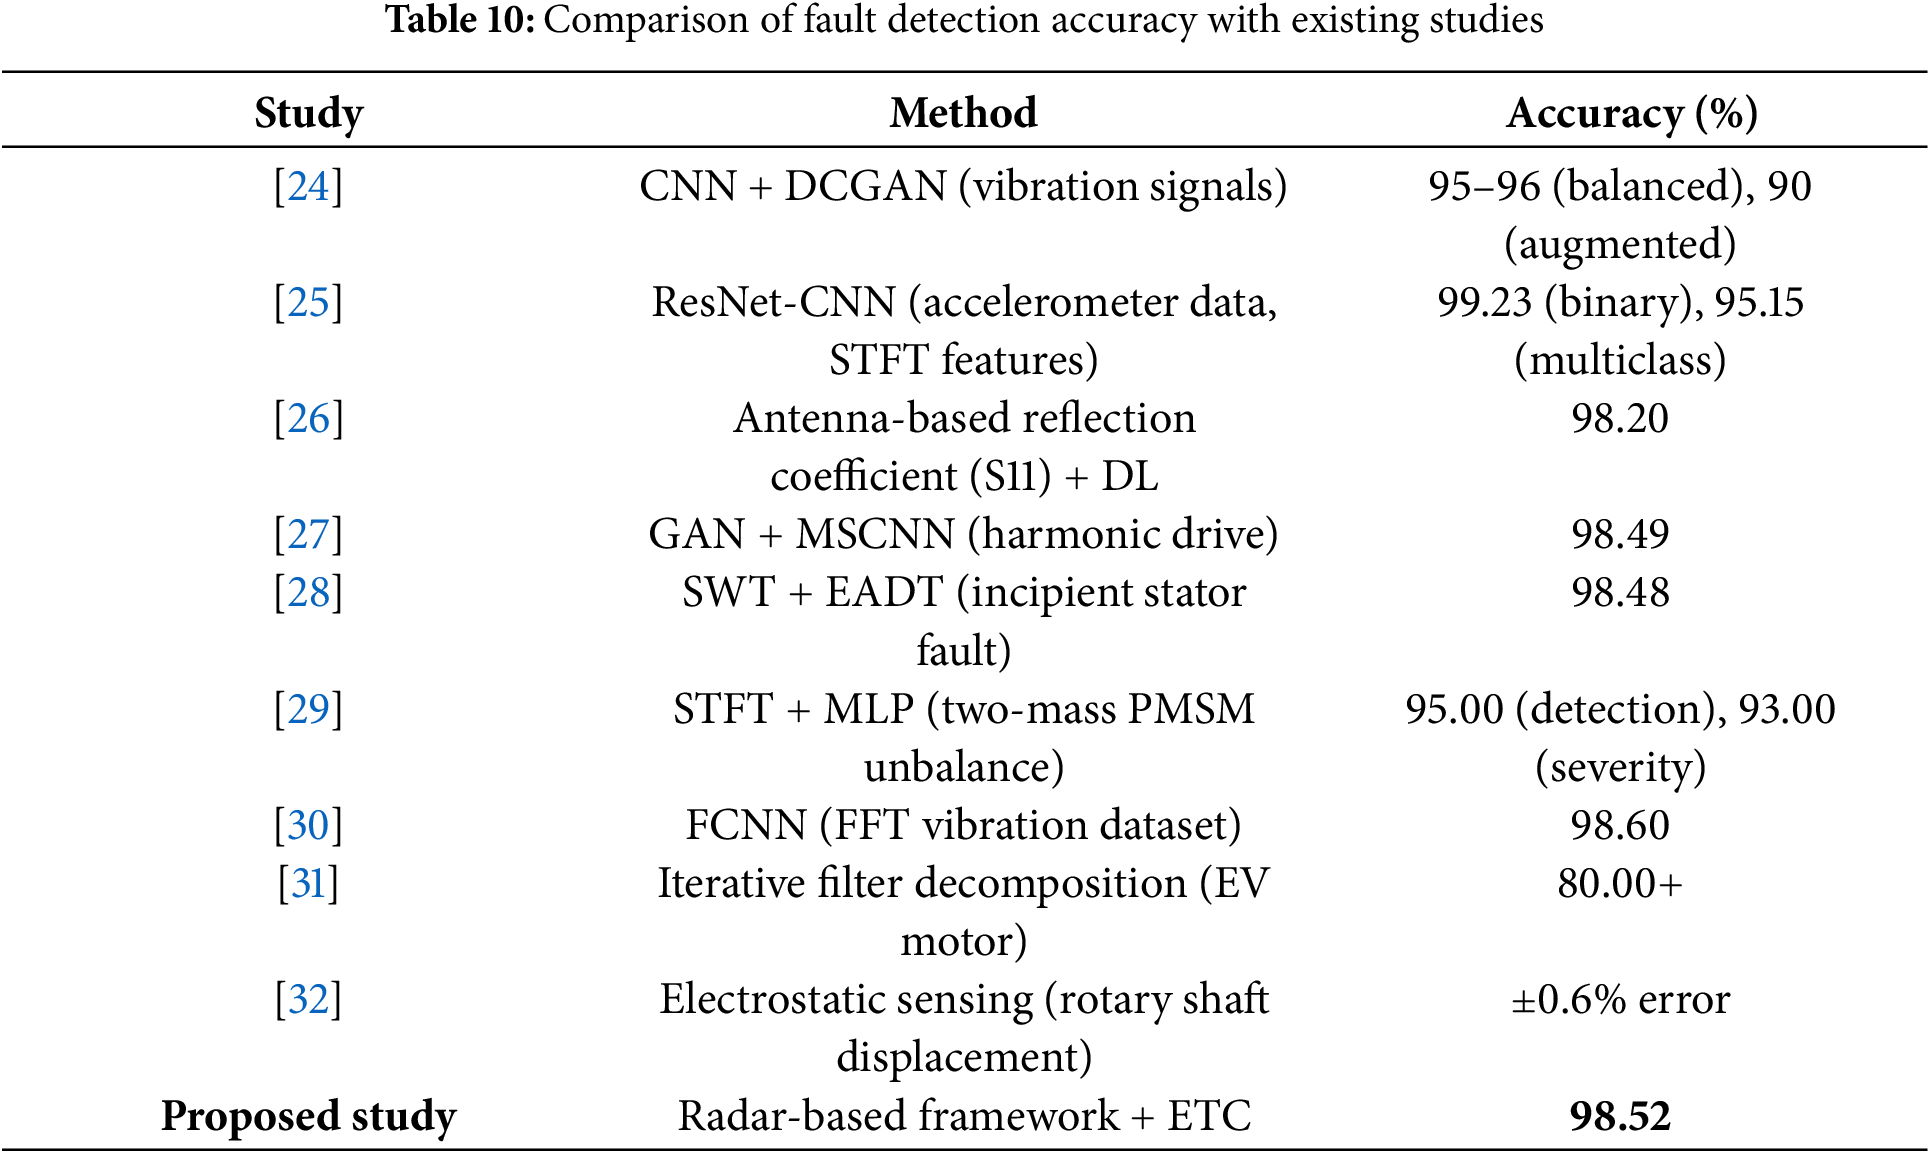
Alternative noninvasive methods such as antenna-based S11 measurements [26] and electrostatic sensing [32] demonstrated accuracies of 98.2% and error rates within
The comparative results in Table 10 indicate that the radar-based framework achieves competitive or superior classification accuracy compared to state-of-the-art methods. Importantly, it addresses key limitations of existing approaches by offering a noncontact sensing solution, strong robustness against imbalance-induced variations, and low inference latency suitable for real-time industrial deployment. This positions the framework as a practical advancement in motor fault diagnosis research.
The achieved classification accuracy of 98.52% with the ETC represents a significant advancement in radar-based motor fault diagnosis. This performance is comparable or superior to existing contact-based methods while eliminating their inherent limitations. The framework’s near real-time inference capability, with an average processing time of 70 ms, supports integration into industrial monitoring systems for continuous condition assessment. The non-contact operation avoids issues related to sensor mounting, mechanical coupling, and measurement artifacts that frequently compromise accelerometer-based approaches.
Analysis of the selected features indicates that current-domain descriptors, such as I_skew, I_median, and Q_skew, emerged as the most discriminative indicators, achieving effect sizes of 0.06–0.13 with p-values ranging from
To strengthen the clarity of novelty and competitiveness, a more explicit quantitative and qualitative comparison with related studies has been integrated. CNN-based vibration analysis methods typically achieve 95%–96% accuracy and up to 99.23% in binary settings, but require physical sensor contact and exhibit sensitivity to mounting conditions. Antenna-based S11 radar methods reach approximately 98.2% accuracy but depend heavily on precise antenna alignment. Electrostatic sensing approaches, while achieving errors within
The experimental design ensures dataset representativeness under realistic operating conditions, with controlled variation of motor speeds and load torques. Balanced class representation minimizes bias and provides sufficient statistical power for reliable model evaluation. The comprehensive feature extraction captures multiple aspects of motor dynamics, including amplitude statistics, spectral harmonics, and envelope modulation patterns, enhancing discriminative capability.
However, several limitations should be noted. All experiments were conducted under controlled laboratory conditions on a single motor type with controlled imbalance masses, which may limit generalizability to other motors or industrial settings. Variations in motor size, load conditions, bearing stiffness, and rotor dynamics could affect radar signal characteristics and feature distributions. Additionally, the current standoff distance of 30 cm was optimized for the lab setup and may require adaptation for space-constrained industrial installations. Furthermore, the framework focuses exclusively on mass imbalance, necessitating extension for comprehensive fault diagnosis, including misalignment, bearing defects, and electrical anomalies.
The radar-based framework offers substantial potential for industrial implementation, particularly in environments where traditional sensor placement is challenging or unsafe, such as chemical plants, high-temperature settings, or explosive atmospheres. The computational efficiency of the optimized 20-feature set and the ETC supports embedded deployment on industrial controllers or edge devices. The 70 ms inference time enables continuous monitoring without significant computational burden, and integration with existing condition monitoring systems can be achieved using standard communication protocols.
Future research directions include extending the approach to multi-fault diagnosis, validating performance across different motor types and operating conditions, and optimizing radar frequencies for enhanced fault sensitivity. Advanced signal processing, machine learning-based feature learning, and deep neural networks could further improve diagnostic accuracy and fault coverage. Distributed radar sensor networks may enable improved spatial resolution and fault localization, while long-term studies under varying environmental conditions would address robustness and reliability. Incorporating adaptive thresholds and uncertainty quantification could further strengthen industrial applicability. Overall the demonstrated effectiveness of radar-based motor imbalance detection establishes a foundation for broader exploration of microwave sensing in industrial condition monitoring, offering a non-invasive approach that could transform predictive maintenance practices.
This research demonstrates the effectiveness of a non-contact radar-based framework for motor imbalance detection, achieving 98.52% classification accuracy using an optimized 20-feature set and the Extra Trees Classifier. The approach leverages multi-domain feature extraction and systematic feature selection to capture subtle imbalance-induced signatures, providing robust and discriminative representation. The standoff radar sensing paradigm eliminates the complexity and mechanical coupling effects associated with traditional accelerometer-based methods, while the computationally efficient classifier supports near real-time monitoring. Experimental validation across 1802 trials under varying motor speeds and load conditions confirms the reliability and practical applicability of the framework. Compared with existing vibration-based and electrical-signal-based diagnostic techniques, the proposed radar approach offers competitive or superior accuracy while avoiding challenges related to sensor installation, electrical access, and susceptibility to environmental noise. These advantages align with recent trends in non-contact fault detection that emphasize robustness, safety, and ease of deployment. The study establishes radar-based sensing as a promising, scalable, and noninvasive solution for industrial motor condition monitoring and predictive maintenance. By demonstrating competitive performance relative to established techniques while highlighting clear pathways for future development, this work contributes a substantive step toward practical adoption of radar-based diagnostics in industrial environments.
Acknowledgement: The authors want to acknowledge the fund by Princess Nourah bint Abdulrahman University Researchers Supporting Project number (PNURSP2026R346). The authors would also like to acknowledge the support of Prince Sultan University, Riyadh Saudi Arabia for APC of this publication.
Funding Statement: This research was funded by Princess Nourah bint Abdulrahman University Researchers Supporting Project number (PNURSP2026R346), Princess Nourah bint Abdulrahman University, Riyadh, Saudi Arabia.
Author Contributions: The authors confirm contribution to the paper as follows: Study conception and design: Faten S. Alamri, Adil Ali Saleem, Hafeez Ur Rehman Siddiqui; Experiments: Faten S. Alamri, Adil Ali Saleem; Visualization: Amjad Rehman, Muhammad I. Khan; Validation: Adil Ali Saleem, Hafeez Ur Rehman Siddiqui, Amjad Rehman; Analysis and interpretation of results: Muhammad I. Khan, Adil Ali Saleem, Faten S. Alamri; Draft manuscript preparation: Faten S. Alamri, Adil Ali Saleem; Funding acquisition: Faten S. Alamri; Supervision: Amjad Rehman, Hafeez Ur Rehman Siddiqui. All authors reviewed the results and approved the final version of the manuscript.
Availability of Data and Materials: The dataset supporting the findings of this study is openly available in IEEE Dataport at: https://10.21227/3n2f-8z47 (Acar, Y. E., RADAR I/Q data for machinery imbalance detection, 2025).
Ethics Approval: Not applicapble.
Conflicts of Interest: The authors declare no conflicts of interest to report regarding the present study.
References
1. Ganeriwala S. Induction motor diagnostics using vibration and motor current signature analysis. In: Allen M, Blough J, Mains M, editors. Special topics in structural dynamics & experimental techniques, Volume 5 (SEM 2023). 5. Cham, Switzerland: Springer; 2024. p. 199–206. doi:10.1007/978-3-031-37007-6_21. [Google Scholar] [CrossRef]
2. Navarro-Navarro A, Biot-Monterde V, Ruiz-Sarrio JE, Antonino-Daviu JA. Current- and vibration-based detection of misalignment faults in synchronous reluctance motors. Machines. 2025;13(4):319. doi:10.3390/machines13040319. [Google Scholar] [CrossRef]
3. Liu Y, Bazzi AM. A review and comparison of fault detection and diagnosis methods for squirrel-cage induction motors: state of the art. ISA Trans. 2017;70(1):400–9. doi:10.1016/j.isatra.2017.06.001. [Google Scholar] [PubMed] [CrossRef]
4. Ertargin M, Orhan A, Yildirim O, Gurgenc T. Automated fault classification of asynchronous motor using mobile phone accelerometer and parallel residual CNN-GRU. Measurement. 2025;253(8):117539. doi:10.1016/j.measurement.2025.117539. [Google Scholar] [CrossRef]
5. Akkad K. Motor operational settings prediction for sustainable manufacturing facilities. IEEE Access. 2024;12:118185–94. doi:10.1109/access.2024.3447077. [Google Scholar] [CrossRef]
6. Mao H, Zuo H, Wang H. Electrostatic sensor application for on-line monitoring of wind turbine gearboxes. Sensors. 2018;18(10):3574. doi:10.3390/s18103574. [Google Scholar] [PubMed] [CrossRef]
7. Papathanasopoulos DA, Giannousakis KN, Dermatas ES, Mitronikas ED. Vibration monitoring for position sensor fault diagnosis in brushless DC motor drives. Energies. 2021;14(8):2248. doi:10.3390/en14082248. [Google Scholar] [CrossRef]
8. Nandi S, Toliyat HA, Li X. Condition monitoring and fault diagnosis of electrical motors—a review. IEEE Trans Energy Convers. 2005;20(4):719–29. doi:10.1109/tec.2005.847955. [Google Scholar] [CrossRef]
9. Liu X, Yan Y, Hu Y, Wang L. Optimization of electrostatic sensors for rotational speed measurement of a metallic rotor. IEEE Trans Instrum Meas. 2023;73:1–11. doi:10.1109/tim.2023.3342240. [Google Scholar] [CrossRef]
10. Ali MZ, Shabbir MNSK, Liang X, Zhang Y, Hu T. Machine learning-based fault diagnosis for single- and multi-faults in induction motors using measured stator currents and vibration signals. IEEE Trans Ind Appl. 2019;55(3):2378–91. doi:10.1109/tia.2019.2895797. [Google Scholar] [CrossRef]
11. Krishnaveni S, Raja SS, Jayasankar T, Babu PS. Analysis and control of the motor vibration using Arduino and machine learning model. Mater Today Proc. 2021;45(2):2551–5. doi:10.1016/j.matpr.2020.11.261. [Google Scholar] [CrossRef]
12. Daas A, Sari B, Jia J, Rigatos G. Enhancing induction machine fault detection through machine learning: time and frequency analysis of vibration signals. Measurement. 2025;242(4):116023. doi:10.1016/j.measurement.2024.116023. [Google Scholar] [CrossRef]
13. Kang M, Kim J-M. Singular value decomposition based feature extraction approaches for classifying faults of induction motors. Mech Syst Signal Process. 2013;41(1–2):348–56. doi:10.1016/j.ymssp.2013.08.002. [Google Scholar] [CrossRef]
14. Chai N, Yang M, Ni Q, Xu D. Gear fault diagnosis based on dual parameter optimized resonance-based sparse signal decomposition of motor current. IEEE Trans Ind Appl. 2018;54(4):3782–92. doi:10.1109/tia.2018.2821099. [Google Scholar] [CrossRef]
15. Santiago-Perez JJDe, Valtierra-Rodriguez M, Amezquita-Sanchez JP, Perez-Soto GI, Trejo-Hernandez M, Rivera-Guillen JR. Fourier-based adaptive signal decomposition method applied to fault detection in induction motors. Machines. 2022;10(9):757. doi:10.3390/machines10090757. [Google Scholar] [CrossRef]
16. Zhukovskiy Y, Buldysko A, Revin I. Induction motor bearing fault diagnosis based on singular value decomposition of the stator current. Energies. 2023;16(8):3303. doi:10.3390/en16083303. [Google Scholar] [CrossRef]
17. El Ouanjli N, Mahfoud S, Bhaskar MS, El Daoudi S, Derouich A, El Mahfoud M. A new intelligent adaptation mechanism of MRAS based on a genetic algorithm applied to speed sensorless direct torque control for induction motor. Int J Dyn Control. 2022;10(6):2095–110. doi:10.1007/s40435-022-00947-z. [Google Scholar] [CrossRef]
18. Dutta S, Basu B, Talukdar FA. Classification of motor faults based on transmission coefficient and reflection coefficient of omni-directional antenna using DCNN. Expert Syst Appl. 2022;198:116832. doi:10.1016/j.eswa.2022.116832. [Google Scholar] [CrossRef]
19. Esfahani ET, Wang S, Sundararajan V. Multisensor wireless system for eccentricity and bearing fault detection in induction motors. IEEE/ASME Trans Mechatron. 2013;19(3):818–26. doi:10.1109/tmech.2013.2260865. [Google Scholar] [CrossRef]
20. Hoang DT, Kang HJ. A motor current signal-based bearing fault diagnosis using deep learning and information fusion. IEEE Trans Instrum Meas. 2019;69(6):3325–33. doi:10.1109/tim.2019.2933119. [Google Scholar] [CrossRef]
21. Shao S-Y, Sun W-J, Yan R-Q, Wang P, Gao RX. A deep learning approach for fault diagnosis of induction motors in manufacturing. Chin J Mech Eng. 2017;30(6):1347–56. doi:10.1007/s10033-017-0189-y. [Google Scholar] [CrossRef]
22. Wang C-S, Kao I-H, Perng J-W. Fault diagnosis and fault frequency determination of permanent magnet synchronous motor based on deep learning. Sensors. 2021;21(11):3608. doi:10.3390/s21113608. [Google Scholar] [PubMed] [CrossRef]
23. Benninger M, Liebschner M, Kreischer C. Fault detection of induction motors with combined modeling- and machine-learning-based framework. Energies. 2023;16(8):3429. doi:10.3390/en16083429. [Google Scholar] [CrossRef]
24. Chang H-C, Wang Y-C, Shih Y-Y, Kuo C-C. Fault diagnosis of induction motors with imbalanced data using deep convolutional generative adversarial network. Appl Sci. 2022;12(8):4080. doi:10.3390/app12084080. [Google Scholar] [CrossRef]
25. Wisal M, Oh K-Y. A new deep learning framework for imbalance detection of a rotating shaft. Sensors. 2023;23(16):7141. doi:10.3390/s23167141. [Google Scholar] [PubMed] [CrossRef]
26. Dutta S, Basu B, Talukdar FA. Classification of induction motor fault and imbalance based on vibration signal using single antenna’s reactive near field. IEEE Trans Instrum Meas. 2021;70:1–9. doi:10.1109/tim.2021.3108230. [Google Scholar] [CrossRef]
27. Yang G, Zhong Y, Yang L, Tao H, Li J, Du R. Fault diagnosis of harmonic drive with imbalanced data using generative adversarial network. IEEE Trans Instrum Meas. 2021;70:1–11. doi:10.1109/TIM.2021.3089240. [Google Scholar] [CrossRef]
28. Almounajjed A, Sahoo AK, Kumar MK. Condition monitoring and fault detection of induction motor based on wavelet denoising with ensemble learning. Elect Eng. 2022;104(5):2859–77. doi:10.1007/s00202-022-01523-6. [Google Scholar] [CrossRef]
29. Ewert P, Pajchrowski T, Wicher B. Sensorless detection of mechanical unbalance in servodrive with elastic coupling. Energies. 2024;17(19):4859. doi:10.3390/en17194859. [Google Scholar] [CrossRef]
30. Mey O, Neudeck W, Schneider A, Enge-Rosenblatt O. Machine learning-based unbalance detection of a rotating shaft using vibration data. In: Proceedings of a 25th IEEE International Conference on Emerging Technologies and Factory Automation (ETFA); 2020 Sep 8–11; Vienna, Austria. p. 1610–7. doi:10.1109/ETFA46521.2020.9212000. [Google Scholar] [CrossRef]
31. Rosyadi I, Nazaruddin YY, Siregar PI. Unbalance fault diagnosis in electric motors under non-stationary load conditions: an iterative filter decomposition approach. In: Proceedings of a 8th International Conference on Instrumentation, Control, and Automation (ICA); 2023 Aug 9–11; Jakarta, Indonesia. p. 258–63. doi:10.1109/ICA58538.2023.10273105. [Google Scholar] [CrossRef]
32. Reda K, Yan Y. Vibration measurement of an unbalanced metallic shaft using electrostatic sensors. IEEE Trans Instrum Meas. 2019;68(5):1467–76. doi:10.1109/TIM.2018.2882900. [Google Scholar] [CrossRef]
33. Acar YE. RADAR I/Q Data for Machinery Imbalance Detection. Available from: https://ieee-dataport.org/documents/radar-iq-data-machinery-imbalance-detection. [Google Scholar]
34. Mirhosseini SF, Alaee-Kerahroodi M, Beltrao G, Schroeder U, BSM R. Phase unwrapping for heart and breathing rate estimation using mmWave FMCW radar. In: Proceedings of a European Signal Processing Conference (EUSIPCO); 2025 Sep 8–12; Palermo, Italy. p. 2567–71. [Google Scholar]
35. Xiong Y, Peng Z, Xing G, Zhang W, Meng G. Accurate and robust displacement measurement for FMCW radar vibration monitoring. IEEE Sens J. 2021;21(3):2567–78. doi:10.1109/jsen.2017.2778294. [Google Scholar] [CrossRef]
36. Wampler L. A Doppler radar lock-in demodulation algorithm for machine vibration sensing [master’s thesis]. Cambridge, MA, USA: Dept. Mech. Eng., Massachusetts Institute of Technology; 2023. [Google Scholar]
37. Shouran M, Elgamli E. Design and implementation of Butterworth filter. Int J Innov Res Sci Eng Technol. 2020;9(9):7975–83. [Google Scholar]
38. Shapiro SS, Wilk MB. An analysis of variance test for normality (complete samples). Biometrika. 1965;52(3–4):591–611. doi:10.1093/biomet/52.3-4.591. [Google Scholar] [CrossRef]
39. Yap BW, Sim CH. Comparisons of various types of normality tests. J Stat Comput Simul. 2011;81(12):2141–55. doi:10.1080/00949655.2010.520163. [Google Scholar] [CrossRef]
40. Thadewald T, Büning H. Jarque-Bera test and its competitors for testing normality-a power comparison. J Appl Stat. 2007;34(1):87–105. doi:10.1080/02664760600994539. [Google Scholar] [CrossRef]
41. Brys G, Hubert M, Struyf A. A robustification of the Jarque-Bera test of normality. In: Computational statistics. Berlin/Heidelberg, Germany: Springer-Verlag; 2004. p. 753–60. [Google Scholar]
42. Scholz FW, Stephens MA. K-sample Anderson-darling tests. J Am Stat Assoc. 1987;82(399):918–24. [Google Scholar]
43. Lewis PAW. Distribution of the Anderson–Darling statistic. Ann Math Stat. 1961;32(4):1118–24. doi:10.1214/aoms/1177704850. [Google Scholar] [CrossRef]
44. Marsaglia G, Marsaglia J. Evaluating the Anderson-Darling distribution. J Stat Softw. 2004;9:1–5. [Google Scholar]
45. McKight PE, Najab J. Kruskal–Wallis test. Corsini Encyclopedia Psychol. 2010;1:1–10. [Google Scholar]
46. Ostertagova E, Ostertag O, Kováč J. Methodology and application of the Kruskal-Wallis test. Appl Mech Mater. 2014;611:115–20. doi:10.4028/www.scientific.net/amm.611.115. [Google Scholar] [CrossRef]
47. Vargha A, Delaney HD. The Kruskal-Wallis test and stochastic homogeneity. J Educ Behav Stat. 1998;23(2):170–92. doi:10.3102/10769986023002170. [Google Scholar] [CrossRef]
Cite This Article
 Copyright © 2026 The Author(s). Published by Tech Science Press.
This work is licensed under a Creative Commons Attribution 4.0 International License , which permits unrestricted use, distribution, and reproduction in any medium, provided the original work is properly cited.
 Downloads
 Citation Tools