
 Submit a Paper
 Propose a Special lssue
 Open Access
ARTICLE

Automated Machine Learning for Fault Diagnosis Using Multimodal Mel-Spectrogram and Vibration Data
1 Guangdong Provincial Key Laboratory of Computer Integrated Manufacturing System, and State Key Laboratory of Precision Electronic Manufacturing Technology and Equipment, Guangdong University of Technology, Guangzhou, China
2 School of Mechatronics & Vehicle Engineering, East China Jiaotong University, Nanchang, China
3 Electronics & Drives Centers, Reutlingen University, Reutlingen, Germany
* Corresponding Authors: Zhuyun Chen. Email: ; Qiang Liu. Email:
(This article belongs to the Special Issue: Intelligent Dynamics Modeling, Predictive Operations & Maintenance, and Control Optimization for Complex Systems)
Computer Modeling in Engineering & Sciences 2026, 146(2), 16 https://doi.org/10.32604/cmes.2026.075436
Received 31 October 2025; Accepted 12 January 2026; Issue published 26 February 2026
 View Full Text
 Download PDF
Abstract
To ensure the safe and stable operation of rotating machinery, intelligent fault diagnosis methods hold significant research value. However, existing diagnostic approaches largely rely on manual feature extraction and expert experience, which limits their adaptability under variable operating conditions and strong noise environments, severely affecting the generalization capability of diagnostic models. To address this issue, this study proposes a multimodal fusion fault diagnosis framework based on Mel-spectrograms and automated machine learning (AutoML). The framework first extracts fault-sensitive Mel time–frequency features from acoustic signals and fuses them with statistical features of vibration signals to construct complementary fault representations. On this basis, automated machine learning techniques are introduced to enable end-to-end diagnostic workflow construction and optimal model configuration acquisition. Finally, diagnostic decisions are achieved by automatically integrating the predictions of multiple high-performance base models. Experimental results on a centrifugal pump vibration and acoustic dataset demonstrate that the proposed framework achieves high diagnostic accuracy under noise-free conditions and maintains strong robustness under noisy interference, validating its efficiency, scalability, and practical value for rotating machinery fault diagnosis.Keywords
In modern industry, rotating machinery constitutes the core component of many critical production processes, including aerospace, robotics, engines, and wind energy, all of which exert significant impacts on the national economy and human livelihood [1,2]. Due to the complexity of real operating conditions, studies have shown that components such as bearings are prone to failure, which may cause production interruptions and safety hazards, resulting in substantial economic losses and threats to personnel safety [3]. Therefore, fault diagnosis plays a crucial role in ensuring the reliability and safety of rotating machinery.
Traditional fault diagnosis methods mainly rely on vibration or acoustic signal analysis combined with manually extracted features in the time, frequency, and time-frequency domains [4,5]. Several studies have made progress in rolling bearing fault diagnosis. Altaf et al. [6] analyzed statistical characteristics of vibration signals in both the time and frequency domains to identify and classify bearing defects. Zhang et al. [7] detected fault features at different locations by modeling and simulating vibration signals and comparing them with experimental signals, validating the effectiveness of fault feature extraction. Łuczak [8] employed short-time fourier transform (STFT) and continuous wavelet transform (CWT) to extract transient components, enhancing local fault representation. Guo et al. [9] systematically studied signal characteristics in the time and time-frequency domains, prioritizing independent feature extraction followed by integration to improve diagnostic accuracy. Rotating machinery faults often manifest as transient events with rapidly varying frequencies, making it challenging for traditional time-frequency analysis techniques to accurately capture these features. Lin et al. [10] proposed the matching pursuit network, which can automatically extract robust and interpretable fault features in the time-frequency domain of complex and non-stationary mechanical signals. However, traditional methods exhibit limited feature extraction accuracy under complex operating conditions, vibration signals are easily contaminated by noise, and although acoustic diagnostics enable non-contact measurement, they are susceptible to high-frequency noise [11]. Moreover, Ma et al. [12] emphasized the limitations of conventional nonlinear filtering under high-frequency noise. These methods still depend on complex signal processing and manual features, increasing deployment and transfer costs [13]. Despite their interpretability, traditional signal processing methods heavily rely on expert knowledge, manual feature engineering, and prior mechanical information, which limits their adaptability and scalability under dynamic conditions. To overcome these limitations, data-driven fault diagnosis techniques based on machine learning (ML) and deep learning (DL) have been developed. Yang et al. [14] designed a multi-scale feature enhancement module and a convolutional feature fusion framework to improve diagnostic accuracy for rotating components. Hu et al. [15] developed a convolutional neural network (CNN)-based degradation assessment model and visualized degradation trajectories via t-distributed stochastic neighbor embedding (t-SNE) mapping. Hu et al. [16] further proposed a hybrid method combining compressed sensing and an improved multiscale network to enhance fault detection performance. Zarouan et al. [17] applied wavelet transform, residual networks, hybrid deep learning models, and gradient optimizer algorithm hyperparameter tuning for fault diagnosis. Zhang et al. [18] proposed a novel DL framework using transfer learning (TL) to optimize CNNs. Mahmoud et al. [19] combined pretrained residual networks with supervised ML to improve performance in noisy environments.
Despite their successes, ML and DL methods are computationally intensive, require large labeled datasets, and often lack interpretability, which limits industrial deployment. Wang et al. [20] proposed a method integrating quantum particle swarm optimization (QPSO), multiscale permutation entropy (MPE), and support vector machines (SVM) to improve fault recognition. Xia et al. [21] introduced a digital twin-based method with physical-virtual data fusion to enhance gearbox diagnosis under limited fault data by generating high-quality virtual vibration data. Xia et al. [22] developed a digital twin-driven partial domain fault diagnosis method by combining labeled virtual fault data with unlabeled physical data via adversarial transfer learning to achieve efficient diagnosis under limited labeled data. Xiang and Zhong [23] proposed a personalized shaft fault diagnosis method based on numerical simulation and intelligent techniques, employing finite element modeling, wavelet packet transform decomposition, and SVM classification to accurately detect imbalance, misalignment, and friction-impact faults. Gao et al. [24] introduced a gear fault detection method combining numerical simulation and generative adversarial networks (GANs) to expand fault samples for training multiple neural networks, enabling high-precision classification even with insufficient data. However, the following limitations remain: (1) feature engineering still relies on manual intervention for feature selection and extraction, which is time-consuming and requires high expertise; (2) traditional ML and DL algorithms commonly suffer from overfitting and insufficient generalization when handling high-dimensional, complex data; (3) although ML-based real-time fault detection and diagnosis (RT-FDD) offers advantages such as improved fault prediction accuracy, it faces challenges in data quality, model interpretability, and system integration, necessitating improvements in handling imbalanced datasets and extracting features from time-series data.
Automated machine learning (AutoML) refers to a set of techniques that simplify the application of ML to complex problems by automating many traditionally manual tasks, enabling the generation of more powerful ML solutions and extending their applicability [25]. AutoML automates all or part of the ML workflow, reducing human effort in model development and allowing domain experts to effectively leverage ML. Larocque-Villiers et al. [26] and Li et al. [27] developed AutoML-based methods for intelligent fault detection in bearings and gearboxes, respectively. Kefalas et al. [28] studied the application of AutoML for estimating the remaining useful life (RUL) of aircraft engines, while Nascimento and Lopes [29] investigated an IoT and AutoML framework for monitoring indoor thermal comfort and forecasting environmental indices. With the rapid development of AutoML, its capabilities in automated feature engineering, optimal model selection, and hyperparameter tuning significantly improve modeling efficiency and predictive performance. Compared with traditional methods, AutoML provides advantages in model optimization, autonomous feature construction, and task adaptability; however, its application in mechanical fault diagnosis still faces challenges such as high computational cost and limited model interpretability. In industrial scenarios with stringent safety and reliability requirements, the “black-box” nature of AutoML models remains a critical concern.
To address these challenges, this study proposes an AutoML-based multimodal fusion framework that integrates vibration and acoustic data to construct complementary diagnostic representations. Within this framework, the AutoML module autonomously performs feature engineering, model selection, and hyperparameter optimization, thereby realizing an end-to-end learning process that eliminates manual intervention and enhances model generalization. By incorporating Bayesian optimization and ensemble learning, the framework adaptively fuses multimodal features and achieves superior diagnostic accuracy and robustness, even under complex and noisy operating conditions. The main contributions of this paper are as follows.
(1) A multimodal fault diagnosis framework combining vibration and acoustic signals with AutoML is developed, achieving end-to-end automation of feature engineering, model selection, and hyperparameter optimization.
(2) The integration of PCA-based dimensionality reduction and the shapley additive explanations-base interpretability analysis enhances diagnostic transparency while reducing manual feature engineering effort by nearly 80%.
(3) By employing early feature fusion and a two-layer AutoML ensemble strategy, the proposed method attains an F1-score above 0.91 under 30% noise, demonstrating outstanding robustness and industrial applicability.
The remainder of this paper is organized as follows. Section 2 presents the theoretical background. Section 3 describes the methodology. Section 4 details the experimental design. Section 5 discusses the experimental results, and Section 6 concludes the study and provides directions for future research.
Fault diagnosis of mechanical systems involves analyzing operating condition data to identify potential faults, to improve equipment reliability, and minimize downtime. Typical fault types in rotating machinery include rolling bearing failures, gear wear, and shaft misalignment. These faults can be characterized through signal analysis and feature extraction techniques. For example, rolling bearing faults involve damage to the inner race, outer race, rolling elements, and cages, whose characteristic frequencies can be identified through vibration spectrum analysis [30]. Vibration signals directly reflect the operational state of mechanical components. When a fault occurs, attributes such as amplitude and frequency undergo significant changes. For instance, when a rolling bearing fails, vibration signals exhibit characteristic components associated with the fault frequency, which can be used to determine the type and severity of the fault. Acoustic signals also contain abundant fault-related information. Changes in their frequency distribution can indicate mechanical failures [31]. By combining vibration and acoustic signals in multimodal analysis, more comprehensive fault information can be obtained, thereby improving diagnostic accuracy [32]. Multimodal data fusion refers to integrating information from different sensors, such as vibration, acoustic, and temperature signals, to enhance both diagnostic accuracy and robustness, though challenges such as data alignment and feature fusion must be addressed [33].
Feature extraction is a critical step in transforming raw signals into meaningful diagnostic information. The core objective is to capture key characteristics of the signal using specific techniques. In existing research, feature extraction methods can generally be classified into three categories, namely time-domain analysis, frequency-domain analysis, and joint time–frequency analysis.
(1) Time-domain analysis
Time-domain analysis forms the foundation of signal processing. It describes the overall properties of signals in the time dimension using statistical measures and is well-suited for preliminary evaluation of equipment stability. Commonly used statistical indicators include Mean, Variance, and Crest factor.
Mean is the arithmetic average of sampled values, representing the baseline vibration energy of the system. A higher mean often indicates elevated vibration amplitude due to increased mechanical excitation.
Variance is used to measure signal fluctuation. It reflects the deviation of signal values from the mean. In a healthy state, equipment typically exhibits stable operation with concentrated vibration energy, resulting in relatively low variance. When localized defects such as pitting occur in bearings, impact shocks cause energy dispersion, leading to a significant increase in variance.
Crest factor is defined as the ratio of the peak value to the root mean square (RMS) value. It indicates the prominence of peak components relative to the overall energy distribution. Under normal operating conditions, vibration signals are relatively stable, and energy distribution is uniform, resulting in modest crest factors. When transient shocks occur, such as localized spalling in bearings, large peaks arise, and the crest factor exhibits significant variation. Collectively, these time-domain indicators describe the signal’s amplitude stability, fluctuation, and impulsiveness, providing essential cues for fault detection.
(2) Frequency-domain analysis
Frequency-domain analysis is essential for fault localization in rotating machinery. The Fourier transform is typically employed to convert time-domain signals into frequency-domain representations, thereby revealing characteristic fault frequencies and energy distribution. For example, in centrifugal pump bearings, the fault frequency of the inner race can be calculated. The energy variations of these fault-related frequency components can be quantified by indicators such as spectral peaks, energy distribution, and spectral entropy.
The spectral peak represents the maximum absolute value of the spectrum, as expressed in Eq. (1).
Energy distribution is defined as the squared amplitude of the spectrum, as shown in Eq. (2). It reflects the proportion of energy contained in each frequency component.
Spectral entropy is a measure of the disorder in energy distribution, as given in Eqs. (3) and (4), and measures the degree of uncertainty or randomness in the spectral energy distribution. A low entropy value signifies that the vibration energy is concentrated at a few characteristic frequencies, which often correspond to periodic impacts caused by bearing or gear defects. Conversely, higher entropy indicates dispersed spectral energy, reflecting irregular or noise-dominated operation. Therefore, spectral entropy serves as an important quantitative indicator for identifying fault-related periodicity in the frequency domain.
In these equations, denotes the frequency of the signal, while represents the frequency-domain expression of the time-domain signal, reflecting the amplitude and phase information of the signal at frequency.
This study proposes a multimodal fault diagnosis method based on automated machine learning. The overall framework is illustrated in Fig. 1. The method begins with the synchronous acquisition and preprocessing of vibration and acoustic signals from a centrifugal pump, where Gaussian noise of varying intensity is introduced to simulate interference in real industrial conditions. In the feature extraction stage, time–frequency statistical features such as mean, variance, and crest factor are extracted from the vibration signals, while 128-dimensional Mel-frequency cepstral coefficients are derived from the acoustic signals using a Mel filter bank to emphasize fault-related high-frequency components. An early fusion strategy is adopted to integrate multimodal information by directly concatenating the 128-dimensional vibration and acoustic features into a 256-dimensional composite feature vector. The features are normalized using a min–max scaling approach to ensure consistent magnitudes. Based on this unified representation, the AutoML platform performs fully automated feature engineering. Missing values are imputed using the median method, principal component analysis is applied to retain 95 percent of the data variance for dimensionality reduction, and recursive feature elimination combined with correlation analysis is used to automatically select the most discriminative feature subset. During model training, multiple base learners, including LightGBM, XGBoost, and random forest, are trained in parallel. A Bayesian optimization algorithm guided by a Gaussian process surrogate model is employed to automatically search for the optimal hyperparameter configuration, and an early stopping mechanism is applied to prevent overfitting. Finally, a two-layer ensemble strategy is used to integrate model predictions, where the first layer adopts soft voting weighted by validation performance, and the second layer utilizes a logistic regression meta-learner for stacking to fully exploit the complementary advantages of different models. The resulting model exhibits high robustness and classification accuracy, significantly enhancing generalization capability and diagnostic reliability under noisy conditions.
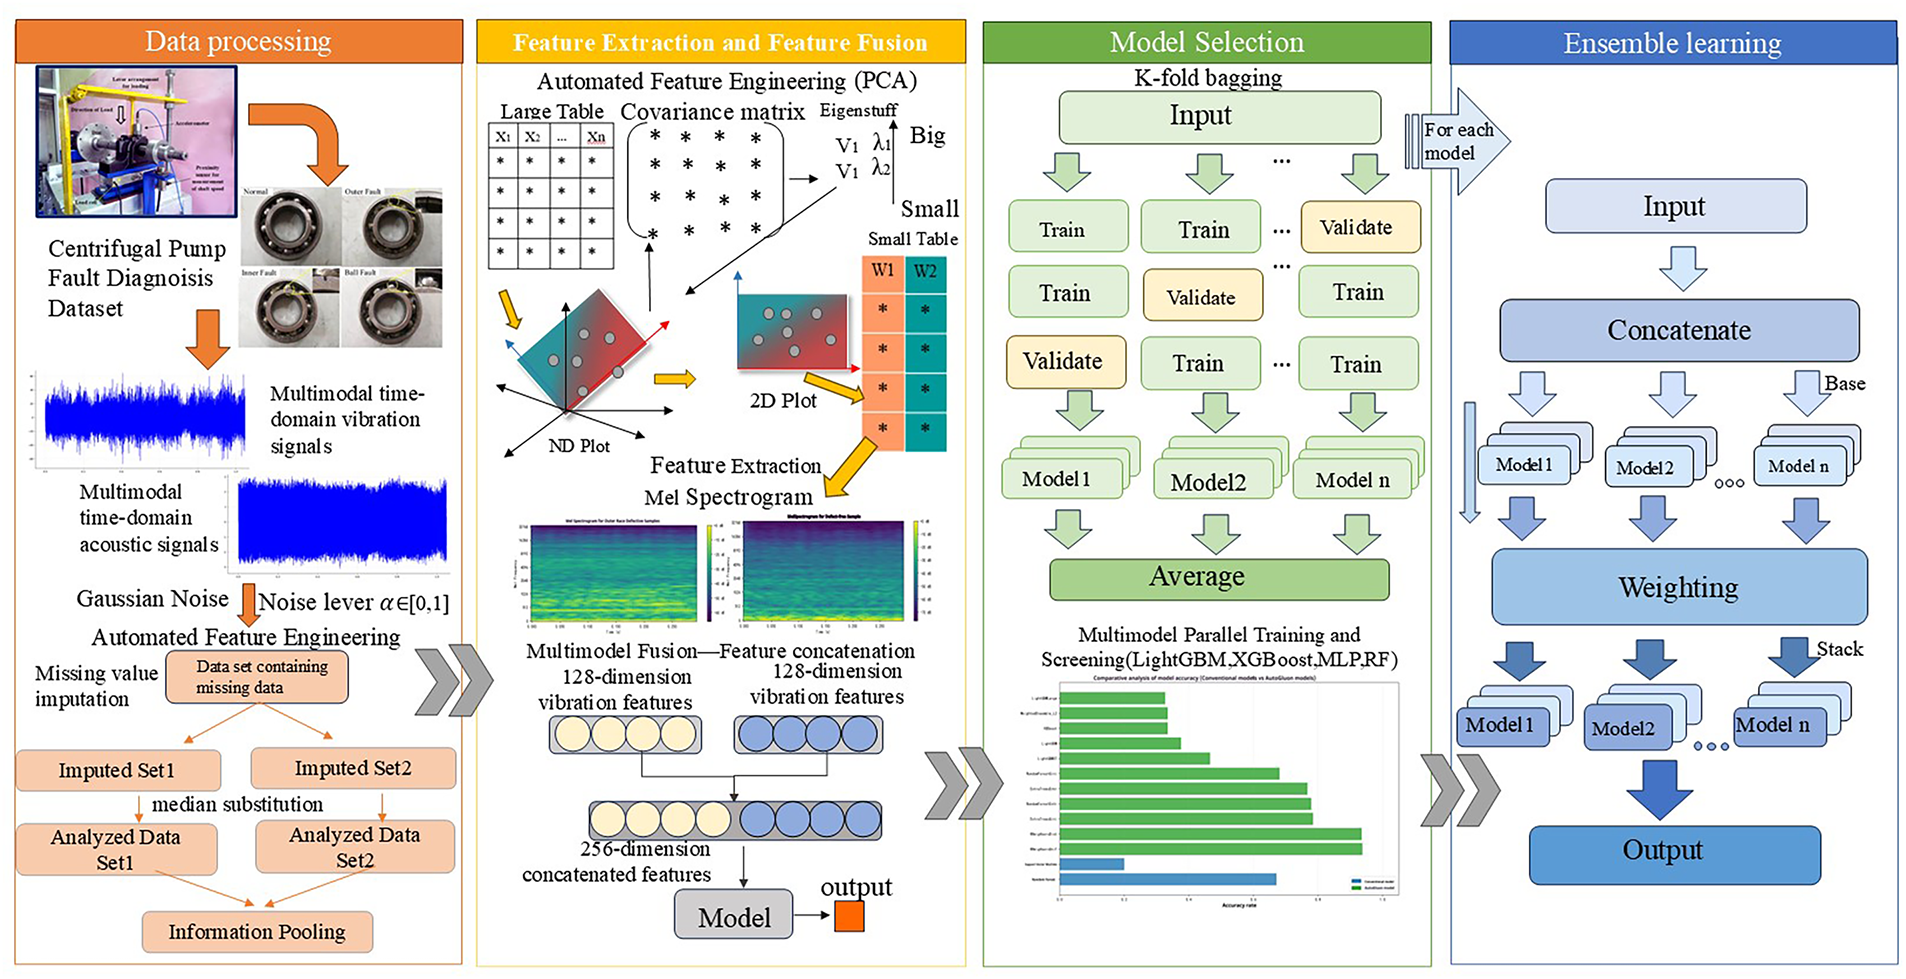
Figure 1: Overall model structure.
3.1 Mel Spectrogram Processing and Feature Extraction
For acoustic signal feature extraction, this study employs the Mel-frequency cepstral coefficient (MFCC) method. The raw acoustic signals are first preprocessed to optimize feature extraction accuracy. Using the mel spectrogram function of the librosa library, the preprocessed signals are converted into Mel spectrograms, with parameters set as follows.
The STFT window length (n_fft) is 2048 samples, the hop length between adjacent frames (hop_length) is 300 samples, and the number of Mel filter banks (n_mels) is 128.
STFT is applied to the raw acoustic signals, with a window length of 2048 samples per frame and a frame hop size of 300 samples. Given a total of sampling points in the input signal, the number of time frames can be calculated using Eq. (5). This parameter setting balances frequency resolution with computational efficiency and time resolution.
In the above formula, n_fft is the window length of STFT, the number of sampling points contained in each frame, which determines the frequency resolution. hop_length is the interval of sampling points between adjacent frames, which controls the degree of frame overlap. The smaller the value, the more overlap, and the higher the time resolution. N is the total number of sampling points of the input signal, and T is the number of time frames, reflecting the number of segments in the time dimension of the signal. n_mels refers to the number of Mel filter banks, which maps linear frequency to the Mel frequency domain. By compressing the high-frequency region, nonlinear fault features are highlighted. Here, 128 Mel filter banks are used to map linear frequency to the logarithmic scale Mel frequency domain. In this way, the high-frequency linear frequency range is compressed, effectively highlighting the nonlinear high-frequency components related to faults. Finally, after taking the log power spectrum of the Mel spectrogram, the discrete cosine transform (DCT) is performed to extract 128-dimensional MFCC features. These features preserve the frequency distribution characteristics of the acoustic signal, while dimensionality reduction improves the discriminability of the features.
The number of Mel filters is set to 128. The Mel filter bank maps linear frequency scales into the Mel frequency domain, compressing high-frequency intervals to highlight nonlinear fault features. This process emphasizes high-frequency components associated with faults. After computing the logarithmic power spectrum of the Mel spectrogram, DCT is applied to extract 128-dimensional MFCC features. These features preserve the frequency distribution of the acoustic signal while enhancing discriminability through dimensionality reduction.
By converting linear frequency scales into the Mel scale, higher frequency resolution is achieved in the high-frequency region, while redundant low-frequency information is compressed. The resulting normalized feature vectors integrate both time-domain and frequency-domain information, providing high-quality inputs for the AutoML model.
In practical fault diagnosis of rotating machinery, multiple sensing modalities such as vibration, acoustic, and current signals provide complementary diagnostic perspectives on system behavior. Vibration signals reflect mechanical impacts, acoustic signals capture sound pressure variations, and current signals encode electromechanical coupling effects. These heterogeneous data sources differ in sampling frequencies, dimensionality, and statistical distributions, making manual fusion design complex and often suboptimal. To overcome this limitation, the proposed framework integrates an AutoML-based multimodal feature fusion strategy implemented on the AutoGluon platform, which automatically learns optimal fusion structures and hyperparameters through systematic model search and validation.
Raw signals from each modality are first transformed into domain-specific feature representations. For vibration signals, time–frequency statistical features are extracted to describe amplitude fluctuations and spectral energy distributions. For acoustic signals, Mel-frequency cepstral coefficients (MFCC) and Mel spectrograms are computed to enhance the discriminability of high-frequency fault features. These initial feature representations are denoted as
where
The AutoML framework performs automated feature alignment and normalization to ensure comparability among modalities. This process includes standardization, missing-value imputation, and dimensionality reduction, represented as
where
To capture cross-modal feature interactions, AutoML transforms multimodal fusion into an implicit modeling task that can be optimized automatically. It explores different fusion mechanisms, including early, intermediate, and late fusion, and adaptively selects the optimal configuration through Bayesian optimization. In early fusion, all aligned features are directly concatenated into a unified feature space according to
Therefore, it preserves complementary modality information. In this study, early fusion was adopted by concatenating vibration and acoustic features into a 256-dimensional composite vector, which was subsequently normalized using Min–Max scaling. In intermediate fusion, modality-specific features are projected into a shared latent space and combined using adaptive weighting.
where
where
While the AutoML framework is theoretically capable of exploring intermediate and late fusion strategies, the early fusion approach was empirically selected and validated as the most suitable strategy for this study. This decision is justified by several compelling reasons that align with the objectives of an automated, efficient, and robust diagnostic pipeline.
First, the AutoML platform is designed to operate on fixed-length feature vectors. Early fusion through simple concatenation seamlessly fulfills this requirement without necessitating custom, complex fusion architectures or introducing additional hyperparameters. This alignment is crucial for maintaining a fully automated, end-to-end diagnostic workflow, which is a core advantage of the proposed framework. Implementing intermediate or late fusion within this context would require significant customization, undermining the automated principle of AutoML.
Second, concatenation is computationally efficient and preserves the original. This strategy effectively leverages the complementary advantages of both modalities: acoustic signals are sensitive to high-frequency fault components, while vibration signals robustly capture low-frequency mechanical impacts. The concatenated feature representation provides a more comprehensive characterization of faults, thereby enhancing diagnostic accuracy and system reliability. This allows the subsequent suite of AutoML models to autonomously learn the optimal cross-modal interactions and hierarchies during training. This approach avoids potential information loss or inductive bias that might be introduced by predefined, more complex fusion mechanisms, which may not be universally optimal across all fault classes.
Third, the concatenated feature vector maintains high interpretability. It readily allows for post-hoc analysis using techniques like SHAP to quantify the contribution of each vibration and acoustic feature to the final diagnosis. In contrast to intermediate fusion, which relies on learned and often opaque transformations, early fusion provides a more transparent approach.
Consequently, in this study, early fusion was adopted by concatenating the 128-dimensional MFCC features from acoustic signals and the 128-dimensional time-frequency statistical features from vibration signals into a 256-dimensional composite multimodal feature vector, which was subsequently normalized using Min–Max scaling.
The optimal fusion configuration
where
During model training, AutoML constructs and evaluates multiple base learners, including tree-based models, linear models, and neural networks, trained in parallel on the fused multimodal feature set. Tree models automatically extract nonlinear rule combinations from vibration–acoustic features, linear models assign interpretable weights to modality contributions, and neural networks capture deeper inter-modal relationships. Ensemble learning strategies such as weighted voting and hierarchical stacking further integrate model outputs into a unified decision framework, resulting in an adaptive hierarchical fusion mechanism that coordinates discriminative information across modalities.
t-SNE visualization confirmed that the fused multimodal feature space exhibits improved class separability, with Kullback–Leibler (KL) divergence decreasing from 1.21 (unimodal) to 0.78 (multimodal). By integrating complementary diagnostic cues across heterogeneous sensing modalities, the AutoML-based multimodal fusion generates a richer and more comprehensive fault representation, thereby enhancing both diagnostic accuracy and robustness under varying operational conditions. The resulting fused vectors serve as the basis for subsequent ensemble classification and performance optimization within the AutoML pipeline.
The AutoML framework integrates heterogeneous sensing modalities, such as vibration and acoustic signals, into a unified diagnostic representation through automated feature extraction, alignment, and fusion optimization. Raw sensor data are transformed into domain-specific feature sets. The statistical features for vibration and MFCC/Mel-spectrogram features for acoustics. AutoML automatically applies feature preprocessing, including normalization, imputation, and dimensionality reduction, concatenates aligned features into a 256-dimensional composite vector, and explores multiple fusion and ensemble configurations. Using Bayesian optimization, AutoGluon identifies the optimal fusion strategy that maximizes classification performance. The fused representation captures complementary mechanical and acoustic fault characteristics, enabling robust few-shot fault diagnosis under variable and noisy industrial conditions.
3.3 Automated Feature Engineering
Traditional feature engineering relies heavily on expert knowledge to design appropriate processing pipelines and manually select discriminative features. Such approaches are time-consuming, dataset-specific, and prone to human bias, which limits their scalability and reproducibility in complex industrial applications. The AutoML framework addresses these limitations by automating the entire feature engineering process, thereby reducing dependence on domain expertise and enabling consistent, data-driven feature construction across heterogeneous datasets.
In this study, AutoML was employed to automatically perform feature engineering on multimodal vibration and acoustic data. The automated process encompasses a series of operations, including missing-value imputation, categorical encoding, dimensionality reduction, feature selection, and importance evaluation. Missing-value imputation was achieved using statistically informed strategies such as median substitution, ensuring data completeness in vibration or acoustic features. When categorical variables were present, one-hot encoding was applied to convert them into binary vectors, enabling machine learning models to process heterogeneous data types.
After initial preprocessing, AutoML performs feature space transformation, mapping the original feature space
This transformation integrates multiple operations: normalization, non-linear mapping, and dimensionality reduction, automatically selected and tuned through AutoGluon’s optimization engine. Among these, principal component analysis (PCA) is a commonly applied dimensionality reduction method that eliminates redundancy while preserving essential information. PCA computes an orthogonal projection matrix
which preserves as much feature variance as possible. In practical vibration analysis, PCA that retains 95% of total variance can typically reduce the feature dimension to 10%–30% of its original size. For instance, a 2000-dimensional vibration feature set can be compressed to about 50 dimensions while maintaining energy distribution information critical for fault identification.
Following the transformation, AutoML executes feature selection to enhance discriminability and computational efficiency. Redundant or irrelevant features are automatically pruned using recursive feature elimination, correlation-based filtering, and model-based ranking. The reduced representation is expressed as
where
To evaluate the relative contribution of each selected feature, AutoML employs the SHAP framework derived from cooperative game theory, as formulated in Eq. (15). This metric quantifies the average marginal contribution of each feature to the model’s output across all possible feature combinations. In the context of fault diagnosis, a larger SHAP value implies that the corresponding vibration or acoustic feature has a stronger influence on the classification decision. For instance, features with high SHAP importance often correspond to frequency bands or statistical descriptors sensitive to fault-induced impulsive responses. This enhances interpretability by linking mathematical feature importance to physically meaningful fault characteristics. The importance of the
where
The entire automated feature engineering process is formulated as an end-to-end optimization problem that integrates preprocessing, transformation, selection, and model learning.
where
Through this automated and adaptive process, AutoML systematically transforms raw multimodal data into standardized, compact, and highly discriminative feature representations. The resulting features exhibit reduced redundancy, enhanced interpretability, and improved fault sensitivity. Feature importance ranking based on SHAP values provides transparent interpretive insight into the contribution of each modality, ensuring both diagnostic reliability and explainability. The optimized feature matrices generated by this automated feature engineering process subsequently serve as the input for the multimodal feature fusion stage, forming the foundation for ensemble-based fault classification and robust cross-domain generalization.
3.4 Hyperparameter Optimization
Hyperparameter optimization refers to the systematic exploration of a model’s parameter space to identify the optimal configuration, thereby improving model performance. AutoML frameworks, such as AutoGluon, are capable of simultaneously searching hyperparameters for multiple model types, including LightGBM, XGBoost, Random Forest, CatBoost, and neural networks. This capability allows AutoML not only to tune individual model parameters but also to identify well-performing configurations across models and leverage ensemble methods to combine their strengths, enhancing robustness and generalization.
For each base learner
where
Hyperparameter optimization aims to minimize the expected validation loss, which can be expressed as:
where
where
where
where
In AutoML, multiple base learners are trained with independent hyperparameters
where
3.5 Model Selection and Ensemble Learning
In AutoML frameworks, model selection and ensemble learning constitute the final yet critical stages of the pipeline, directly influencing predictive performance, robustness, and generalization. Multimodal fault diagnosis tasks involve heterogeneous features with varying statistical distributions, temporal resolutions, and discriminative power, making single-model selection insufficient. AutoML addresses this challenge through an adaptive model selection mechanism that evaluates a diverse pool of candidate models in parallel, automatically identifying high-performing learners under the constraints of the data and task requirements.
The candidate models
where
where
Despite rigorous selection, individual models may fail to capture all discriminative information across heterogeneous modalities. To overcome this, AutoGluon employs a two-layer ensemble strategy that integrates multiple base learners into a unified predictor. The ensemble process is fully automated and consists of the following stages.
The first layer of integration is accomplished through a Weighted Ensemble. AutoGluon constructs a WeightedEnsemble model that performs a weighted averaging of the prediction probabilities from multiple high-performing base models. The weight
where
Subsequently, to further refine the predictions and capture complex inter-model relationships, AutoGluon employs a second layer of integration via Stacked Generalization. This stage involves the construction of a MultiLayerEnsemble, where the output probabilities from all first-layer base models are treated as a new feature vector for training a meta-learner. The stacked ensemble process is formally expressed as follows.
here,
Through this built-in, hierarchical ensemble capability, the framework ensures effective fusion of complementary diagnostic information from vibration and acoustic modalities at the decision level. This automated strategy not only mitigates the variance inherent in individual models but also significantly enhances robustness against noise and operational variations, thereby achieving high diagnostic accuracy and reliability while maintaining full automation and reproducibility.
Furthermore, AutoML frameworks dynamically adapt the ensemble according to operational conditions. For instance, in scenarios with limited labeled data, the ensemble may prioritize models with lower variance or higher robustness to noise, while in high-data regimes, diversity-driven weighting ensures complementary information is captured. This flexibility is crucial for industrial fault diagnosis, where operational environments vary, sensor noise exists, and multimodal features exhibit complex interactions. By integrating model selection, weighted voting, and stacking, the framework maintains high accuracy, robustness, and generalization, ensuring reliable performance across diverse and noisy real-world conditions.
3.6 The Procedure of the Proposed Method
The complete workflow of the proposed method can be summarized as follows.
Step 1: Vibration and acoustic signals are simultaneously collected from the centrifugal pump using acceleration and acoustic sensors. The acquired data is preprocessed to remove noise and divided into training and testing sets.
Step 2: Vibration signals are converted into time–frequency statistical features, while acoustic signals are transformed into Mel-spectrograms to extract MFCC features. The two modalities are concatenated into a 256-dimensional normalized composite feature vector.
Step 3: The multimodal features are input into the AutoML framework, which automatically performs feature engineering, hyperparameter optimization, and model training through Bayesian optimization based on Gaussian process surrogates.
Step 4: AutoML evaluates multiple candidate models, including LightGBM, XGBoost, Random Forest, and a multilayer perceptron, using five-fold cross-validation. The optimal model
Step 5: The framework employs AutoML’s automated two-layer ensemble strategy, where the first layer performs weighted averaging of base models based on their validation performance, and the second layer applies stacked generalization using a meta-learner to optimally combine these predictions, thereby generating the final robust diagnostic results.
This automated workflow reduces reliance on expert knowledge, ensures reproducibility, and enhances diagnostic performance, particularly in noisy environments.
4.1 Experimental Platform Construction
A centrifugal pump is a typical rotary machine that delivers fluid using centrifugal force generated by impeller rotation. It is widely applied in chemical engineering, petroleum, metallurgy, pharmaceuticals, agricultural irrigation, and urban water supply. The rotating components of the centrifugal pump, such as the impeller and shaft, are supported and positioned by rolling bearings, as illustrated in Fig. 2.
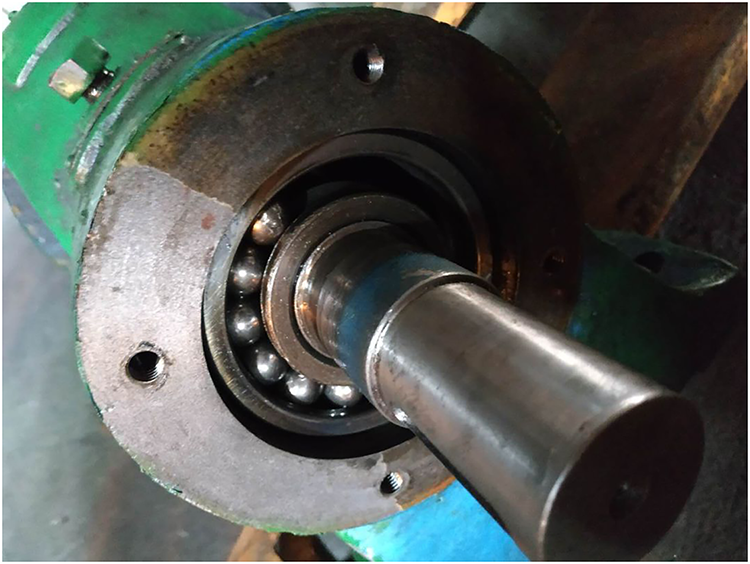
Figure 2: Installation details of centrifugal pump bearings.
Bearing impact vibrations are transmitted through the shaft system to the impeller and pump casing, causing intensified machine vibration and friction between the impeller and casing, which may lead to resonance and other secondary faults. Conducting fault diagnosis for centrifugal pumps, therefore, holds significant industrial value. Accordingly, this study employs the publicly available centrifugal pump fault diagnosis dataset released by Kumar’s team [35]. The dataset was specifically designed for typical fault scenarios in rotating machinery and includes cross-modal data of vibration and acoustic signals, providing essential support for evaluating the diagnostic performance of AutoML models under complex operating conditions. Vibration and acoustic signals were synchronously acquired using acceleration sensors and microphones, respectively. The details are as follows.
Vibration signals were collected using a uniaxial accelerometer mounted on the drive-end bearing housing, which reflected the vibration characteristics of the machine structure, with a sampling rate of 70 kHz [36].
Acoustic signals were simultaneously collected as sound pressure signals. The dataset encompasses five operational states, including inner race defect, outer race defect, impeller damage, impeller clogging, and defect-free operation, as shown in Fig. 3. These states cover the most common failure modes of centrifugal pump core components.
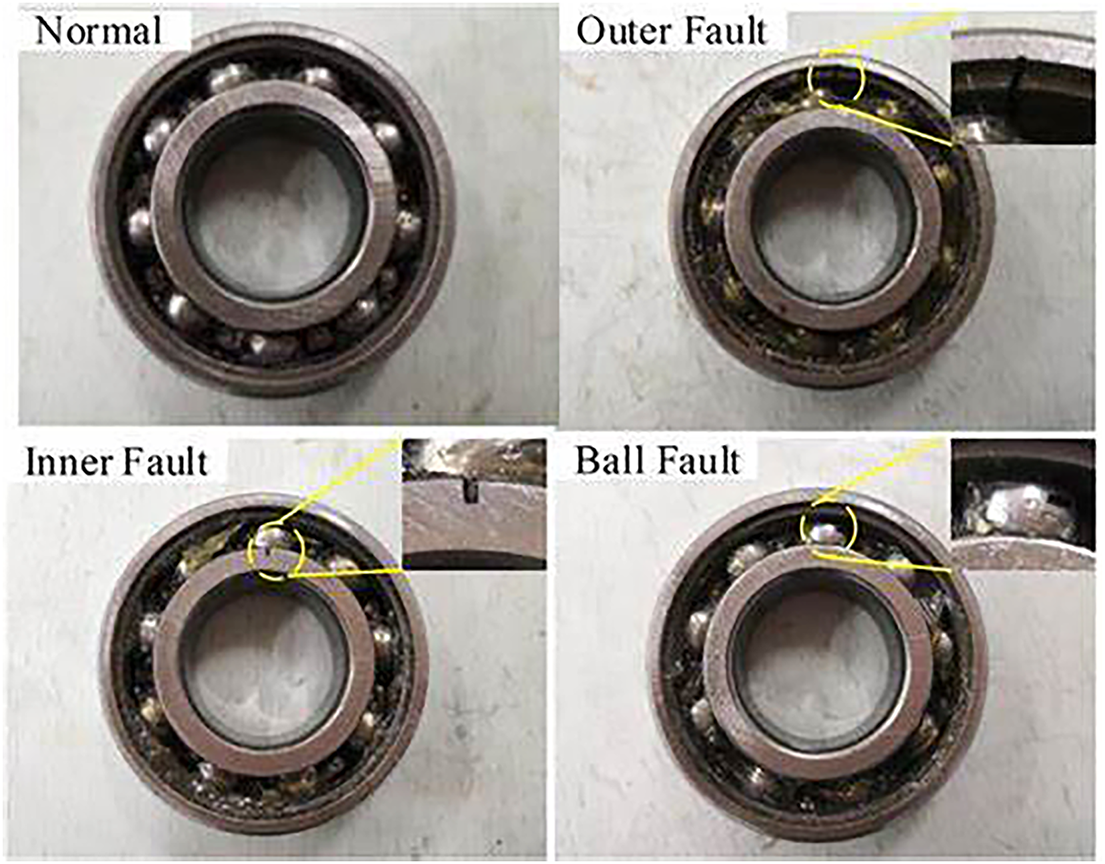
Figure 3: Fault diagram of centrifugal pump bearings.
The raw signals contain approximately 1200k data points, including both normal and defective states. The signals were segmented into multiple subsequences of 2048 data points each, with each subsequence treated as an independent sample to facilitate preprocessing and model training, as illustrated in Fig. 4.
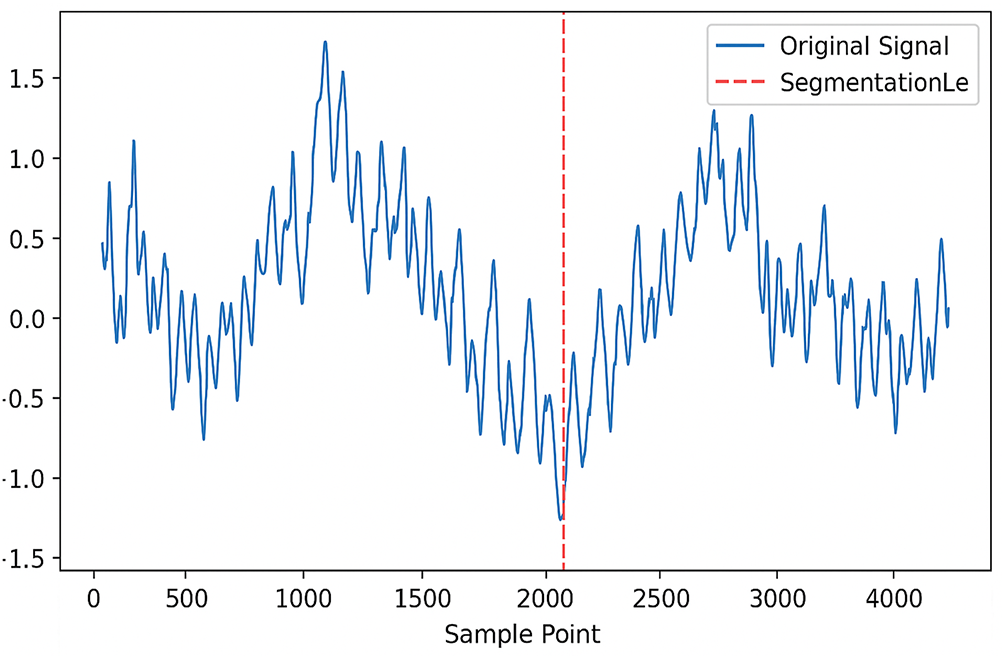
Figure 4: Schematic diagram of raw signal segmentation.
In this study, in response to the noise interference existing in the experimental dataset, a systematic data cleaning process was implemented. The strategy for handling missing values was based on the distribution characteristics of the data, and linear interpolation technology was applied to time series data. For the identification of abnormal values, a scientific and reasonable threshold judgment standard was established to find out data points that exceeded the normal fluctuation range, and then these data points were corrected or removed, in order to ensure the quality of the training data.
Signal amplitude range:
According to the set noise level α, calculate the standard deviation of the Gaussian noise.
The generated Gaussian noise follows a normal distribution.
Superimposing the noise onto the original signal can obtain the noisy signal.
In the above formulas, s(t) represents the original single-modal signal,
By simulating the interference of noise on signals in real scenarios, this study built a noise processing framework, which effectively improves the robustness evaluation of the model in noisy environments, making the model training and evaluation process more consistent with actual engineering application scenarios, and improving the credibility and scientific validity of the experimental data.
4.2 Experimental Scheme Design
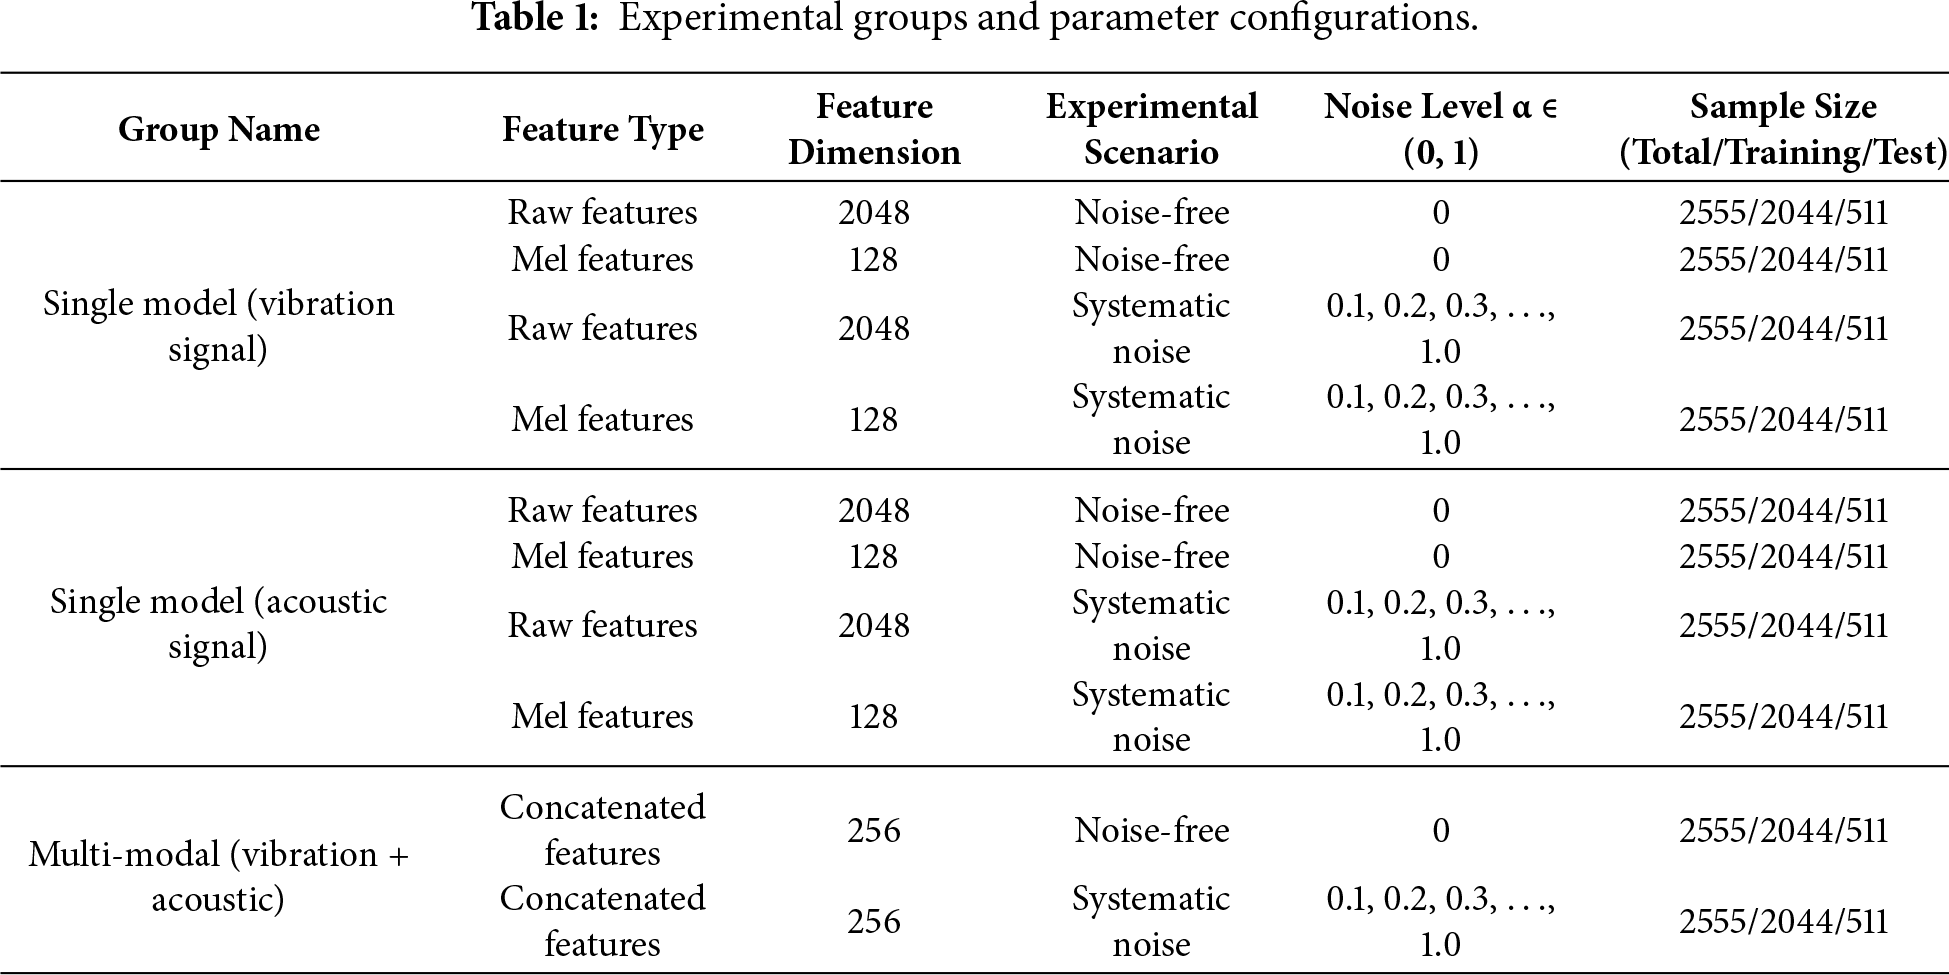
This study adopts the method of controlled variables to design multiple sets of control experiments, controlling the data source, sample division, and preprocessing process, to quantitatively evaluate the impact of multimodal fusion and noise on diagnostic performance. To simulate the noise interference prevalent in real industrial environments and to rigorously evaluate the model’s robustness, we introduced Gaussian noise to the original signals. The noise level is controlled by a dimensionless parameter α, which ranges from 0 to 1. The parameters of each group are as follows (Table 1).
(1) Quantitative evaluation
In the quantitative evaluation index system, accuracy is the key indicator used to measure the overall classification performance of the model, defined as the ratio of the number of correctly classified samples to the total number of samples. With this indicator, the comprehensive recognition performance of the model for various types of faults can be effectively reflected in balanced data distribution scenarios. In the evaluation requirements for imbalanced datasets, this study selected the F1-score as a comprehensive indicator, which is the harmonic mean of precision and recall, providing a comprehensive evaluation of the model’s balanced performance across different categories.
Precision refers to the proportion of samples predicted as positive that are actually positive. This parameter reflects the accuracy of the model’s discrimination of positive cases. Its mathematical expression is given as follows.
Recall is defined as the proportion of correctly identified positive samples in the total number of actual positive samples, presenting the model’s coverage ability for positive samples. Its mathematical expression is given as follows.
Based on the above two parameters, the calculation formula of the F1-score can be expressed as follows.
In the above formulas, TP represents the number of true positives, FP represents the number of false positives, and FN represents the number of false negatives.
(2) Qualitative analysis
The normalized confusion matrix heatmap uses color coding to present the prediction distribution between categories, where the diagonal elements reflect classification accuracy. While the off-diagonal elements reveal misclassification patterns, such as confusion between high-frequency faults and low-frequency faults. Combined with Seaborn visualization technology, numerical annotations and color gradients are used to identify the weaker categories in the model, providing direction for feature optimization.
The t-SNE feature distribution and KL divergence are applied based on manifold learning theory, where high-dimensional features are reduced to a two-dimensional space, and KL divergence quantifies the separability between classes. The smaller the KL value, the stronger the discriminative ability of the features. By comparing the compactness of the distributions of single-modal and multi-modal features, the inter-class separability after fusion can be intuitively verified.
The Mel-spectrogram comparative analysis is performed using the Librosa library, where the acoustic signal is converted into a logarithmic power spectrum. By visualizing fault features through differences in high-frequency energy distribution, and comparing the spectrograms before and after multi-modal fusion, the changes in frequency coverage and energy concentration are analyzed to verify the effectiveness of multi-source data.
By adopting the method of controlled variables and comparing the performance differences of different groups under the same noise level, the study focuses on analyzing the inhibitory effect of multimodal fusion on noise interference and the advantages of AutoML in feature optimization. The experimental results, from both quantitative indicators and visualization analysis, demonstrate the effectiveness of automated machine learning technology in mechanical fault diagnosis.
5.1.1 Effectiveness of Mel-Spectrogram Features in Fault Discrimination
Feature extraction quality directly determines the model’s ability to recognize fault patterns. Mel spectrogram analysis simulates the nonlinear frequency perception of the human auditory system, making it particularly effective for capturing fault-sensitive features in vibration and acoustic signals. Based on the MFCC method, discriminative time–frequency features are obtained from raw acoustic signals. Fig. 5 presents an example of the Mel spectrograms. The color intensity represents energy distribution (the horizontal axis represents time, and the vertical axis represents Mel frequency), effectively illustrating spectral differences among fault conditions.
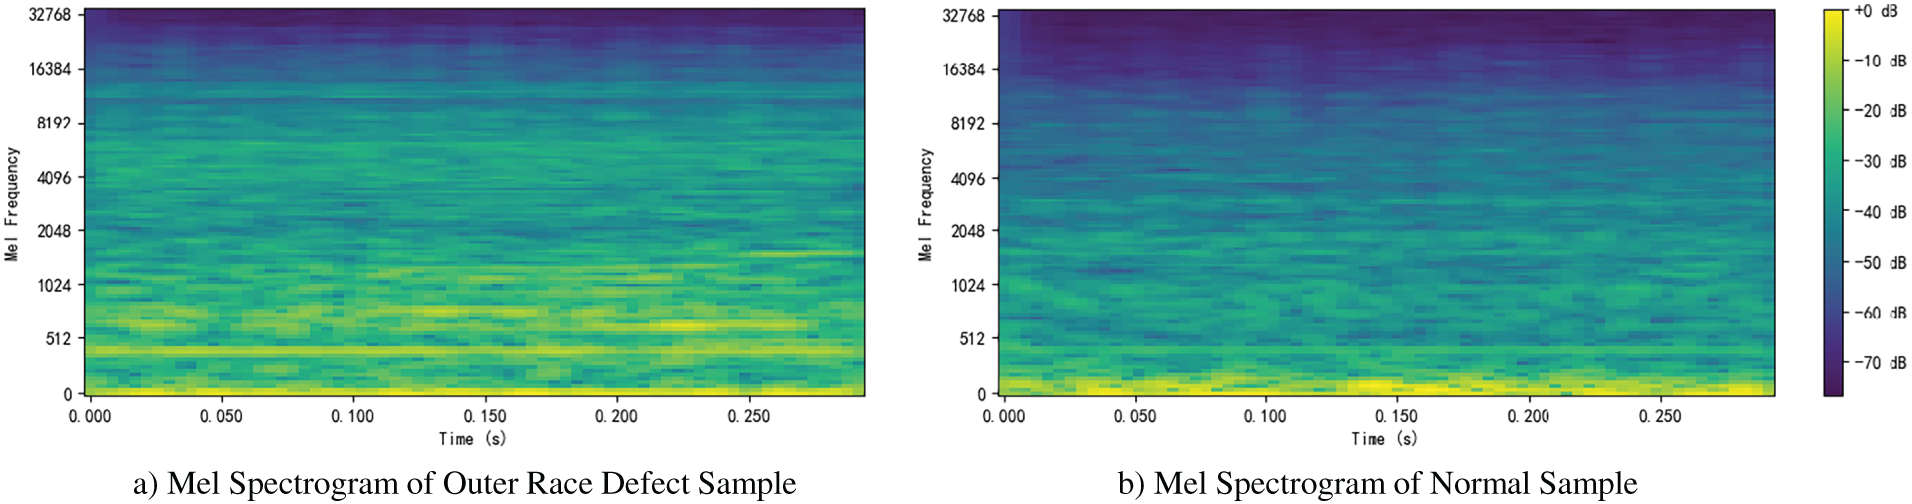
Figure 5: Mel-spectrogram of a sample.
For instance, samples with outer-race defects show pronounced energy peaks in the high-frequency range (4000–8000 Hz), consistent with impulsive noise generated by bearing surface wear. By contrast, defect-free samples exhibit energy concentrated in the low-frequency range (<2000 Hz), corresponding to periodic vibrations during normal operation (e.g., the 42 Hz impeller rotational frequency and its harmonics). This validates that the Mel scale conversion enhances the discriminability of high-frequency fault components.
In summary, MFCC-based Mel spectrogram feature extraction not only highlights the spectral differences across different fault conditions but also provides highly discriminative input features for subsequent classification models, thereby improving diagnostic accuracy and interpretability.
5.1.2 Enhanced Feature Representation through Multimodal Mel-Spectrograms
As shown in Fig. 6, the Mel-spectrogram of acoustic signals exhibits a relatively dispersed frequency–time energy distribution. In contrast, the multimodal Mel-spectrogram displays a more structured and concentrated energy distribution with more distinct frequency characteristics. This difference indicates that multimodal fusion enhances the regularity and discriminability of spectral features, facilitating the capture of informative patterns and improving classification performance. The comparison clearly demonstrates that multimodal fusion provides advantages in feature representation and confirms its effectiveness in fault diagnosis.
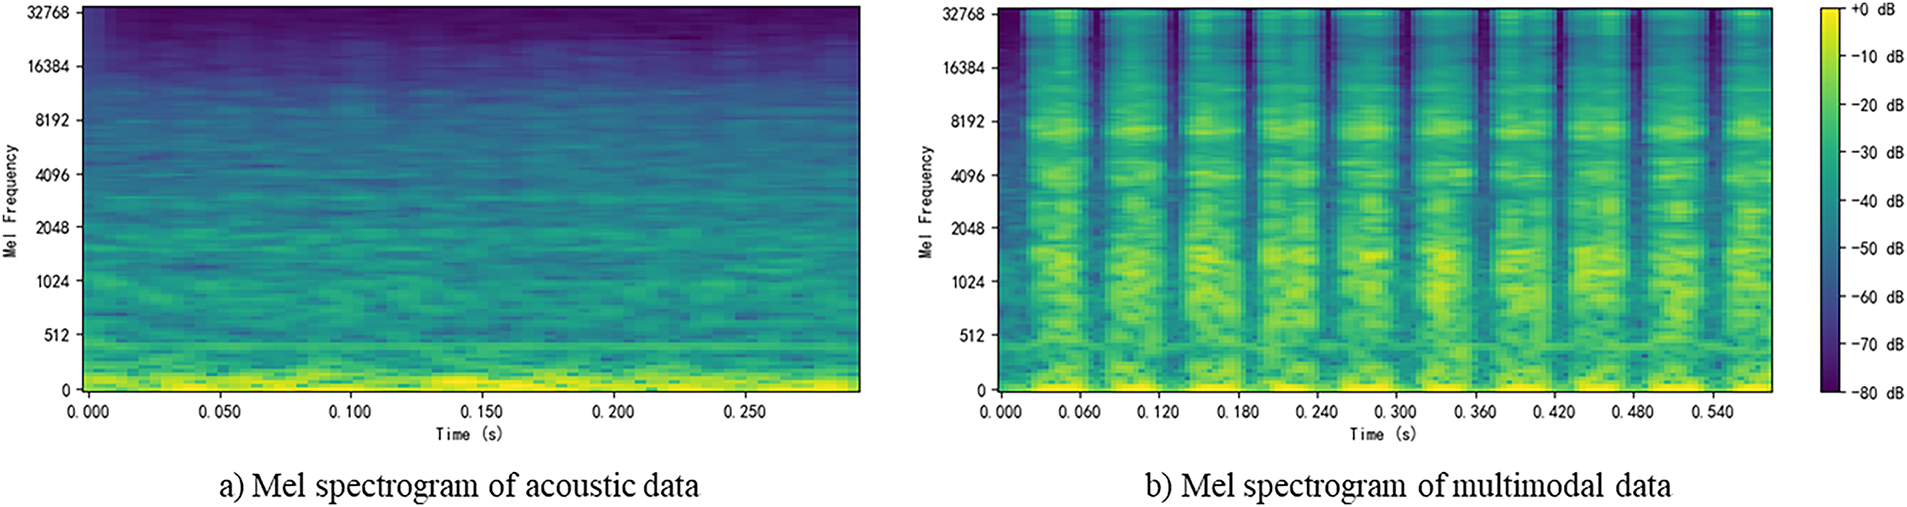
Figure 6: Mel-spectrogram comparison of acoustic and multimodal signals.
5.2 Accuracy Results and Noise Robustness
Fig. 7 illustrates the robustness comparison under different noise levels, with the horizontal axis representing noise level and the vertical axis denoting model accuracy. This figure compares the performance of Random Forest, SVM, and AutoML under varying noise levels. At zero noise, all models achieved satisfactory classification accuracy. However, as noise increased, SVM performance deteriorated sharply, dropping to 0.37 at a noise level of 0.2 and stabilizing around 0.2 for noise levels of 0.4 or higher, effectively losing classification capability. Random Forest accuracy also declined steadily, from approximately 0.98 at zero noise to 0.32 at a noise level of 1.0. In contrast, AutoML demonstrated stronger robustness. Although its accuracy decreased with rising noise, it remained relatively high, maintaining 0.41 at the maximum noise level. This indicates that AutoML can efficiently extract effective features in noisy environments and sustain classification performance, underscoring its practical advantage under real-world interference conditions.
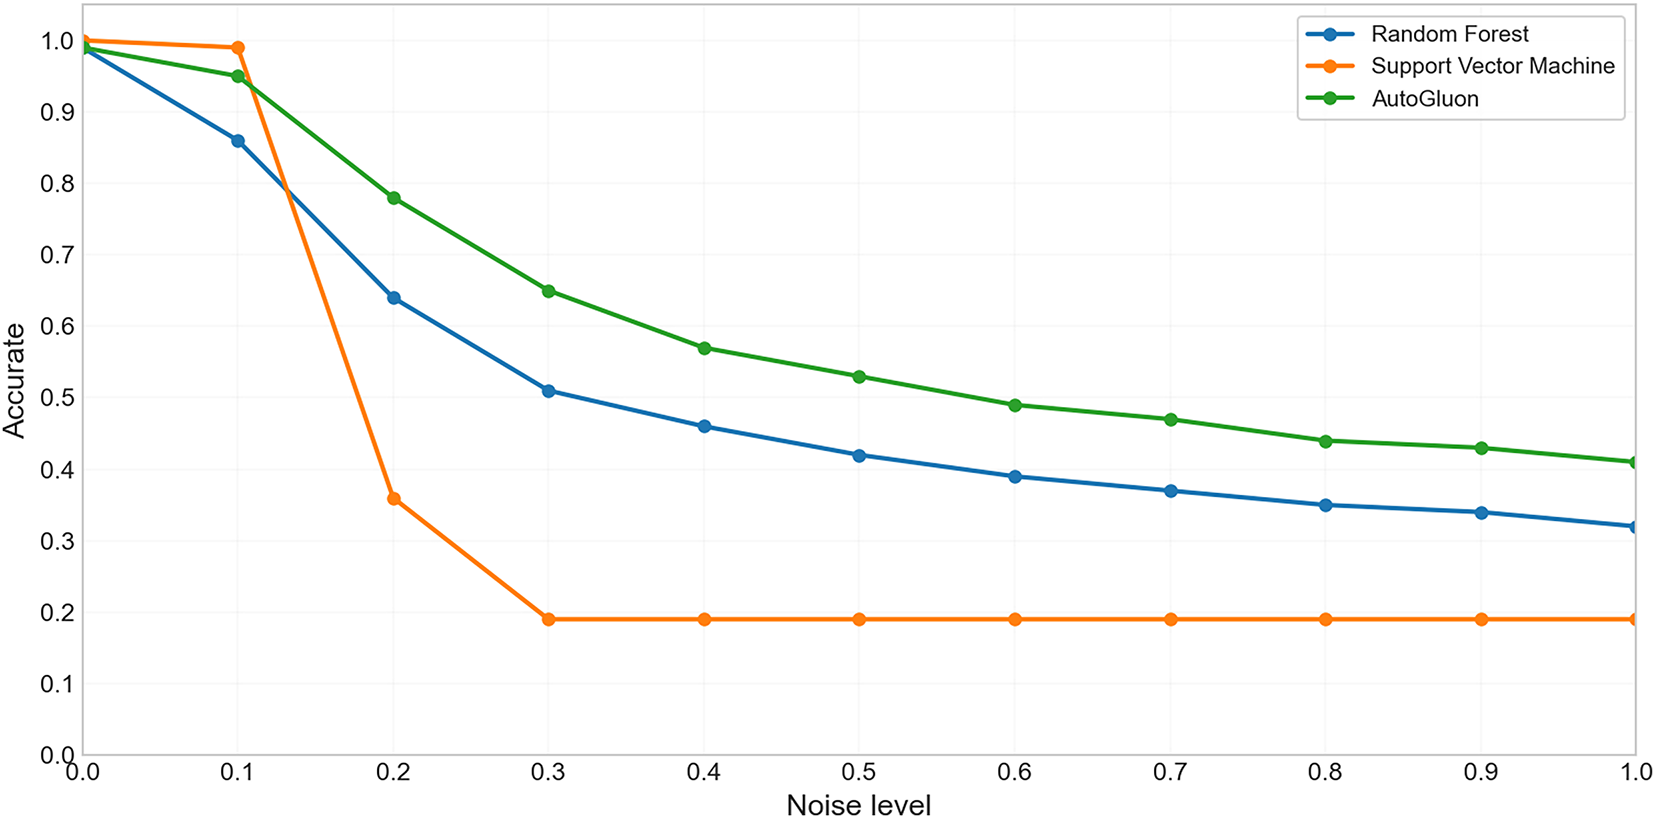
Figure 7: Robustness comparison under different noise levels.
To comprehensively evaluate model performance, the accuracies and F1-scores of AutoML submodels, Random Forest, and SVM were compared using both raw and noisy data (30% noise level). The results are presented in Table 2 (raw data) and Table 3 (noisy data), with Fig. 8 providing a visual comparison.
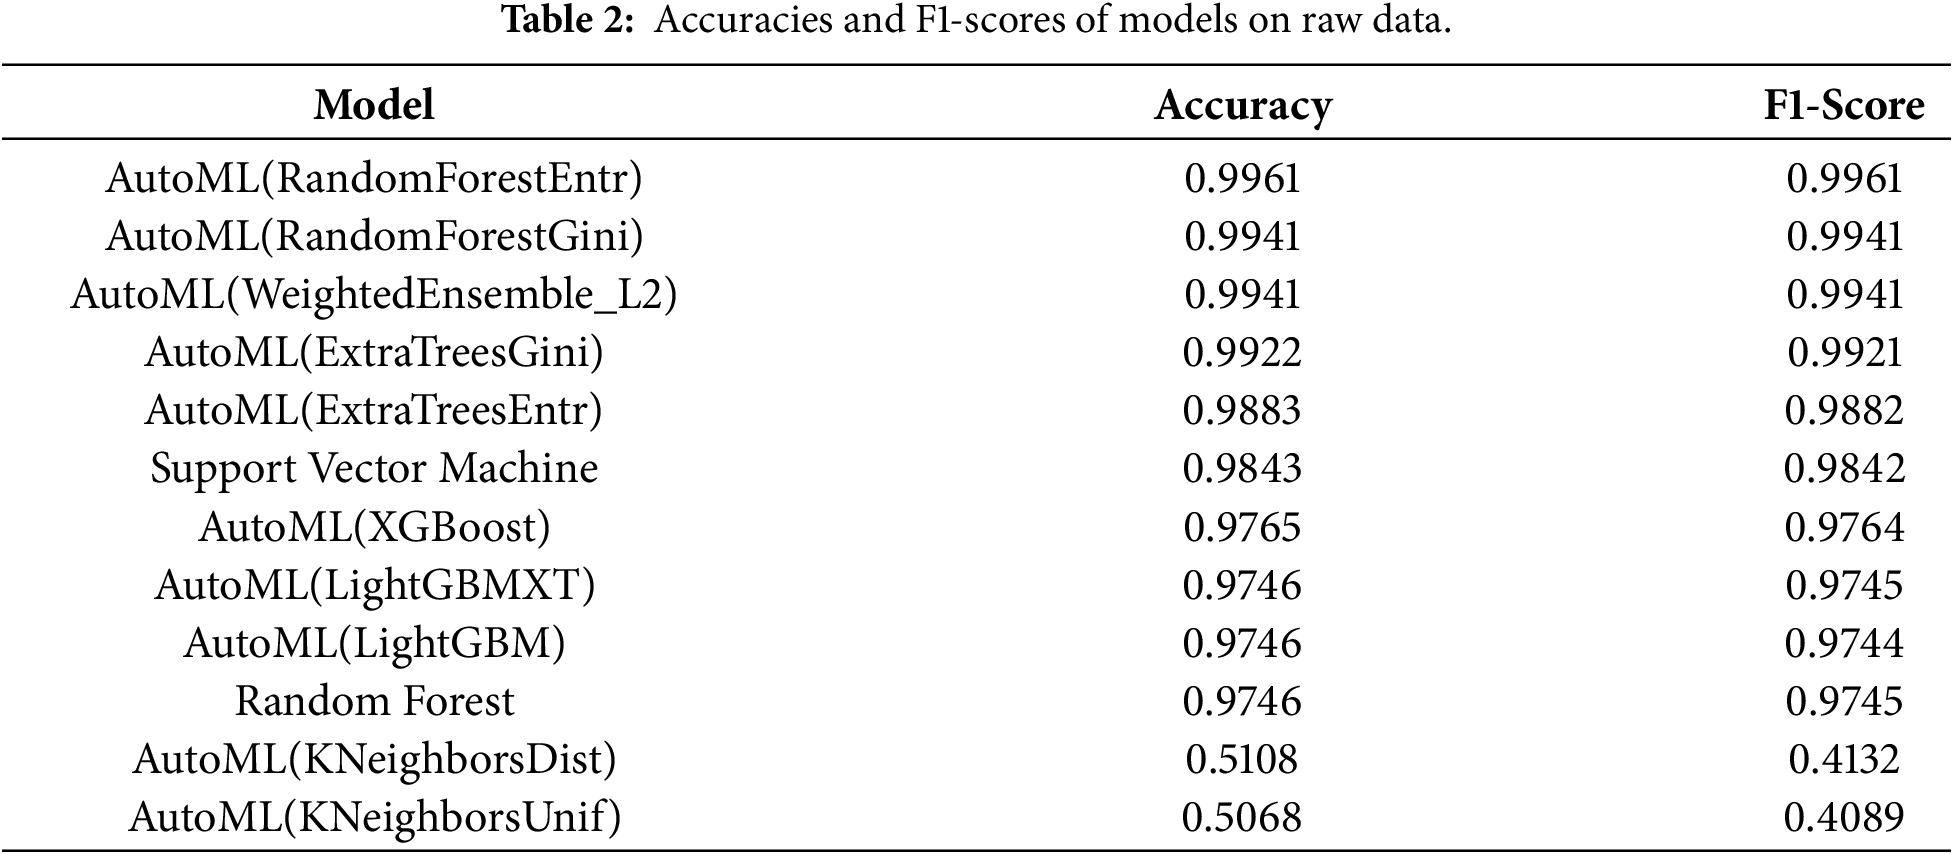
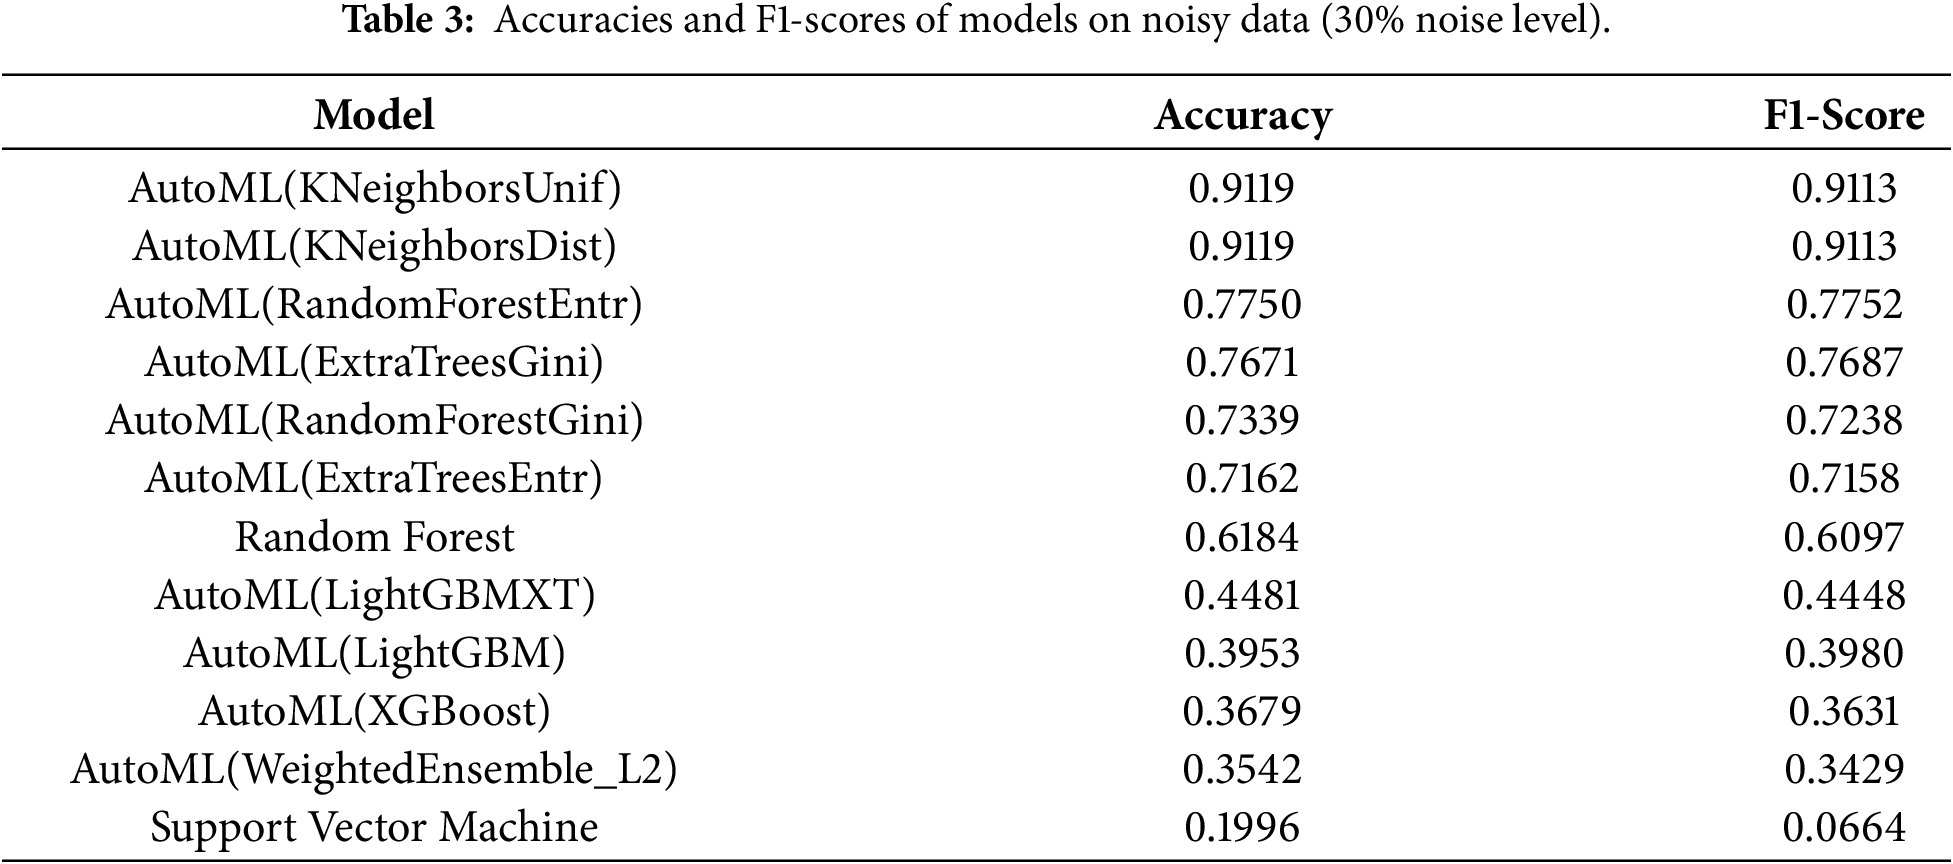
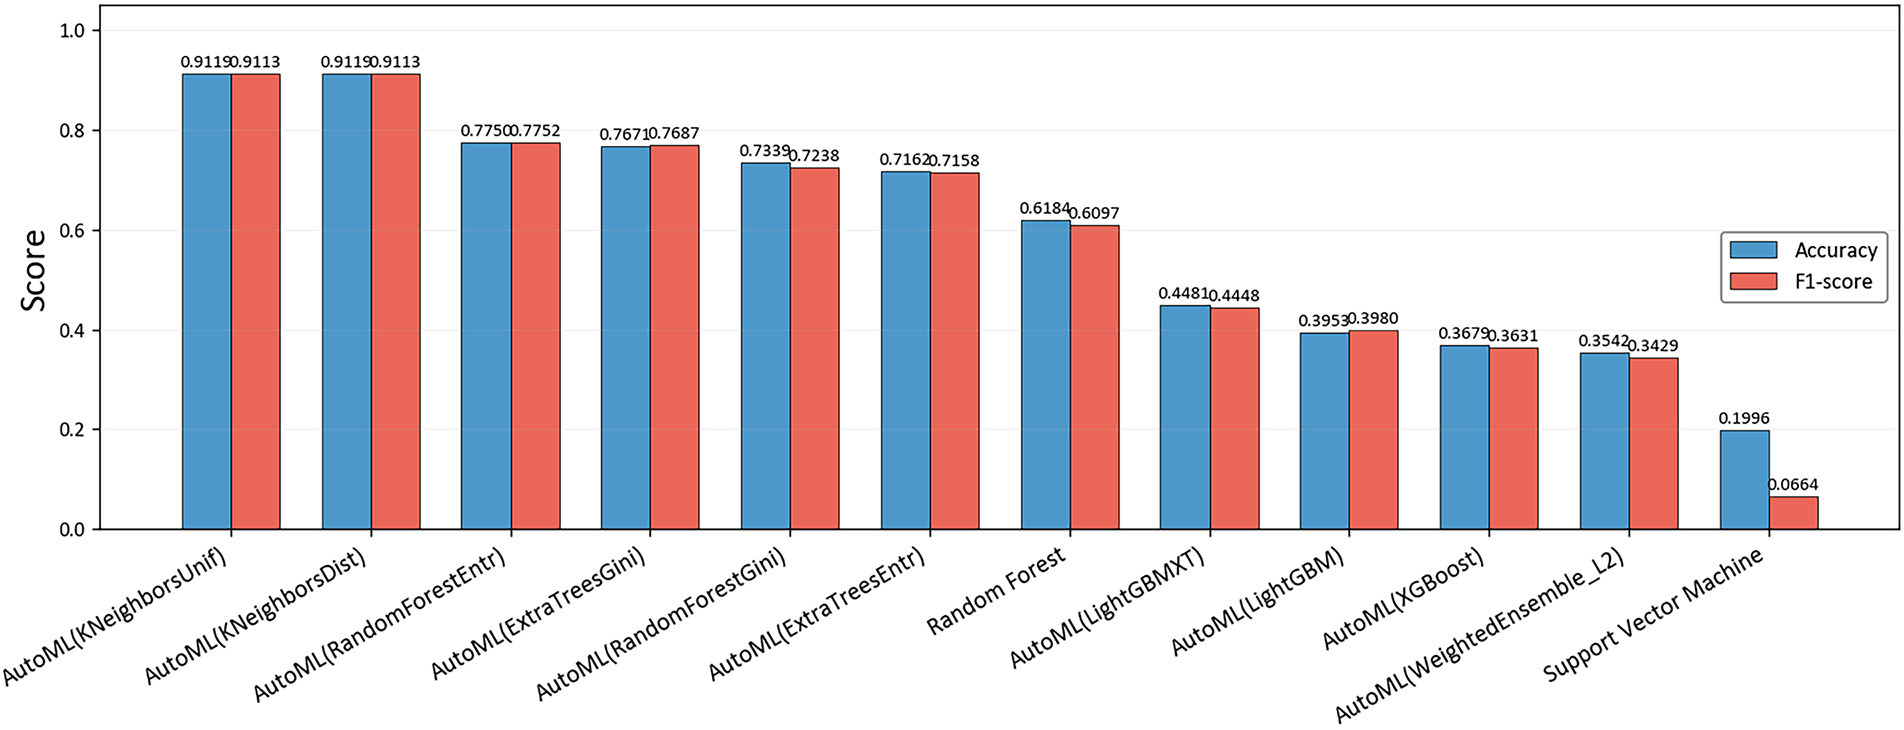
Figure 8: Comparison of model accuracy and F1-score under noisy data.
On raw data, AutoML exhibited balanced performance across fault categories. Among traditional models, Random Forest achieved 97.46% accuracy, and SVM achieved 98.43%, both lower than the best AutoML models, demonstrating the effectiveness of AutoML’s automated feature engineering and hyperparameter optimization in enhancing accuracy.
When Gaussian noise with a level of 30% was added, performance differences among models became more pronounced. The KNeighborsUnif and KNeighborsDist models within AutoML performed well, maintaining 91.19% accuracy and an F1-score of 0.9113. In contrast, Random Forest accuracy dropped to 61.84%, and SVM accuracy fell drastically to 19.96% with an F1-score as low as 0.0664, highlighting its sensitivity to noise and poor generalization under interference.
The superior performance of the KNeighborsUnif and KNeighborsDist models under a 30% noise level, where they significantly outperform several more complex tree-based ensembles. This counterintuitive result merits further discussion and can be attributed to the intrinsic properties of the K-NN algorithm and the characteristics of the constructed feature space.
The robustness of K-NN in this context underscores the quality of the multimodal feature representation engineered by the AutoML pipeline. The early fusion of 128-dimensional MFCC features and 128-dimensional time-frequency statistical features, followed by Min-Max normalization, creates a feature space where samples from the same fault class form compact and well-separated clusters in their local neighborhoods. K-NN, as a non-parametric, instance-based method, classifies samples based on the majority label within their local vicinity. Consequently, even when additive Gaussian noise corrupts the global structure of the data, the local similarity relationships that are fundamental to K-NN’s decision rule can remain largely preserved. The model’s performance thus indicates that the local topology of the fused feature space is resilient to the applied noise interference.
In contrast, powerful tree-based models like LightGBM and XGBoost, while achieving higher accuracy on clean data (Table 2), may learn complex, highly specific decision boundaries that are susceptible to overfitting. During training, these models can inadvertently assimilate not only the underlying fault patterns but also spurious correlations and noise artifacts. When presente d with test data containing a different instantiation of noise, as in our systematic noise introduction, the learned boundaries may become suboptimal, leading to a more pronounced degradation in performance. The K-NN algorithm, devoid of such an intensive parametric learning phase, demonstrates an inherent advantage in this scenario by relying solely on the preserved local data geometry.
Therefore, the strong performance of K-NN under noise is not an anomaly but rather a validation of the AutoML framework’s success in generating a discriminative and robust feature set. It highlights that in multimodal fault diagnosis, a simpler model can exhibit remarkable robustness when supported by high-quality, fused feature representations that maintain class separability at a local level, even in challenging noisy environments.
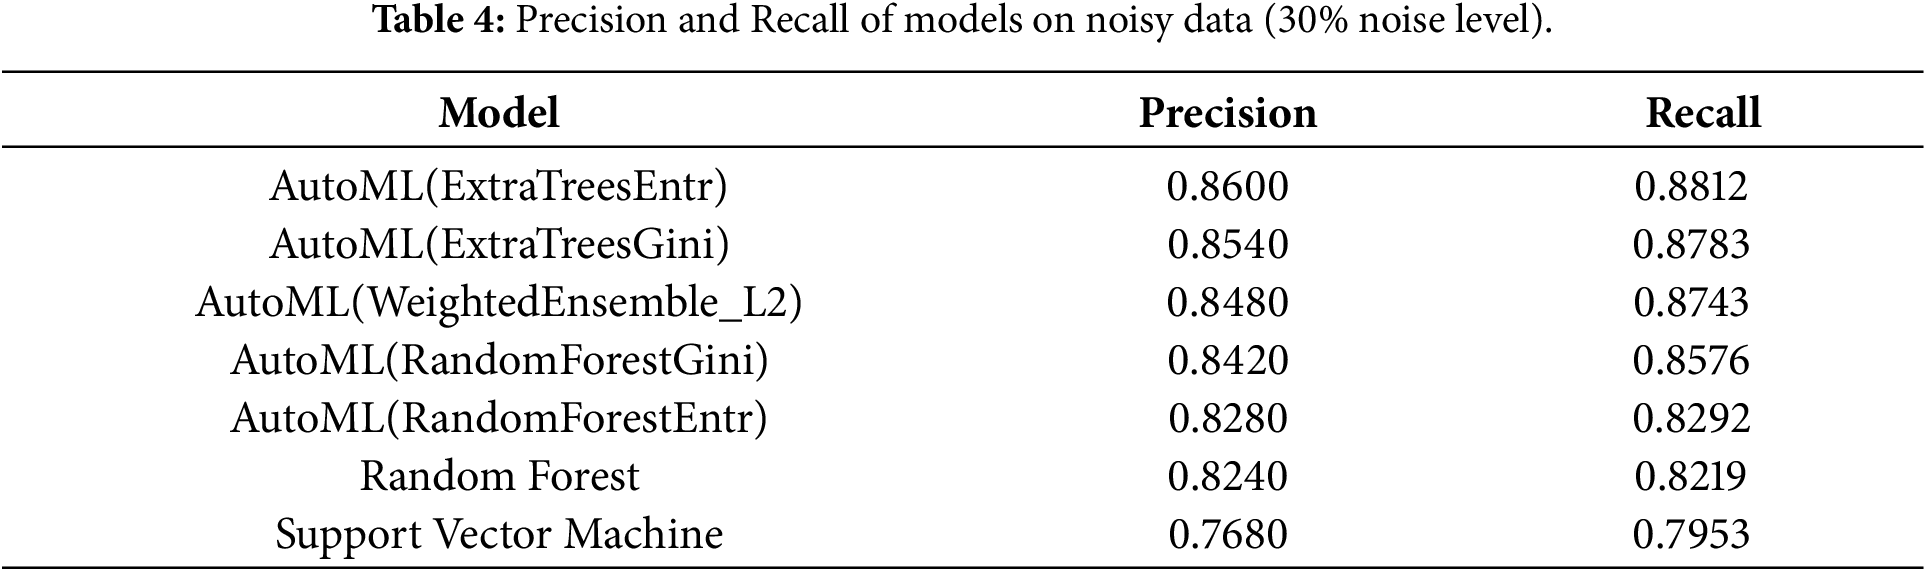
Based on the analysis of precision and recall under 30% noise conditions (Table 4), the AutoML-based ensemble models, particularly ExtraTrees, demonstrate significantly superior representational capacity and balanced diagnostic performance in high-noise environments through automated feature engineering and hyperparameter optimization. These models not only effectively capture essential feature patterns from noisy data but also exhibit strong characterization capabilities for complex fault features. The prevailing pattern, where recall rates generally exceed precision, indicates that while maintaining high representational power, the models prioritize avoiding missed fault detections. This strategic preference proves particularly valuable for industrial fault diagnosis scenarios where safety is paramount. In contrast, traditional models such as SVM and standalone Random Forest show limited expressiveness, with noticeable deficiencies in feature extraction and pattern recognition. Although retaining basic classification capability, their substantial performance degradation under noise interference further highlights the pivotal role of automated machine learning frameworks in enhancing model representational capacity and strengthening diagnostic robustness and reliability in complex industrial environments.
In summary, AutoML exhibits remarkable adaptability. Through ensemble learning and feature optimization, it achieves high classification accuracy and maintains stable performance under noisy conditions. The synergy between multimodal feature fusion and AutoML’s built-in denoising functions further enhances robustness. Traditional machine learning methods, such as Random Forest and SVM, suffer significant performance degradation in noisy environments, as they rely heavily on manually designed features and exhibit inherent limitations in handling complex, noisy data. The results demonstrate that AutoML frameworks consistently outperform traditional models under varying data quality conditions, particularly in balancing robustness and accuracy, thereby offering an efficient and reliable intelligent solution for mechanical fault diagnosis.
The confusion matrix is a key tool for evaluating the performance of classification models in machine learning, as it effectively reveals the prediction accuracy across different categories and highlights potential classification biases. It systematically presents the correspondence between true and predicted labels, where the diagonal elements represent the proportion of correctly classified samples, and the off-diagonal elements reflect misclassifications between categories. In practical applications, normalized confusion matrices are plotted using the Seaborn library, combining color coding with numerical annotations to visually illustrate classification outcomes.
5.3.1 Diagnostic Performance under Noise-Free Conditions
To investigate the classification performance of single-modality data, experiments were conducted on both acoustic and vibration signals. The confusion matrices are shown in Fig. 9.
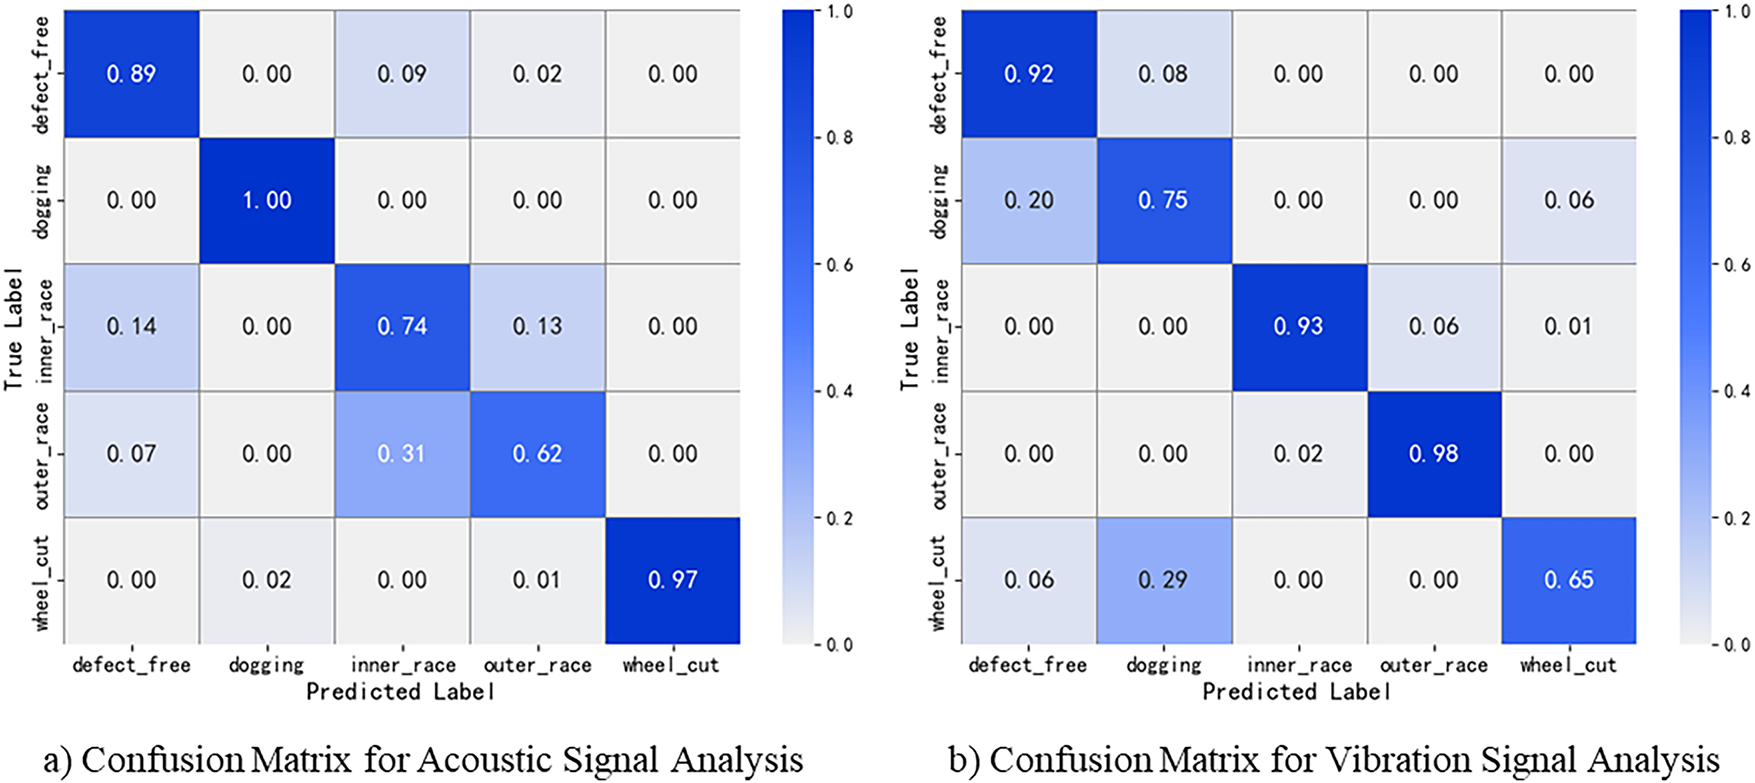
Figure 9: Confusion matrices of AutoML (XGBoost) for acoustic and vibration signals.
For the acoustic signal, the accuracy for the clogging class was 0.89, with 0.09 misclassified as inner_race and 0.02 as outer_race. The wheel_cut class achieved perfect classification with an accuracy of 1.00, indicating that the model captured its distinctive features effectively. The inner_race class reached an accuracy of 0.74, with 0.14 and 0.13 misclassified as clogging and outer_race, respectively. The outer_race class had an accuracy of 0.62, with many samples misclassified as inner_race, suggesting insufficient discriminative power of acoustic signals for this fault. The defect-free class achieved an accuracy of 0.97, with only 0.02 and 0.01 misclassified as wheel_cut and outer_race.
For the vibration signal, the clogging class achieved an accuracy of 0.92, with 0.08 misclassified as wheel_cut. This indicates that the model effectively captured the major features of this fault but exhibited limited ability to distinguish low-frequency components similar to wheel_cut. The wheel_cut class achieved an accuracy of 0.75, with 0.20 misclassified as clogging and 0.06 as defect_free, reflecting partial feature overlap with other classes. The inner_race class reached an accuracy of 0.93, with 0.06 misclassified as outer_race and 0.01 as defect_free, demonstrating relatively accurate recognition of core features, though still susceptible to minor disturbances. The outer_race class performed excellently with an accuracy of 0.98, with only 0.02 misclassified as inner_race, showing high feature separability. The defect-free class had an accuracy of 0.65, with many samples misclassified as clogging and wheel_cut, indicating that vibration signals under normal conditions are prone to low-frequency interference, which can be confused with early fault features.
Analysis of the confusion matrices for acoustic and vibration signals yields the following conclusion. Acoustic signals show limited capability in distinguishing high-frequency fault features, while vibration signals under normal conditions are vulnerable to low-frequency disturbances. Each modality exhibits limitations in certain categories, highlighting the necessity of multimodal fusion to leverage complementary information for improved overall classification accuracy. This validates the rationale for conducting multimodal experiments.
5.3.2 Diagnostic Performance under Multimodal Data
As shown in Fig. 10, the multimodal confusion matrix demonstrates the classification performance of the AutoML model after integrating acoustic and vibration signals. Both the clogging and wheel-cut classes achieved perfect accuracy (1.0), eliminating the misclassification issues observed in single-modality experiments. The inner_race class achieved an accuracy of 0.92, surpassing both acoustic (0.74) and vibration (0.93) single modalities. The outer_race class reached an accuracy of 1.0, showing substantial improvement over single-modality results. The defect-free class achieved an accuracy of 0.96, with a significantly reduced misclassification rate compared to single-modality models. Overall, multimodal fusion effectively combined complementary features from acoustic and vibration signals, substantially enhancing fault recognition accuracy and reducing confusion caused by low-frequency interference and high-frequency feature overlap.
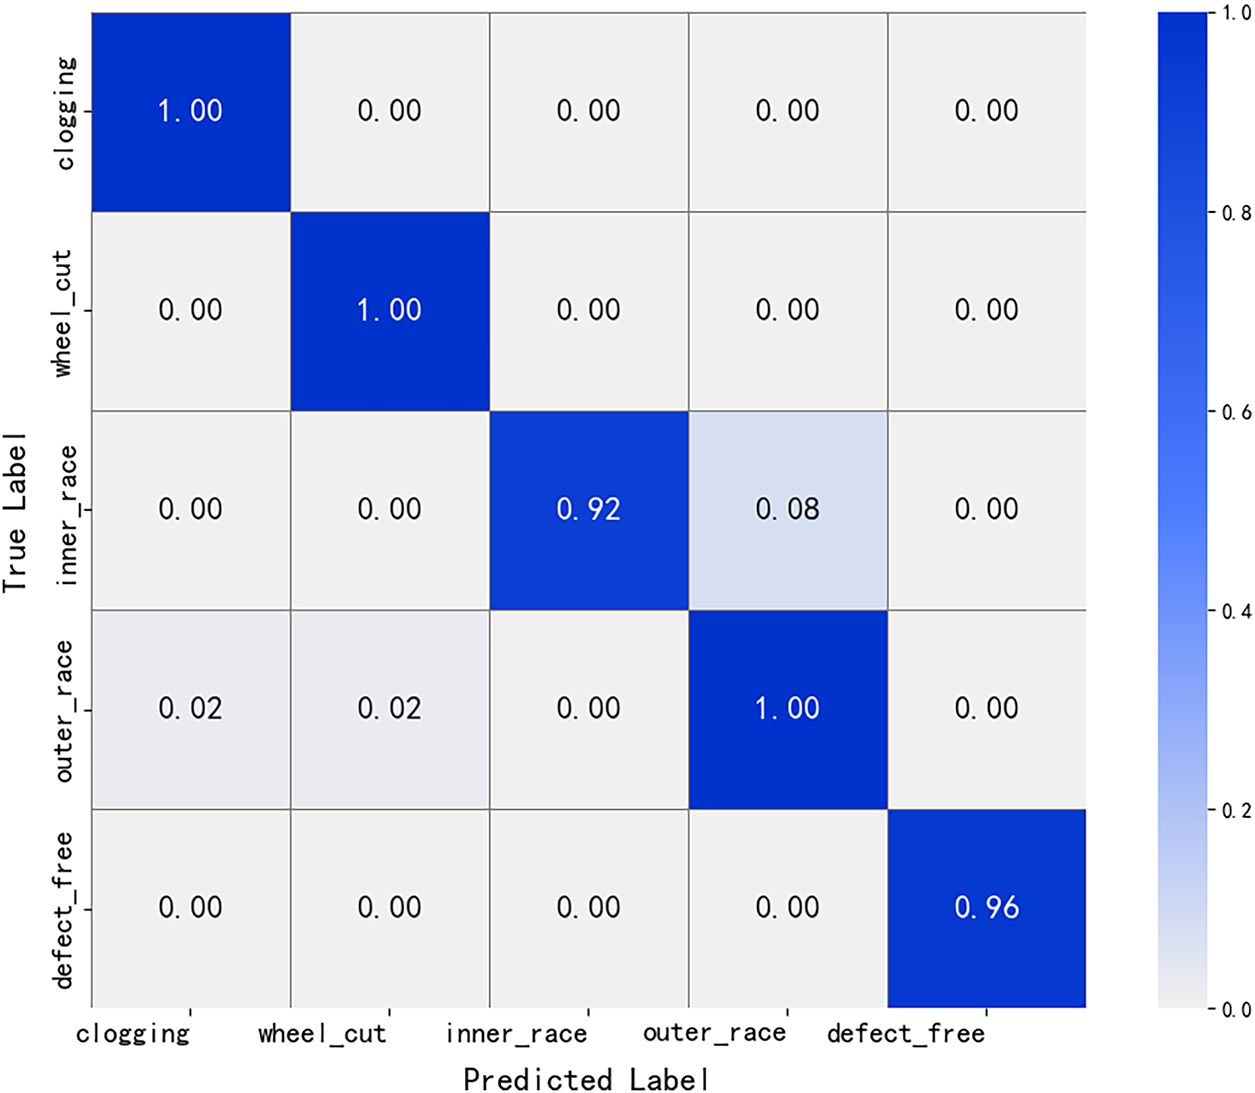
Figure 10: Confusion matrix of AutoML (XGBoost) for multimodal data.
5.4 t-SNE Visualization of Feature Distributions
t-SNE was applied to the acoustic, vibration, and multimodal features for dimensionality reduction, with results shown in Fig. 11.
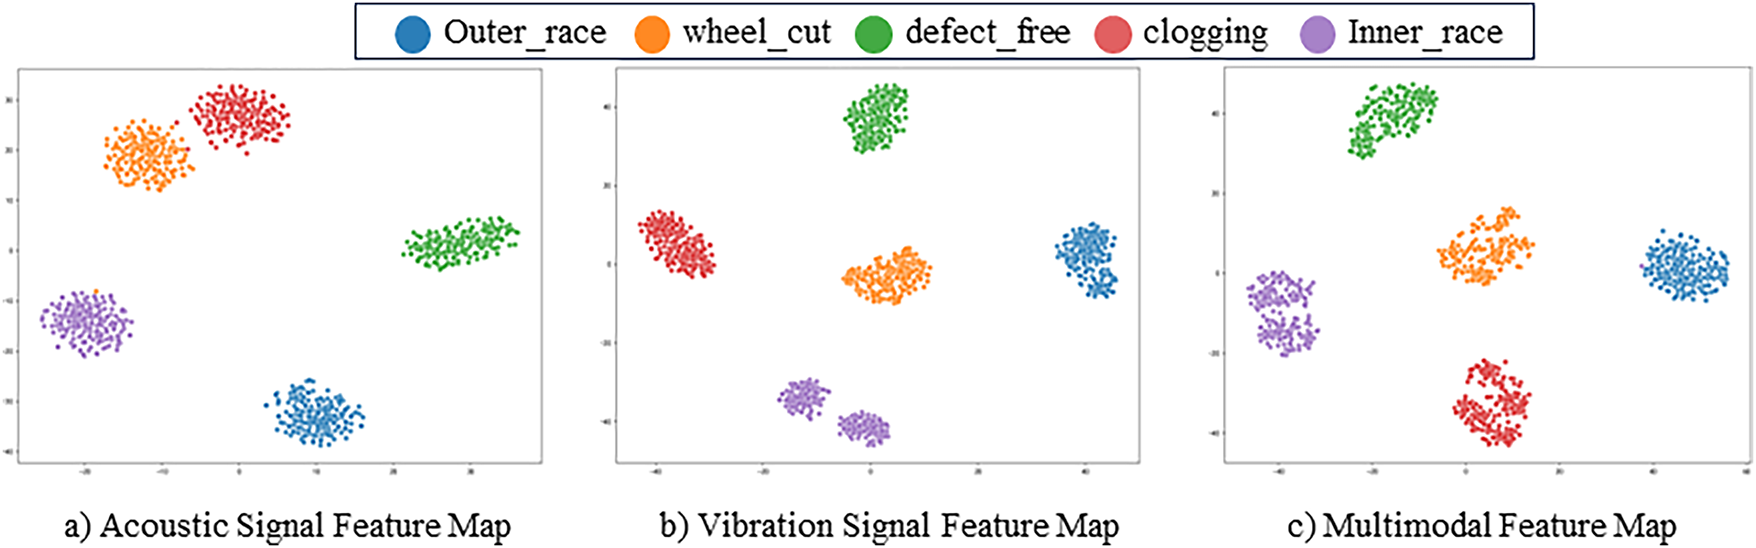
Figure 11: t-SNE visualization of acoustic, vibration, and multimodal features.
For acoustic features, strong overlap was observed between the wheel_cut and clogging classes, while the inner_race class was insufficiently separated from other categories. This indicates that acoustic signals are limited by high-frequency noise and feature similarity in distinguishing certain faults.
For vibration features, the defect-free class showed partial separation, but the inner-race class overlapped slightly with other categories, and overall distribution compactness was lacking, suggesting limited discriminative power for certain faults.
For multimodal features, the outer_race, wheel_cut, clogging, inner_race, and defect_free classes exhibited compact distributions with clear boundaries and almost no overlap. This confirms that multimodal fusion effectively integrates complementary acoustic and vibration information, enhances feature separability, and provides superior input for classification models, thereby validating the advantage of multimodal approaches in fault diagnosis.
This study presents an intelligent multimodal fault diagnosis framework that integrates Mel-spectrogram feature extraction with automated machine learning, offering a scalable and generalizable paradigm for intelligent machinery maintenance. By leveraging the complementary advantages of acoustic and vibration modalities, the framework achieves accurate and robust fault recognition even under strong noise interference. Experiments on a centrifugal pump dataset verified that the proposed method substantially outperforms traditional models, demonstrating its strong adaptability and practical potential for deployment in real industrial environments. Beyond empirical results, this study contributes a forward-looking perspective on the integration of AutoML and multimodal analytics in mechanical systems. The framework not only eliminates the dependence on expert-driven feature engineering but also establishes an end-to-end intelligent modeling process capable of autonomous optimization and cross-domain adaptability. These advances mark an important step toward self-evolving, data-efficient diagnostic systems in the era of intelligent manufacturing.
Although the research has achieved substantial progress, further exploration is still warranted in several promising directions. Firstly, Future work will extend the multimodal sensing system by integrating additional information sources such as temperature and current signals. Advanced cross-modal fusion algorithms—such as attention-guided feature weighting and dynamic temporal alignment (e.g., dynamic time warping)—will be explored to enhance the interpretability and consistency of complex fault patterns. Secondly, for edge intelligence scenarios, lightweight AutoML compression techniques, including knowledge distillation and pruning, will be developed to reduce computational overhead. Combined with interpretability frameworks such as SHAP and local interpretable model-agnostic explanations (LIME), a “white-box analysis architecture” will be established to improve transparency and engineering trustworthiness. Finally, Future validation will extend beyond centrifugal pumps to other representative machinery such as gearboxes and compressors, thereby enhancing cross-system generalization and accelerating the transition from laboratory research to industrial implementation.
Acknowledgement: Not applicable.
Funding Statement: This work was supported in part by the National Natural Science Foundation of China under Grants 52475102 and 52205101, in part by the Guangdong Basic and Applied Basic Research Foundation under Grant 2023A1515240021, in part by the Young Talent Support Project of Guangzhou Association for Science and Technology (QT-2024-28), and in part by the Youth Development Initiative of Guangdong Association for Science and Technology (SKXRC2025254).
Author Contributions: Zehao Li: Writing—original draft, Validation, Software, Methodology, Funding acquisition. Xuting Zhang: Writing—original draft, Resources, Investigation, Methodology, Data curation. Hongqi Lin: Methodology, Data curation, Resources. Wu Qin: Methodology, Data curation, Resources. Junyu Qi: Validation, Resources, Investigation. Zhuyun Chen: Methodology, Validation, Resources, Investigation, Funding acquisition. Qiang Liu: Review & editing, Resources, Project administration, Methodology, Investigation. All authors reviewed and approved the final version of the manuscript.
Availability of Data and Materials: Data will be made available on request.
Ethics Approval: Not applicable. This study focuses on signal processing and fault diagnosis, and it does not involve human or animal subjects.
Conflicts of Interest: The authors declare no conflicts of interest.
References
1. Zhu Z, Lei Y, Qi G, Chai Y, Mazur N, An Y, et al. A review of the application of deep learning in intelligent fault diagnosis of rotating machinery. Measurement. 2023;206:112346. doi:10.1016/j.measurement.2022.112346. [Google Scholar] [CrossRef]
2. Gawde S, Patil S, Kumar S, Kamat P, Kotecha K, Abraham A. Multi-fault diagnosis of industrial rotating machines using data-driven approach: a review of two decades of research. Eng Appl Artif Intell. 2023;123:106139. doi:10.1016/j.engappai.2023.106139. [Google Scholar] [CrossRef]
3. Chen X, Yang R, Xue Y, Huang M, Ferrero R, Wang Z. Deep transfer learning for bearing fault diagnosis: a systematic review since 2016. IEEE Trans Instrum Meas. 2023;72(1):1–21. doi:10.1109/tim.2023.3244237. [Google Scholar] [CrossRef]
4. Gao Z, Cecati C, Ding SX. A survey of fault diagnosis and fault-tolerant techniques—part I: fault diagnosis with model-based and signal-based approaches. IEEE Trans Ind Electron. 2015;62(6):3757–67. doi:10.1109/tie.2015.2417501. [Google Scholar] [CrossRef]
5. Iunusova E, Gonzalez MK, Szipka K, Archenti A. Early fault diagnosis in rolling element bearings: comparative analysis of a knowledge-based and a data-driven approach. J Intell Manuf. 2024;35(5):2327–47. doi:10.1007/s10845-023-02151-y. [Google Scholar] [CrossRef]
6. Altaf M, Akram T, Khan MA, Iqbal M, Ch MMI, Hsu CH. A new statistical features based approach for bearing fault diagnosis using vibration signals. Sensors. 2022;22(5):2012. doi:10.3390/s22052012. [Google Scholar] [PubMed] [CrossRef]
7. Zhang M, Jiang Z, Feng K. Research on variational mode decomposition in rolling bearings fault diagnosis of the multistage centrifugal pump. Mech Syst Signal Process. 2017;93:460–93. doi:10.1016/j.ymssp.2017.02.013. [Google Scholar] [CrossRef]
8. Łuczak D. Machine fault diagnosis through vibration analysis: continuous wavelet transform with complex morlet wavelet and time-frequency RGB image recognition via convolutional neural network. Electronics. 2024;13(2):452. doi:10.3390/electronics13020452. [Google Scholar] [CrossRef]
9. Guo J, Yang Y, Li H, Dai L, Huang B. A parallel deep neural network for intelligent fault diagnosis of drilling pumps. Eng Appl Artif Intell. 2024;133:108071. doi:10.1016/j.engappai.2024.108071. [Google Scholar] [CrossRef]
10. Lin H, Huang X, Chen Z, He G, Xi C, Li W. Matching pursuit network: an interpretable sparse time-frequency representation method toward mechanical fault diagnosis. IEEE Trans Neural Netw Learn Syst. 2025;36(7):12377–88. doi:10.1109/tnnls.2024.3483954. [Google Scholar] [PubMed] [CrossRef]
11. Yao Y, Gui G, Yang S, Zhang S. A recursive denoising learning for gear fault diagnosis based on acoustic signal in real industrial noise condition. IEEE Trans Instrum Meas. 2021;70:1–15. doi:10.1109/tim.2021.3108216. [Google Scholar] [CrossRef]
12. Ma Z, Chen Y, Zhang T, Liao Z. An enhanced spectral amplitude modulation method for fault diagnosis of rolling bearings. Machines. 2024;12(11):779. doi:10.3390/machines12110779. [Google Scholar] [CrossRef]
13. Zheng J, Liao J, Chen Z. End-to-end continuous/discontinuous feature fusion method with attention for rolling bearing fault diagnosis. Sensors. 2022;22(17):6489. doi:10.3390/s22176489. [Google Scholar] [PubMed] [CrossRef]
14. Yang J, Yin S, Sun C, Gao T. A novel convolutional neural network with interference suppression for the fault diagnosis of mechanical rotating components. Neural Comput Appl. 2022;34(13):10971–87. doi:10.1007/s00521-022-07022-w. [Google Scholar] [CrossRef]
15. Hu C, Liu Z, Xiao X, Jin Y, Wang T, Zhou L, et al. A degradation evaluation method with the convolutional neural network for the cyclic symmetry rolling bearing. Meas Sci Technol. 2025;36(1):016188. doi:10.1088/1361-6501/ad9629. [Google Scholar] [CrossRef]
16. Hu ZX, Wang Y, Ge MF, Liu J. Data-driven fault diagnosis method based on compressed sensing and improved multiscale network. IEEE Trans Ind Electron. 2020;67(4):3216–25. doi:10.1109/tie.2019.2912763. [Google Scholar] [CrossRef]
17. Zarouan M, Mehedi IM, Latif SA, Rana MM. Gradient optimizer algorithm with hybrid deep learning based failure detection and classification in the industrial environment. Comput Model Eng Sci. 2024;138(2):1341–64. doi:10.32604/cmes.2023.030037. [Google Scholar] [CrossRef]
18. Zhang W, Zhang T, Cui G, Pan Y. Intelligent machine fault diagnosis using convolutional neural networks and transfer learning. IEEE Access. 2022;10:50959–73. doi:10.1109/access.2022.3173444. [Google Scholar] [CrossRef]
19. Mahmoud MS, Huynh VK, Senanyaka JSL, Robbersmyr KG. Robust multiple-fault diagnosis of PMSM drives under variant operations and noisy conditions. IEEE Open J Ind Electron Soc. 2023;4:762–72. doi:10.1109/ojies.2024.3350443. [Google Scholar] [CrossRef]
20. Wang Y, Xu C, Wang Y, Cheng X. A comprehensive diagnosis method of rolling bearing fault based on CEEMDAN-DFA-improved wavelet threshold function and QPSO-MPE-SVM. Entropy. 2021;23(9):1142. doi:10.3390/e23091142. [Google Scholar] [PubMed] [CrossRef]
21. Xia J, Huang R, Chen Z, He G, Li W. A novel digital twin-driven approach based on physical-virtual data fusion for gearbox fault diagnosis. Reliab Eng Syst Saf. 2023;240:109542. doi:10.1016/j.ress.2023.109542. [Google Scholar] [CrossRef]
22. Xia J, Chen Z, Chen J, He G, Huang R, Li W. A digital twin-driven approach for partial domain fault diagnosis of rotating machinery. Eng Appl Artif Intell. 2024;131:107848. doi:10.1016/j.engappai.2024.107848. [Google Scholar] [CrossRef]
23. Xiang J, Zhong Y. A novel personalized diagnosis methodology using numerical simulation and an intelligent method to detect faults in a shaft. Appl Sci. 2016;6(12):414. doi:10.3390/app6120414. [Google Scholar] [CrossRef]
24. Gao Y, Liu X, Xiang J. Fault detection in gears using fault samples enlarged by a combination of numerical simulation and a generative adversarial network. IEEE/ASME Trans Mechatron. 2022;27(5):3798–805. doi:10.1109/tmech.2021.3132459. [Google Scholar] [CrossRef]
25. Liu R, Lin Z. Bilevel optimization for automated machine learning: a new perspective on framework and algorithm. Natl Sci Rev. 2024;11(8):1–2. doi:10.1093/nsr/nwad292. [Google Scholar] [PubMed] [CrossRef]
26. Larocque-Villiers J, Dumond P, Knox D. Automating predictive maintenance using state-based transfer learning and ensemble methods. In: Proceedings of the 2021 IEEE International Symposium on Robotic and Sensors Environments (ROSE); 2021 Oct 28–29; Virtual. [Google Scholar]
27. Li X, Zheng J, Li M, Ma W, Hu Y. One-shot neural architecture search for fault diagnosis using vibration signals. Expert Syst Appl. 2022;190(1):116027. doi:10.1016/j.eswa.2021.116027. [Google Scholar] [CrossRef]
28. Kefalas M, Baratchi M, Apostolidis A, van den Herik D, Back T. Automated machine learning for remaining useful life estimation of aircraft engines. In: Proceedings of the 2021 IEEE International Conference on Prognostics and Health Management (ICPHM); 2021 Jun 7–9; Detroit, MI, USA. [Google Scholar]
29. Nascimento M, Lopes P. Internet of Things and machine learning applied to the thermal comfort of internal environments. Indoor Built Environ. 2022;31(9):2274–90. doi:10.1177/1420326x221097338. [Google Scholar] [CrossRef]
30. Wang Z, Wang J, Sun Y. Review of spectrum analysis in fault diagnosis for mechanical equipment. Eng Res Express. 2023;5(4):042001. doi:10.1088/2631-8695/acfae2. [Google Scholar] [CrossRef]
31. Xu L, Xia C, Chang L. Dynamic modeling and vibration analysis of an RV reducer with defective needle roller bearings. Eng Fail Anal. 2024;157:107884. doi:10.1016/j.engfailanal.2023.107884. [Google Scholar] [CrossRef]
32. Delvecchio S, Bonfiglio P, Pompoli F. Vibro-acoustic condition monitoring of internal combustion engines: a critical review of existing techniques. Mech Syst Signal Process. 2018;99:661–83. doi:10.1016/j.ymssp.2017.06.033. [Google Scholar] [CrossRef]
33. Sun B, Sheng Z, Song P, Sun H, Wang F, Sun X, et al. State-of-the-art detection and diagnosis methods for rolling bearing defects: a comprehensive review. Appl Sci. 2025;15(2):1001. doi:10.3390/app15021001. [Google Scholar] [CrossRef]
34. Bischl B, Binder M, Lang M, Pielok T, Richter J, Coors S, et al. Hyperparameter optimization: foundations, algorithms, best practices, and open challenges. Wiley Interdiscip Rev Data Min Knowl Discov. 2023;13(2):e1484. doi:10.1002/widm.1484. [Google Scholar] [CrossRef]
35. Kumar A, Tang H, Vashishtha G, Xiang J. Noise subtraction and marginal enhanced square envelope spectrum (MESES) for the identification of bearing defects in centrifugal and axial pump. Mech Syst Signal Process. 2022;165:108366. doi:10.1016/j.ymssp.2021.108366. [Google Scholar] [CrossRef]
36. Kumar A, Gandhi CP, Zhou Y, Kumar R, Xiang J. Improved deep convolution neural network (CNN) for the identification of defects in the centrifugal pump using acoustic images. Appl Acoust. 2020;167:107399. doi:10.1016/j.apacoust.2020.107399. [Google Scholar] [CrossRef]
Cite This Article
 Copyright © 2026 The Author(s). Published by Tech Science Press.
This work is licensed under a Creative Commons Attribution 4.0 International License , which permits unrestricted use, distribution, and reproduction in any medium, provided the original work is properly cited.
 Downloads
 Citation Tools