
 Submit a Paper
 Propose a Special lssue
 Open Access
ARTICLE

Experimental and Numerical Optimization of Prestressed Anchor Cable Support for In-Situ Large-Span Tunnel Expansion with an Energy Balance Framework
1 Shandong Hi-Speed Infrastructure Construction Co., Ltd., Jinan, China
2 Shandong Hi-speed South Ring Expressway Co., Ltd., Jinan, China
3 State Key Laboratory of Intelligent Construction and Healthy Operation and Maintenance of Deep Underground Engineering, China University of Mining and Technology, Xuzhou, China
* Corresponding Author: Xiaoliang Dong. Email:
(This article belongs to the Special Issue: Artificial Intelligence and Advanced Numerical Modeling Integration Techniques in Tunnel and Underground Engineering)
Computer Modeling in Engineering & Sciences 2026, 146(2), 19 https://doi.org/10.32604/cmes.2026.076381
Received 19 November 2025; Accepted 21 January 2026; Issue published 26 February 2026
 View Full Text
 Download PDF
Abstract
In-situ enlargement of super-large-span tunnels can intensify excavation-induced unloading in the surrounding rock, increasing deformation demand and failure risk during construction. This study combines laboratory model tests with FLAC3D simulations to evaluate the stabilizing role of prestressed anchor cables and to establish an energy-balance framework for support optimization. Comparative model tests of existing and enlarged tunnel sections, with and without anchors, show that reinforcement increases load-carrying capacity, reduces displacement, and confines damage to more localized zones. The numerical simulations reproduce displacement fields, shear-strain localization, and plastic-zone evolution with good agreement against the experimental observations. The energy framework is implemented in the in-situ simulations by quantifying unloading-related energy release in the rock mass and reinforcement work contributed by the anchors, and by introducing an energy release–reinforcement ratio as a stability indicator. Parametric analyses indicate that anchor length, spacing, and prestress influence stability in a nonlinear manner, with diminishing returns once reinforcement extends beyond the mechanically dominant deformation zone. An efficient parameter window is identified that improves deformation and yielding control while avoiding unnecessary reinforcement. The results provide an energy-consistent and design-oriented basis for prestressed anchorage selection in large-span tunnel expansion.Keywords
Rapid economic growth and increasing traffic have pushed many existing highway tunnels beyond their intended capacity. Tunnels originally built with two or three lanes often cannot meet demand [1]. Many regions responded by expanding these tunnels in situ to four or more lanes to accommodate increased flow [2]. Recent reconstruction-and-expansion practice has also promoted in-situ expansion concepts that rely on active pre-support using prestressed anchorage, including removable prestressed systems aimed at improving constructability and stability during expansion [3]. Expansion requires removal of the original lining and careful excavation of additional width [4]. This process disturbs the surrounding rock mass and triggers complex three-dimensional redistribution of stress within both the ground and the support system. As a result, such redistributions affect deformation, stability, and safety during and after construction. Studies on in-situ tunnel expansion confirm these effects and underline the need for robust design methods [5,6].
Ensuring stability and safety during tunnel expansion is crucial for both social and economic sustainability [7]. From the perspective of transportation networks, successful execution directly governs system reliability and congestion mitigation. From a risk management perspective, failure could lead to collapse, resulting in severe consequences for human life and economic assets [8]. These challenges highlight the necessity of a rigorous understanding of the coupled mechanical response of the surrounding rock mass and the prestressed bolt system during in-situ expansion of large-span tunnels. Establishing such understanding is a prerequisite for safe construction practice and provides the foundation for data-driven optimization of anchor cable design parameters [9–12].
Existing studies indicate that employing advanced reinforcement measures such as rock bolts or cables in tunnel widening projects can significantly mitigate deformation and maintain surrounding rock stability, especially in weak or shallow-ground conditions [13,14]. Innovative in-situ expansion methods now install pre-support anchors from within the original tunnel. This approach breaks the traditional “excavate-then-support” model by using the existing tunnel space to reinforce ahead of excavation and thus maximizing control of rock deformation [15,16]. Studies have demonstrated that the timely installation of systematic bolt-shotcrete support during early excavation stages greatly improves stability in the expansion process. He et al. [17] monitored a super-large-span tunnel expansion and found that blasting a new pilot tunnel without adequate pre-reinforcement severely damaged the temporary supports, underscoring the need for robust anchor bolt pre-support to reduce construction risks. Jia et al. [18] concluded that applying dense rock bolt support when converting a single-hole tunnel into a twin-arch configuration effectively constrained the loosening of surrounding rock, providing crucial stability control throughout the expansion process. Recent model-test work further supports the effectiveness of prestressed anchor-cable systems in improving stability and deformation control under complex geological conditions, providing experimental evidence that complements field monitoring and numerical analysis [19].
Combining numerical simulations with geo-mechanical model tests has become a prevalent approach to analyze complex mechanical responses during tunnel expansion and to validate support design theories [20–22]. Physical model experiments, following similarity principles, enable realistic replication of an expansion’s ground conditions and provide insight into the spatial effect of excavation on surrounding rock. Meanwhile, calibrated numerical models can help extend these findings and test various cases. Singh et al. [23] instrumented dozens of rock bolts over eight months and used the data to calibrate a refined numerical model. The simulated axial forces in the bolts closely replicated the monitored values, verifying the reliability of the model. Liu et al. [24] proposed an active support system using high-prestress rock bolts in large-span shallow tunnels, showing via simulation and field data that plastic zones shrink and deformation is significantly reduced. Sun et al. [25] investigated a large-section shallow tunnel under different pre-support schemes using numerical analysis and reported that appropriate pre-reinforcement significantly reduces face deformation and controls stress redistribution in the surrounding rock. Han et al. [16] compared multiple construction schemes through three-dimensional numerical analysis and validated the selected scheme using field monitoring, showing that simulation-guided scheme selection can improve safety in in-situ expansion practice.
At present, geo-mechanical modeling of large-span and super-large-span tunnels still focuses primarily on the deformation dynamics of surrounding rock and lining failure mechanisms under conventional passive grouted cables. By contrast, the coupled stress evolution between the rock mass and prestressed anchorage systems during in-situ cross-sectional expansion has received limited attention. Existing models seldom establish a quantitative framework for parameter optimization that is simultaneously grounded in mechanical response and stability-relevant state variables while encompassing critical variables such as cable length, spacing, and prestress. This limitation becomes more pronounced under staged unloading and stress-path-dependent damage, where displacement or force responses alone may not distinguish whether deformation is stabilizing or approaching an instability threshold. Recent tunnel mechanics studies have shown that tracking energy transformation and dissipation provides a physically consistent way to interpret progressive failure and the stabilizing role of support, because it directly quantifies elastic energy storage and irreversible energy consumption during excavation and support interaction [26–30]. Energy-balance formulations for tunnels further clarify how surrounding rock and support share and exchange energy, which offers a unified metric for comparing support strategies across different excavation stages and geological conditions [31,32]. These gaps motivate a more systematic framework that can connect prestressed support parameters with both deformation outcomes and energy-based stability indicators.
This study combines laboratory model tests and FLAC3D numerical simulations to evaluate tunnel expansion with and without prestressed anchor cable support. Physical tests on a scaled tunnel capture failure mode, deformations, and the restraint provided by anchors. Subsequently, calibrated numerical models apply an energy-based monitoring scheme, tracking energy storage and dissipation during staged expansion to quantify stability. By interpreting stability through the balance between stored elastic energy and dissipated energy in the coupled rock–support system, the proposed framework aims to reveal excavation stages that accumulate hazardous energy and to identify support configurations that shift the response toward controlled dissipation rather than unstable release. A parametric analysis of anchor length, spacing, and prestress level identifies support configurations that minimize convergence and plastic-zone growth, yielding practical guidance for optimizing prestressed anchor cable design in large-span expansion.
2 Expansion Construction Scheme of the Existing Tunnel
The Jinan Ring Expressway Tunnel is situated in Jinan City, Shandong Province, China, and serves as a key component of the regional expressway network. The original tunnel was constructed with an arched cross-section and an excavation diameter of 11.14 m, designed to accommodate the traffic demand at the time of construction. The expanded cross-section is approximately 23.84 m in width, equivalent to a large-span tunnel section.
2.2 Prototype and Model Geometry
The prototype tunnel geometry adopted in this study is defined by the Jinan Ring Expressway Tunnel cross-section described above. The original tunnel has an excavation diameter of 11.14 m, and the expanded section reaches a width of about 23.84 m. These prototype dimensions, together with the lining thickness and the anchor layout, are provided in Fig. 1 to ensure that the geometric configuration is fully reproducible.
Figure 1: Schematic of advance pre-reinforcement for tunnel enlargement: existing vs. expansion.
Both the laboratory model and the FLAC3D model are derived from the same prototype geometry. The physical model follows a consistent geometric scaling rule, meaning that the excavation boundary, lining thickness, and anchor layout are scaled from the prototype using a single geometric similarity ratio. The numerical model adopts the same tunnel outline and the same support layout definition as the laboratory configuration, while representing the excavation and reinforcement process through staged simulation. With this explicit mapping, the laboratory observations and numerical outputs can be interpreted within a unified geometric framework, and the comparative cases S01–S04 can be reproduced without relying on schematic assumptions.
2.3 Excavation Method and Support Design
Fig. 1 shows the configuration of the physical and numerical models adopted for tunnel excavation and expansion. Four representative cases were established to capture the influence of anchor cables on the mechanical response of the surrounding rock. Case S01 represents the original non-expansion excavation without anchor support, serving as a baseline. Case S02 considers the same non-expansion condition but incorporates anchor cables with an average length of 15.3 mm and a spacing of 12.1 mm, thereby providing a reinforced condition. Case S03 simulates the excavation of an enlarged tunnel without support, reflecting the instability challenges during in-situ expansion. Case S04 represents the expansion excavation reinforced by anchor cables, with an average cable length of 9.5 mm and spacing of 16.3 mm, designed to simulate the application of prestressed reinforcement. Together, these four cases establish a comparative framework to evaluate the deformation control and plastic zone evolution under different excavation and support conditions.
For completeness, the longitudinal layout of anchor rows is specified for both scales considered in this study. In the laboratory-scale model tests, the anchors are arranged in repeated rows along the specimen length, and the spacing between adjacent rows is 10 mm, consistent with the prefabricated geometry and the specimen size. For the in-situ numerical model, the tunnel enlargement is simulated as a stepwise advance along the tunnel axis following the construction stages described in Section 2.2, and the anchor cables are arranged uniformly with an axial row spacing of 2 m for all supported cases. The excavated and reinforced segment is positioned in the middle of the numerical domain, while additional buffer lengths are reserved at both ends to reduce axial boundary influence on the deformation and plasticity around the excavation.
Considering the inherent complexities associated with the construction of large-span tunnels, the expansion process employs the Center Diaphragm (CD) method. To ensure rock mass stability throughout the excavation phase, prestressed anchor cables are utilized. Pre-reinforcement cables are installed from the existing tunnel lining. Subsequently, during expansion, cables intersecting the excavation face are removed, whereas those embedded in unexcavated sections are preserved. The support system incorporates an intersected configuration of long and short bolts as shown in Fig. 1e. Short cables provide immediate stabilization, and the effects of long-cable parameters on rock mass response during excavation are investigated. The optimization focuses on cable length, spacing, and prestress, with candidate lengths ranging from 6 to 17 m, spacings of 1.0, 1.5, 2.0, and 2.5 m, and initial prestress levels of 80, 110, 140, and 170 kN.
The numerical simulations adopt a homogeneous material model calibrated against the mechanical properties obtained from laboratory tests. Two representative lithologies were employed to reflect different scales of analysis. Parameters for model simulation and in-situ simulation are shown in Table 1. The surrounding rock behavior was represented using a Mohr–Coulomb constitutive model.
3 Specimen Preparation and Experimental Methods
The laboratory tunnel blocks were designed as reduced-scale models that preserve the cross-sectional geometry of the prototype and allow consistent comparisons among cases. The geometric similarity ratio is defined as the prototype characteristic length divided by the model characteristic length. Using the excavation diameter of the existing tunnel as the reference length, the prototype diameter is 11.14 m and the corresponding model cavity diameter is 31.68 mm, which gives a geometric similarity ratio of about 352. The same scaling is applied to the span, height, lining profile, and the anchor layout within each cross-section, so the existing and enlarged geometries remain shape-consistent at model scale.
Mechanical similarity is described through stiffness and stress ratios so the interpretation remains transparent. The stiffness similarity ratio is defined as the prototype rock mass modulus divided by the mortar modulus measured from the companion coupon tests. The stress similarity ratio is defined as the prototype representative strength divided by the mortar compressive strength measured from the same batch, where the prototype properties are taken from the in-situ numerical model inputs and the associated site investigation basis. Under an elastic-dominant response, the strain similarity follows from the stress-to-stiffness ratio, and the displacement similarity follows from the geometric ratio multiplied by the strain ratio. In this study, these relationships are used to support consistent interpretation and numerical calibration, while strict one-to-one reproduction of the full prototype stress path is not targeted because the laboratory blocks are loaded under uniaxial compression with a preformed cavity. The prototype excavation sequence and confinement evolution are therefore addressed in the staged in-situ FLAC3D simulations, whereas the physical tests provide controlled comparative evidence of deformation, failure morphology, and reinforcement effectiveness under identical laboratory conditions.
As illustrated in Fig. 2, a modular mold-negative-casting workflow was employed to ensure geometric fidelity and batch consistency. Initially, cross-sectional formers representing both the existing tunnel and enlarged tunnel geometries were 3D-printed. Each former was then used to cast a reusable silicone negative mold, from which final cementitious blocks were produced through casting. All blocks have uniform nominal dimensions (100 × 50 × 100 mm), establishing a standardized comparison baseline.
Figure 2: Modeling and casting workflow for existing and expansion tunnel model specimens.
The mortar matrix was proportioned by mass at a fixed ratio of cement:sand:water = 1.0:0.8:0.5. Constituents were mechanically blended to achieve a homogeneous, pourable consistency. Specimens were demolded after the initial set and stored in suitable conditions for 28 days to reach maximum strength.
Radial anchor elements were fabricated as discrete components via 3D printing using a rigid resin, as shown in Fig. 2b,d. Before casting, the printed anchors were precisely positioned within silicone molds using a removable alignment fixture, ensuring their axes remained perpendicular to the tunnel intrados. The inner ends were aligned flush with the lining surface, while the tips were fully embedded during the subsequent mortar pouring. The room-temperature properties of the printing resin—featuring tensile strength 43.5 MPa, tensile modulus 2.20 GPa, elongation at break 5%, flexural strength 56.4 MPa, flexural modulus 1.44 GPa, impact strength 12 J m−1, and density 1.17 g cm−3—validate modeling the anchors as linear-elastic reinforcements within the tested load range.
The overall experimental procedure is summarized in the flow chart (Fig. 3). The workflow bridges the linkage between specimen preparation and anchor installation, Mechanical Testing System (MTS)-controlled uniaxial loading, DIC imaging, synchronized data acquisition, and post-processing of the key outputs.
Figure 3: Experimental methodology workflow.
Uniaxial compression tests were conducted using a servo-controlled MTS testing frame, as shown in Fig. 4. Each specimen was centered between loading pistons. Axial force and displacement were continuously recorded at 100 Hz through the high-precision transducers (±0.1% full-scale accuracy). Loading was applied under constant displacement control at a constant crosshead speed of 2 mm/min, with the test protocol extended beyond the peak load to fully characterize post-peak softening behavior. Testing was terminated when either the residual load capacity diminished below 30% of the peak load.
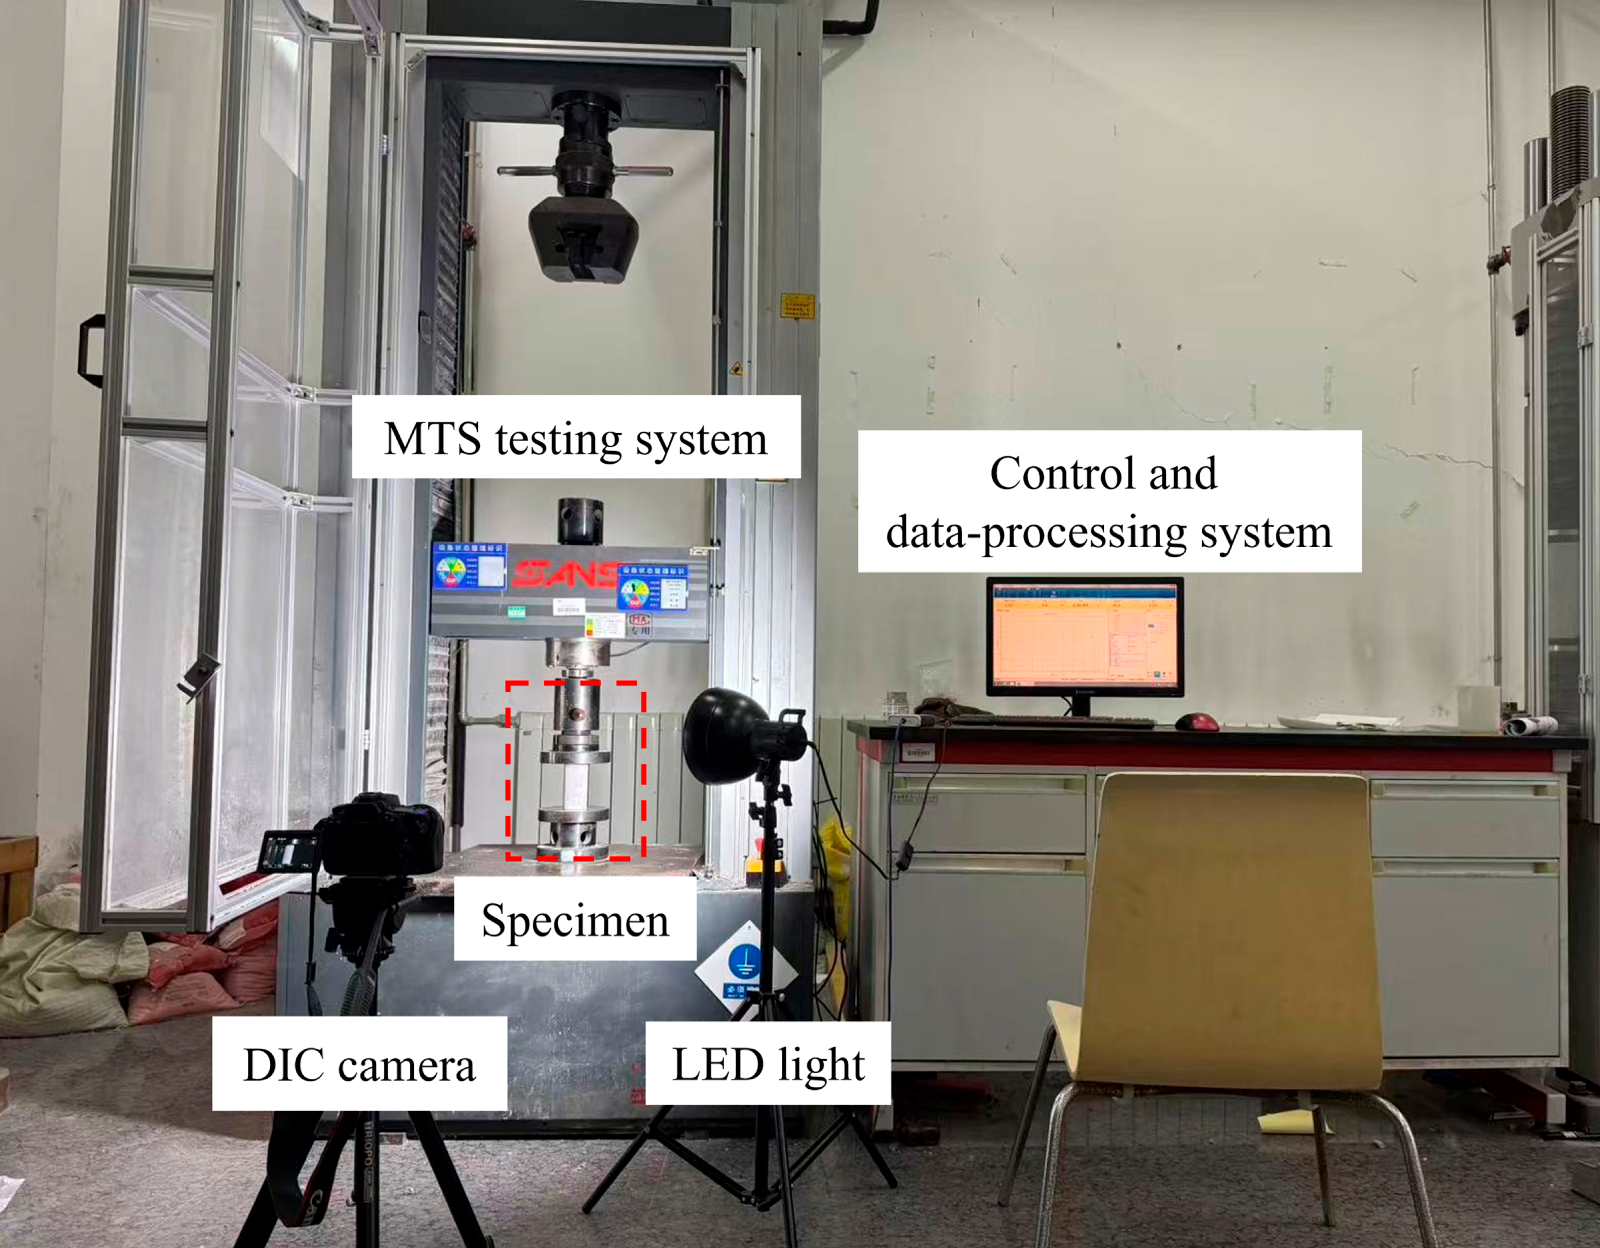
Figure 4: MTS rock mechanics test system.
Full-field deformation measurements were obtained via digital image correlation (DIC) with sub-pixel accuracy. The lateral surface of each block was prepared by applying a fine black speckle pattern, ensuring optimal contrast for strain tracking. A diffuse LED lighting system illuminated the surface uniformly, while images were captured by a high-resolution camera with vibration isolation.
The laboratory experiment is designed to provide a controlled comparison of reinforcement effects between the unanchored and anchored configurations under the same boundary and loading conditions. The uniaxial compression tests reproduce the dominant compression-driven damage and strain localization that develop around openings in weak geomaterials, which allows the influence of embedded anchors on peak resistance, post-peak softening, and deformation patterns to be quantified using synchronized MTS and DIC measurements. At the same time, the tests do not replicate the full in-situ stress path associated with tunnel enlargement. In particular, the physical specimens are not subjected to three-dimensional confinement, far-field stress anisotropy, or staged excavation-induced unloading, and scale-related boundary effects cannot be fully avoided. For this reason, the laboratory results are interpreted as mechanism-based evidence for the support contribution and as a validation reference for the numerical simulations, rather than as a direct reproduction of the field confinement conditions during in-situ tunnel expansion.
To validate the mortar matrix prepared with a cement:sand:water mass ratio of 1:0.8:0.5, companion coupons from an identical production batch underwent uniaxial compression testing on an MTS frame before block evaluation, as shown in Fig. 4. The recorded axial-force-displacement curves in Fig. 5 exhibited characteristic quasi-brittle behavior, with an initial peak followed by strain-softening accompanied by inclined shear cracking. These consistent failure patterns confirmed uniform matrix performance across all specimens, establishing a material-level benchmark for interpreting block responses and isolating the reinforcement effects of 3D-printed anchors in configurations S02 and S04.
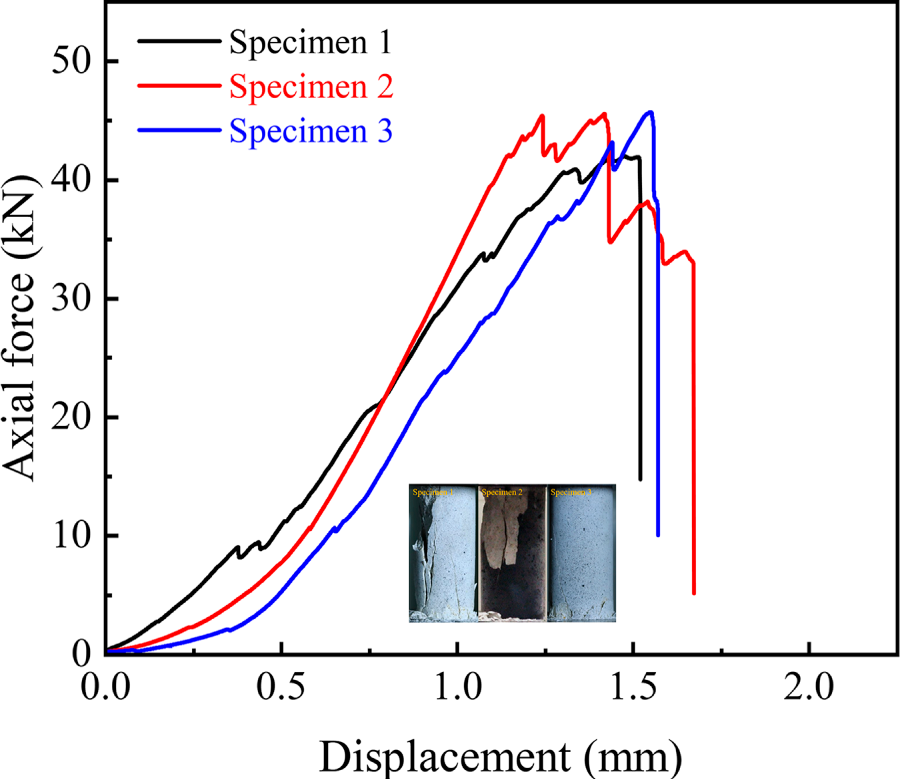
Figure 5: Mechanical experimental results of cylindrical specimen.
To clarify the correspondence between the laboratory material and the prototype rock mass, the study adopts a two-level strategy. At the laboratory scale, the cement–sand–water mortar is used as an analogue material to provide stable and repeatable quasi-brittle behavior for comparing the mechanical response of supported and unsupported cases under the same loading condition. Its mechanical response was characterized using companion cylinder tests (Fig. 5), and the measured parameters were used to calibrate the material parameters for the model-scale numerical simulation (Table 1, model simulation). At the prototype scale, the in-situ numerical model employs rock-mass parameters interpreted from the engineering geological investigation (Table 1, in-situ simulation) to reproduce the field-scale mechanical level and staged excavation effects. Therefore, the laboratory mortar is not intended to exactly replicate the absolute mechanical parameters of the in-situ rock mass; instead, it provides a controlled experimental benchmark for validating failure patterns and reinforcement effects, while the stress path and confinement evolution during excavation are addressed in the in-situ numerical analysis.
4 Geo-Mechanical Model Simulation and Experimental Validation
4.1 Experimental Test and Validation
To evaluate the effects of support on tunnel stability, four model cases are analyzed: S01—unexpanded tunnel without anchor support, S02—unexpanded tunnel with anchors, S03—expanded tunnel without anchors, and S04—expanded tunnel with anchors. The mechanical tests are conducted to study the deformations and mechanical characteristics of the specimens.
The mechanical tests measured how each tunnel model carries load and deforms until failure, with and without anchor cable support. Fig. 6a shows the axial force-displacement curve for the existing tunnel model. The unanchored specimen exhibits a lower peak load and a more abrupt post-peak drop, whereas the anchored sample reaches a higher peak axial force and sustains the load more steadily. Specifically, the peak load of the anchored existing tunnel is about 21% higher than that of the unanchored, demonstrating a significant increase in ultimate bearing capacity due to the support of anchors. Meanwhile, the displacement at peak is reduced for the anchored case. The anchored specimen reached its peak load at a displacement of about 0.256 mm less than that of the unanchored specimen. This suggests that the anchor support stiffens the system, achieving higher strength with less deformation.
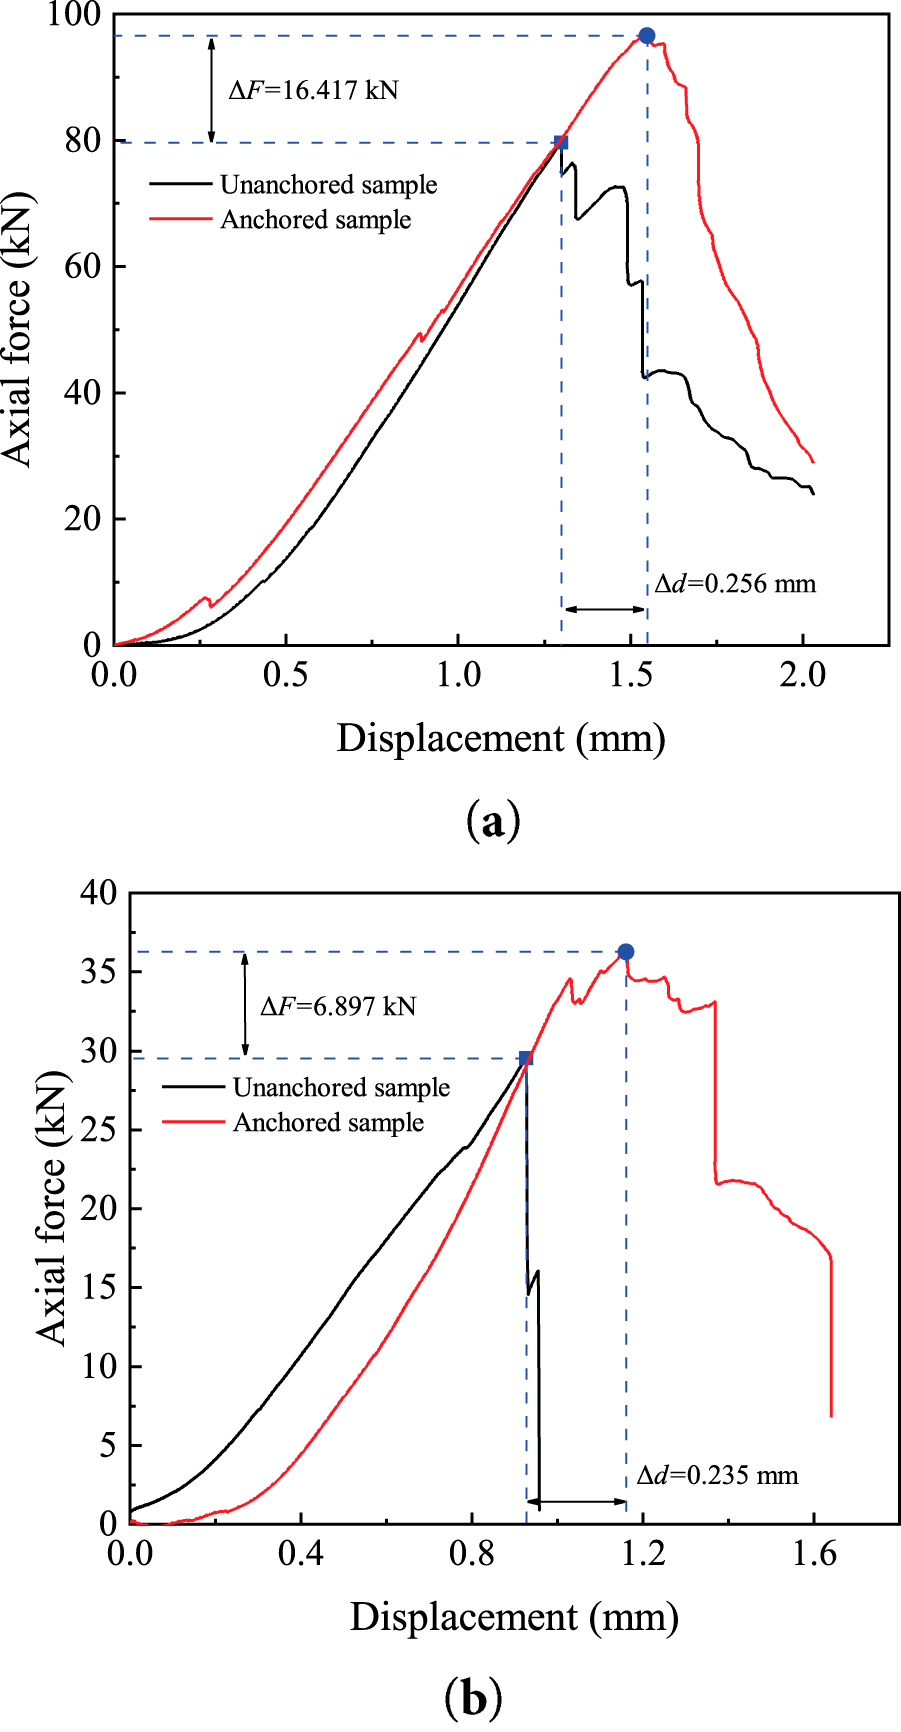
Figure 6: Mechanical experimental results and deformation mode of existing tunnel model samples. (a) Axial force–displacement curve of the existing tunnel model; (b) Axial force–displacement curve of the enlarged tunnel model.
Fig. 6b presents the results for the expanded tunnel model. Compared with the original geometry, the unanchored expanded specimen exhibits a lower peak load, indicating that enlargement leads to a more unfavorable mechanical response under the same loading condition when no reinforcement is provided. After anchors are installed in the expanded model, the peak force increases, with an increment of about 6.897 kN relative to the unanchored expanded case, and the peak displacement increases by about 0.235 mm, reflecting an improved load-carrying capacity accompanied by a higher deformation tolerance at peak. The support effect is therefore evaluated through within-geometry comparisons, meaning S01 vs. S02 for the original tunnel and S03 vs. S04 for the expanded tunnel, which avoids confounding from non-identical anchor layouts across geometries. Under this consistent comparison, anchoring provides a clear enhancement in the expanded configuration, although the enlargement still amplifies deformation demand and makes deformation control more challenging than in the original section. These observations support the role of anchors in mitigating expansion-related instability, while the absolute capacity difference between anchored cases is not interpreted as a pure expansion effect because the support configurations are different.
The experimental force-displacement curves show that anchor reinforcement leads to a higher load-bearing capacity and a more ductile failure behavior, indicating improved stability. The fact that the anchored expanded tunnel of S04 still has a lower absolute strength than the anchored original tunnel of S02 emphasizes the impact of the expansion. However, the support narrows this gap considerably.
4.2 Numerical Simulation of the Tunnel Model
To fully verify the validity of the mechanical model tests and the degree of alignment between the results, a numerical simulation was performed using FLAC3D. The size of the model was kept the same as in the mechanical tests. The rock mass was modeled with a Mohr-Coulomb constitutive model. The parameter sets were calibrated from the laboratory material characterization for the model-scale study and from project inputs for the in-situ study, as summarized in Table 1. The mesh was refined around the excavation boundary and the anchorage zone to capture shear localization and plastic development, while a coarser discretization was used away from the tunnel to maintain computational efficiency. Boundary extents were selected to limit boundary effects on the tunnel response, and the influence of key modelling choices was checked qualitatively by confirming that the case-to-case trends remain unchanged under reasonable variations in mesh density and boundary distance.
The model boundaries were placed sufficiently far from the excavation profile to reduce boundary influence on the tunnel response. Normal displacement was constrained on the lateral boundaries, while tangential movement was allowed, and the bottom boundary was fixed in the vertical direction to provide a stable support condition. The in-situ stress state was represented using a vertical stress derived from the overburden depth adopted for this project and a lateral-to-vertical stress ratio taken from the design assumptions and site interpretation. The initial vertical stress was defined from unit weight and overburden depth, and the horizontal stresses were assigned from the selected stress ratio. Initial stresses were generated in FLAC3D by applying the target stress field and solving to mechanical equilibrium before excavation, with the displacement field reset so subsequent deformation reflects excavation and support effects. Excavation was simulated through staged zone removal following the enlargement sequence, and each stage was solved to equilibrium using mechanical damping. Convergence was checked using the unbalanced force level, and the calculation proceeded to the next stage only after the equilibrium criterion was satisfied, so the reported contours reflect stable states after each excavation step.
For consistency with the laboratory force–displacement curves shown in Fig. 6, the numerical results were post-processed to obtain an equivalent force–displacement output for each case. The axial force was extracted as the vertical reaction force at the loading platen in the FLAC3D model, and the displacement was taken as the corresponding platen movement, so the numerical output follows the same definition as the experimental measurement. Using this consistent framework, the comparison is reported through the maximum load and the displacement at the maximum load for cases S01–S04. The maximum loads for S01, S02, S03, and S04 are 92.11, 83.46, 38.26, and 27.82 kN, respectively, and the corresponding displacements are 1.64, 1.21, 1.22, and 0.87 mm. These values are summarized together with the pointwise percentage differences in Table 2, which enables a direct one-to-one validation in the same output format as Fig. 6 without introducing an additional figure.
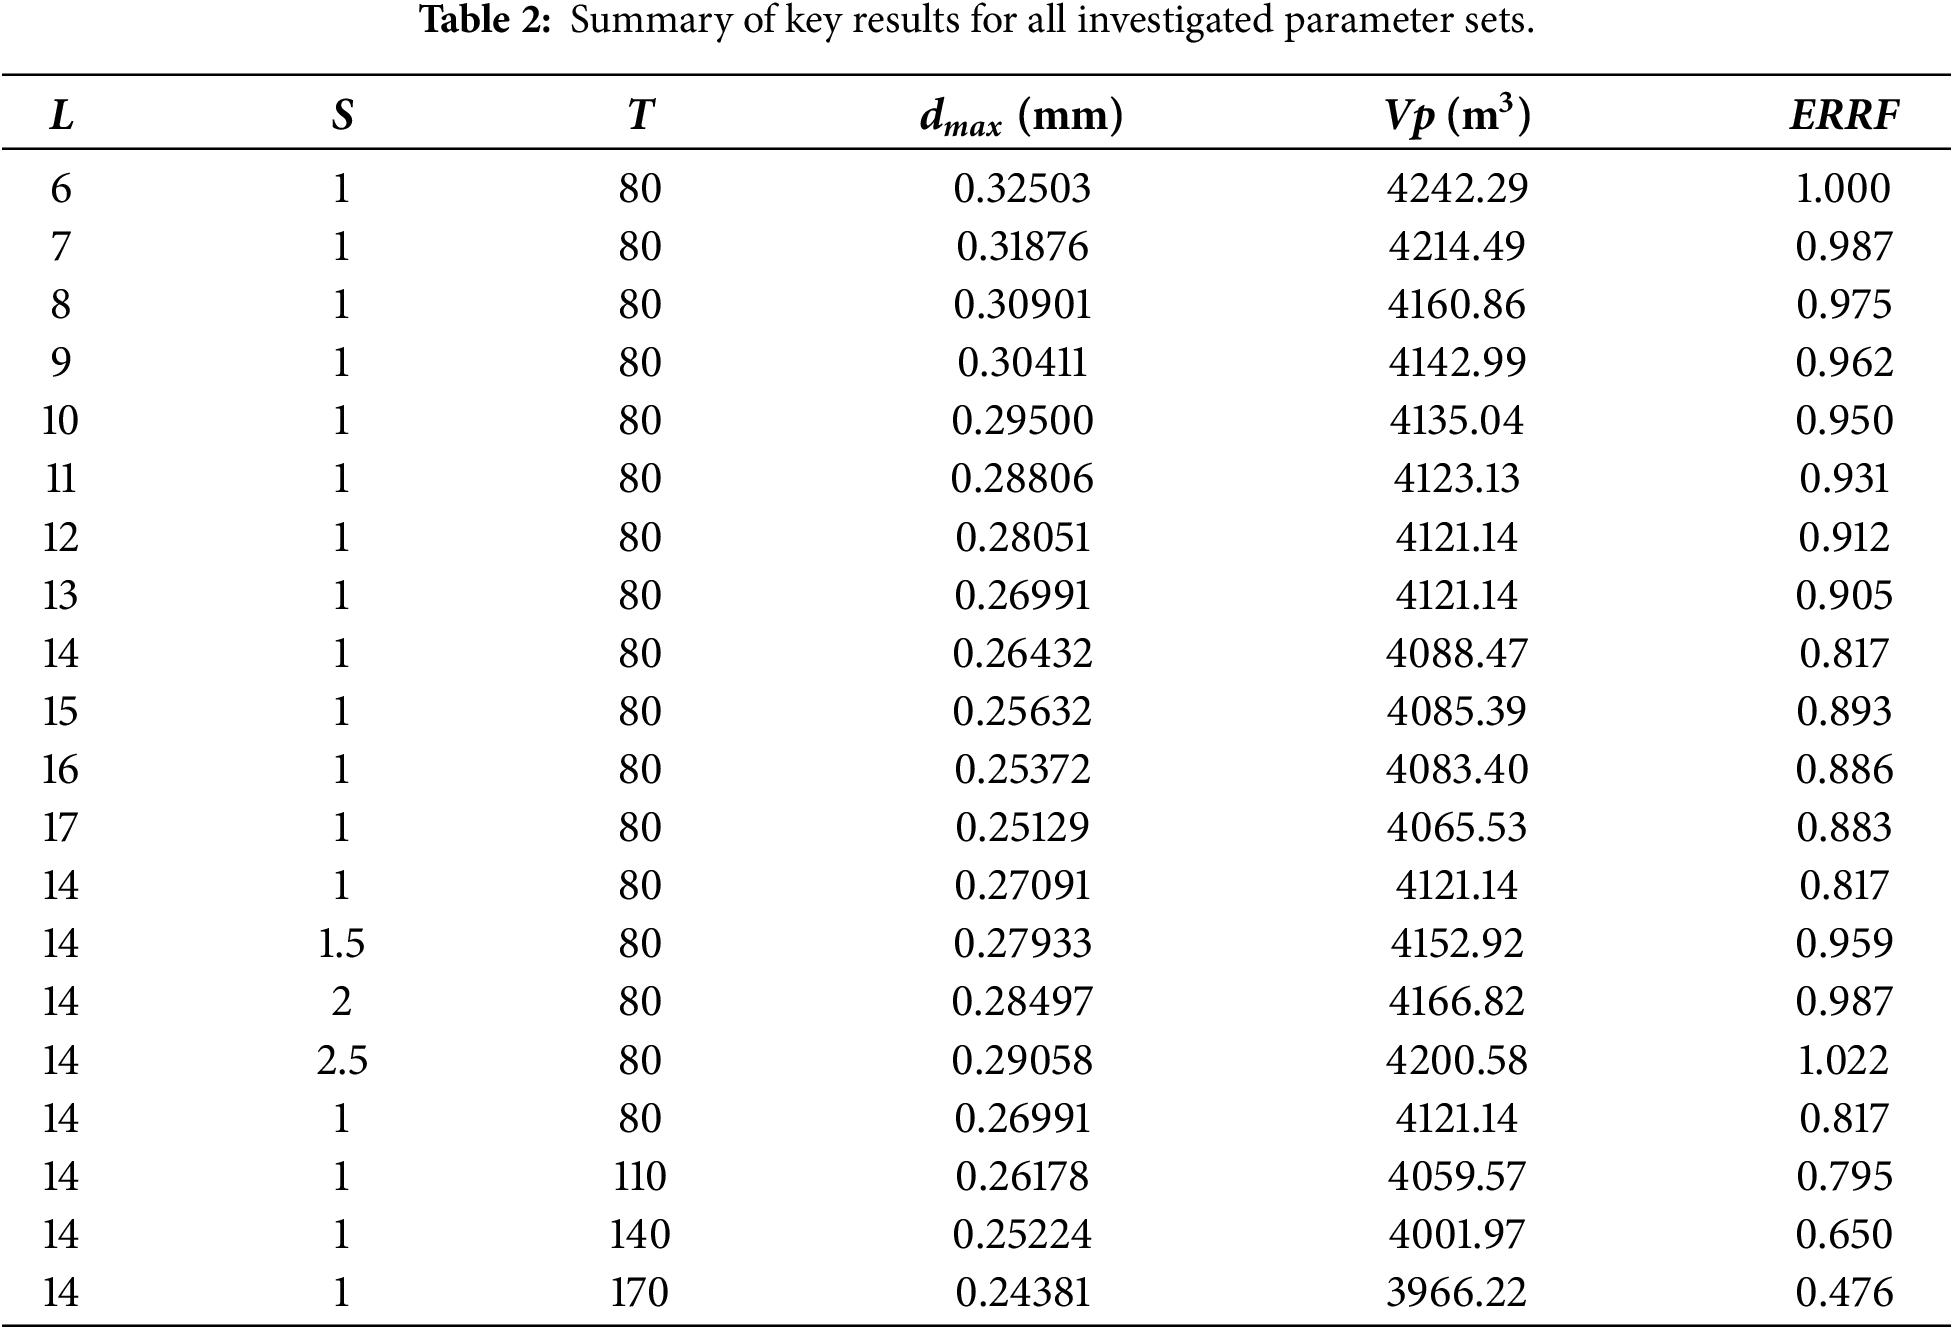
Fig. 7 is plotted with case-wise color scaling so the deformation gradients around the excavation boundary remain clearly visible, particularly near the shoulders and the invert where the contours change rapidly. To provide a consistent numerical basis for comparison across cases, the maximum downward displacement in the Z direction is reported for each case. The peak values are −1.78 mm for S01, −1.55 mm for S02, −2.39 mm for S03, and −2.16 mm for S04, corresponding to reductions of 12.9% for the original section (S02 vs. S01) and 9.6% for the expanded section (S04 vs. S03).
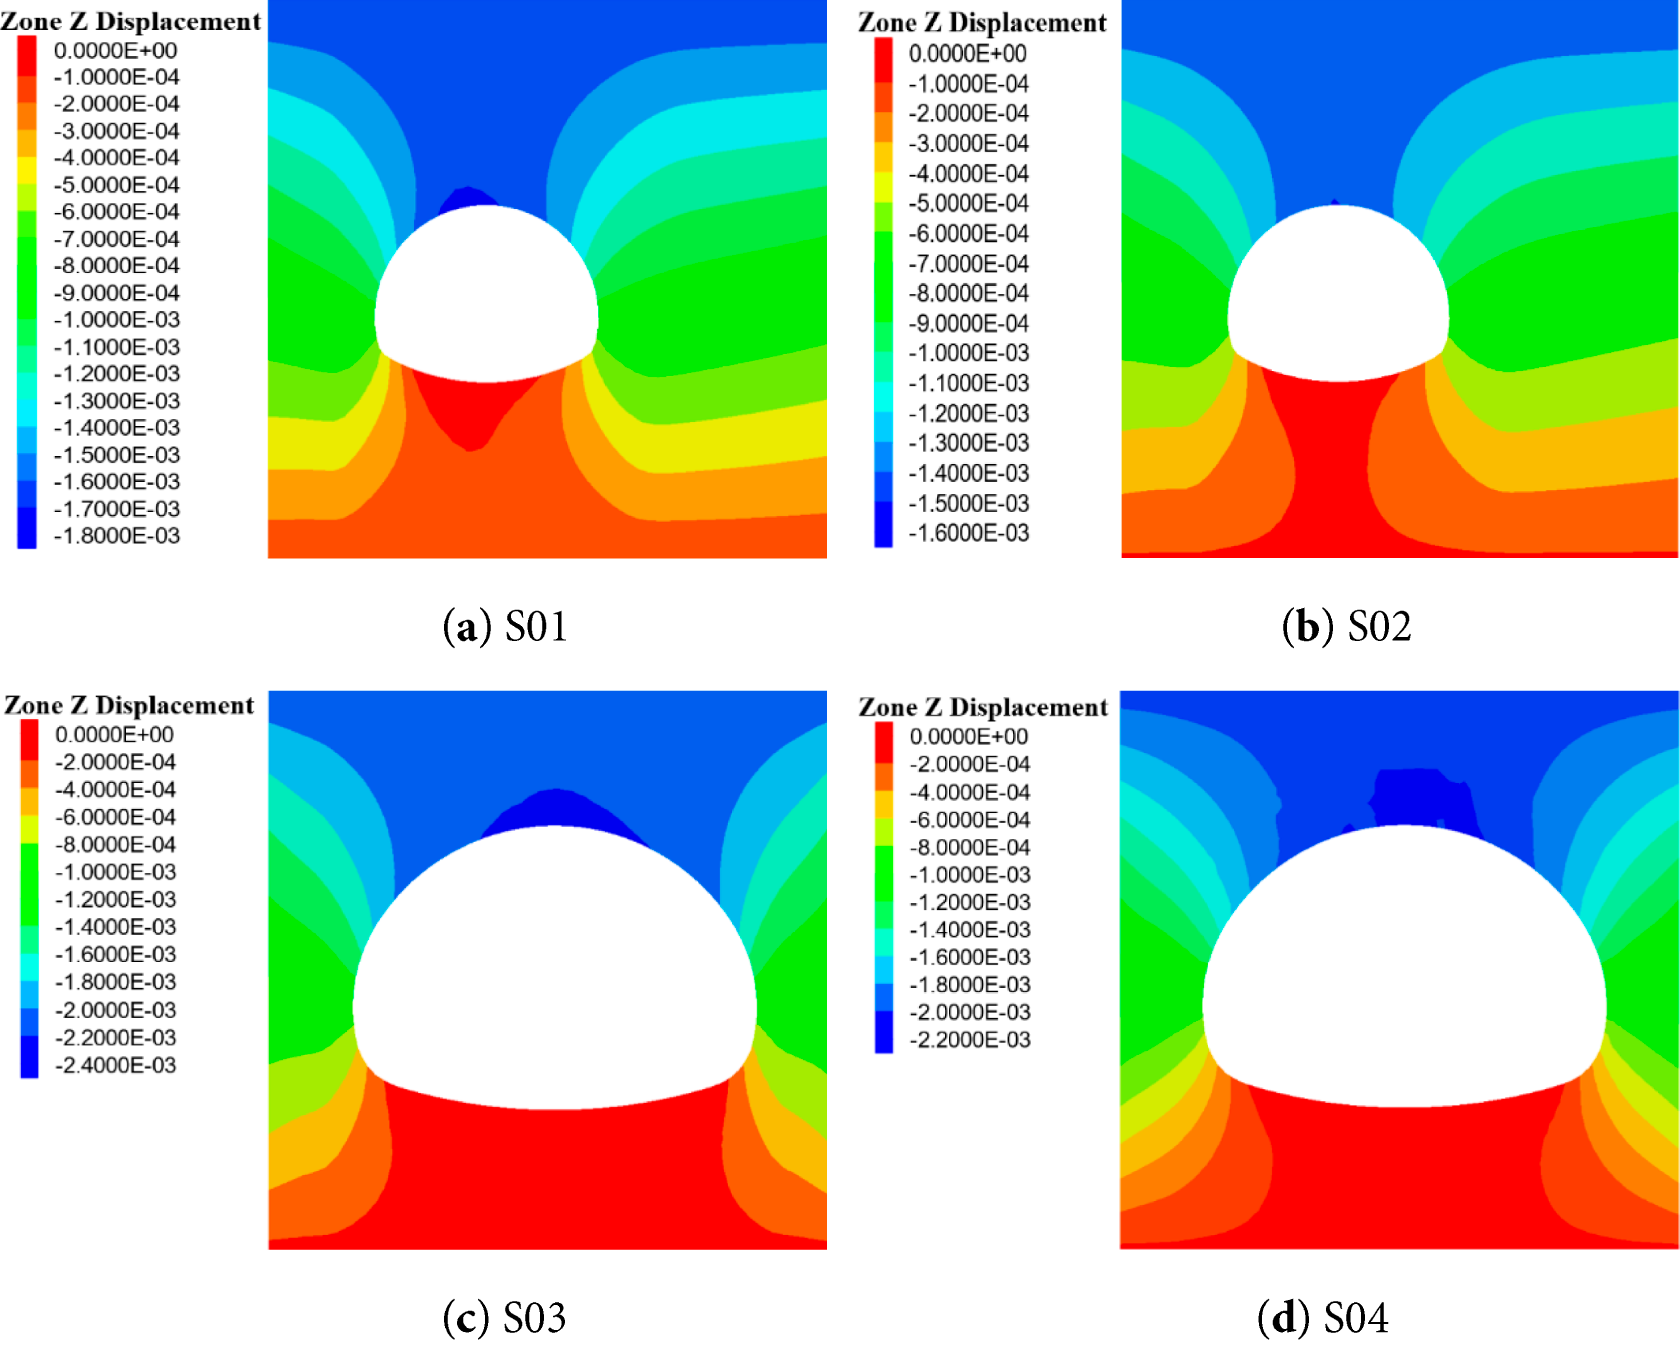
Figure 7: Contour map of displacement in Z direction.
As shown in Fig. 7a, the unanchored case S01 exhibits notable vertical displacement concentrated around the tunnel. The top of the tunnel and bottom experience the largest settlement and heave, forming a bisymmetric displacement pattern around the opening. In contrast, with anchor support (S02), the overall displacement magnitude is reduced. The red and orange zones near the tunnel shrink noticeably, indicating less vertical movement of the surrounding rock. When the tunnel is expanded without support for S03, the displacement contours broaden significantly. A larger region of the surrounding rock mass shows high displacement, reflecting the additional disturbance caused by the expansion excavation. The maximum vertical displacement in S03 is higher than in S01, especially around the newly excavated zone, suggesting the expansion induces extra deformation in the rock. With anchor support in the expanded case for S04, however, the displacement is markedly controlled. Fig. 7d shows that the red and orange areas in S04 are much smaller than in S03, and the displacement field is more localized around the tunnel. The anchors confine the deformation, preventing it from spreading widely into the rock mass. Overall, adding anchors reduces the magnitude of vertical displacement and limits its extent for both the original and expanded tunnels. The greatest deformation occurs in S03, whereas the least is in S02 and S04 with support, verifying the benefit of anchoring in controlling deformation.
Fig. 8 shows the contour maps of maximum shear strain increment for cases S01 to S04. In case S01 without support, high values concentrate around the tunnel boundary. The most affected areas are the shoulders and the bottom of the tunnel. The red and yellow zones indicate large increments, which suggests excavation induces strong local stress redistribution and deformation patterns. In case S02 with anchors, the distribution becomes more uniform. The red zones shrink, and blue and green areas expand around the tunnel. This indicates that anchors absorb and transfer part of the strain energy into the deeper rock mass. The reduced peak values near the boundary indicate that the anchors mitigate the intensity of localized deformation, which is consistent with a lower tendency for stress concentration to develop around the excavation profile. In case S03 with expansion and no support, the increment of maximum shear strain becomes more significant. The high-value red zones cover a wider area, and the influence extends to both the newly excavated and the original rock mass. This shows that expansion aggravates stress redistribution and increases the risk of local failure. In case S04 with anchors after expansion, the effect is clearly improved. The red zones are smaller and limited to the reinforced regions. The stress increment is distributed into more stable areas away from the tunnel wall. Anchors play a key role in preventing severe local accumulation of strain energy.
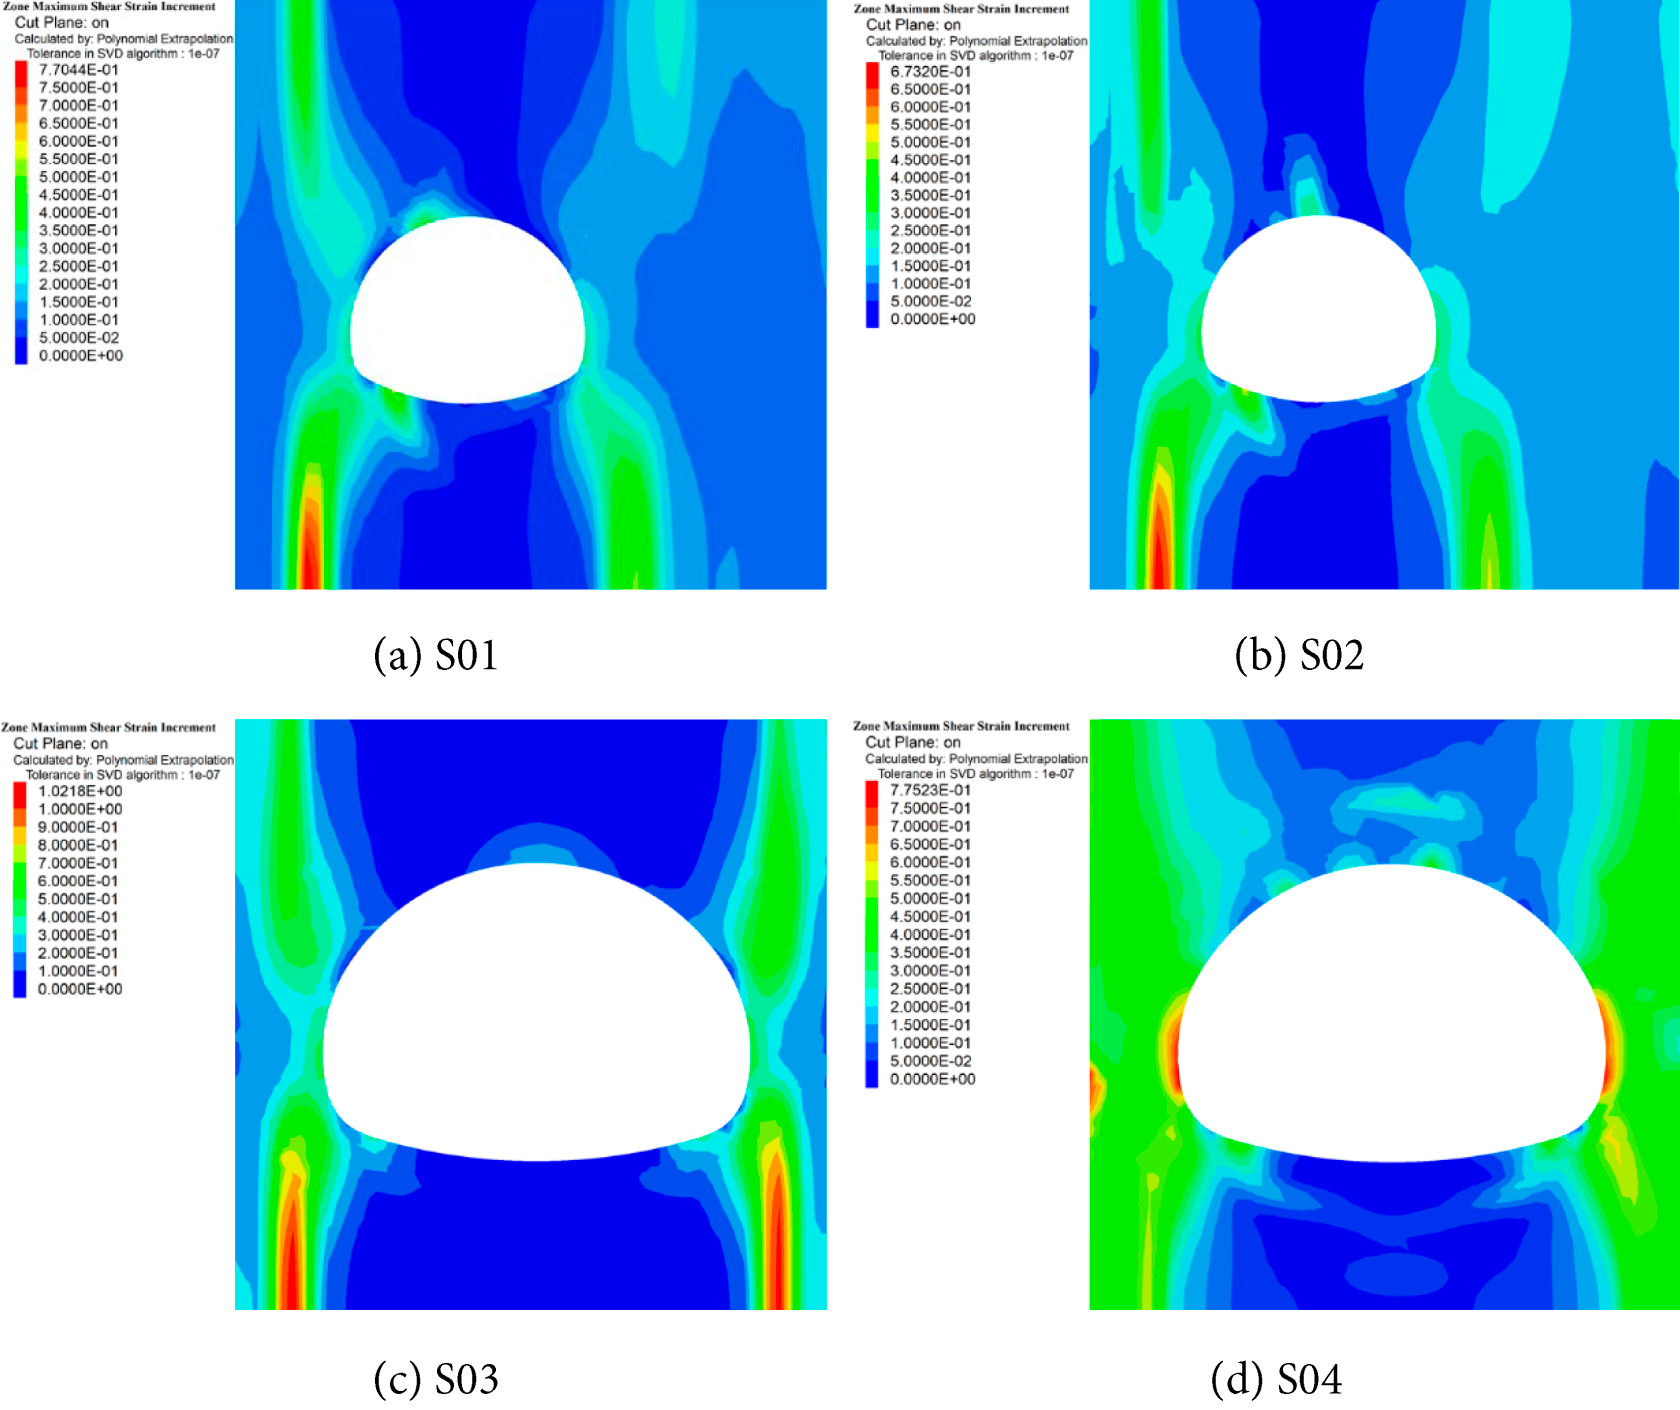
Figure 8: Contour map of maximum shear strain increment in Z direction.
The analysis of maximum shear strain increment indicates that anchor support reduces peak values and leads to smoother redistribution. Both the existing and expanded tunnel models show that anchors transfer strain energy into deeper rock and relieve stress concentration near the boundary. This effect significantly improves the stability of the surrounding rock. In addition to stress redistribution, the numerical results also reveal the failure pattern of the tunnel models. The deformation and failure mode observed in the simulations exhibit an X-shaped pattern. The primary failure zones are located at the tunnel shoulders and the arch feet. These regions experience the most intense accumulation of shear strain and plastic deformation. The simulated failure morphology is in good agreement with the failure pattern observed in the physical model tests, which further validates the numerical approach.
It is worth noting that the surrounding rock in the numerical model is described using a Mohr–Coulomb formulation. Under this assumption, shear localization can appear relatively sharp, and the banding pattern may look more symmetric when the excavation geometry and boundary conditions are symmetric. If post-peak degradation were represented through a strain-softening law, the localization process would likely develop in a more progressive manner, and the yielded region could become wider or more diffuse, although the main localization zones would still concentrate in mechanically sensitive regions such as the shoulders and arch feet. A Hoek–Brown type description, which accounts for nonlinear strength dependence on confinement, could further modify the extent of yielding during enlargement where confinement evolves rapidly. These constitutive choices mainly affect the detailed appearance and extent of the localized bands, whereas the comparative conclusion drawn from the same modelling framework remains stable, namely that prestressed anchoring reduces the severity and spread of localization relative to the corresponding unsupported cases.
It is also important to consider that the numerical results are obtained with a Mohr–Coulomb constitutive description, which can promote relatively sharp shear localization and may not fully reproduce progressive damage accumulation during excavation-induced unloading. This modelling choice can influence the apparent intensity and, in some cases, the symmetry of the predicted high-strain zones. Even with this limitation, the concentration of response at the shoulders and invert remains mechanically reasonable because these locations commonly experience pronounced stress redistribution and geometric discontinuities during enlargement. In this study, the identified critical regions are not inferred from the numerical contours alone. They are supported by the observed deformation and failure features in the physical model tests, which show damage initiating and propagating preferentially around the shoulder and invert areas, providing confidence that the mapped zones reflect dominant structural behavior rather than a purely numerical artifact.
The progressive growth of the plastic zone in the surrounding rock is plotted in Fig. 9 for each case. Initially, for all cases, Vp increases as the loading begins, reflecting the formation of a plastic region around the opening. In the unexpanded tunnel without support S01, the plastic zone volume rises rapidly at first, then starts to level off as it approaches a convergence after the initial expansion stage. The final plastic zone volume in S01 reaches on the order of 4.34 × 105 mm3. In case S02, the growth of the plastic zone is notably restrained. The curve of S02 lies below S01 throughout. During the expansion stage, the plastic volume increases more slowly, and it reaches a plateau at a significantly lower value. This indicates that the anchor support in S02 limits the extent of yielding in the rock, with fewer elements of the surrounding rock reaching the plastic state compared to S01.
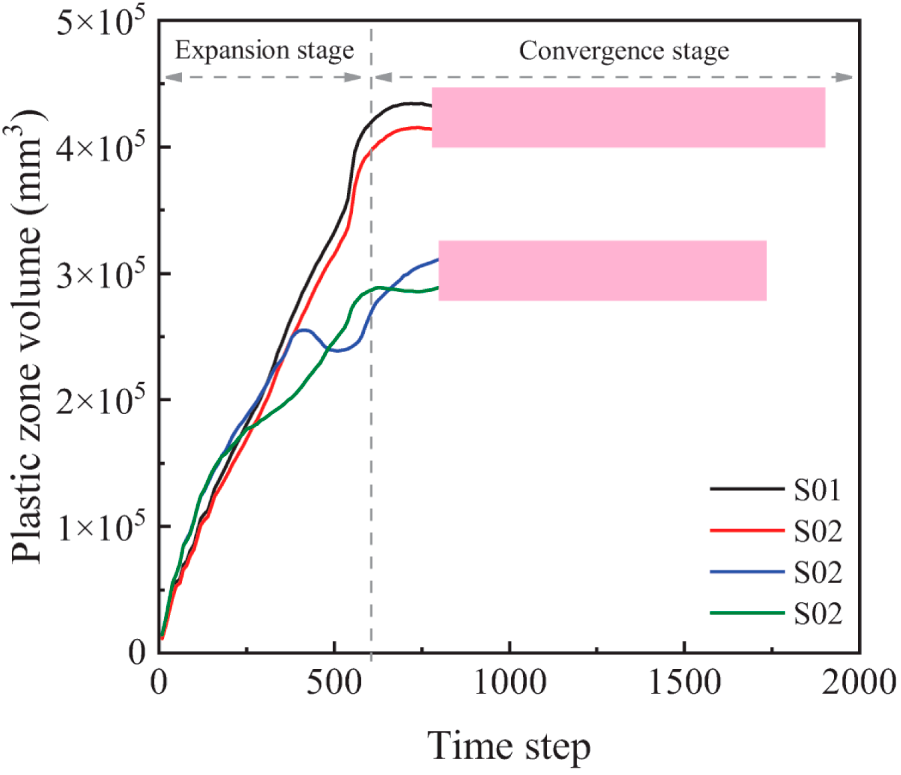
Figure 9: Evolution of plastic zone volume Vp with computational step for cases S01–S04.
Before the expansion, the S03 and S04 curves follow a trend similar to S01 and S02, respectively. Once the loading is initiated, the plastic zone volume in the unsupported expanded case S03 surges dramatically. The blue curve shows a sharp increase in Vp during the expansion stage, far exceeding the S01 curve. This pinnacle represents the additional yielding caused by the expansion of the tunnel. In S03, Vp climbs to around 3.17 × 104 mm3 after expansion, roughly an order of magnitude higher than before, and then slowly approaches convergence in the latter stage.
Meanwhile, the anchored expanded case S04 exhibits a much more moderate increase. The curve of S04 does rise during the expansion stage, reflecting some new plasticity as the tunnel is enlarged, but the increment is significantly smaller than in S03. The final Vp for S04 remains much lower. In fact, the plastic zone volume of S04 after full convergence is even slightly below that of S01. Despite the disturbance of an expansion, the anchors in S04 manage to keep the plastic zone volume below the level of an unsupported single tunnel.
This highlights that anchor support not only slows the growth rate of the plastic zone during excavation but also significantly reduces the ultimate extent of plastic failure in the surrounding rock. The most severe plastic development occurs in the expanded-unanchored case, whereas the anchored cases achieve much smaller plastic zones, demonstrating improved rock mass stability and higher containment of damage due to the support system.
4.3 Comparison between Mechanical Test and Numerical Simulation
4.3.1 Comparison of Failure Modes
Fig. 10 presents the comparison of failure modes derived from model tests, DIC displacement fields, and numerical plastic zone distributions. For the unanchored original tunnel S01, the physical model shows extensive cracking around the tunnel, especially diverging upward from the crown and downward from the bottom. These cracks outline a typical failure mechanism where tunnel shoulders and the arch feet have yielded, and rock blocks are detaching. The DIC displacement field reveals large downward deformation at the crown and upward displacement at the bottom. The plastic zone envelops almost the entire tunnel contour. The overall pattern presents a clear X-shaped failure, with intersecting deformation paths similar to the crack propagation pattern. In case S02, where anchors were applied without tunnel expansion, the failure range is significantly reduced. Cracks are limited to the crown and arch feet. The displacement field demonstrates much smaller vertical movements compared to S01. The plastic zone contracts into a narrow band close to the excavation surface, with limited depth penetration. The failure still follows an X-shaped distribution but with substantially lower intensity.
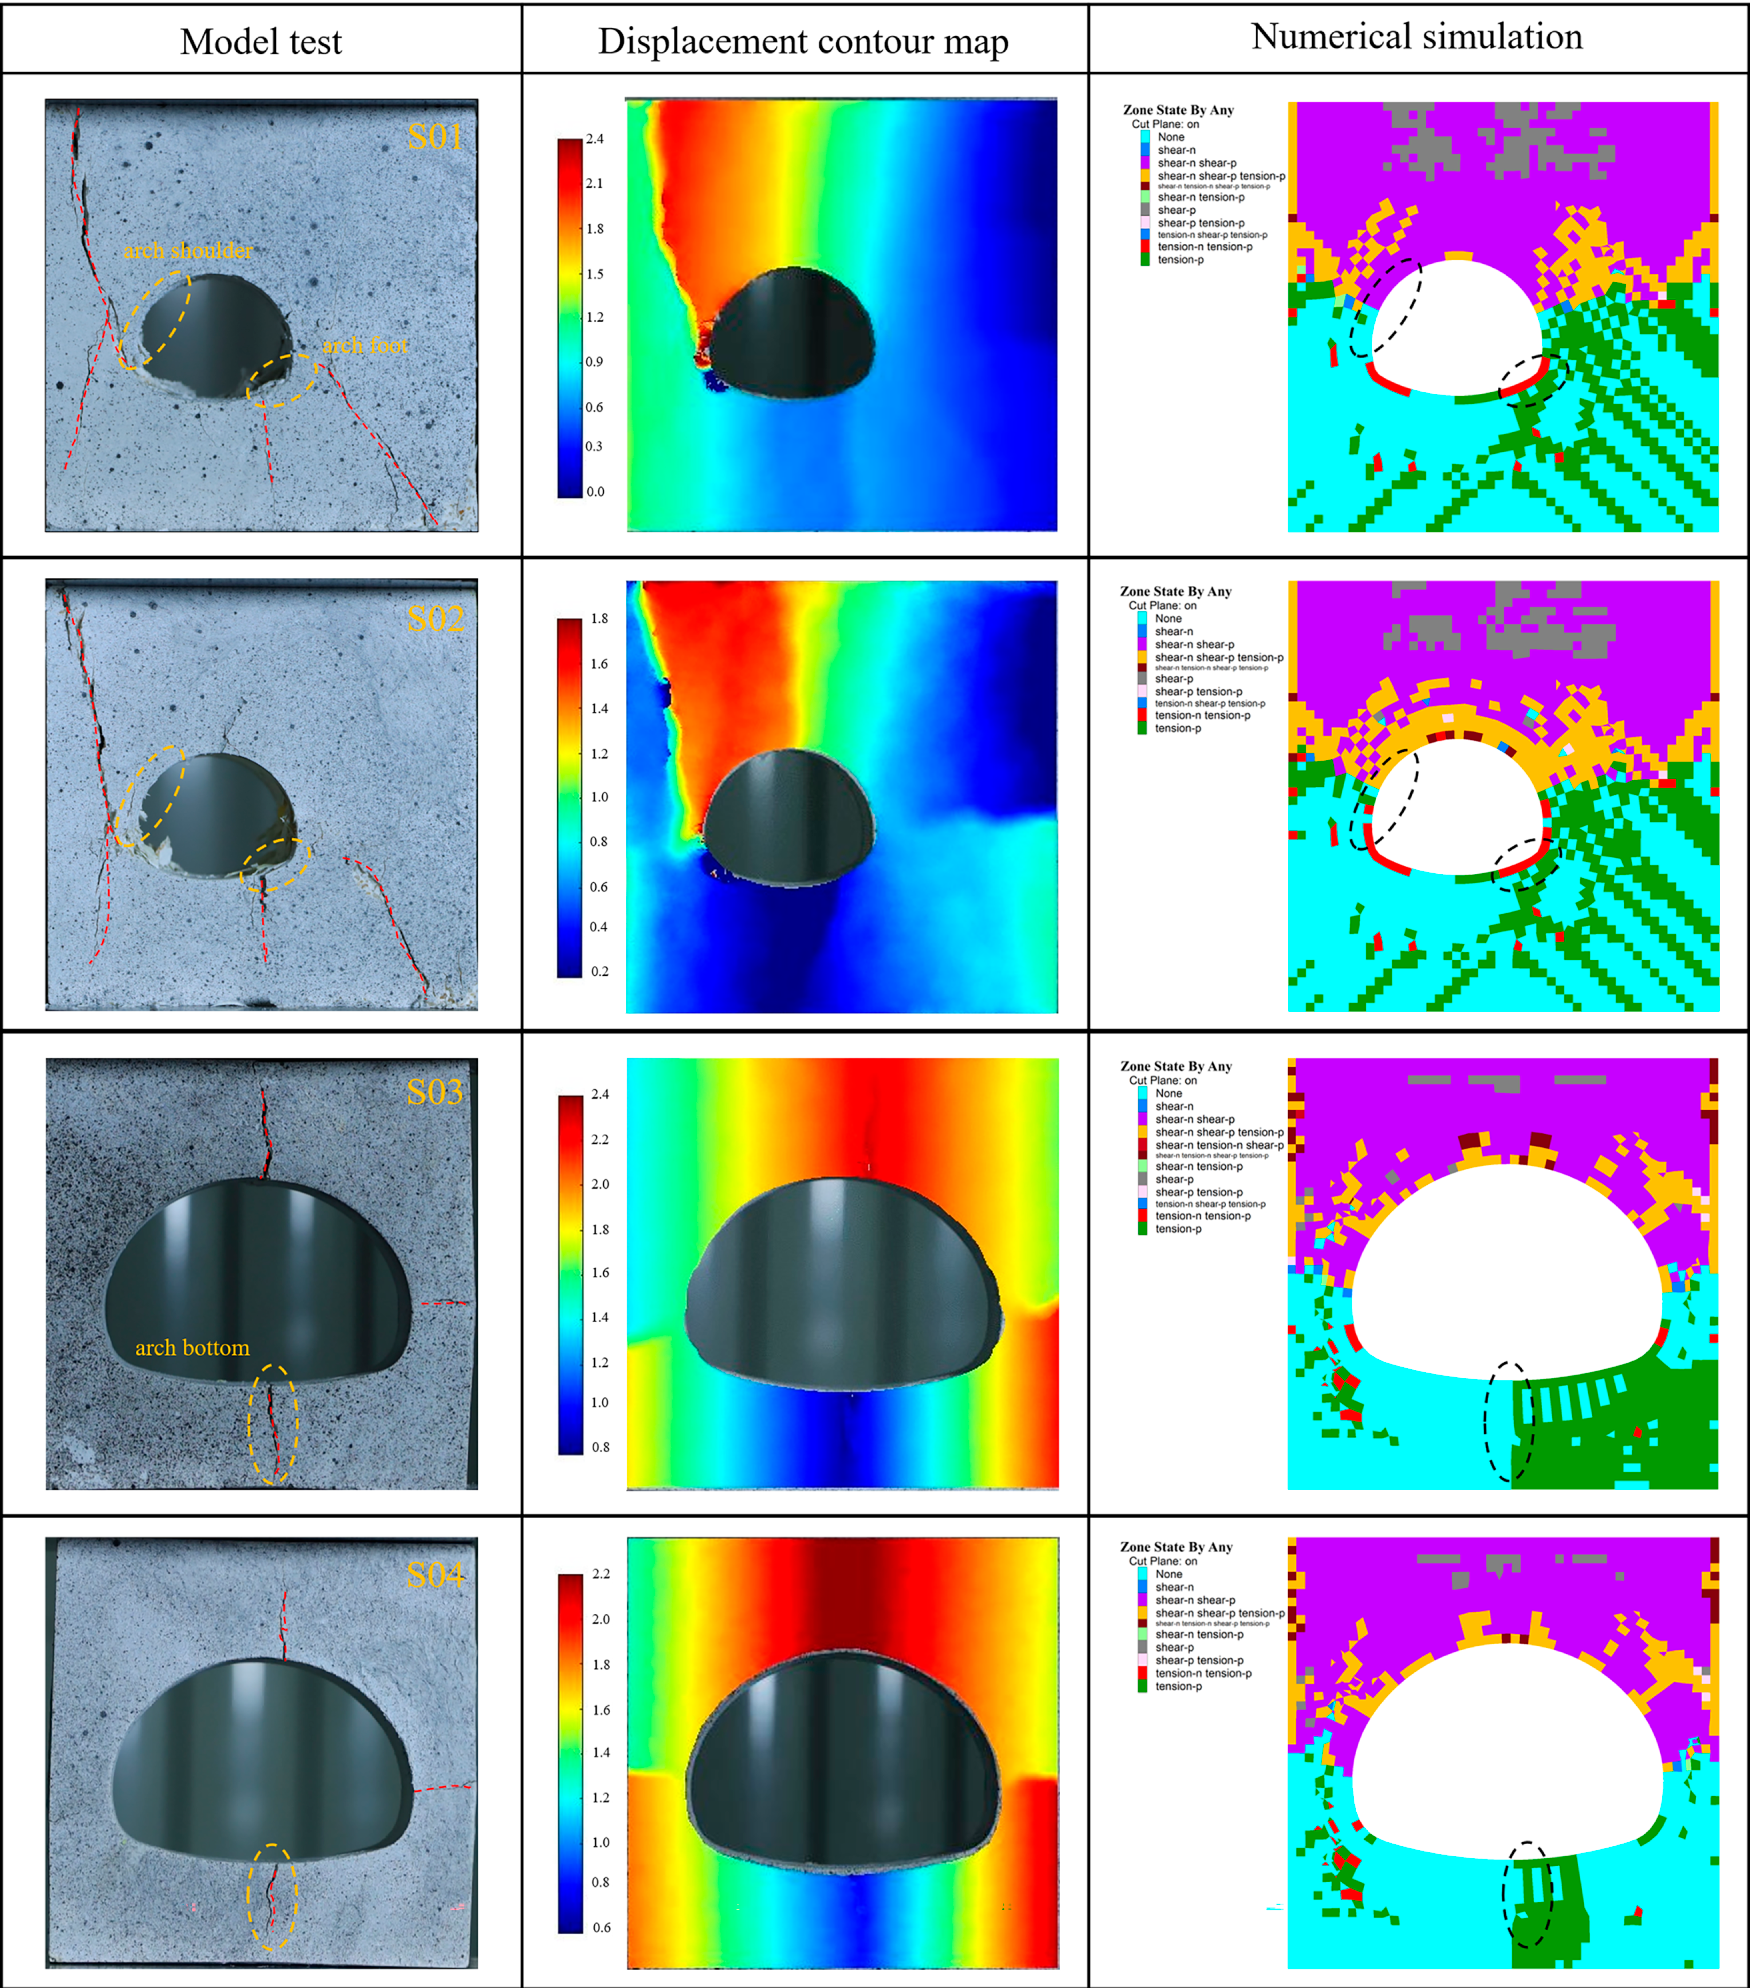
Figure 10: Mechanical experimental results and deformation mode of enlarged tunnel model samples.
As for case S03, with tunnel expansion but no anchor support, the extent of damage increases sharply. The specimen exhibits numerous intersecting cracks across the arch top and bottom. The DIC displacement field shows significant deformation concentrated at the enlarged section, while the plastic zone extends deeply into the surrounding rock. The instability here is more severe than in S01 due to the expansion. For case S04, where tunnel expansion is combined with anchor support, the overall stability is markedly improved. Only a few fine cracks are observed on the specimen surface. The displacement field demonstrates localized deformation, much weaker than in S03. The plastic zone shrinks considerably, concentrating around the excavation contour with no large-scale extension.
4.3.2 Comparison of Monitoring-Point Deformation
Besides the failure modes, Fig. 11 shows monitoring points that were employed around the profile of the tunnel model in eight typical positions. The data gained from numerical simulation and mechanical tests were compared as shown in Fig. 12. The radar charts provide a quantitative comparison of the measured and simulated deformations at monitoring points around the tunnel. To further quantify the agreement in Fig. 12, a root mean square error (RMSE) index was calculated using the displacements at the eight monitoring points shown in Fig. 11. The RMSE values are 0.244 mm for S01, 0.144 mm for S02, 0.617 mm for S03, and 0.525 mm for S04, which provides a compact quantitative measure of the experiment–simulation mismatch at the monitoring locations. In case S01, the maximum deformation occurs at points A and E, with test values of 1.62 and 1.78 mm and simulation values of 1.47 and 1.54 mm. The agreement is strong, and the deformation pattern is nearly symmetric. In case S02, anchor support reduces overall deformation. At point A, the measured value decreases to 1.28 mm, while the simulation gives 1.37 mm. At point E, the values are 1.47 and 1.44 mm. The reduction compared to S01 is evident, and both test and simulation show consistent results, with the anchors effectively limiting vertical settlement and uplift. In case S03, corresponding to the enlarged tunnel without support, the deformation pattern becomes asymmetric. The maximum occurs at point A with 2.25 mm in the test and 1.92 mm in the simulation. At point G, the test value reaches 1.87 mm, while the simulation is 1.63 mm. The asymmetry reflects the influence of expansion, with the side closer to the excavation showing larger displacement. The numerical model reproduces this trend, although it slightly underestimates peak values. In case S04, the installation of anchors restores a more uniform distribution. At point A, the measured deformation decreases to 1.59 mm, and the simulation yields 1.44 mm. At point G, the values fall to 1.35 and 1.16 mm. The overall reduction compared to S03 confirms the efficiency of anchors in controlling expansion-induced deformation.
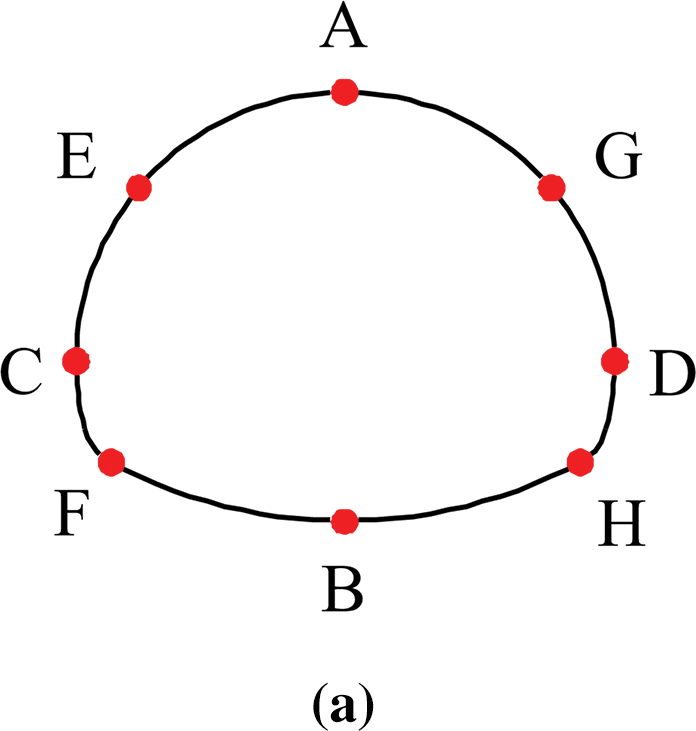
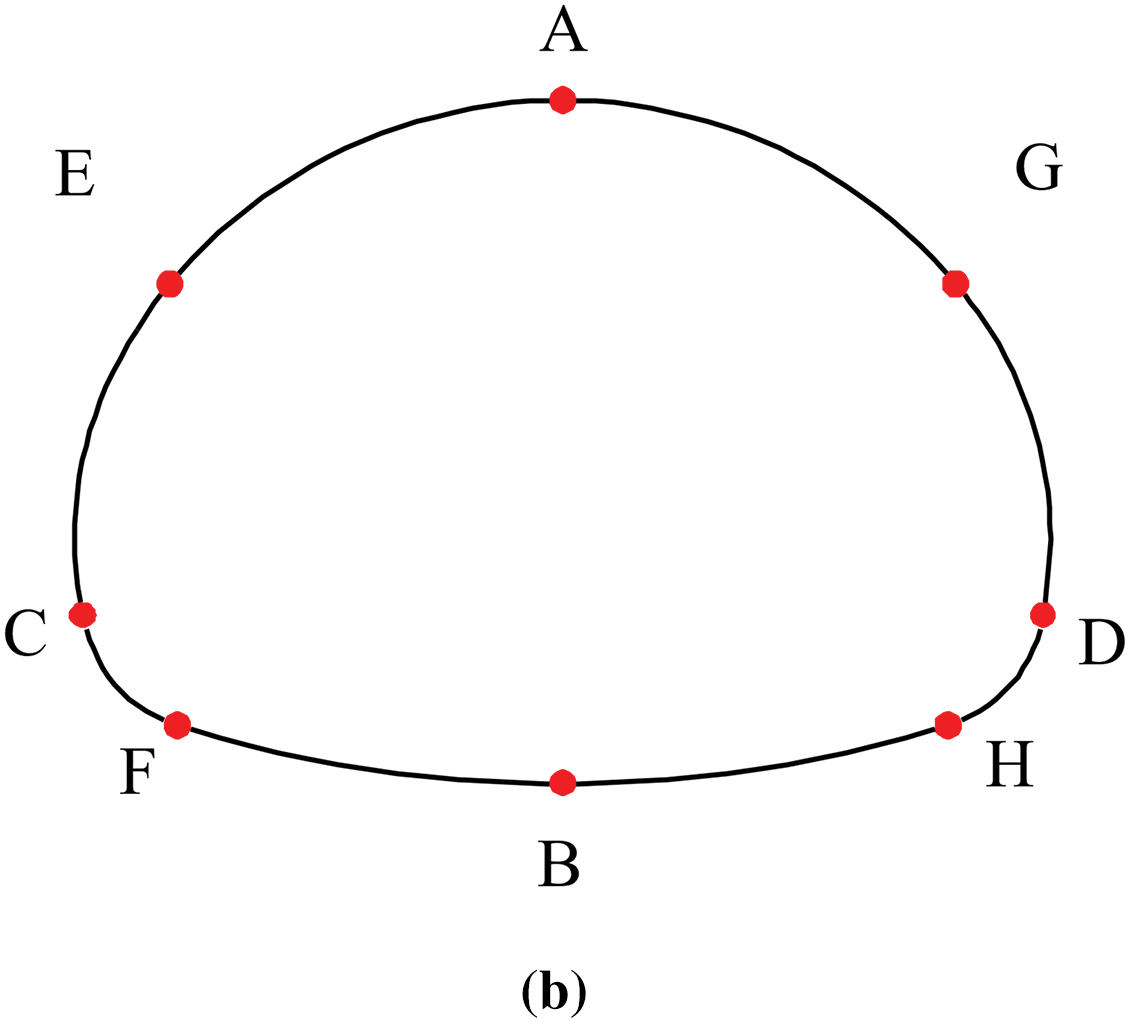
Figure 11: Monitoring points position of model tests. (a) Monitoring points of existing tunnel; (b) Monitoring points of expansion tunnel.
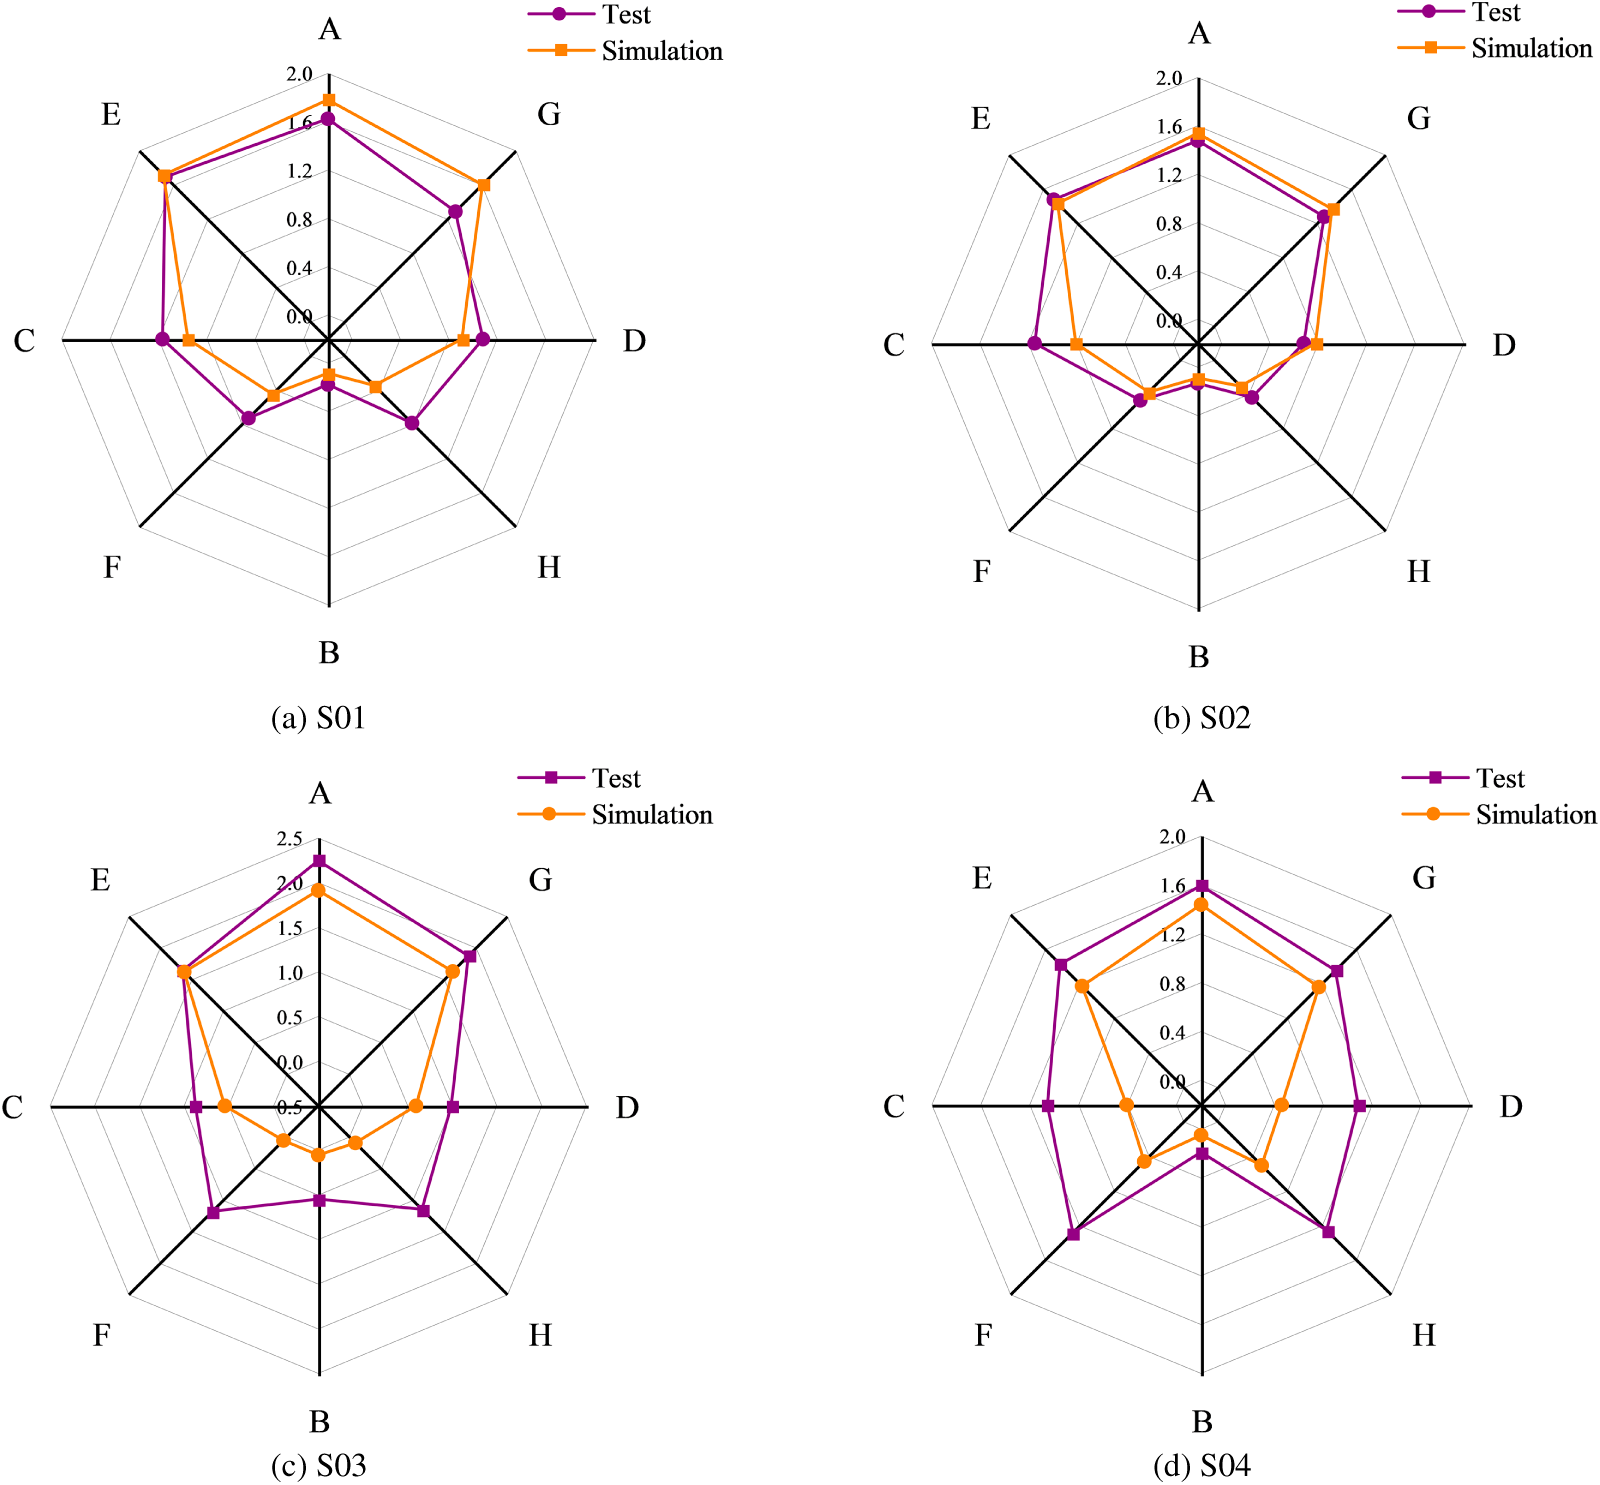
Figure 12: Comparison of specimen maximum deformation of monitoring points.
The agreement between test and simulation is close, with only minor discrepancies. The four cases demonstrate a clear pattern. Without anchors, deformation is large and asymmetric after expansion. With anchors, deformation is significantly reduced and distributed more uniformly. The numerical model captures both the reduction in magnitude and the change in distribution, validating its predictive reliability.
The numerical simulation results, supported by model tests, demonstrate that anchor reinforcement significantly enhances tunnel stability. Without support, both existing and enlarged tunnels experience large deformations, extensive plastic development, and reduced load capacity, with expansion being particularly vulnerable. Introducing anchor cables reduces deformation, confines the plastic zone, and increases ultimate resistance. The deformation at the crown and walls is effectively controlled, and the failure mode changes to a more ductile and localized pattern. The consistency between simulation and experimental results confirms the reliability of the numerical model and provides a reference for the subsequent in-situ model design.
In the model-scale study, both the laboratory specimens and the corresponding FLAC3D tunnel-model simulations were prepared with a preformed tunnel profile, and the response was obtained under controlled uniaxial loading. Under this setup, the excavation process is not simulated as a staged removal of material. Its mechanical influence is reflected through the presence of the cavity itself and, for the enlargement scenario, through the geometric change from the original to the expanded cross-section, together with the change in reinforcement configuration. The staged excavation effect, including excavation-induced unloading and the construction sequence, is investigated in the subsequent in-situ model, where excavation steps and support activation are implemented to reproduce the field expansion process.
5 Numerical Simulation Analysis of the In-Situ Model
5.1 Deformation Analysis of Tunnel Expansion and Influence of Supporting Parameters
The three-dimensional numerical model was established in FLAC3D to investigate the mechanical response of the tunnel expansion process. The computational domain measured 220 m in length, 40 m in width, and 120 m in height, ensuring sufficient boundary distance to minimize boundary effects. The mesh was locally refined around the tunnel excavation to capture stress and strain concentration. The existing tunnel cavity was explicitly included, and staged excavation was simulated according to the actual construction sequence (Fig. 13a).
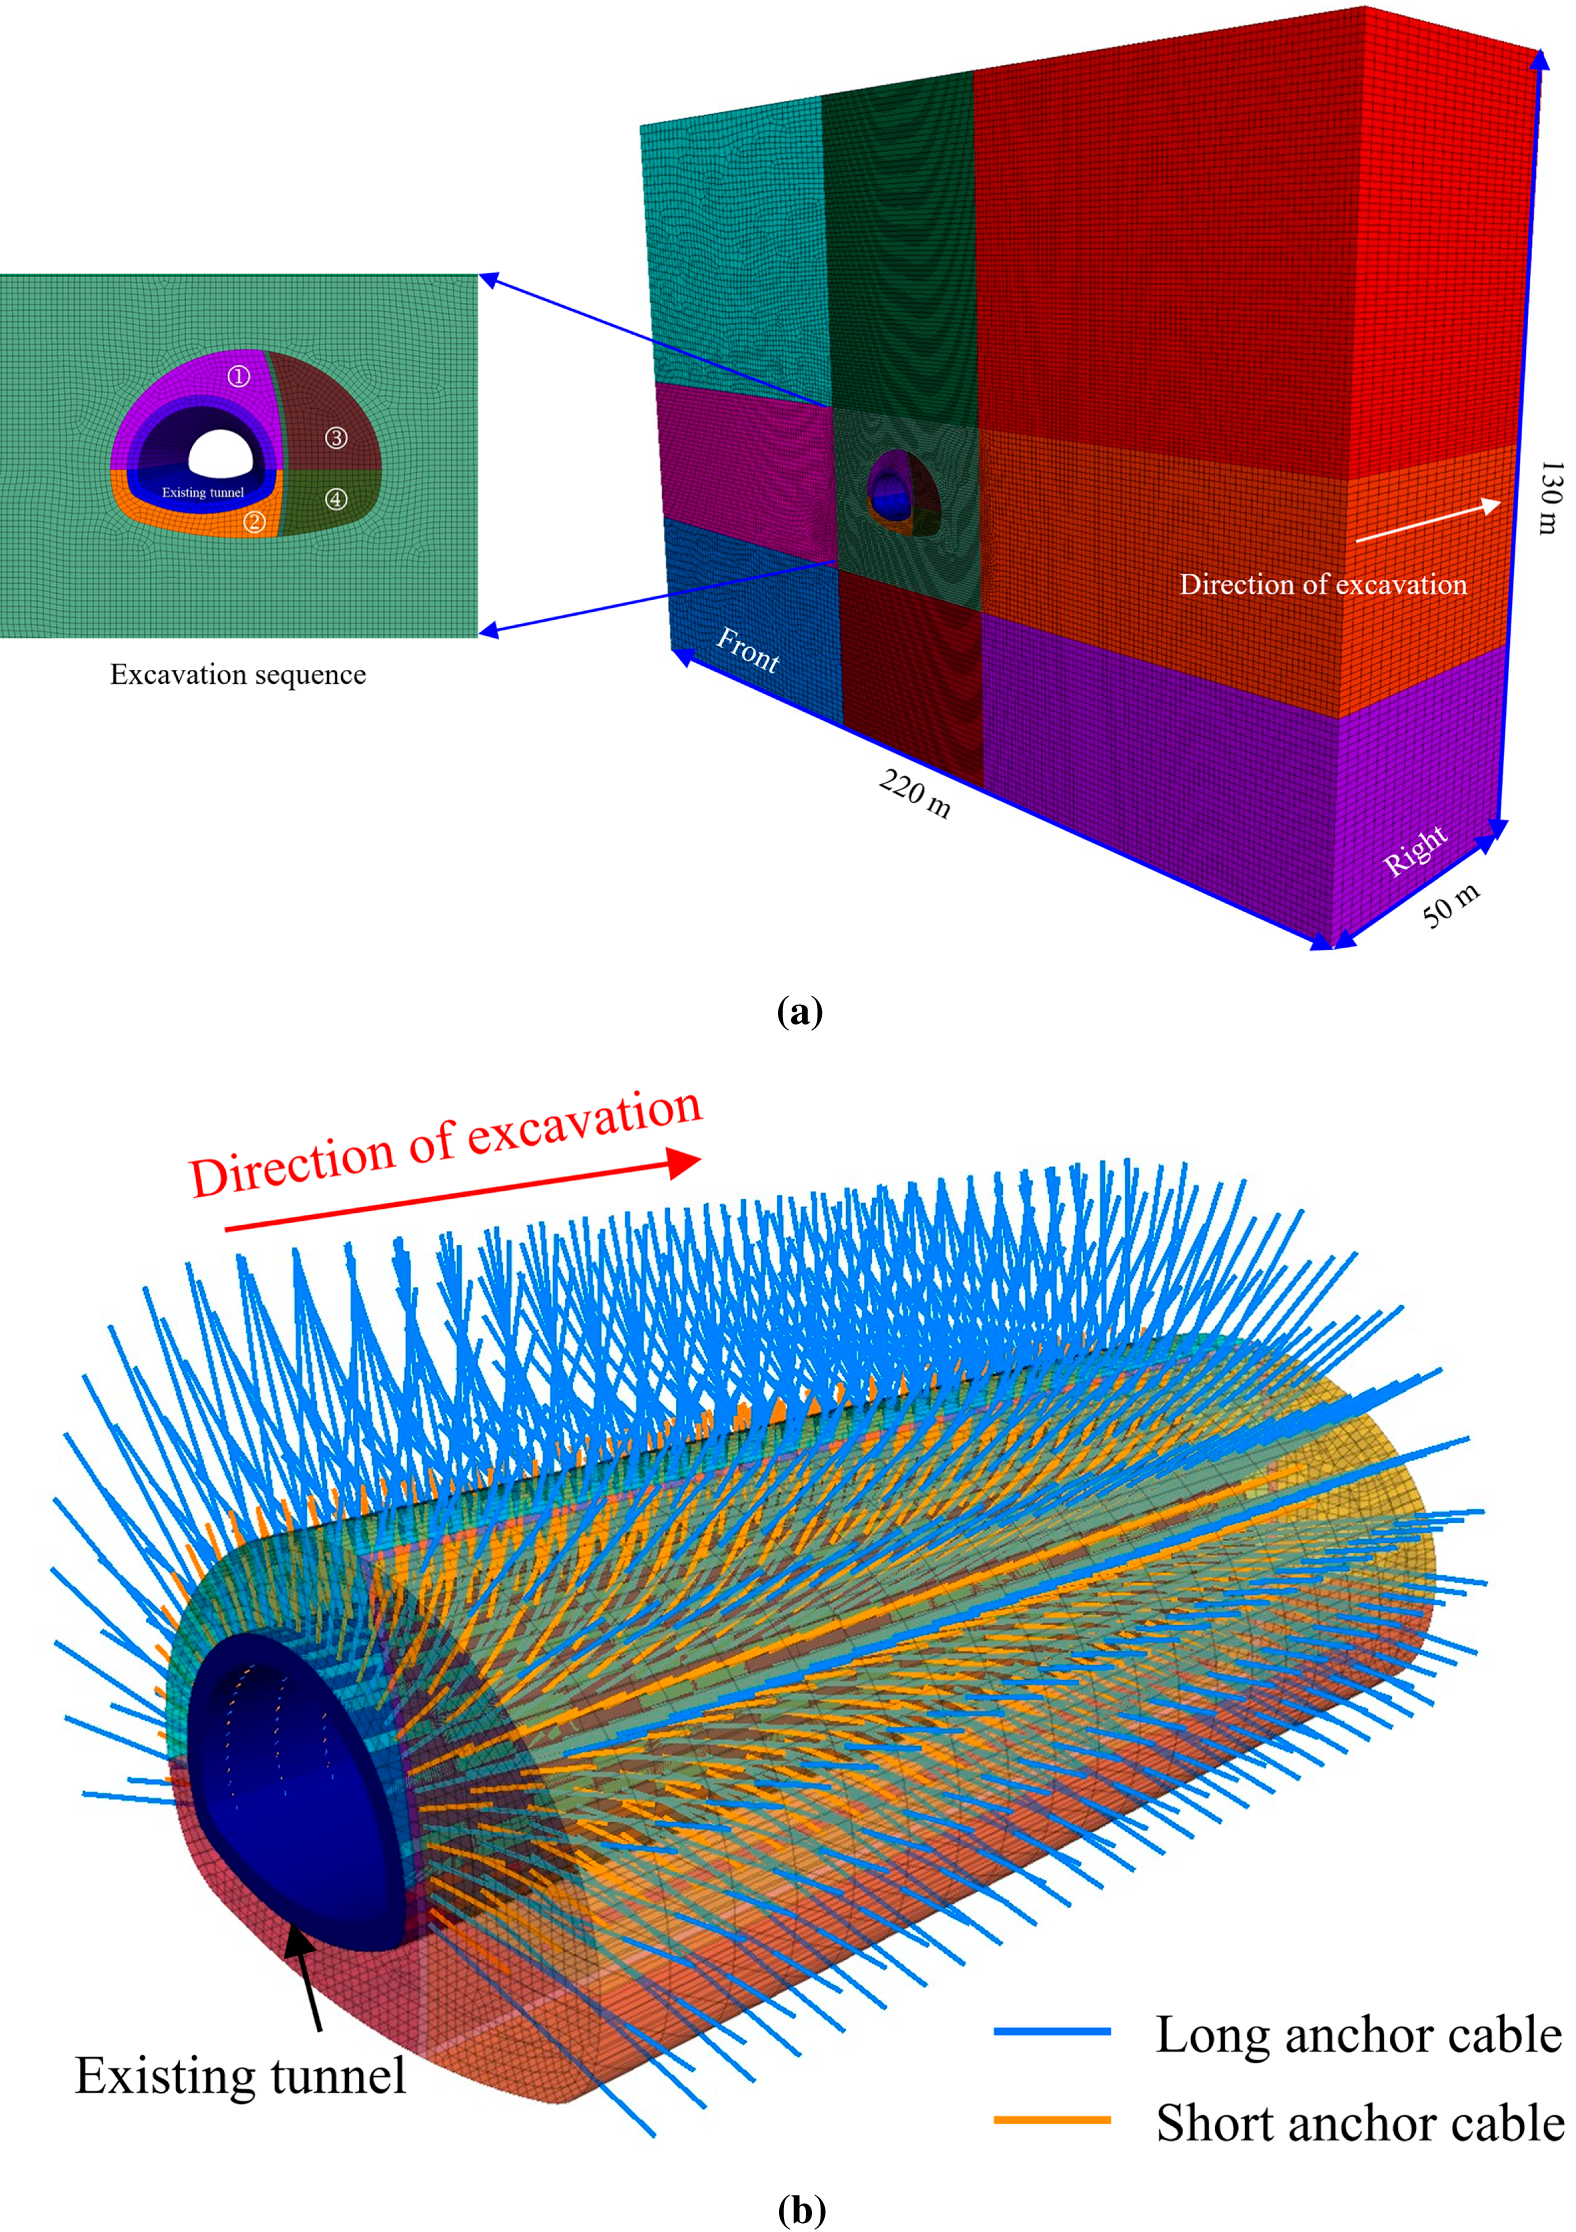
Figure 13: Three-dimensional expansion model and anchor cable support system. (a) Meshing and geometry of the model; (b) Supporting system of long and short anchor cable.
The support system consisted of long and short anchor cables arranged alternately around the lining of the existing tunnel (Fig. 13b). The short anchor cables reinforced the near-field rock mass, while the long anchor cables penetrated deeper into the surrounding rock to control deformation in the plastic zone. In this study, three key parameters of the long anchor cables were investigated: (i) length, ranging from 6 to 17 m; (ii) spacing, varying between 1.0 and 2.5 m; and (iii) prestress, set to 80, 110, 140, and 170 kN. These parameters were systematically varied to evaluate the influence on tunnel stability.
Anchor cables were simulated using FLAC3D structural cable elements, which carry axial force only and were treated as linear elastic within the investigated load range through the assigned axial stiffness. Load transfer between the cable and the surrounding rock was represented by the built-in grout coupling of the cable element, where the interaction is idealized by distributed springs along the bonded length that transmit shear resistance from the cable to the rock mass. In the present simulations, the grout coupling was used to represent anchored load transfer, and no progressive debonding or pull-out failure was modelled as the governing mechanism. Prestress was applied as an initial tensile force at the installation stage of each excavation step, after which the cable axial force evolved with excavation and deformation as part of the staged calculation. Time-dependent prestress loss related to seating, relaxation, or grout creep was not introduced, while excavation-induced stress redistribution and the resulting changes in cable force were captured directly by the numerical process.
Fig. 14 indicates that the surrounding rock shows larger crown settlement and stronger deformation at the shoulders in the unsupported case, with concentrated strain increments indicating local instability. With anchor cable support, displacement is significantly reduced, crown subsidence is restrained, and the distribution of strain increments becomes more uniform. The reinforcement effectively weakens stress concentration at the shoulders and toes, leading to improved overall stability of the tunnel.
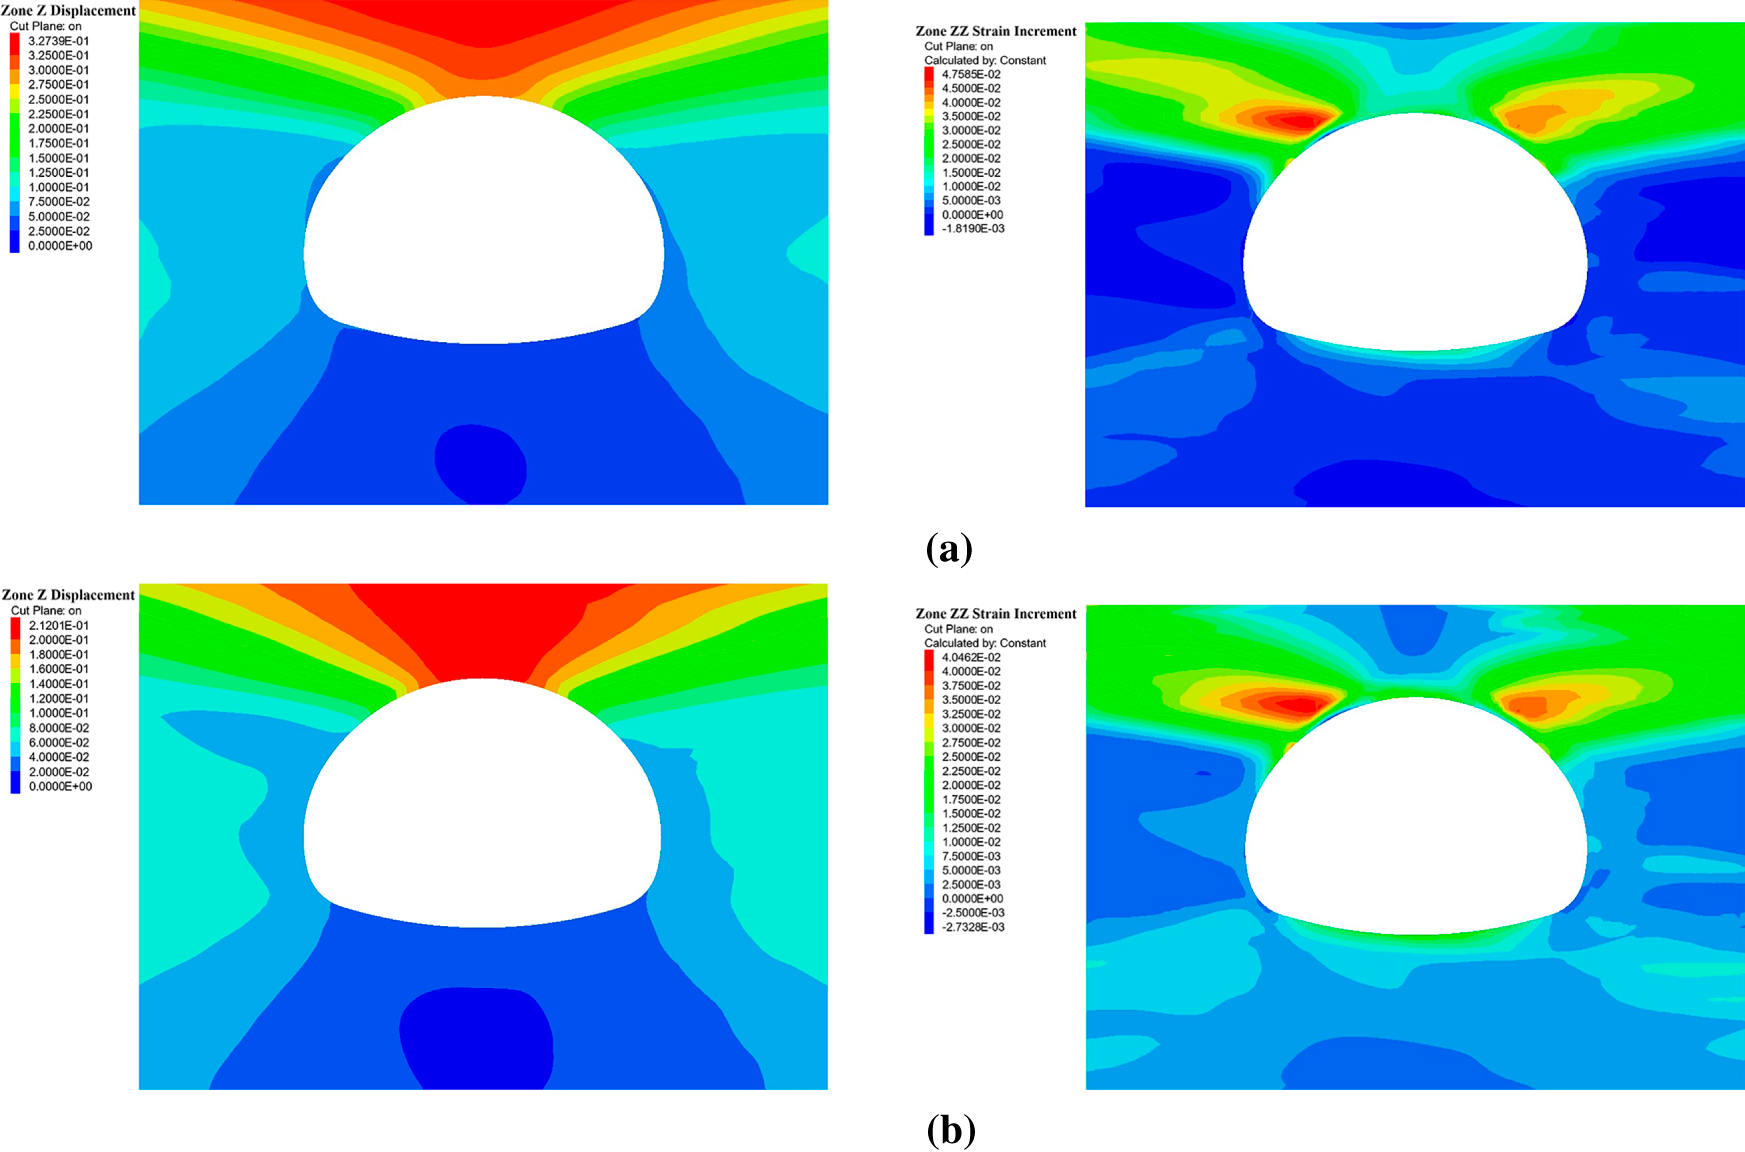
Figure 14: Comparative analysis of displacement and normal strain increment in the Z direction. (a) Surrounding rock deformation and strain increment without anchor cable support; (b) Surrounding rock deformation and strain increment with anchor cable support.
The results in Fig. 15 demonstrate a clear decreasing trend in both deformation and plastic zone volume with increasing anchor cable length. When the length increased from 6 to 17 m, the maximum wall deformation decreased from 0.325 to 0.251 m, representing a 23% reduction. Meanwhile, the plastic zone volume shrank from 4242 to 4066 m3, a decrease of approximately 4%. The rate of improvement is different before and after 14 m. For lengths shorter than 14 m, deformation reduction is significant. Increasing the length from 6 to 14 m reduced wall deformation from 0.325 to 0.264 m, about 19%. The plastic zone volume decreased from 4242 to 4088 m3, about 3.6%. When the length increased beyond 14 m, the improvement became small. Extending the length from 14 to 17 m reduced deformation by only 0.013 m, about 5%. The plastic zone volume decreased by only 22 m3, about 0.5%. These results indicate that 14 m is a critical length. At this length, the reinforcement effect is fully mobilized. Beyond 14 m, the cable extends into the stable zone of the surrounding rock, where excavation-induced stress has little influence. Further increase in length brings limited benefit but adds cost. The optimal design length for long anchor cables is therefore about 14 m.
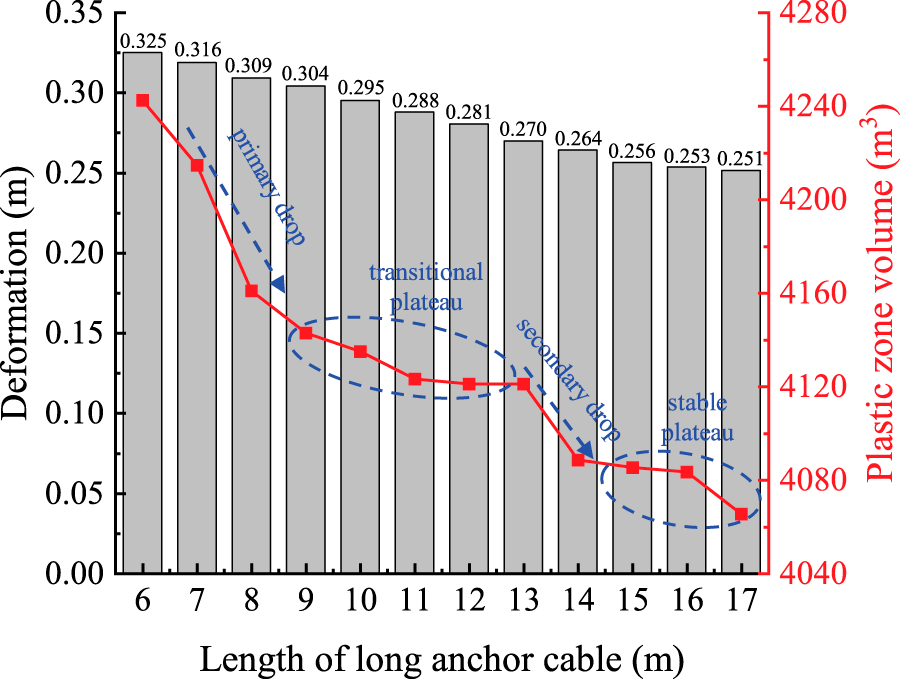
Figure 15: Influence of long anchor cable length on plastic zone volume and deformation.
Fig. 16 shows a clear spacing effect when the length is 14 m and the prestress value is 80 kN. Larger spacing increases deformation and enlarges the plastic zone. When the spacing increases from 1.0 to 2.5 m, the peak displacement rises from 0.271 to 0.291 m. The increase is about 7%. Over the same interval, the plastic zone volume grows from 4121 to 4201 m3. The increase is about 2%. The trend is monotonic across the spacing range of 1.0–2.5 m. Each step to a wider spacing produces more deformation and more yielding. The mechanism is geometric and energetic. Wider spacing reduces reinforcement density. The tributary area per anchor becomes larger. The overlap between compression and confinement bulbs diminishes. Load transfer to the rock mass becomes less continuous. Shear localization is easier to form, and arching is weaker. As a result, the excavation releases more recoverable energy and drives a larger yield volume. The benefit of highly dense spacing shows diminishing returns. At 1.0 m, the displacement is already low, and the plastic volume is close to the minimum of the tested set. Reducing spacing below 1.0 m would add construction cost and congestion. The expected gain would be small. A practical design range for the expansion stage is from 1.0 to 1.5 m. In this range, the displacement remains near or below about 0.28 m in the present simulations. The plastic volume stays close to about 4100 m3. The spacing of 1.0 m provides the strongest confinement, while the spacing of 1.5 m gives a balanced solution with moderate material demand and acceptable deformation control.
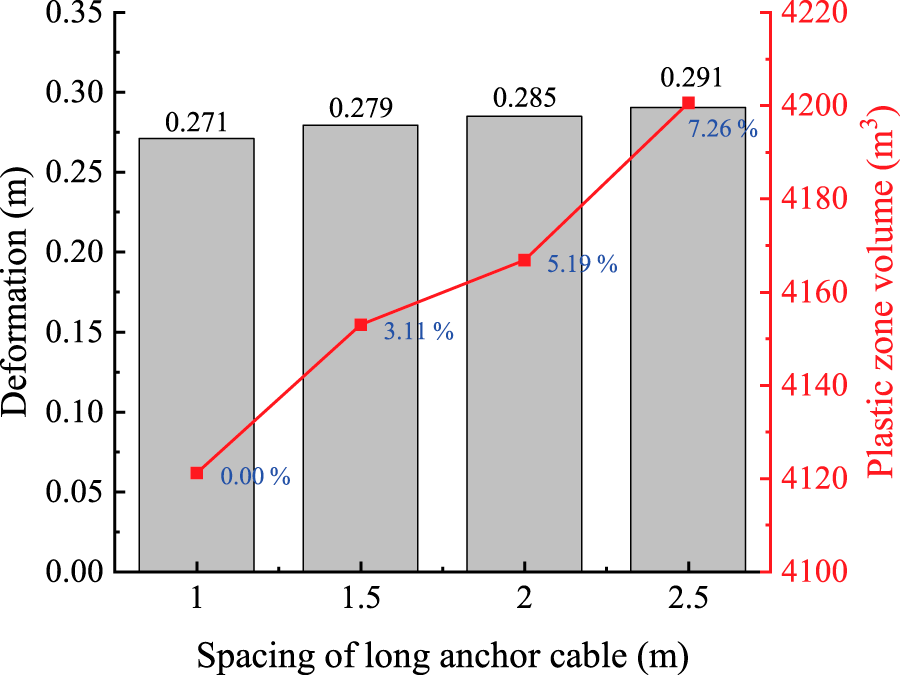
Figure 16: Influence of long anchor cable spacing on plastic zone volume and deformation.
Fig. 17 indicates that prestress significantly enhances the reinforcement effect of anchor cables. When prestress increased from 80 to 170 kN, crown displacement decreased from 0.270 to 0.244 m, a reduction of about 10%. The plastic zone volume decreased from 4121 to 3966 m3, corresponding to a shrinkage of about 4%. The improvement is more evident between 80 and 140 kN. Within this range, deformation reduction reached 0.022 m, and the plastic zone volume decreased by 122 m3. This shows that moderate prestress can effectively mobilize the anchors and confine the surrounding rock at an early stage of excavation. When the prestress exceeded 140 kN, the trend gradually flattened. Increasing the prestress from 140 to 170 kN reduced deformation by only 0.004 m, and the plastic zone volume decreased by 33 m3.
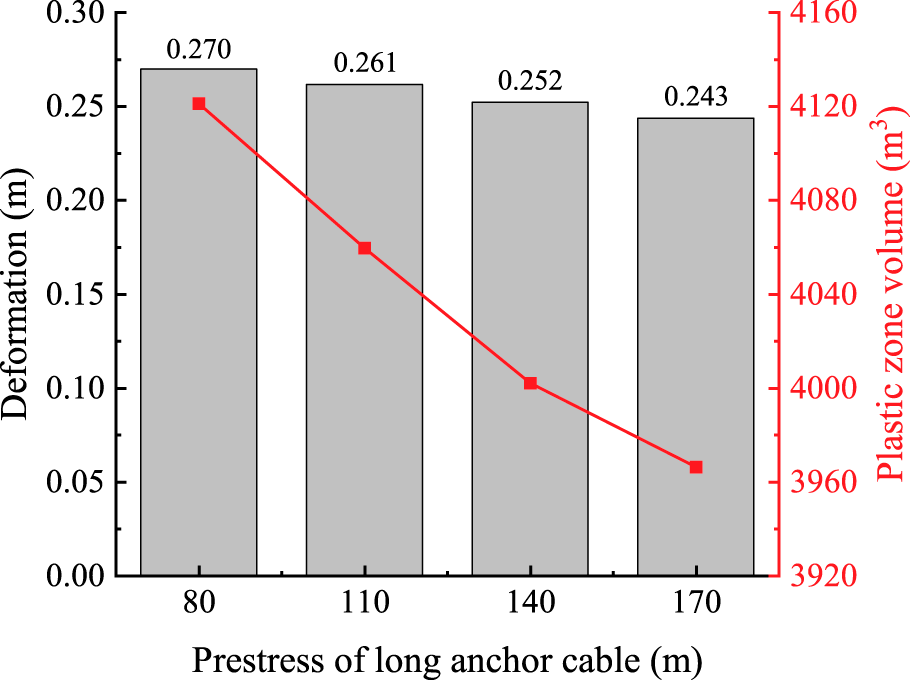
Figure 17: Influence of long anchor cable prestress on plastic zone volume and deformation.
This result indicates that the reinforcement efficiency follows a nonlinear response. Prestressing first enhances the contact between the anchor and rock mass, improving load transfer and reducing localized deformation. However, once the anchorage system is fully mobilized, the effect of additional prestress becomes marginal. Excessive prestress may also increase the risk of overstressing the cable or damaging the grout-rock interface.
Based on the simulation results, the optimal prestress value falls within the range of 110 to 140 kN. This range provides significant improvement in both displacement control and plastic zone reduction while avoiding unnecessary material demand or structural risk.
5.2 Energy-Based Analysis of Tunnel Expansion and Support Parameter Optimization
5.2.1 Definitions of Energy Components
As rock is excavated and supports are installed, the total potential energy within the system changes. Let
Prestressed anchors do not eliminate excavation-induced energy release. They provide reinforcement work that offsets part of the released elastic strain energy and reduces the energy available for localization and damage development. The remaining portion is still dissipated through plastic deformation, which is tracked in the numerical energy components and remains non-zero even in reinforced cases.
Energy quantities were obtained from FLAC3D outputs and post-processing rather than from direct physical instrumentation. The elastic strain energy of the surrounding rock was computed from the stress and elastic strain state stored in the zones, and its stage-to-stage change was used to represent unloading-related energy release. Plastic dissipation was tracked from the incremental plastic work in the yielded zones. Support energy was evaluated from the anchor response by integrating axial force with respect to elongation along the loading path, and the system energy balance was assessed by comparing released elastic energy with the sum of support work and plastic dissipation. These energy terms were extracted consistently at each excavation stage so the energy index provides a comparable measure across designs and supports the subsequent parameter screening.
To quantitatively evaluate the improvement of stability, two key indicators are defined based on the energy balance between the rock and supports. Energy difference is the absolute difference between the released rock energy and the support energy. It can be expressed as:
This value represents the net energy not accounted for by support work. If
ERRF serves as a direct measure of the energy balance between the rock and the supports. When ERRF = 1, it indicates that the support energy matches the released energy exactly. When ERRF > 1 suggests inadequate support, where more energy is released than absorbed, while when ERRF < 1 implies that the support system is sufficiently robust to absorb all the released energy, possibly even providing excessive support. In effect, a lower ERRF corresponds to better stability improvement, as a smaller fraction of the rock’s released energy is going unabsorbed by supports. ERRF will be used as a primary stability indicator in the study.
In this framework, the unity threshold reflects a stage-wise energy-balance condition between the released unloading energy and the reinforcement work. When ERRF exceeds one, the released energy is larger than the support work provided by the anchors, and the remaining portion is dissipated through irreversible processes such as plastic deformation and damage, which is consistent with stronger localization, a larger yielded zone, and higher displacement demand in the weakly supported or unsupported cases. When ERRF approaches one, the system is close to energy balance, so the response becomes more sensitive to parameter changes because a modest reduction in support contribution can shift the excavation into an energy-deficit state. When ERRF falls below one, the support work offsets a larger portion of the released energy, and the response becomes more controlled, which is reflected by reduced displacement demand and a contracted plastic zone in the present simulations. For engineering interpretation, ERRF is evaluated together with conventional indicators reported in the parametric study, including crown displacement and plastic zone volume, so the energy index can be used as a practical screening target while remaining consistent with displacement-based checks and yielded-zone control criteria.
The FLAC3D simulation monitors energy components throughout excavation. The total system energy change due to the tunnel expansion can be conceptually partitioned as:
where
In order to quantitatively evaluate the interaction between excavation-induced unloading and prestressed anchor support, the system energy components were extracted directly from FLAC3D. The total change in elastic strain energy
where
The support energy provided by anchors
where
where
The support energy in this study is evaluated based on the applied prestress level at the installation stage and the corresponding deformation compatibility within the numerical model. During staged excavation, the axial force of the anchor cables evolves automatically with the surrounding rock deformation, so the model captures the redistribution of cable force induced by excavation. At the same time, the calculation does not include time-dependent prestress losses associated with seating, relaxation, grout creep, or progressive debonding along the bonded length. In practice, partial mobilization or prestress loss would reduce the effective support work that can be delivered, which would increase the energy release–reinforcement ratio and could shift a scheme that is close to energy balance toward a less favorable state. For this reason, the reported energy-based evaluation is interpreted as an upper-bound estimate of the support contribution under the assumed ideal mobilization, and this limitation has been stated explicitly.
With minor differences attributed to numerical damping and negligible kinetic energy due to the staged excavation procedure. This energy framework ensures that the extracted
5.2.2 Energy-Based Optimization Indicators
To provide a compact quantitative overview of the parametric results, Table 2 summarizes the maximum displacement, plastic zone volume, and ERRF for all investigated parameter sets, together with percentage changes relative to the reference configuration in each sweep. For the length sweep under spacing 1.0 m and prestress 80 kN, increasing the long-anchor length from 6 to 14 m reduced the maximum displacement from 0.32503 to 0.26432 mm and reduced the plastic zone volume from 4242.29 to 4088.47 m3, while ERRF decreased from 1.000 to 0.894. For the spacing sweep under length 14 m and prestress 80 kN, decreasing the spacing from 2.5 to 1.0 m reduced the maximum displacement from 0.29058 to 0.27091 mm and reduced the plastic zone volume from 4200.58 to 4121.14 m3, accompanied by a reduction of ERRF from 1.00 to 0.91. For the prestress sweep under length 14 m and spacing 1.0 m, increasing the prestress from 80 to 170 kN reduced the maximum displacement from 0.27 to 0.24 mm and reduced the plastic zone volume from 4121.14 to 3966.22 m3, with ERRF decreasing from 1.000 to 0.897. The percentage reductions reported in Table 2 enable a direct comparison of parameter efficiency under consistent within-sweep reference conditions.
The spatial distribution of unloading energy is used as a function of anchor length and spacing at a representative prestress level. Fig. 18 shows a contour map of the total unloading energy
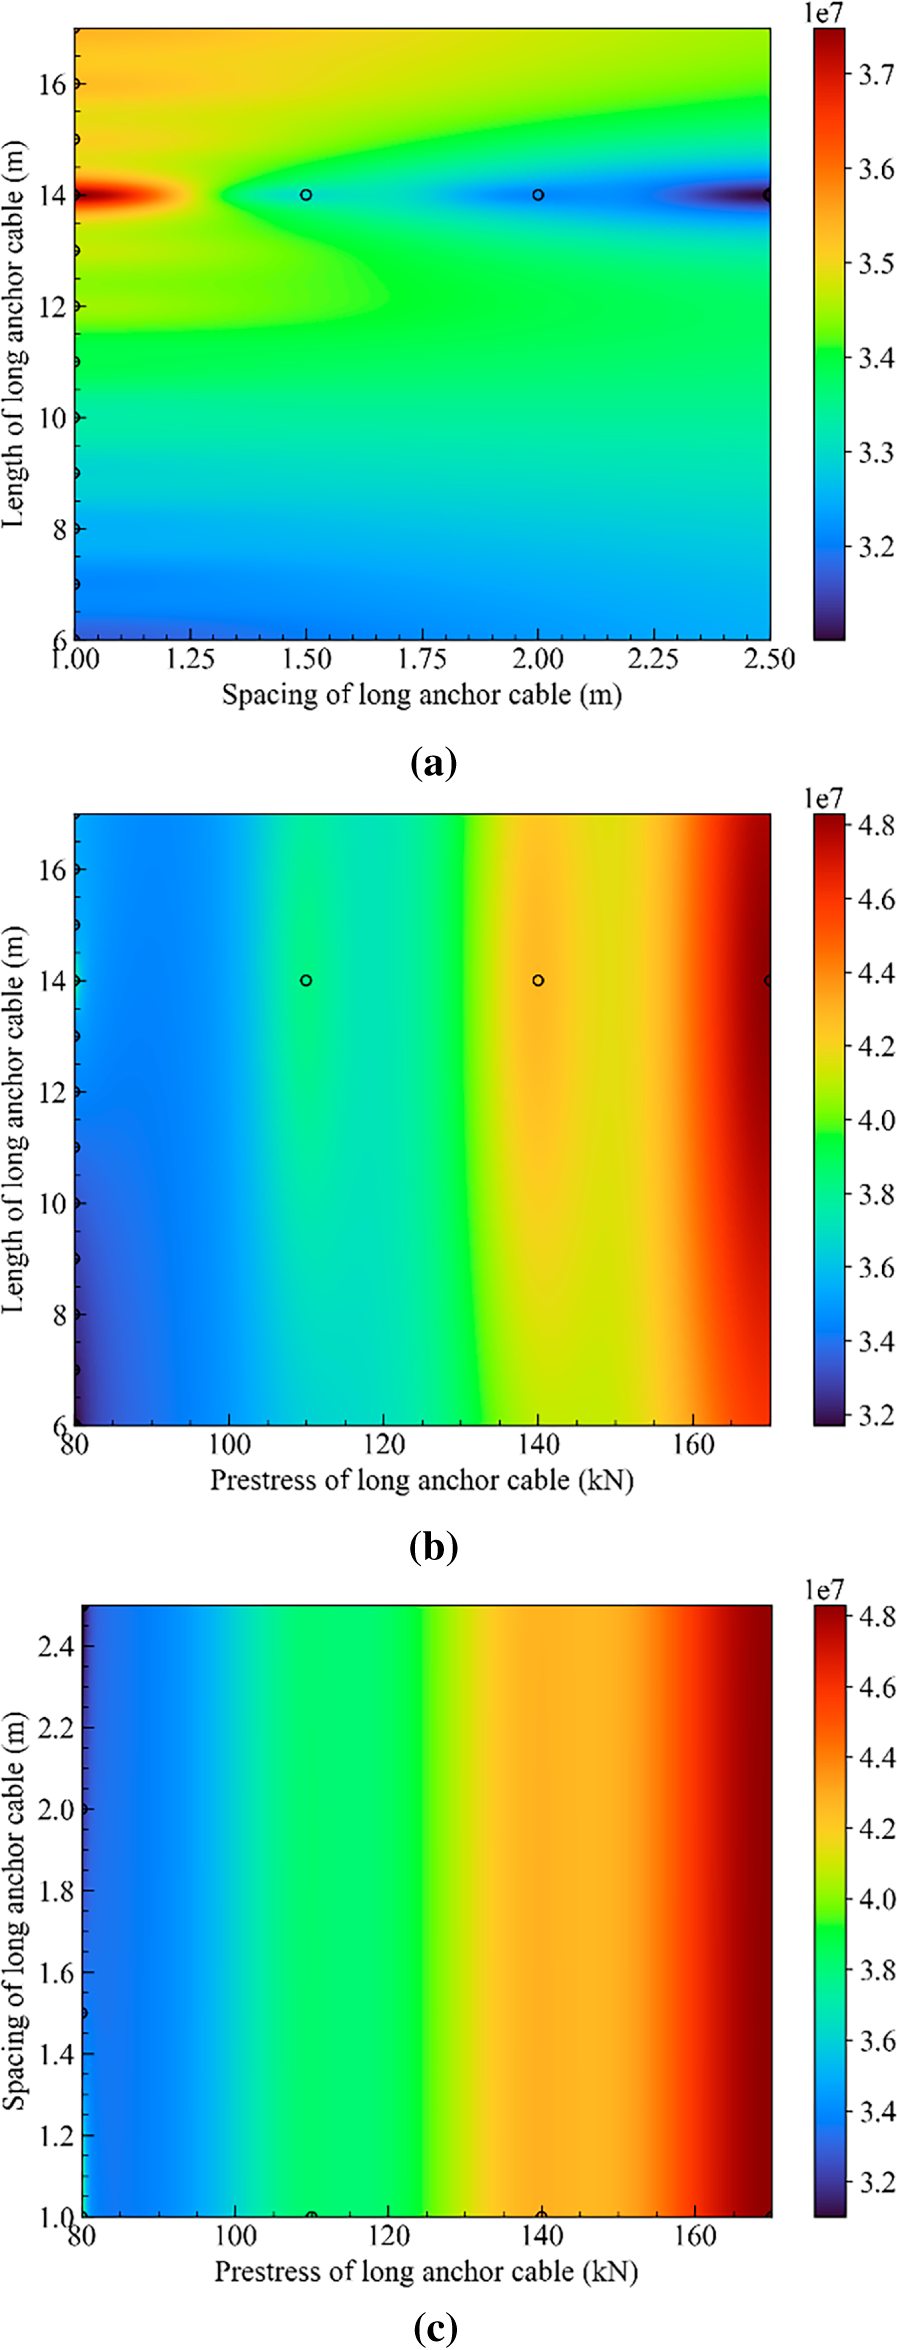
Figure 18: Response surfaces of cumulative elastic energy
There is a pronounced influence of anchor length L on energy release in Fig. 18a. Short anchors (L = 6–8 m) result in a moderate amount of energy release, whereas increasing the length up to about 14 m causes the released energy to peak. This suggests that anchors of around 14 m length are most effective at motivating the surrounding rock elastic deformation. An anchor length of nearly 14 m can engage the majority of the loosened zone around the tunnel. Also, it is not too short to leave a large portion unreinforced and not much longer than necessary. Beyond 14 m, the contours begin to cool slightly, particularly for denser spacing, indicating diminishing returns. Extremely long anchors (L > 14 m) penetrate well into stable ground, adding little additional confinement benefit to the already stabilized zone, and thus do not further increase the energy released by excavation. In essence, L = 14 m appears to be an optimal anchor length for this condition, beyond which the rock does not appreciably store or release more elastic energy during expansion [37].
Spacing of the anchor has an inverse relationship with energy release. Tighter spacing (S = 1.0 m) corresponds to higher measured unloading energy, whereas wider spacing (S = 2.0–2.5 m) shows significantly lower energy release. Considering the energy partitioning, the rock mass with dense anchor support is held more rigidly, which leads to less immediate plastic dissipation and allows more elastic strain energy to accumulate in the rock-support system before failure. Thus, when the expansion excavation occurs, a larger quantity of elastic energy is released. In contrast, the rock is less restrained with sparse anchors, which has earlier yielding and dissipation, and smaller elastic energy release is recorded. In other words, strong support tends to preserve the rock’s elastic energy and prevent premature dissipation until excavation, whereas weak support lets the rock dissipate energy through damage, resulting in a lower measurable
In summary, the energy distribution results at T = 80 kN show that closer anchor spacing and moderate-long anchors around 12–14 m lead to higher recorded unloading energy, which means more elastic energy is preserved for the support to handle, whereas sparse or short anchors result in lower energy release, implying more of the energy was dissipated into rock damage.
Anchor prestress T plays a crucial role in the energy balance. By actively loading the rock before excavation, a higher T increases the capacity of anchors to absorb energy and also confine the rock more effectively. Simulations confirm the stronger influence of T.
At fixed spacing (S = 1.0 m) and varying T, the total unloading energy
Correspondingly, the support energy
However, it is worth noting that simply increasing T beyond a certain point yields diminishing returns in terms of additional stability. Fig. 18c indicates that going from 80 to 110 kN prestress only modestly increases
The concentration of shear demand around the shoulders and arch feet can be understood as a geometric and mechanical coupling effect during enlargement, where stress redistribution and boundary deformation jointly promote localized shearing in these sensitive zones. Prestressed anchoring modifies this response by providing active confinement and by offering a stiffer load-transfer route, so boundary deformation is partly converted into axial resistance and transmitted to deeper rock that remains closer to elastic. As a result, localization near the excavation boundary weakens and the yielded region grows more slowly in the supported cases, which matches the smoother strain redistribution observed in the numerical contours. The same trend is consistent with the energy view adopted here. When reinforcement is insufficient, a larger fraction of the unloading-related energy release must be accommodated through irreversible deformation, which is reflected by a broader plastic zone and higher displacement demand. When reinforcement work increases, more of the release is offset by support contribution, and the remaining demand that drives plastic dissipation is reduced. This mechanism also explains the diminishing returns in the parametric results. Anchor length becomes less effective once additional cable extends beyond the dominant yielding region, spacing becomes less sensitive after the boundary zone is already continuously constrained, and prestress shows weaker incremental influence at higher levels because the controlling response progressively shifts from boundary slip toward the stiffness of the surrounding rock and the mobilization capacity of the anchor–rock interaction.
To validate the energy-based approach, a correlation analysis was performed to examine how the input parameters (L, S, T) and the output metrics relate to each other. Fig. 19 displays a heatmap of the Pearson correlation coefficients between key variables: anchor Length (L), Spacing (S), Prestress (T), total unloading energy
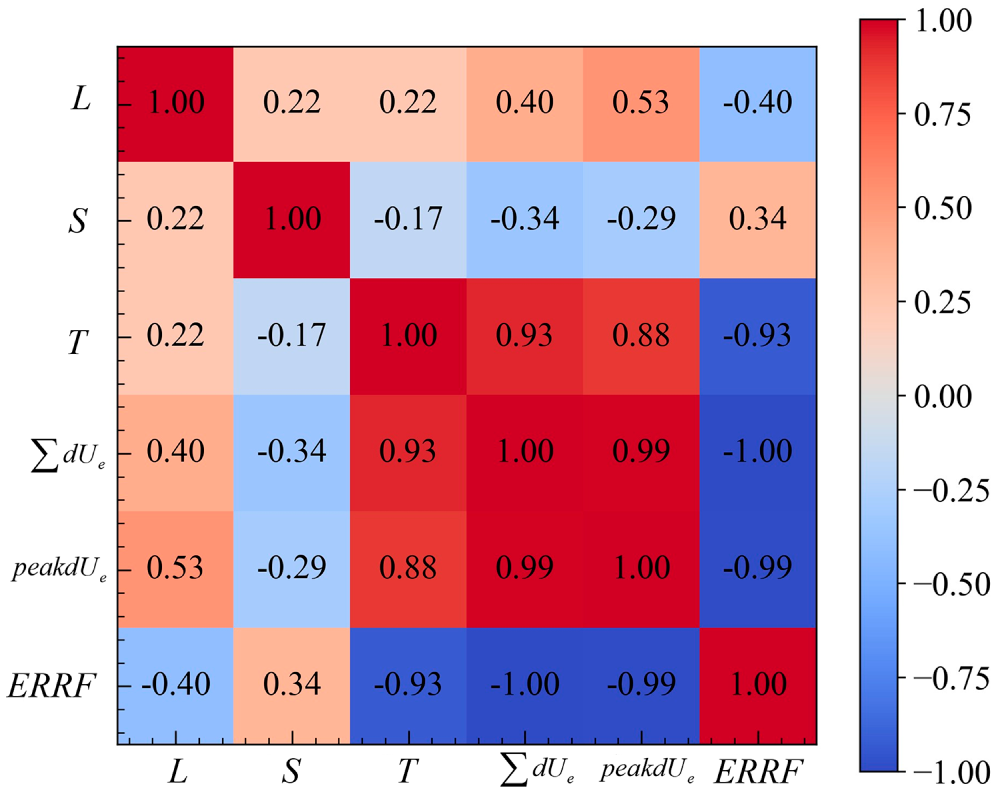
Figure 19: Correlation matrix of L, S, T and energy-based metrics (
Prestress T stands out as having the most significant impact on energy metrics. T shows a strong positive correlation (r = 0.93) with total unloading energy
Anchor Length L also correlates favorably, though more moderately. L has a negative correlation with ERRF (r = 0.40), indicating that longer anchors tend to reduce the energy ratio. Additionally, L correlates positively with total and peak energy release (r = 0.53 and 0.40, respectively,
Anchor Spacing S has a negative correlation with total energy release (r = −0.34), meaning larger spacing results in less energy release, and a positive correlation with ERRF (r = 0.34), meaning larger spacing increases ERRF. In short, as anchors are spaced farther apart, the support becomes less effective. Thus, less elastic energy is captured, resulting in a lower
Overall, the results demonstrate that the optimal support parameter range is L = 12–14 m, S = 1.2–1.5 m, T = 100–120 kN, within which anchors can absorb nearly all unloading energy and suppress plastic zone development. This confirms that the energy-based approach is a robust and practical tool for support optimization in tunnel expansion projects.
The improvement in the energy balance state produced by the optimized parameters is controlled by how reinforcement interacts with the dominant yielding region during enlargement. In the present geometry, shear localization and plastic deformation concentrate near the shoulders and arch feet, so anchor length is most effective when the reinforced segment overlaps this zone and provides a stable load-transfer path into deeper rock. As the length increases toward the reported range, the reinforced zone engages a larger portion of the deformation-affected region and helps the surrounding rock form a more coherent load-bearing ring, which reduces local energy concentration and slows the outward growth of the yielded zone. Anchor spacing affects the continuity of this confinement effect. A smaller spacing within the efficient interval improves reinforcement density along the boundary, promotes more uniform redistribution of deformation work, and reduces the fraction of released unloading energy that must be accommodated through plastic dissipation. Prestress mainly controls when and how this transfer mechanism is activated. Higher prestress increases the initial confinement and accelerates mobilization of axial resistance, so the support work contribution becomes more prominent at earlier stages and localization is suppressed. Once the boundary zone is already effectively constrained, further increases in prestress produce smaller incremental changes because the response becomes increasingly governed by the stiffness of the surrounding rock and the mobilization capacity of the anchor–rock interaction rather than by boundary slip alone.
The reported ranges for anchor length, spacing, and prestress are obtained from the parametric study for the tunnel geometry, boundary conditions, and rock-mass properties considered in this project. They are therefore project-specific in an absolute sense, and their direct transfer to other tunnels should account for differences in span, overburden and in-situ stress level, rock-mass strength and stiffness, and construction sequence. The practical implication is that the present ranges provide a rational baseline and a screening interval for similar large-span enlargement problems under comparable rock conditions, while the final design should be calibrated through project-specific numerical analyses and field constraints, including allowable displacement limits, constructability, and expected prestress retention.
This study combined physical model experiments and numerical simulations to investigate the mechanical response of the surrounding rock and anchor cable support during in-situ tunnel expansion. A series of laboratory-scale models (S01-S04) and large-scale FLAC3D simulations were employed to evaluate deformation, plastic zone development, and energy evolution under different support configurations. The research further introduced an energy-based framework, quantifying unloading energy release and reinforcement energy absorption, to identify optimal design parameters for prestressed anchors.
(1) Comparisons between physical model tests and numerical simulations demonstrated strong consistency. The displacement contours and plastic zone distributions reproduced the experimental failure patterns, including the X-shaped shear failure concentrated at the tunnel shoulders and footings. The monitored deformations at characteristic points agreed within a small margin, confirming that the numerical model captures the essential mechanical behavior of the surrounding rock under excavation.
(2) Results showed that increasing the length of long anchors from 6 to 14 m reduced deformation and plastic zone volume. For example, the cumulative elastic energy balance improved by more than 15% when the anchor length increased from 10 to 14 m. When the length exceeded 14 m, the rate of improvement diminished and the response tended to plateau. This trend suggests that extending anchor length beyond the main deformation-affected zone contributes progressively less to overall control in the present configuration, which is consistent with the limited additional engagement of the far end of the cable in the dominant yielding region.
(3) Varying the spacing between long anchors had a pronounced influence on surrounding rock control. Reducing spacing from 2.5 m to 1.0 m decreased plastic zone volume by approximately 20%. When spacing was below 1.5 m, the incremental benefit became smaller and the response approached saturation, indicating that a spacing interval between 1.0 and 1.5 m provides an efficient balance between reinforcement density and deformation control for the studied tunnel. Larger spacings are associated with broader redistribution and larger yielded regions, which is consistent with the observed expansion of high-strain zones in the numerical results.
(4) Prestress influenced the energy index and the overall stability response. Increasing prestress from 80 to 170 kN reduced ERRF from about 1.0 to below 0.7, indicating a stronger support contribution relative to the released energy within the adopted calculation framework. Prestress values above 140 kN provided relatively stable control in the simulated cases, while further increases produced smaller incremental changes. This behaviour suggests diminishing sensitivity at high prestress levels, and practical upper bounds should still consider constructability and the risk of overstressing structural components.
(5) An energy method was proposed to quantify the interaction between excavation-induced unloading and prestressed anchor reinforcement. Unloading energy of the surrounding rock was defined as the reduction in stored elastic strain energy, while support energy was calculated from the work of anchors. The ERRF was introduced as the principal stability indicator. ERRF values below unity were consistently associated with smaller displacements and reduced plastic zone development in the simulated cases, so ERRF is used here as a practical indicator that aligns with conventional stability outputs rather than as a stand-alone mechanistic proof.
The applicability of the present findings is subject to several limitations. The physical model tests were performed at a reduced scale, and the simplified material representation may not fully capture the heterogeneity and discontinuities of in-situ rock masses. The FLAC3D simulations adopted idealized boundary conditions and calibrated constitutive assumptions, so the reported parameter ranges and ERRF thresholds should be transferred with caution to projects with different stress regimes, rock-mass quality, or excavation sequences. The current energy-balance evaluation is based on quasi-static excavation steps, while time-dependent effects and progressive support–rock interaction degradation were simplified. Further validation with full-scale field monitoring is needed to refine the generality of the proposed indicator and the recommended design ranges.
Recent tunnel expansion and large-span tunnelling studies commonly evaluate alternative enlargement schemes and support layouts using displacement, stress redistribution, and the extent of yielding as the main decision basis [38]. In parallel, research on prestressed bolt and cable systems typically demonstrates reinforcement benefits through monitored deformation control and improved stability during construction, which provides valuable empirical evidence but still leaves the interpretation distributed across multiple indicators [39]. Building on these established evaluation practices, the present study introduces an energy-balance lens that translates excavation-related energy release and support contribution into a single interpretable relationship, so that different design options can be compared under a consistent physical meaning rather than relying on one output only [40]. This energy interpretation is also consistent with recent tunnel-focused work showing that excavation unloading can be discussed in terms of energy evolution and redistribution, which helps explain why some parameter changes produce clear improvements in deformation control while others show diminishing returns.
In practical engineering design, the energy-balance method can be implemented as a short workflow. The tunnel geometry and enlargement sequence are first fixed from project drawings and construction constraints, and the baseline support layout is defined together with rock-mass and support properties obtained from site investigation and design inputs. A staged numerical model of the enlargement process is then established so that deformation and yielding evolve with the excavation steps. For each stage, the change in stored elastic strain energy of the surrounding rock and the reinforcement contribution of the prestressed anchorage system are extracted to evaluate ERRF, and stages with unfavorable energy balance are identified. Anchor length, spacing, and prestress are subsequently adjusted within feasible ranges to drive ERRF toward a more favorable level, while the resulting schemes are checked against conventional criteria already used in practice, including displacement limits and plastic zone control, together with constructability constraints. The final design is selected from the schemes that satisfy both the energy-balance screening and the conventional performance requirements.
Acknowledgement: None.
Funding Statement: This study has been partially funded by the National Key R&D Program of China, China (No. 2024YFF0507903), the National Key Research and Development Program of China (Grant No. 2024YFF0507904), and the National Natural Science Foundation of China, China (Grant No. 52379114). These supports are gratefully acknowledged.
Author Contributions: The authors confirm contribution to the paper as follows: Conceptualization, Ying Zhu and Minghui Hu; methodology, Xiaoliang Dong; software, Zheng Yuan; validation, Richeng Liu, Xuewen Xiao and Shengxu Wang; formal analysis, Ying Zhu; investigation, Minghui Hu; resources, Xiaoliang Dong; data curation, Xuewen Xiao; writing—original draft preparation, Ying Zhu; writing—review and editing, Xiaoliang Dong; visualization, Shengxu Wang; supervision, Richeng Liu; project administration, Meng Wang; funding acquisition, Richeng Liu. All authors reviewed and approved the final version of the manuscript.
Availability of Data and Materials: The data that support the findings of this study are available from the corresponding author upon reasonable request.
Ethics Approval: This study did not involve human participants, human data, human tissue, or animals. According to the relevant institutional and national regulations for engineering and laboratory research, such work is exempt from review by a research ethics committee; therefore, no committee approval and no approval or registration number are applicable. All experimental procedures complied with the authors’ institutional guidelines for research integrity, laboratory safety, and environmental protection.
Conflicts of Interest: The authors declare no conflicts of interest.
Abbreviation
| Density of the model material | |
| E | Elastic modulus |
| Poisson’s ratio | |
| c | Cohesion in the Mohr–Coulomb model |
| Friction angle in the Mohr–Coulomb model | |
| L | Anchor cable length |
| S | Anchor spacing |
| T | Applied prestress level per anchor cable |
| dmax | Maximum Displacement |
| Vp | Plastic zone volume |
| Ue | Elastic strain energy stored in the rock mass |
| ΔUe | Released elastic strain energy |
| Esup | Energy provided by the anchor system |
| ΔE | Energy difference |
| ERRF | Energy release-reinforcement ratio |
| Ep | Energy dissipated through plastic deformation |
| Ek | Energy dissipated through dynamic effects |
| ΔUt | Total system energy change |
| r | Pearson correlation coefficient |
References
1. He C, Wang B. Research progress and development trends of highway tunnels in China. J Mod Transp. 2013;21(4):209–23. doi:10.1007/s40534-013-0029-4. [Google Scholar] [CrossRef]
2. Zhang JL, Gao YM, Liu X, Zhang ZA, Yuan Y, Mang HA. A shield tunneling method for enlarging the diameter of existing tunnels: experimental investigations. Tunn Undergr Space Technol. 2022;128:104605. doi:10.1016/j.tust.2022.104605. [Google Scholar] [CrossRef]
3. Cheng X, Wang B, Guo X, Zhang L. A novel in-situ tunnel expansion method based on removable prestressed active support technology for rapid construction. Tunn Undergr Space Technol. 2026;168:107155. doi:10.1016/j.tust.2025.107155. [Google Scholar] [CrossRef]
4. Chen H, Zheng H, Liu B, Huang M, Liu J. Study on construction mechanic characteristics and construction optimization of super-large cross-section tunnel portal under shallow buried depth and asymmetrical loading: a case study in Southwest China. PLoS One. 2025;20(1):e0316736. doi:10.1371/journal.pone.0316736. [Google Scholar] [PubMed] [CrossRef]
5. Tian X, Song Z, Shen X, Xue Q. Study on progressive failure mode of surrounding rock of shallow buried bias tunnel considering strain-softening characteristics. Sci Rep. 2024;14(1):9608. doi:10.1038/s41598-024-60324-y. [Google Scholar] [PubMed] [CrossRef]
6. Lin XT, Wu QJ, Cao L, Zhao ZY, Su D, Chen X. Experimental study on failure mechanism of tunnel face during shield tunneling beneath existing underground rectangular structure. Tunn Undergr Space Technol. 2026;167:107072. doi:10.1016/j.tust.2025.107072. [Google Scholar] [CrossRef]
7. Gijzel D, Bosch-Rekveldt M, Schraven D, Hertogh M. Integrating sustainability into major infrastructure projects: four perspectives on sustainable tunnel development. Sustainability. 2020;12(1):6. doi:10.3390/su12010006. [Google Scholar] [CrossRef]
8. Ou GZ, Jiao YY, Zhang GH, Zou JP, Tan F, Zhang WS. Collapse risk assessment of deep-buried tunnel during construction and its application. Tunn Undergr Space Technol. 2021;115(3):104019. doi:10.1016/j.tust.2021.104019. [Google Scholar] [CrossRef]
9. Sun BJ, Mei YC, Li WT, Zhang CA, Shao X, Li TC, et al. Experimental study on the deformation and failure mode of surrounding rocks of a tunnel in a jointed rock mass. Eng Fail Anal. 2024;163:108470. doi:10.1016/j.engfailanal.2024.108470. [Google Scholar] [CrossRef]
10. Jiang B, Wu K, Wang Q, Wang Y, Li D, Deng Y. High prestressed anchorage support for tunnel surrounding rock model test method and its control effect. Tunn Undergr Space Technol. 2025;157(7):106332. doi:10.1016/j.tust.2024.106332. [Google Scholar] [CrossRef]
11. Li P, Chen Y, Huang J, Wang X, Liu J, Wu J. Design principles of prestressed anchors for tunnels considering bearing arch effect. Comput Geotech. 2023;156:105307. doi:10.1016/j.compgeo.2023.105307. [Google Scholar] [CrossRef]
12. Zhou S, Jin Y, Tian Z, Zou C, Zhao H, Miao Z. Exploring the feasibility of prestressed anchor cables as an alternative to temporary support in the excavation of super-large-span tunnel. Railw Eng Sci. 2024;32(3):344–60. doi:10.1007/s40534-024-00340-w. [Google Scholar] [CrossRef]
13. Frenelus W, Peng H, Zhang J. An insight from rock bolts and potential factors influencing their durability and the long-term stability of deep rock tunnels. Sustainability. 2022;14(17):10943. doi:10.3390/su141710943. [Google Scholar] [CrossRef]
14. Khan B, Jamil SM, Jafri TH, Akhtar K. Effects of different empirical tunnel design approaches on rock mass behaviour during tunnel widening. Heliyon. 2019;5(12):e02944. doi:10.1016/j.heliyon.2019.e02944. [Google Scholar] [PubMed] [CrossRef]
15. Bian WH, Yang J, Zhu C, Wang KX, Xu DM. Application of excavation compensation method for enhancing stability and efficiency in shallow large-span rock tunnels. J Cent South Univ. 2024;31(9):3242–63. doi:10.1007/s11771-024-5767-4. [Google Scholar] [CrossRef]
16. Han D, Zhong X, Liu L, Cui H, Li D, Yan Z, et al. Study on the construction method for in-situ expansion of existing large cross-section tunnels. Discov Appl Sci. 2025;7(6):556. doi:10.1007/s42452-025-07132-9. [Google Scholar] [CrossRef]
17. He S, He J, Ma J, Liu X, Li Y, Zhang B. Mechanical behavior of anchor bolts for shallow super-large-span tunnels in weak rock mass. Materials. 2023;16(17):5862. doi:10.3390/ma16175862. [Google Scholar] [PubMed] [CrossRef]
18. Jia Y, Ouyang A, Wang S, Liang X, Wang B, Liu C, et al. Development and application of model test system for reconstruction and expansion of existing shallow single-hole tunnel into twin-arch tunnel. Adv Civ Eng. 2021;2021(1):6656165. doi:10.1155/2021/6656165. [Google Scholar] [CrossRef]
19. Huo SS, Tao ZG, He MC, Xu C, Wang FN, Lv ZY. Physical model test of NPR anchor cable-truss coupling support system for large deformation tunnel in fault fracture zone. Tunn Undergr Space Technol. 2024;152:105939. doi:10.1016/j.tust.2024.105939. [Google Scholar] [CrossRef]
20. Yang X, Xue H, Guo J, Zhang M. Quantitative analysis of the performance improvement of the surrounding rock mass by applying a prestressed bolt system. Sci Rep. 2025;15(1):7186. doi:10.1038/s41598-025-91976-z. [Google Scholar] [PubMed] [CrossRef]
21. Zhang X, Wang M, Lyu C, Tong J, Yu L, Liu D. Experimental and numerical study on tunnel faces reinforced by horizontal bolts in sandy ground. Tunn Undergr Space Technol. 2022;123(2):104412. doi:10.1016/j.tust.2022.104412. [Google Scholar] [CrossRef]
22. Shan R, Xiao S, Li Y, Zhao X, Han T, Zhang S. Study on numerical simulation and mechanical properties of anchor cable with C-shaped tube subjected to shearing. Sci Rep. 2024;14(1):7425. doi:10.1038/s41598-024-58085-9. [Google Scholar] [PubMed] [CrossRef]
23. Singh P, Jang H, Spearing AJSS. Improving the numerical modelling of in-situ rock bolts using axial and bending strain data from instrumented bolts. Geotech Geol Eng. 2022;40(5):2631–55. doi:10.1007/s10706-022-02051-7. [Google Scholar] [CrossRef]
24. Liu Q, Li Y, Li W, Zhao J, Qin Z, Yang X, et al. Primary support optimization of large-span and shallow buried hard rock tunnels based on the active support concept. Sci Rep. 2022;12(1):7918. doi:10.1038/s41598-022-11399-y. [Google Scholar] [PubMed] [CrossRef]
25. Sun Z, Zhang D, Liu D, Tai Q, Hou Y. Insights into the ground response characteristics of shallow tunnels with large cross-section using different pre-supports. Int J Rock Mech Min Sci. 2024;175(1):105663. doi:10.1016/j.ijrmms.2024.105663. [Google Scholar] [CrossRef]
26. Gong FQ, Luo S, Yan JY. Energy storage and dissipation evolution process and characteristics of marble in three tension-type failure tests. Rock Mech Rock Eng. 2018;51(11):3613–24. doi:10.1007/s00603-018-1564-4. [Google Scholar] [CrossRef]
27. Duan K, Ji Y, Wu W, Kwok CY. Unloading-induced failure of brittle rock and implications for excavation-induced strain burst. Tunn Undergr Space Technol. 2019;84:495–506. doi:10.1016/j.tust.2018.11.012. [Google Scholar] [CrossRef]
28. Fan D, Liu X, Tan Y, Li X, Yang S. Energy mechanism of bolt supporting effect to fissured rock under static and dynamic loads in deep coal mines. Int J Min Sci Technol. 2024;34(3):371–84. doi:10.1016/j.ijmst.2024.03.001. [Google Scholar] [CrossRef]
29. Li G, Zhu C, Liu H, Tang S, Du K, Wu CZ. Energy balance support method in soft rock tunnel with energy absorbing anchor cable. Tunn Undergr Space Technol. 2023;141:105380. doi:10.1016/j.tust.2023.105380. [Google Scholar] [CrossRef]
30. Yang K, Yan Q, Zhang C, Cheng Y. Investigation of energy transformation and dissipation in soft rock tunnels with yielding support under large deformation. Rock Mech Rock Eng. 2024;57(8):6119–40. doi:10.1007/s00603-024-03842-5. [Google Scholar] [CrossRef]
31. Zheng K, Shi C, Lou Y, Jia C, Lei M, Yang Y. A computational method for tunnel energy evolution in strain-softening rock mass during excavation unloading based on triaxial stress paths. Comput Geotech. 2024;169:106212. doi:10.1016/j.compgeo.2024.106212. [Google Scholar] [CrossRef]
32. Xin XK, Meng QB, Wu JY, Wu ZW, Chen L, Song ZM. The evolutionary distribution law of rock energy and the study of energy balance mechanism in tunnel-surrounding rock. Int J Geomech. 2025;25(11):04025254. doi:10.1061/ijgnai.gmeng-11842. [Google Scholar] [CrossRef]
33. Salamon MD. Energy considerations in rock mechanics: fundamental results. J South Afr Inst Min Metall. 1984;84(8):233–46. [Google Scholar]
34. Hua AZ, You MQ. Rock failure due to energy release during unloading and application to underground rock burst control. Tunn Undergr Space Technol. 2001;16(3):241–6. doi:10.1016/S0886-7798(01)00046-3. [Google Scholar] [CrossRef]
35. Li W, Li X, Mei Y, Wang G, Yang W, Wang H. A numerical simulation approach of energy-absorbing anchor bolts for rock engineering. Int J Rock Mech Min Sci. 2022;158(1):105188. doi:10.1016/j.ijrmms.2022.105188. [Google Scholar] [CrossRef]
36. Wang W, Xu W, Zhao G, Zhang Y, Qi M, Zhao B, et al. Mechanical behavior and energy evolution of surrounding rock during excavation-induced unloading in high-stress conditions. Geotech Geol Eng. 2025;43(7):363. doi:10.1007/s10706-025-03334-5. [Google Scholar] [CrossRef]
37. Li G, Ma WB, Yu CY, Tao ZG, Wang FN. Optimization of anchorage support parameters for soft rock tunnel based on displacement control theory. J Mt Sci. 2023;20(7):2076–92. doi:10.1007/s11629-023-7999-4. [Google Scholar] [CrossRef]
38. Luo J, Zhang D, Sun Z, Fang Q, Liu D, Xu T, et al. Numerical modelling and field monitoring study on large-span tunnelling using pretensioned bolt-cable combined support system. Tunn Undergr Space Technol. 2023;132:104911. doi:10.1016/j.tust.2022.104911. [Google Scholar] [CrossRef]
39. Tao Z, Lei X, Liu K, Zhang R, Fan X, Cai M. A model test investigation on prestressed anchor cable support for the Haidong fault tunnel. Tunn Undergr Space Technol. 2025;158:106396. doi:10.1016/j.tust.2025.106396. [Google Scholar] [CrossRef]
40. Wang C, Liu L, Elmo D, Shi F, Gao A, Ni P, et al. Improved energy balance theory applied to roadway support design in deep mining. J Geophys Eng. 2018;15(4):1588–601. doi:10.1088/1742-2140/aab3a0. [Google Scholar] [CrossRef]
Cite This Article
 Copyright © 2026 The Author(s). Published by Tech Science Press.
This work is licensed under a Creative Commons Attribution 4.0 International License , which permits unrestricted use, distribution, and reproduction in any medium, provided the original work is properly cited.
 Downloads
 Citation Tools