
 Submit a Paper
 Propose a Special lssue
 Open Access
ARTICLE

QFedFormer: A Privacy-Preserving Federated Transformer with Blockchain-Anchored Incentives for Dynamic EV Charging Pricing
1 Department of Computer Science and Engineering, Sejong University, 209, Neungdong-ro, Gwangjin-gu, Seoul, Republic of Korea
2 The Institute of Research and Development, Duy Tan University, Da Nang, Vietnam
3 Faculty of Information Technology, Duy Tan University, Da Nang, Vietnam
* Corresponding Author: Hyosik Yang. Email:
Computer Modeling in Engineering & Sciences 2026, 147(3), 46 https://doi.org/10.32604/cmes.2026.081849
Received 10 March 2026; Accepted 14 May 2026; Issue published 30 June 2026
 View Full Text
 Download PDF
Abstract
We present QFedFormer, a federated transformer for dynamic electric vehicle (EV)-charging price prediction that combines quantization-aware training, SHAP-guided explainability, and blockchain-based incentives. The framework trains across distributed charging stations without centralizing user data, and programmable contracts set tariffs from forecasted demand and user-declared flexibility, while token rewards are derived from SHAP-based utility scores and anchored on-chain via Merkle proofs. On a real-world dataset, QFedFormer attains an energy-demand RMSE ofGraphic Abstract
Keywords
As EV adoption increases, the need for intelligent and secure EV charging management is increased [1]. Conventional centralized energy management methods are limited by the distributed nature of EV infrastructure, heterogeneous user behavior, and the variability of renewable energy inputs [2]. Key challenges are identified as real-time scalability, data privacy preservation, and demand-side participation without excessive grid burden or loss of user incentives [3]. These challenges are further intensified by the scale and variability of EV charging demand. Additional constraints are introduced for grid coordination and infrastructure efficiency [4].
Further challenges are observed in EV charging pricing compared with other energy applications. Pricing decisions are affected by highly dynamic consumer demand, user behavior, and grid constraints. This condition produces unstable and non-IID data distributions across charging stations.
Privacy concerns arise from the continuous collection of consumer-level charging data, such as user location, charging time, and consumed energy. A potential risk of private data leakage is introduced.
Additional risks are associated with the security of EV charging operations. Communication between charging stations and grid operators is exposed to cyberattacks, such as data injection, spoofing, and MIM attacks. User consumption records and charging price decisions may be altered by attackers. These challenges indicate that an adequate pricing mechanism is required.
To address these issues, decentralized learning and secure communication channels are required. Collaborative model training is enabled by federated leadrning (FL) without direct exchange of raw data, and user anonymity is preserved. Privacy is ensured by DP for transmitted model updates. Price calculation and payment execution are secured by blockchain technology. Pricing rules and reward distribution are executed automatically through smart contracts. Transparent decisions are also supported by explainability tools such as SHAP. Decisions can be verified, and user trust in the pricing policy is improved. Therefore, an EV charging pricing algorithm can be designed with these components to provide security and privacy.
Complementary capabilities are provided by FL and blockchain paradigms in decentralized EV charging systems. Collaborative model training is achieved by FL without data disclosure, and privacy protection is supported in distributed data settings [5]. Coordination integrity, and enforceable execution are guaranteed by blockchain through smart contracts [6].
However, demand prediction and pricing execution are usually considered separately in current methods. Explainability, auditability, and incentive alignment are also not considered jointly in many existing frameworks.
Integration of dynamic pricing with the forecasting process poses several related challenges. First, a challenge arises from the non-IID nature of EV load statistics. Charging demand is influenced by time slots, user routines, regional needs, and charging-point availability. Therefore, existing centralized methods are not considered effective [7]. Second, price changes and rational user expectations are required to be balanced. Real-time pricing may not be accepted by users when fair treatment is not guaranteed. This issue may negatively affect grid balance [8].
Other related problems are also identified. First, infrastructure heterogeneity is required to be considered. Hardware equipment, local policies, renewable integration, and other factors differ across regions. This heterogeneity increases the difficulty of applying a single forecasting or pricing model [9]. In addition, a decentralized solution is required, as discussed in [10]. Moreover, incentive design in FL is underexplored [11]. Most federated methods provide only simple participation-based rewards. Quantifiable utility measures and reward allocation models are not provided.
To address data fragmentation, explainability, and misaligned incentives, SHAP-based model explainability is combined with blockchain-based coordination and incentive schemes. In this study, SHAP is used as a post-hoc model interpretation and compression method. It is not used as a predictive method. In current studies, FL or dynamic pricing is addressed separately. However, a unified approach that considers data fragmentation, model explainability, and incentive design is limited.
Formally, the main problem addressed in this study is the need for a deployable EV charging pricing mechanism. Three goals are required to be satisfied at the same time: (i) accurate forecasting of short-term EV loads, (ii) provable privacy guarantees, and (iii) auditable and explainable tariffs with enforceable incentives. Most existing approaches address only two of these goals. All three goals are not addressed together. Some methods are centralized or privacy-invasive. Explainability for regulators is not provided in some methods. User behavior toward grid-level objectives is not guided by other methods. QFedFormer is designed to address this gap. FL, SHAP-based explanation techniques, and blockchain technology are combined in the federated setting.
To this end, QFedFormer is proposed as a blockchain-enabled FL approach for EV charging environments. The main contributions are summarized as follows:
• SHAP-Pruned Federated Transformer: A lightweight Transformer-based forecasting model is developed for non-IID and distributed EV charging networks. SHAP-guided attention pruning is applied to improve post-hoc interpretability and edge efficiency.
• Privacy-Preserving Optimization: DP and post-pruning quantization are integrated to protect local model updates while practical utility is preserved.
• Smart Contract Pricing: A blockchain-based pricing engine is designed. Bounded real-time tariff updates are executed based on forecasted demand and user-declared flexibility.
• Utility-Linked Token Incentives: A programmable on-chain reward mechanism is developed. Tokens are issued according to a composite utility score.
• On-Chain Explainability and Auditability: Cryptographic commitments of SHAP-based explanation summaries are anchored on-chain through Merkle roots.
The rest of this paper is organized as follows. Related works in the area of FL, blockchain coordination, and EV charging are discussed in Section 2. The design of our proposed QFedFormer framework is explained in Section 3. These include local prediction, pruning through SHAP values, quantization, federated averaging, and smart contract enforcement. The experimental setting, data set details, and performance metrics are elaborated in Section 4. Experimental results are reported in Section 5. This section includes analysis based on accuracy, privacy, scalability, and incentive compliance behavior. The conclusion of this paper is drawn in Section 6.
2.1 FL for EV and Smart Grid Forecasting
The FL technology makes it possible to train models using EV charger, smart meter, and grid-edge device data without data transfer between users. It is appropriate for EV and smart grid forecasting tasks due to distributed, privacy-preserving, and non-IID nature of the data sets used.
It is claimed that current achievements in deep learning-based time series forecasting include excellent performance in capturing long-range dependencies in sequences with Transformer models. FedFormer and similar frequency Transformers reduce computational load while ensuring the precision of forecasting. These types of models can be used for energy demand prediction in a distributed manner.
A variety of traditional ML algorithms are explored to predict EV charging in smart grids. Algorithms like DNN, SVM, RF, and LSTM are applied for load forecasting and charging optimization. Demand estimates become more precise, and the grid becomes less vulnerable to power imbalance as a result. However, no focus is paid to privacy protection and decentralization [12]. A rising trend is noted in the application of FL and blockchain in the context of EV charging stations and smart grid systems. The focus areas include privacy, scalability, and distributed intelligence. The FL scheme incorporating blockchain technology has been suggested as Block-FeDL [13] by Danish et al. for load forecasting of EV charging stations. On the same platform of developing secure and decentralized forecasting models, Hameed et al. [14] proposed another model called Block-FeST, which employed sparse transformer models within the federated model. This work still lacks clarity in incentive alignment and model decision-making.
Other FL methods, including FedPT-V2G, an attention architecture proposed by Shang and Li [9], prove the efficacy of attention architectures in facilitating two-way learning in EV and grid realms. Nonetheless, these algorithms fail to provide techniques to ensure reward traceability, accountability, and feasible pricing implementation. You et al. [15] further extended FL into renewable energy resource contexts using FMGCN, a federated multi-graph convolutional network, to perform wind forecasting on non-IID nodes. Nonetheless, this framework is not developed to address EV demand-side flexibility and pricing-related decision-making. By incorporating Laplace noise into pricing decisions, Hassan et al. [16] proposed a DP demand-side management scheme in the field of data privacy. Although privacy is improved, the method lacks auditability, interpretability, and tokenized incentives.
2.2 Incentive Mechanisms and Learning-Based Pricing
Dynamic pricing in EV charging systems is used to adjust tariffs according to demand, grid constraints, user flexibility, and local operating conditions. However, many pricing methods remain centralized, require global data access, or lack transparent execution, which creates privacy and trust concerns.
Blockchain-based incentive mechanisms have also been explored to ensure transparent and verifiable reward allocation. Pricing regulations and incentivization enforcement are realized through smart contracts. Blockchain is used to ensure auditability and tamper-resistance of the incentive scheme. Incentives are essential for sustained participation in FL systems. Nevertheless, adequate research has not been conducted in the existing studies.
Incentives derived from dynamic pricing in FL have been explored by Ding et al. [17], considering the local cost sensitivity analysis. Nonetheless, the use of decentralized implementation and blockchain support has been excluded. Reward schemes for EV aggregators and user involvement have been designed using Stackelberg games by Chen et al. [18]. However, no provision for smart contract formulation has been considered. Other related works include dynamic pricing frameworks modeled by Zhang et al. [19] using DRL, accounting for the bounded rationality of consumers. Nevertheless, federated mechanisms have not been employed, along with blockchain-based incentive execution.
Additionally, dynamic pricing has been discussed in the literature concerning centralized ML and optimization algorithms [20]. Deep learning on graphs has been employed by Ruan et al. [21] to derive prices for retail electricity consumption under localized demands. Multi-objective optimization methods are proposed by Zhang et al. [22]. Consumer flexibility and price sensitivity are considered. These methods are applied in centralized settings, but privacy-preserving measures are not considered. Similarly, pricing mechanisms are developed by Tang et al. [23] using DRL models, with consideration of grid-based constraints. Regulatory compliance and realistic consumer behavior are examined by Wang et al. [24]. However, validation is limited to centralized settings, or federated predictions with contract-based incentive implementation are not incorporated.
2.3 Blockchain-Based Coordination and Auditability
Security threats in smart grid communication layers include spoofing, data injection, MITM, replay, and availability attacks. Confidentiality, integrity, and availability may be affected by these threats. Therefore, blockchain-based coordination is relevant for transaction records and for verifiable and tamper-resistant EV charging operations. This layer-wise threat characterization is aligned with recent smart grid security analyses. Cyberattacks are categorized across system and communication layers. Impacts on confidentiality, integrity, and availability are defined, and mitigation strategies are provided [25].
Solutions based on blockchain technology are proposed to support decentralized coordination in energy pricing. A blockchain-enabled zero-sum game-based pricing scheme is proposed by Kakkar et al. [26] for EV charging stations. Smart contracts and IPFS-based transaction storage are incorporated. Price fairness is improved, and coordination latency is reduced. However, federated demand forecasting and model-level explainability are not included.
A stochastic blockchain-based energy management model for smart cities is proposed by Zhang et al. [27]. V2G and V2S interactions under uncertainty are integrated. Stochastic behavior is captured by an unscented transformation method. Data exchange among energy subsystems is secured by blockchain. Effective coordination between transportation and grid components is demonstrated. However, centralized optimization is used, and federated learning or decentralized model training is not included. In addition, incentive mechanisms and audit-level interpretability of model decisions are not addressed. Applicability in privacy-sensitive and user-participatory environments is limited.
A blockchain-based dynamic energy pricing approach is introduced by Abadi et al. [28]. Machine-learning-based demand prediction is used to support supply-chain resilience. Although their model demonstrates the benefits of blockchain-assisted pricing execution, it operates in a centralized learning setting and does not address privacy-preserving knowledge acquisition, decentralized model coordination, or incentive traceability. To provide a structured view of these security challenges, Table 1 summarizes layer-wise attack types, their impact on confidentiality, integrity, and availability, and the corresponding mitigation mechanisms adopted in this work.

The table shows that mitigation strategies are aligned with each layer to reduce attack impact and preserve reliable pricing and coordination.
However, in this area of work, there are still several critical areas that are left untouched. First, in most existing work, demand forecasting and tariffs are decoupled in such a way that real-time tariffs are not properly and consistently enforced in real time. Second, without utility-aware scoring or traceable reward distribution, incentive mechanisms are usually static and rely on coarse participation-based rewards. Third, explainability is rarely integrated as a system-level component, and on-chain anchoring of model-derived decision evidence is still mostly unexplored, despite its growing recognition as crucial for user trust and regulatory oversight. This proposal integrates a privacy-preserving FL solution for decentralized data ownership, a utility-related token economic incentive for participant coordination, a smart contract-based pricing execution service for the enforcement of electricity costs in real-time, a SHAP-based model explanation and approximation service for the interpretability of predictions, and a blockchain-based auditability service for the verification of data integrity. When combined, these elements provide a unified and implementable solution for decentralized EV charging networks.
Table 2 summarizes the identified research gaps and maps them to the corresponding architectural and algorithmic design choices used in this work. The comparison shows that prior approaches address only isolated aspects of decentralized EV charging, such as forecasting, pricing, or blockchain coordination. In contrast, joint integration of FL, explainability, privacy preservation, incentive alignment, and executable smart contracts is achieved in a single deployable design.

3 System Architecture and Methodology
To enable secure, explainable, and scalable dynamic pricing in EV charging networks, we design a five-layer architecture (Fig. 1) centered on QFedFormer, a quantized and SHAP-pruned federated transformer for edge-level forecasting. The layers cover (i) data acquisition, (ii) local forecasting, (iii) federated aggregation with privacy, (iv) smart contract pricing, and (v) tokenized incentives with auditable explainability.

Figure 1: Overview of the QFedFormer architecture. The process follows a bottom-up sequence from local input collection to QFedFormer-based forecasting, SHAP-guided pruning, quantization, DP-protected aggregation, zk-SNARK verification, smart contract pricing, and Merkle-anchored auditability.
For clarity, Fig. 1 is interpreted as a sequential bottom-up process. First, EV charging, tariff, user, and environmental features are collected at each local node. Second, a local demand forecast is produced by QFedFormer. SHAP-guided pruning with quantization is applied to obtain a compressed local model. Third, DP noise is added before the compressed update is transmitted for federated aggregation. Fourth, zk-SNARK verification is used to check whether the submitted update follows the prescribed compression protocol. Fifth, the verified update is aggregated, and the predicted demand is transferred to the smart contract pricing layer. Sixth, the tariff and reward are computed by the smart contract. Merkle commitments of SHAP summaries are recorded on-chain for audit purposes. The step-wise interpretation is used to clarify the link between quantized local training and blockchain-anchored verification.
3.1 Data Acquisition and Preprocessing Layer
Each edge node
where
Charger availability
User flexibility
The EV charging dataset is collected from charging stations in Jiaxing, China. All tariff-related variables are linearly normalized and expressed in KRW/kWh. This representation is used only for interpretability of price deviations. It does not affect learning behavior or relative comparison across models. No exchange-rate-based economic conversion is applied. KRW is used only as a normalized reporting unit and does not represent actual local tariffs.
A sliding window of
3.2 QFedFormer: SHAP-Pruned Quantized Transformer Layer
Each node trains a local transformer regressor
The forecasting model is defined as an encoder–decoder Transformer adapted for time-series regression under non-IID edge data distributions.
FedFormer is selected because long-range temporal patterns are required to be captured with reduced computational cost. Quadratic complexity
Compared with Informer and Autoformer, higher suitability is observed for FedFormer in the EV charging data used in this study. Repeated daily tariff patterns, local demand peaks, and heterogeneous client behavior are contained in the data. A stable representation of trend and seasonal components is required under non-IID FL. Therefore, FedFormer is adopted as the forecasting backbone of QFedFormer. Long-horizon temporal modeling is supported, and computational burden at edge clients is reduced.
Quantization
To support resource-constrained edge devices and reduce communication overhead, model parameters are quantized to low-precision representations. Given a trained parameter tensor
Post-hoc Explainability.
Explainability is incorporated strictly as a post-hoc mechanism. The forecast
where
SHAP-Guided Attention Pruning
SHAP attributions are leveraged to guide structural pruning of the Transformer after local training. For each attention head
where
The set
For multi-head self-attention layers, relevance scores are computed independently per layer and per client, with attention contributions averaged across tokens within the local window. Attention heads whose relevance scores fall below a fixed threshold
Pruning is restricted to attention-head parameters only; all remaining model weights are preserved.
Attribution-based pruning is adopted to remove structurally weak components while predictive behavior is preserved. A consistent measure of feature contribution under model-agnostic conditions is provided by SHAP values. This property ensures that importance scores are comparable across clients with heterogeneous data distributions.
The use of SHAP is motivated by additive consistency and local accuracy. Each attribution value is defined as the marginal contribution of an input feature to the prediction outcome. Low-impact components are identified by this property without reliance on gradient magnitude or weight norm.
Attention-level mapping is applied to align feature attribution with the Transformer structure. Information from specific input dimensions is aggregated by attention heads. Therefore, the relevance of an attention head is estimated from the SHAP values of the features to which it attends.
This approach is suitable under non-IID FL settings. Local data distributions vary across clients, and gradient-based pruning may produce inconsistent patterns. SHAP-based scoring remains stable because it depends on prediction contribution rather than parameter scale.
As a result, pruning decisions are based on contribution to output rather than parameter magnitude. This property improves robustness and preserves the dominant predictive subspace across heterogeneous clients.
The computational overhead of SHAP evaluation is explicitly controlled to ensure feasibility on edge devices. SHAP values are computed on mini-batches instead of the full local dataset, which reduces computational cost. In addition, attribution is aggregated at the attention-head level rather than at the parameter level, which further limits complexity.
SHAP computation is executed after local training and is not required during real-time inference or tariff execution. Therefore, the additional cost does not affect latency-critical operations at charging stations. Feasibility of SHAP-based pruning and incentive evaluation is ensured under limited computational resources.
Compression Ordering
Explainability-driven pruning and quantization are applied in sequence to obtain the compressed local update:
Pruning is applied first to remove low-relevance attention heads. Uniform quantization is then applied to the remaining parameters.
This process is executed independently at each client after local training and before transmission. Client-specific sparsity patterns are produced to represent diverse demand profiles and operational contexts.
At each client, attention heads with relevance scores below the threshold
As a result, lightweight and interpretable subnetworks are produced at the edge by QFedFormer. Forecasting accuracy is preserved under non-IID data and limited computational resources.
3.3 Federated Aggregation and Privacy Preservation
Let
DP
Each local update follows a fixed sequence of operations. First, SHAP-based pruning and quantization are applied to obtain
Formally, the perturbed update is defined as:
where
The effect of noise on learning accuracy is controlled. A moderate increase in RMSE is observed due to perturbation. The increase is limited to approximately
The effect of DP on audit latency is also evaluated. Additional latency is introduced by the verification of perturbed updates and proof validation. This overhead remains bounded and is reported in the evaluation section. Separation between compression and noise addition ensures that DP is applied to the transmitted representation without change to the compression structure.
Only the perturbed updates
No SHAP attributions, raw features, forecasts, or explanation vectors are transmitted. Only compressed and perturbed model parameters are used for federated averaging.
Robustness to Malicious Updates
The aggregation process is designed to reduce the impact of malicious or corrupted client updates. Poisoning attacks are possible in federated settings when adversarial clients submit manipulated model updates to bias the global model or downstream pricing decisions.
Several design choices are used to mitigate this risk. First, stochastic perturbation is introduced by DP, and the influence of any single client update on the aggregated model is reduced. Second, compression through SHAP-based pruning and quantization limits the degrees of freedom for adversarial manipulation, as only structured and reduced representations are transmitted.
Third, zk-SNARK verification ensures that each submitted update follows the prescribed compression protocol. Invalid updates that do not satisfy pruning and quantization constraints are rejected at the smart contract level. Arbitrary or structurally inconsistent updates are prevented from entry into the aggregation process.
Full Byzantine robustness is not provided by these mechanisms. However, vulnerability to simple poisoning strategies is reduced, and consistency of client contributions is enforced. Robust aggregation rules and adversarial filtering are identified as directions for future extension.
Zero-Knowledge Proofs (ZKPs)
Each client generates zk-SNARKs
Smart contracts verify
The proofs attest only to the correct execution of the compression protocol and do not reveal model parameters, SHAP values, or client data, nor do they certify forecast optimality. To characterize the circuit structure and computational complexity, the zk-SNARK statement enforces that the client-transmitted update is the result of the prescribed local compression pipeline: (i) reshaping the trained model and masking attention heads whose SHAP relevance scores fall below the threshold
3.4 Smart Contract-Based Pricing Execution
Dynamic tariffs are computed by a blockchain-deployed contract consuming one-step-ahead demand forecasts
The pricing formulation is selected based on three design criteria: interpretability, bounded response, and deterministic execution under smart contract constraints. A linear structure is adopted. Each input variable is allowed to contribute in a transparent and monotone manner to the final tariff. Direct verification of pricing behavior is enabled. Ambiguity in decision rules is avoided.
The formulation is aligned with demand–supply balance in EV charging networks. The congestion term
Real-time pricing adaptation is achieved through one-step-ahead forecasts
User behavior is incorporated through the flexibility variable
Existing studies in EV charging pricing often rely on reinforcement learning or game-theoretic optimization. Pricing decisions are determined through iterative updates or equilibrium computation. Multiple interaction steps are required. Stable outcomes are not guaranteed under non-IID demand conditions. In contrast, a single-step deterministic output is produced by the proposed formulation. Suitability for real-time on-chain execution is ensured.
A bounded structure is required for safe deployment. Extreme values may be produced by adaptive pricing rules under demand spikes when explicit bounds are not applied. The clipping operator is used to enforce operational limits. Tariffs are ensured to remain within acceptable ranges.
The additive form is used to separate congestion, availability, and flexibility effects. Direct control of pricing sensitivity is enabled through parameters
The contract implements a single bounded tariff update rule:
where
Tariff safety limits are enforced by the clipping bounds
The stress score is defined as:
where
The tariff is monotone increasing in
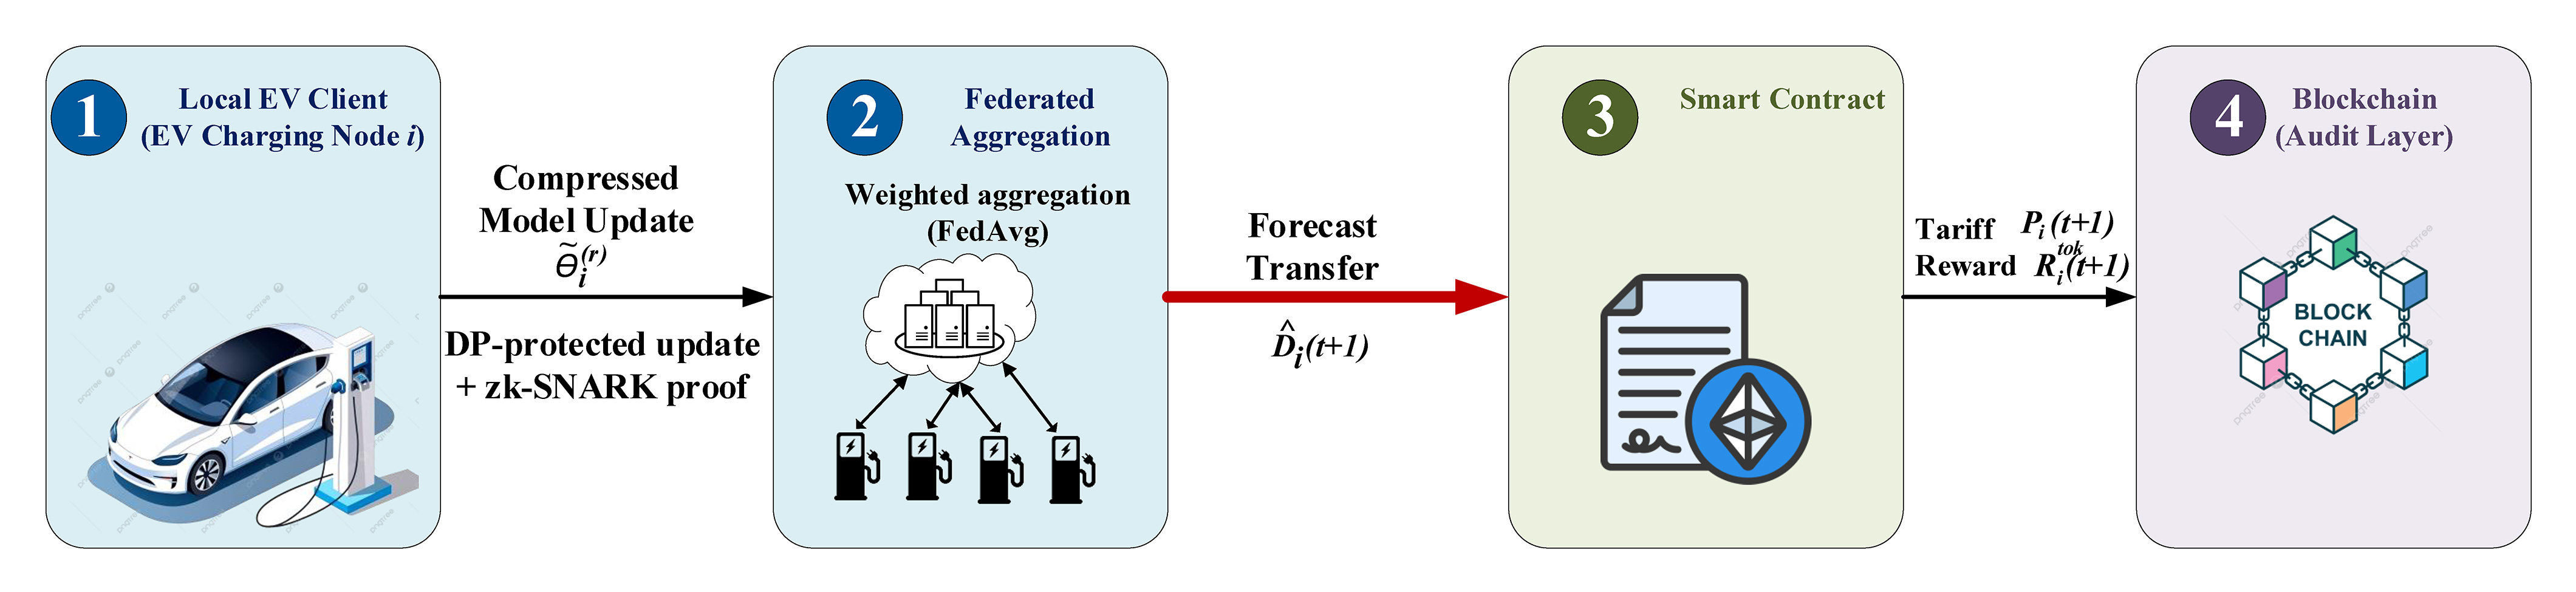
The operational transfer process from federated demand forecasting to smart-contract pricing and blockchain auditability is illustrated in Fig. 2.

Figure 2: Transfer architecture of QFedFormer from local EV charging nodes to federated aggregation, smart-contract pricing execution, and blockchain-based auditability.
Compared to reinforcement learning-based pricing, policy training or exploration is not required by the proposed rule. Non-stationary pricing outputs are produced by RL-based methods, and dependence on reward design is observed. Instability may be introduced by this dependence in decentralized environments. In contrast, consistent responses are produced for identical inputs by the present formulation.
Game-theoretic pricing models assume rational agents and equilibrium convergence. These assumptions are difficult to satisfy in EV charging scenarios with heterogeneous user behavior. Computational overhead is introduced by equilibrium computation, which is not compatible with real-time smart contract execution.
Auction-based mechanisms require iterative bidding and communication among participants. Latency and communication cost are increased under large-scale deployment. In contrast, only local inputs and one-step-ahead forecasts are required by the proposed pricing rule. Low computational cost and deterministic execution are ensured. Stable tariff updates are obtained without iterative optimization or multi-round interaction.
Parameter Calibration
Pricing parameters
Billing records are stored as signed tuples
3.5 Stability and Theoretical Considerations
Closed-Loop Stability
The proposed design operates in a receding-horizon manner. Demand forecasts
Effect of SHAP-Guided Pruning
Attention heads with consistently low attribution magnitude are removed by SHAP-guided pruning. All high-contribution pathways in the trained Transformer are preserved. Low-SHAP heads are assumed to correspond to redundant or weakly informative representations. The dominant predictive subspace of the model is preserved by pruning. The fixed point of the forecast–pricing interaction is unchanged up to a bounded approximation error. This behavior is validated in the evaluation section.
3.6 Tokenized Incentives and Auditability
Each user’s incentive utility is defined as a combination of flexibility, participation, and data quality:
The weights
where
where
Merkle roots of these hashes are published once per round. Tamper-evident auditability is ensured. Auditors can request proofs to verify explanations without access to raw data.
Blockchain-Anchored Incentive Design
The incentive mechanism is implemented through smart contract execution with deterministic pricing and reward allocation rules. On-chain functions are triggered at each audit round. Tariffs are computed, and rewards are distributed based on verified client contributions.
Incentive distribution is based on the utility score defined in Eq. (14). Flexibility, participation, and data quality are combined. Tokenization is used to represent rewards. Tokens are assigned to each client in proportion to its validated contribution under predefined bounds. Trust and transparency are ensured through on-chain execution and immutable storage of transaction records. Verifiable audit trails are provided by Merkle-root commitments of SHAP summaries without exposure of sensitive information.
Security and attack resistance are supported through multiple mechanisms. The influence of individual updates is limited by differential privacy. Correct execution of the local compression protocol is enforced by zk-SNARK verification. Invalid or inconsistent updates are prevented from affecting pricing and reward allocation by smart contract constraints. A transparent, verifiable, and secure incentive mechanism is ensured under decentralized EV charging environments.
Algorithm 1 summarizes the entire process. Local QFedFormer training with SHAP pruning and DP, Merkle anchoring, and token issuance are included.

4 Experimental Setup and Results
This section provides a structured description of the dataset, simulation environment, implementation details, evaluation metrics, and baseline models used for performance evaluation.
4.1 Data Preparation and Simulation Environment
For the performance evaluation of the proposed QFedFormer framework for decentralized dynamic pricing in EV charging networks, we implemented a high-fidelity simulation environment based on the real-world dataset from Jiaxing, China [30,31]. The dataset is used as a basis for simulation of non-IID FL across dispersed clients. Comprehensive EV charging activity from public charging stations is included.
For each charging session, start time, end time, charged energy (kWh), geographic coordinates, ToU pricing signals, station identifiers, service fees, and user behavior indicators such as interruptions and cancellations are provided [30,31]. A total of 24 structured features are included. Local meteorological variables are also included to capture exogenous effects on charging behavior. Demand-side heterogeneity, charging flexibility, and contextual dependencies are represented by this feature set. These factors are essential for accurate utility scoring and federated price forecasting.
A fixed ToU pricing schedule is included in the dataset to represent conventional pricing behavior. These rates are not used as fixed inputs. They are used as reference signals from which dynamic pricing patterns are derived. The regional ToU schedule, shown in Table 3, divides the day into seven temporal intervals. Prices range from off-peak values of 73.10 KRW/kWh to peak values of 232.84 KRW/kWh. These values are obtained through linear rescaling of the original tariff data to a KRW/kWh reporting range. No exchange-rate-based economic conversion is applied.

Real-world policy varies by season and by weekday or weekend. However, this representative structure is adopted based on the original dataset [30,31]. This choice supports the forecasting task and allows deviations and optimal pricing schemes to be identified under different demand conditions.
Daily weather conditions such as temperature, humidity, and precipitation are aligned with session timestamps and appended to each sample. These exogenous variables influence energy consumption and user preferences. More robust and context-aware model training is achieved.
For the federated simulation, the data is split among the 100 clients, each of which simulates a different charging point or geographic area. This division is done in a way that a non-IID data distribution is ensured for each client. This is done by retaining the local charging patterns, as well as weather and demographic influences, for each client. This closely represents the current EV infrastructure setup, which is quite different for each charging point, thereby presenting a challenge for FL’s dynamic pricing.
QFedFormer is implemented in PyTorch v2.1 with TensorFlow Federated for training orchestration and SHAP v0.42 for attribution-based pruning. Smart contracts and token mechanisms are implemented in Solidity v0.8 and deployed on a Hyperledger Besu PoA blockchain emulator.
Each client trains a transformer model with 2 encoder layers, 4 attention heads, and 128-dimensional hidden states. SHAP pruning and 8-bit affine quantization are applied prior to transmission. DP is enforced with parameters
Detailed hardware configuration, communication cost formulation, and blockchain cost modeling are provided in Appendix A.
Training is performed for
The weighting parameters
Blockchain performance is evaluated using a PoA-based emulator. Audit latency and transaction throughput are measured under controlled load conditions. Detailed cost formulation and gas modeling are provided in Appendix A.
QFedFormer is assessed across five dimensions that match its design goals: predictive accuracy, privacy, auditability, fairness, and client-level benefit.
Predictive performance is measured by root mean square error (RMSE) and mean absolute error (MAE):
where
Client-level privacy is measured by the cumulative DP budget
Audit latency is defined as the average verification time for blockchain-anchored model updates and SHAP attributions. Validation is performed through Merkle tree proofs and zero-knowledge checks.
Incentive equity is assessed by the Gini coefficient over token balances:
where
An evaluation-oriented utility score is defined as
where
4.3.6 Grid-Level Pricing Impact
In addition to predictive accuracy, four complementary metrics are used to assess the effect of the pricing mechanism on grid-level objectives. The relative decrease in maximum aggregate demand is used as a measure of peak reduction:
Load smoothness is measured by the decrease in demand variance over time:
Price volatility is assessed by the total variation of the tariff trajectory:
which captures price changes across time intervals. User welfare is approximated by the average charging cost per session:
which reflects the economic effect of dynamic pricing on end users.
These metrics provide a multidimensional evaluation of QFedFormer. Accuracy, privacy, transparency, fairness, incentive alignment, and grid-level operational impact are assessed jointly.
QFedFormer is evaluated against representative baselines from non-learning methods, standard FL, and blockchain-enhanced approaches. Static Pricing uses a fixed normalized tariff level within the KRW/kWh reporting range for nonadaptive comparison. FedAvg [32] and FedAvg+DP are used as standard FL baselines. In FedAvg+DP, Gaussian noise is added to achieve
In this section, prediction accuracy, privacy preservation, incentive mechanism effectiveness, scalability, communication overhead, and comparative performance against baseline methods are analyzed.
All reported results are based on mean values over 15 independent runs. Variability is reported as standard deviation or is indicated by error bars in the figures.
5.1 Forecast Accuracy vs. Model Efficiency
The effect of model compression on inference efficiency and forecast accuracy is evaluated. The QFedFormer model is tested under three quantization levels: full-precision (32-bit), 8-bit, and 4-bit. A trade-off frontier is shown in Fig. 3. Each point is associated with a quantization level and its corresponding RMSE value.

Figure 3: Trade-off frontier between forecast accuracy and latency across quantized models. Each point represents the mean over 15 independent runs. Variability across runs remains within
Fig. 3 shows that 8-bit quantization is the most favorable operating point. Latency is reduced from 110 to 75 ms, while RMSE is increased from
The 4-bit case shows different behavior. Latency is further reduced, but RMSE is increased to 2.31 kWh. This result indicates that useful temporal information is removed by excessive compression. Therefore, 8-bit quantization is selected as the practical setting because forecast quality is preserved and edge inference cost is reduced.
Table 4 provides a quantitative comparison of forecasting accuracy under different quantization levels. RMSE and MAPE are reported to evaluate the effect of model compression on prediction quality.

RMSE is increased from
To isolate the effect of SHAP-guided structural pruning from quantization, the quantization level is fixed at 8-bit, and the privacy budget is fixed at

Figure 4: Privacy–utility trade-off curve showing RMSE and audit latency across privacy levels. Points represent mean values over 15 independent runs.
As
Under this setting, approximately
5.2 SHAP Faithfulness and Audit Stability
A feature-deletion test is used to assess the faithfulness of SHAP explanations. Input features are removed progressively in descending order of absolute SHAP attribution. The resulting degradation in forecasting accuracy is recorded. A steeper error increase is interpreted as higher explanation faithfulness.
Across clients, RMSE is increased by
Explanation stability is assessed by the Spearman rank correlation of SHAP feature importance across consecutive training rounds. An average rank correlation above
This stability is required for on-chain anchoring. It ensures that SHAP hashes reflect persistent model behavior rather than transient training noise.
Table 5 shows the role of each component in the proposed method. When SHAP-guided pruning is replaced with random pruning at the same sparsity ratio, RMSE increases from 1.82 to 1.91 kWh. This result indicates that attribution-based head selection preserves more useful temporal representations than random removal.

The no-DP case improves RMSE to 1.75 kWh, but the privacy guarantee is removed. This result confirms the expected privacy–utility trade-off. The Fed-only case maintains similar forecast accuracy, but audit latency and token fairness are not available. This result shows that blockchain mainly contributes to auditability and incentive traceability rather than direct forecast improvement.
5.4 Privacy–Utility Trade-Off under DP
DP in QFedFormer provides the guarantee that client updates are computationally indistinguishable. Although DP helps to alleviate concerns regarding data leakage, it increases the Gaussian noise involved in learning and may have an impact on prediction accuracy as well as blockchain auditing latency.
To measure the strength of this privacy-accuracy trade-off, the privacy budget
As shown in Fig. 5, decreasing

Figure 5: Privacy–utility trade-off curve: RMSE vs. audit latency, annotated by privacy budget
At the calibrated deployment point
Fig. 5 indicates that the selected value
This analysis provides a sensitivity characterization of the privacy budget. Small changes in
5.5 Token Incentives and Auditability Performance
Fig. 6 evaluates whether the incentive and audit mechanisms remain practical under the selected privacy setting. Three outcomes are analyzed: reward concentration, verification latency, and cumulative token share. These outcomes indicate whether token allocation is useful, auditable, and sufficiently balanced across clients.

Figure 6: Evaluation of token incentives and auditability. Quantitative values are computed over 15 independent runs where applicable.
Fig. 6a shows token allocation to 100 users based on the utility score defined in Eq. (14). More than 55% of the total tokens is assigned to the top 10 users, based on mean values across runs. A Gini index of 0.42 indicates a moderate level of inequality. This result shows that reward allocation follows the contribution pattern. However, concentration among top users is observed. A control mechanism is therefore required. A cap on accumulation or an adaptive rebalancing rule can be applied to improve fairness.
Accuracy measures in demand forecasting are reported under no-DP conditions (
A comparative summary of token fairness, measured by the Gini coefficient, and on-chain audit latency for all baseline methods is presented in Table 6. A reference for incentive concentration and audit latency is provided.

Fig. 6b shows the decomposition of average audit latency across three blockchain verification stages: SHA-256 commitment, Merkle proof generation, and smart contract verification. A total latency of approximately 58 ms per round is observed at the deployed privacy level (
The cumulative token distribution for each client rank is shown in Fig. 6c. A linear trend is observed. This result indicates that a minority fraction of clients receives a large share of the tokens. This observation is consistent with Fig. 6a.
These results support the viability of tokenized incentives as a participation motivator and a transparency mechanism. Merkle-root-based audit logs and on-chain verification enable tamper-evident tracking of model contributions and support regulatory alignment. To mitigate risks such as reward manipulation or Sybil attacks, additional mechanisms can be applied in future work. Examples include client rate limiting, stake-based participation, and privacy-preserving identity attestation. These mechanisms complement the zk-SNARK-based protocol verification mechanism.
5.6 Comparative Evaluation with Baseline Models
QFedFormer is compared with Static Pricing, FedAvg, FedAvg+DP, Block-FeDL, FedPT-V2G, FedProx, SCAFFOLD, and FedFormer. These baselines are selected to isolate the effects of standard FL, DP, blockchain support, client drift control, and Transformer-based forecasting. The comparison is used to determine whether the observed gains are attributed to individual components or to the combined design.
To isolate the contribution of the proposed architecture, FedAvg without enhancement is used as a reference baseline. The effects of Transformer-based forecasting, SHAP-guided pruning, and incentive-aware aggregation beyond standard federated averaging are identified.
Compared with FedAvg, a substantial reduction in prediction error is achieved by QFedFormer. This result indicates that the improvement is not attributed to federated learning alone but is achieved by the combined architectural design. The contribution of each component beyond the baseline FL setting is clarified.
To ensure a fair comparison, all models are evaluated under identical data splits, client partitions, training rounds, and optimization settings. The same random seeds and evaluation metrics are used across all methods. Hyperparameters are selected through a consistent grid search space where applicable. Performance differences are therefore attributed to model design rather than experimental bias.
Fig. 7a reports RMSE, and Fig. 7b reports MAE across all models. Paired tests are applied across identical random seeds to ensure fair evaluation. Bars represent mean values over 15 independent runs, and error bars denote one standard deviation. The lowest error is achieved by QFedFormer in both metrics, with a mean RMSE of

Figure 7: Forecast accuracy across baseline models. Bars represent mean values over 15 independent runs, and error bars denote
Statistical significance is evaluated with a paired
Privacy is improved by FedAvg+DP, but accuracy is reduced. This result confirms the expected privacy–utility trade-off. Training consistency is improved by Block-FeDL, but interpretability and personalization are not provided.
Table 6 reports audit latency and token fairness. An audit latency of
5.7 Price-Level Accuracy (Tariff Deviation)
In addition to demand RMSE, accuracy is evaluated in tariff terms (Table 7). Tariff prediction errors are computed on normalized price trajectories. These trajectories are mapped to KRW/kWh through a fixed linear scaling factor for reporting. RMSE and MAPE values reflect relative pricing accuracy rather than absolute currency variation associated with a specific regional tariff scheme.

The best performance is achieved by QFedFormer, with an RMSE of 11.83 KRW/kWh and a MAPE of 2.7%. Improvements of 3.2% in RMSE and 15.6% in MAPE are obtained over FedFormer (12.22 KRW/kWh and 3.2%). FedAvg yields 13.78 KRW/kWh and 4.9%, and further degradation is observed for FedAvg+DP with 14.69 KRW/kWh and 5.4%.
5.8 Pricing Calibration Sensitivity and Grid-Level Impact
In addition to tariff prediction accuracy, the effect of the smart contract pricing mechanism on grid-level objectives is evaluated under variation of key pricing parameters. A one-at-a-time sensitivity analysis is performed on the coefficients
For each configuration, peak demand reduction, load variance, price volatility, and average user charging cost are evaluated. Peak demand is defined as the maximum aggregated load per interval. Load smoothness is measured by demand variance. Price volatility is computed by the total variation of the executed tariff sequence. User welfare is approximated by the average cost per charging session.
Across all tested settings, peak demand is reduced by
Price volatility is maintained within bounds due to the clipping constraints in Eq. (12). The total variation is increased by less than
5.9 Cross-Site Generalization and Policy Transferability
To evaluate robustness beyond a single geographic deployment, two stress tests are conducted: (i) cross-site data heterogeneity and (ii) regional pricing-policy variation.
Leave-One-Station-Out (LOSO) Generalization.
A leave-one-station-out evaluation is conducted, where all data from one charging station are excluded during federated training and used only for testing. This setup represents unseen charging infrastructure, user behavior, and local demand conditions.
On average across unseen splits, QFedFormer shows an increase in RMSE of 6.1% compared to the standard federated split. The degradation remains below 10% in most folds. This result indicates that the learned feature representations capture transferable temporal patterns rather than station-specific characteristics.
Pricing Policy Shift Stress Test
To evaluate robustness under regional tariff variation, the original time-of-use tariff is replaced by a modified tariff with shifted peak hours and an increased peak-to-off-peak price ratio. The forecasting model and pricing parameters remain fixed.
Under this condition, peak demand is reduced by 6.2%, and demand variance changes by 9.8% relative to static tariffs. Price variability remains bounded due to the clipping constraints in the pricing function. This result confirms that the pricing mechanism maintains stable responses under moderate policy shifts.
Altogether, these results indicate that the proposed method maintains controlled degradation under unseen data and policy variations.
Generalization across Deployment Conditions
The reported experiments use a real-world dataset from Jiaxing, China. Generalization is supported by the federated setting, where non-IID behavior across clients with heterogeneous demand profiles and user participation is captured.
Temporal structures such as daily periodicity, peak demand intervals, and demand fluctuations are used by the forecasting model. These patterns are common in EV charging scenarios across regions. Therefore, transfer of the learned representations to similar deployment conditions is expected.
Normalization and relative feature scaling are applied to reduce dependence on region-specific units and price levels. Robustness under cross-region variation is improved by this design.
In markets such as Europe or North America, differences in charging behavior and regulatory structures are observed due to variations in tariff design, grid constraints, and incentive policies. Forecasting, pricing, and incentive components are separated in the proposed method. Adaptation to different regulatory settings is enabled without modification of the model structure.
Tariff parameters, clipping bounds, and incentive weights are adjusted to reflect local pricing rules and participation schemes. The learning component is data-driven and region-specific demand patterns are captured through federated updates.
Therefore, performance is expected to be maintained under different market conditions when local data and policy parameters are incorporated. Empirical validation across multiple geographic datasets is not included and is considered as future work.
5.10 Smart Contract Execution and Scalability Limitations
Smart contract performance is evaluated under varying client loads by use of a Hyperledger Besu PoA blockchain emulator. An Ethereum-compatible execution model is followed. Transaction latency, throughput, and gas costs are assessed.
All reported latency, throughput, and gas cost values correspond to mean measurements obtained from repeated executions under identical load conditions.
Throughput is reported in transactions per minute (tx/min). Each participating client submits exactly one transaction per audit round. The number of clients per round corresponds one-to-one with the number of on-chain transactions generated in that round.
As shown in Fig. 8a, latency is increased from approximately 17 ms (25 clients or 25 tx per round) to 72 ms (500 clients or 500 tx per round) due to on-chain queuing. Throughput reaches a plateau and is reduced under high load. A decrease from approximately 480 to 270 tx/min is observed under block gas constraints, as shown in Fig. 8b.


Figure 8: Smart contract scalability analysis under a one-transaction-per-client execution model on a permissioned Ethereum PoA testbed. Reported values correspond to mean measurements over repeated runs. (a) Average on-chain transaction latency vs. number of participating clients (one transaction per client per audit round). (b) Throughput degradation measured in transactions per minute (tx/min) under increasing client load. (c) Gas usage growth vs. number of clients (total gas consumption per audit round aggregated across all client transactions).
Each contract function, including token issuance, Merkle proof submission, and SHAP anchoring, is associated with a predictable cost, as summarized in Table 8. A full audit cycle requires approximately 78,000 gas. This value corresponds to approximately

From a deployment perspective, several practical blockchain constraints are identified. The PoA-based testbed provides low latency and stable gas cost behavior compared with public blockchain networks. Block confirmation is deterministic and is controlled by validators in PoA networks. Latency variability is reduced. Gas price variation is limited, and cost predictability for repeated audit operations is improved. However, trusted validator nodes are required, and direct transfer to fully public networks is not ensured.
The block gas limit imposes an upper bound on the number of transactions per audit round. Under high client participation, transaction queuing is introduced, and confirmation delay is increased. Contract state growth introduces storage overhead, which may affect long-term scalability. Under large-scale deployment with thousands of charging stations, simultaneous submission of Merkle proofs increases transaction queuing. Higher confirmation latency and reduced throughput are observed.
These limitations are consistent with findings in high-power EV charging infrastructure, where megawatt-scale charging imposes grid capacity constraints and peak demand stress. Large-scale deployment is restricted [33]. The number of on-chain transactions is reduced by batching client commitments into a single Merkle root per round. These effects are mitigated.
For national-scale deployment, Layer-2 rollups, sharded architectures, or off-chain archival are considered. On-chain transaction load is reduced by rollup-based aggregation through batching of client updates. Transaction processing is distributed across parallel chains by sharding. Scalability is improved, and latency is reduced for large-scale deployment.
Under the one-transaction-per-client model, throughput exceeding 500 tx/min is sustained by the permissioned Ethereum PoA testbed (3 s block time, 25M gas limit). Latency and gas constraints are not violated, which confirms feasibility for regional-scale deployment. Although QFedFormer integrates ZKPs for audit compliance, proof generation and verification costs are not benchmarked and are considered as future work.
5.11 Practical Implications for Regulators and Service Providers
The proposed FL–blockchain approach provides benefits for privacy compliance, auditability, and incentive alignment in decentralized EV energy contexts. User data are kept local, and updates are verified with ZKPs. Compliance with GDPR and related standards is supported, and data sovereignty is preserved. SHA-256 Merkle commitments and SHAP-based explanations are recorded on-chain each round. Tamper-proof and interpretable audit trails are enabled with approximately
For service providers, sustained and fairness-aware participation is promoted by the token incentive mechanism (Gini coefficient
Scalability evaluations confirm feasibility for urban charging or microgrid deployment. Throughput of approximately
The reported approximately
Overall, a privacy-compliant and auditable participation model is provided for regulators, and a transparent and scalable deployment path is provided for service providers.
5.12 Limitations and Future Work
While our federated blockchain-enabled framework shows strong potential, several challenges remain. Scalability declines beyond
Although the base EV charging dataset is taken from a single metropolitan area, namely Jiaxing, China, we alleviate geographic over-fitting concerns by at least two representations: One on cross-sites and another on policy levels. Particularly, we have performed a leave-one-station-out generalization test and pricing-policy shift stress experiments as stated in Section 5.9. The results show that the forecasting performance at both the station and aggregated grid levels is relatively stable under unseen charging stations and/or perturbed tariff regimes. It means that the proposed framework learns transferable demand and flexibility patterns instead of city-specific artifacts.
Real-world deployment will demand pilot trials with utilities to test reliability, regulation, and user engagement, as well as interoperability with OCPP-compliant billing platforms via API bridges or hybrid on/off-chain synchronization. Finally, extending beyond the current unidirectional grid-to-vehicle assumption to bidirectional V2G scenarios will require modeling discharge dynamics, bidirectional incentives, and battery health impacts.
We presented QFedFormer, a privacy-preserving, blockchain-anchored FL framework for dynamic EV charging price forecasting, combining transformer-based modeling, SHAP-guided pruning, quantization-aware training, and calibrated DP. On a real-world ToU dataset, QFedFormer achieved an energy-demand RMSE of
Acknowledgement: This research was supported by the “Regional Innovation System & Education (RISE)” through the Seoul RISE Center, funded by the Ministry of Education (MOE) and the Seoul Metropolitan Government (2026-RISE-01-019-04)
Funding Statement: This research was supported by the “Regional Innovation System & Education (RISE)” through the Seoul RISE Center, funded by the Ministry of Education (MOE) and the Seoul Metropolitan Government (2026-RISE-01-019-04).
Author Contributions: The authors confirm contribution to the paper as follows: Conceptualization, Lilia Tightiz and Hyosik Yang; methodology, Lilia Tightiz; software, Lilia Tightiz; validation, Lilia Tightiz, L. Minh Dang and Hyosik Yang; formal analysis, Lilia Tightiz; investigation, Lilia Tightiz; resources, Hyosik Yang; data curation, Lilia Tightiz and L. Minh Dang; writing—original draft preparation, Lilia Tightiz; writing—review and editing, Lilia Tightiz, L. Minh Dang, and Hyosik Yang; visualization, Lilia Tightiz; supervision, Hyosik Yang; project administration, Hyosik Yang; funding acquisition, Hyosik Yang. All authors reviewed and approved the final version of the manuscript.
Availability of Data and Materials: The data that support the findings of this study are available from the corresponding author, Hyosik Yang upon reasonable request.
Ethics Approval: Not applicable.
Conflicts of Interest: The authors declare no conflicts of interest.
Appendix A Implementation Details and System Configuration
Appendix A.1 Hardware and Execution Environment:
The experimental setup consists of one server and ten GPU-backed virtual machines. Each machine is equipped with NVIDIA A100 (40 GB) GPUs on Google Cloud A2-HighGPU instances. A total of 100 logical clients are simulated with 10 clients per machine under non-IID data distribution.
Appendix A.2 Communication Cost Formulation:
Communication overhead per round is approximated as
bytes per client per FL round, where
Appendix A.3 Blockchain Cost and Latency:
Blockchain execution is evaluated using a Hyperledger Besu PoA emulator. The transaction cost is computed as
where
Appendix A.4 Parameter Selection and Sensitivity Analysis:
The weighting parameters are selected from the candidate set
Sensitivity analysis is performed by perturbing each parameter by
References
1. Singh AR, Vishnuram P, Alagarsamy S, Bajaj M, Blazek V, Damaj I, et al. Electric vehicle charging technologies, infrastructure expansion, grid integration strategies, and their role in promoting sustainable e-mobility. Alex Eng J. 2024;105(1):300–30. doi:10.1016/j.aej.2024.06.093. [Google Scholar] [CrossRef]
2. Kermansaravi A, Refaat SS, Trabelsi M, Vahedi H. AI-based energy management strategies for electric vehicles: challenges and future directions. Energy Rep. 2025;13(1):5535–50. doi:10.1016/j.egyr.2025.04.053. [Google Scholar] [CrossRef]
3. Tightiz L, Dang LM, Yoo J, Padmanaban S. A comprehensive review on AIoT applications for intelligent EV charging/discharging ecosystem. Energy Convers Manag X. 2025;27(12):101088. doi:10.1016/j.ecmx.2025.101088. [Google Scholar] [CrossRef]
4. Narasipuram RP, Pasha MM, Tabassum S, Tandon AS. The electric vehicle surge: effective solutions for charging challenges with advanced converter technologies. Energy. 2025;122(2):431–69. doi:10.32604/ee.2025.055134. [Google Scholar] [CrossRef]
5. Solis WV, Parra-Ullauri MJ, Kertesz A. Exploring the synergy of fog computing, blockchain, and federated learning for IoT applications: a systematic literature review. IEEE Access. 2024;12(1):68015–60. doi:10.1109/ACCESS.2024.3398034. [Google Scholar] [CrossRef]
6. Tightiz L, Dang LM, Padmanaban S, Hur K. Metaverse-driven smart grid architecture. Energy Rep. 2024;12(2):2014–25. doi:10.1016/j.egyr.2024.08.027. [Google Scholar] [CrossRef]
7. Ma X, Zhu J, Lin Z, Chen S, Qin Y. A state-of-the-art survey on solving non-IID data in federated learning. Future Gener Comput Syst. 2022;135(3):244–58. doi:10.1016/j.future.2022.05.003. [Google Scholar] [CrossRef]
8. Mohammed A, Saif O, Abo-Adma M, Fahmy A, Elazab R. Strategies and sustainability in fast charging station deployment for electric vehicles. Sci Rep. 2024;14(1):283. doi:10.1038/s41598-023-50825-7. [Google Scholar] [PubMed] [CrossRef]
9. Shang Y, Li S. FedPT-V2G: security enhanced federated transformer learning for real-time V2G dispatch with non-IID data. Appl Energy. 2024;358(9):122626. doi:10.1016/j.apenergy.2024.122626. [Google Scholar] [CrossRef]
10. Yao H, Xiang Y, Gu C, Liu J. Optimal planning of distribution systems and charging stations considering PV-Grid-EV transactions. IEEE Trans Smart Grid. 2025;16(1):691–703. doi:10.1109/tsg.2024.3429371. [Google Scholar] [CrossRef]
11. Tariq A, Serhani MA, Sallabi FM, Barka ES, Qayyum T, Khater HM, et al. Trustworthy federated learning: a comprehensive review, architecture, key challenges, and future research prospects. IEEE Open J Commun Soc. 2024;5:4920–98. doi:10.1109/OJCOMS.2024.3438264. [Google Scholar] [CrossRef]
12. Mazhar T, Asif RN, Malik MA, Nadeem MA, Haq I, Iqbal M, et al. Electric vehicle charging system in the smart grid using different machine learning methods. Sustainability. 2023;15(3):2603. doi:10.3390/su15032603. [Google Scholar] [CrossRef]
13. Danish SM, Hameed A, Ranjha A, Srivastava G, Zhang K. Block-FeDL: electric vehicle charging load forecasting using federated learning and Blockchain. IEEE Trans Veh Technol. 2025;74(2):2048–56. doi:10.1109/TVT.2024.3406946. [Google Scholar] [CrossRef]
14. Hameed A, Danish MS, Ranjha A, Srivastava G. Block-FeST: blockchain-enhanced federated sparse transformers for privacy-preserving RES forecasting in internet of vehicles systems. IEEE Internet Things J. 2025;12(14):27510–8. doi:10.1109/JIOT.2025.3564526. [Google Scholar] [CrossRef]
15. You L, Chen Q, Qu H, Zhu R, Yan J, Santi P, et al. FMGCN: federated meta learning-augmented graph convolutional network for EV charging demand forecasting. IEEE Internet Things J. 2024;11(14):24452–66. doi:10.1109/JIOT.2024.3369655. [Google Scholar] [CrossRef]
16. Hassan MU, Rehmani MH, Du JT, Chen J. Differentially private demand side management for Incentivized dynamic pricing in smart grid. IEEE Trans Knowl Data Eng. 2023;35(6):5724–37. doi:10.1109/TKDE.2022.3157472. [Google Scholar] [CrossRef]
17. Ding N, Gao L, Huang J. Incentive mechanism design for federated learning with dynamic network pricing. IEEE Trans Mob Comput. 2025;24(8):7206–22. doi:10.1109/TMC.2025.3546977. [Google Scholar] [CrossRef]
18. Chen Y, Hu S, Xie S, Zheng Y, Hu Q, Yang Q. Optimal dynamic pricing of fast charging stations considering bounded Rationality of users and market regulation. IEEE Trans Smart Grid. 2024;15(4):3950–65. doi:10.1109/TSG.2024.3363040. [Google Scholar] [CrossRef]
19. Zhang Z, Chen Z, Gümrükcü E, Ji Z, Ponci F, Monti A. Advancing urban electric vehicle charging stations: AI-driven day-ahead optimization of pricing and Nudge strategies utilizing multi-agent deep reinforcement learning. eTransportation. 2024;22(2):100352. doi:10.1016/j.etran.2024.100352. [Google Scholar] [CrossRef]
20. Hao CH, Wesseh PK Jr, Wang J, Abudu H, Dogah KE, Okorie DI, et al. Dynamic pricing in consumer-centric electricity markets: a systematic review and thematic analysis. Energy Strategy Rev. 2024;52(9):101349. doi:10.1016/j.esr.2024.101349. [Google Scholar] [CrossRef]
21. Ruan J, Liang G, Zhao J, Lei S, He B, Qiu J, et al. Graph deep-learning-based retail dynamic pricing for demand response. IEEE Trans Smart Grid. 2023;14(6):4385–97. doi:10.1109/TSG.2023.3258605. [Google Scholar] [CrossRef]
22. Zhang D, Zhu H, Zhang H, Goh HH, Liu H, Wu T. Multi-objective optimization for smart integrated energy system considering demand responses and dynamic prices. IEEE Trans Smart Grid. 2022;13(2):1100–12. doi:10.1109/TSG.2021.3128547. [Google Scholar] [CrossRef]
23. Tang C, Qin Y, Wu F, Tang Z. Dynamic demand-aware power grid intelligent pricing algorithm based on deep reinforcement learning. IEEE Access. 2024;12:75809–17. doi:10.1109/ACCESS.2024.3406338. [Google Scholar] [CrossRef]
24. Wang C, Ma S, Cai Z, Yan N, Wang Q. Bounded rational real-time charging pricing strategy under the traffic-grid coupling network. IET Electr Syst Transp. 2022;12(4):251–68. doi:10.1049/els2.12050. [Google Scholar] [CrossRef]
25. Mazhar T, Irfan HM, Khan S, Haq I, Ullah I, Iqbal M, et al. Analysis of cyber security attacks and its solutions for the smart grid using machine learning and Blockchain methods. Future Internet. 2023;15(2):83. doi:10.3390/fi15020083. [Google Scholar] [CrossRef]
26. Kakkar R, Agrawal S, Gupta R, Tanwar S. Blockchain and zero-sum game-based dynamic pricing scheme for electric vehicle charging. In: Proceedings of the IEEE INFOCOM 2022—IEEE Conference on Computer Communications Workshops (INFOCOM WKSHPS); 2022 May 2–5; New York, NY, USA. p. 1–6. doi:10.1109/INFOCOMWKSHPS54753.2022.9797894. [Google Scholar] [CrossRef]
27. Zhang L, Cheng L, Alsokhiry F, Mohamed MA. A novel stochastic Blockchain-based energy management in smart cities using V2S and V2G. IEEE Trans Intell Transp Syst. 2023;24(1):915–22. doi:10.1109/TITS.2022.3143146. [Google Scholar] [CrossRef]
28. Abadi MQH, Sadeghi R, Hajian A, Shahvari O, Ghasemi A. A blockchain-based dynamic energy pricing model for supply chain resiliency using machine learning. Supply Chain Anal. 2024;6(3):100066. doi:10.1016/j.sca.2024.100066. [Google Scholar] [CrossRef]
29. Mironov I. Rényi differential privacy. In: Proceedings of the 2017 IEEE 30th Computer Security Foundations Symposium (CSF); 2017 Aug 21–25; Santa Barbara, CA. p. 263–75. doi:10.1109/CSF.2017.11. [Google Scholar] [CrossRef]
30. Zhang Y, Xu T, Chen T, Hu Q, Chen H, Hu X, et al. A high-resolution electric vehicle charging transaction dataset with multidimensional features in China. London, UK: Figshare; 2025. doi: 10.6084/m9.figshare.28182251. [Google Scholar] [CrossRef]
31. Zhang Y, Xu T, Chen T, Hu Q, Chen H, Hu X, et al. A high-resolution electric vehicle charging transaction dataset with multidimensional features in China. Sci Data. 2025;12(1):643. doi:10.1038/s41597-025-04982-1. [Google Scholar] [PubMed] [CrossRef]
32. McMahan B, Moore E, Ramage D, Hampson S, BAy A. Communication-efficient learning of deep networks from decentralized data. In: Proceedings of the 20th International Conference Artificial Intelligence Statistics (AISTATS); 2017 Apr 20–22; Fort Lauderdale, FL, USA, vol. 54. p. 1273–82. doi:10.48550/arXiv.1602.05629. [Google Scholar] [CrossRef]
33. Narasipuram RP, Hosseinpour A. Megawatt charging system for electric vehicles: design requirements and deployment challenges. Energy Convers Manag X. 2026;30(3):101761. doi:10.1016/j.ecmx.2026.101761. [Google Scholar] [CrossRef]
Cite This Article
 Copyright © 2026 The Author(s). Published by Tech Science Press.
This work is licensed under a Creative Commons Attribution 4.0 International License , which permits unrestricted use, distribution, and reproduction in any medium, provided the original work is properly cited.
 Downloads
 Citation Tools