
 Submit a Paper
 Propose a Special lssue
 Open Access
ARTICLE

Frequency-Selective Transmission Control of Ultrasonic Guided Waves in T-Shaped Pipes Using Acoustic Metamaterials: Computer Modeling and Experimental Validation
1 School of Mechanical and Automotive Engineering, South China University of Technology, Guangzhou, China
2 Department of Electromechanical Engineering and Center of Artificial Intelligence and Robotics, University of Macau, Macau, China
* Corresponding Author: Xiaobin Hong. Email:
(This article belongs to the Special Issue: Intelligent Dynamics Modeling, Predictive Operations & Maintenance, and Control Optimization for Complex Systems)
Computer Modeling in Engineering & Sciences 2026, 147(3), 15 https://doi.org/10.32604/cmes.2026.082376
Received 15 March 2026; Accepted 31 May 2026; Issue published 30 June 2026
 View Full Text
 Download PDF
Abstract
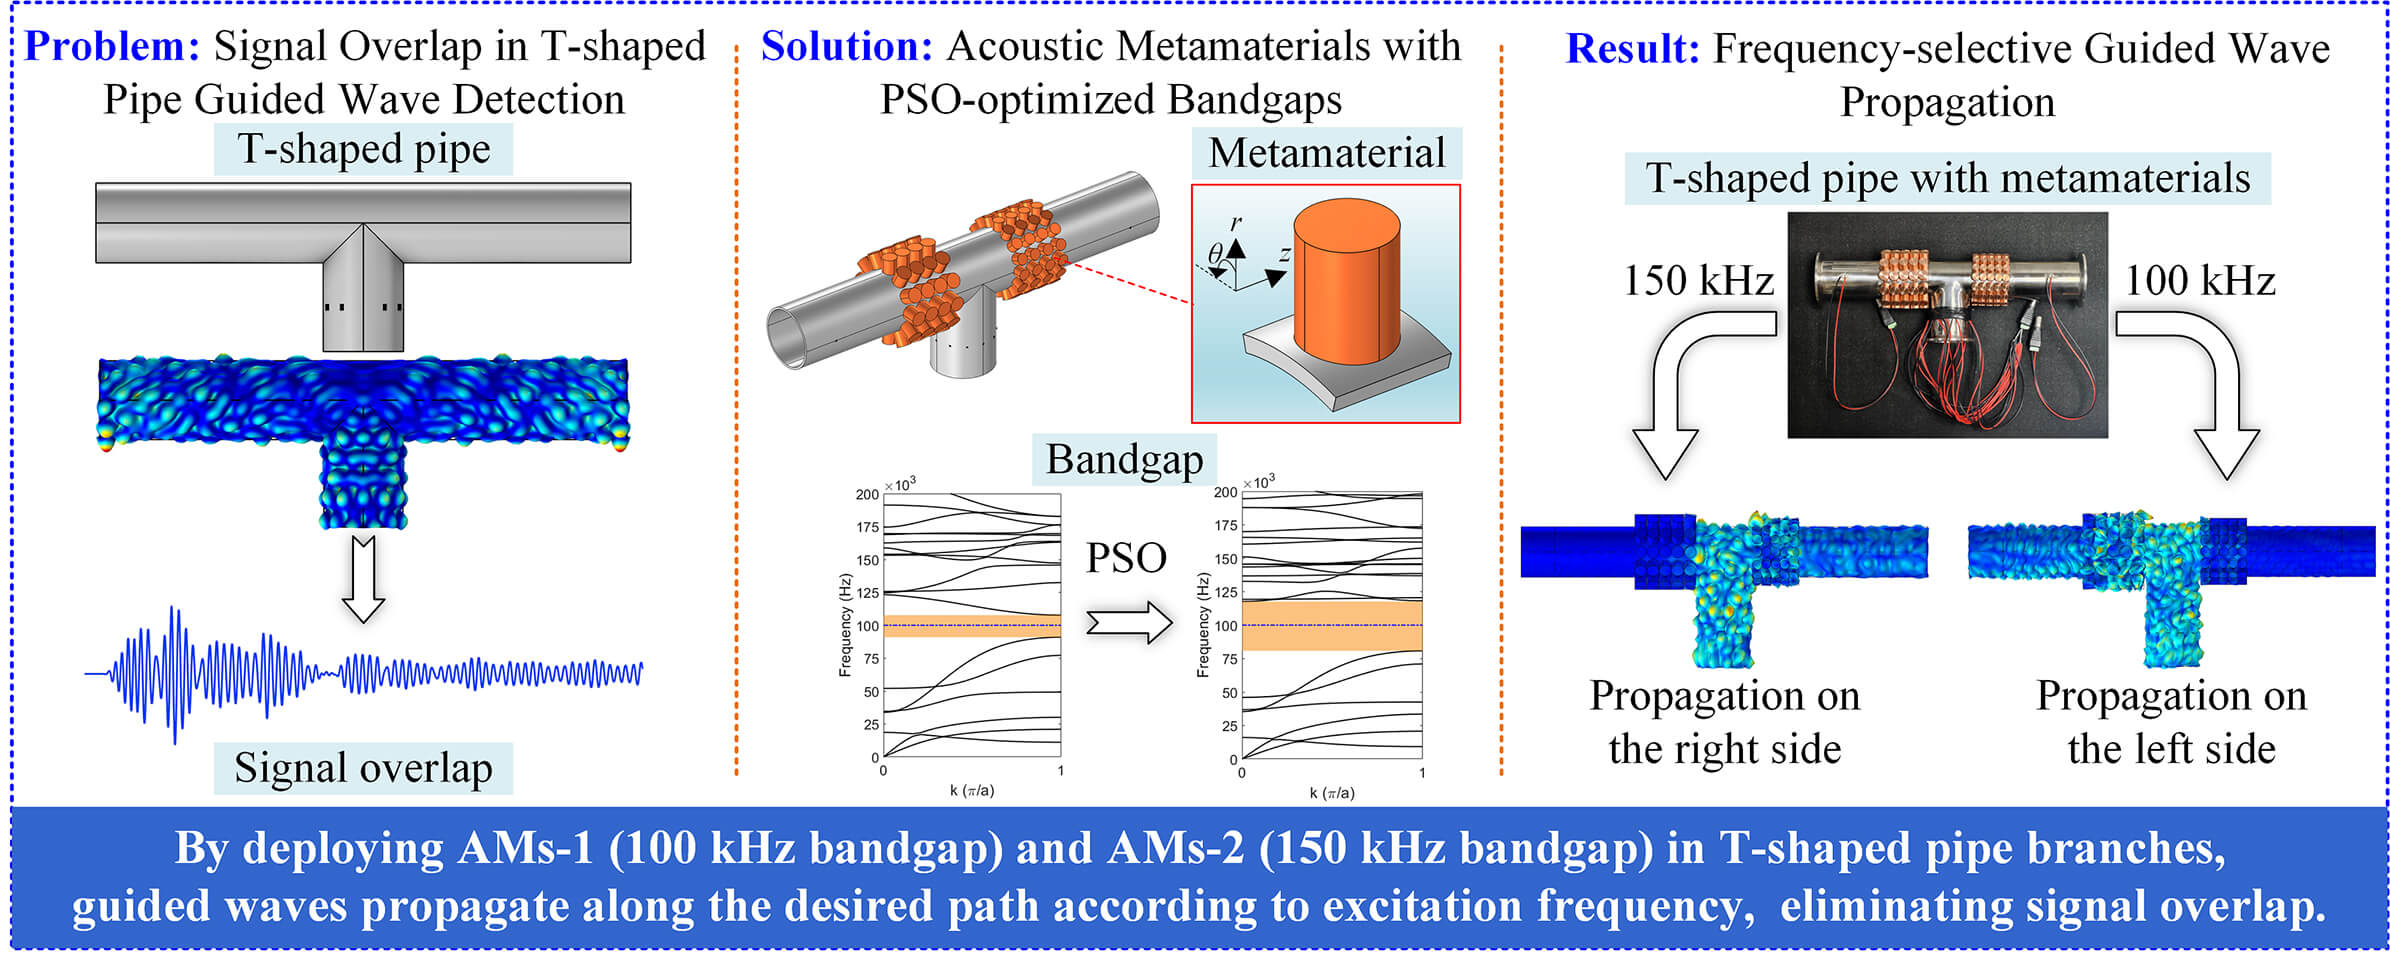
Structural health monitoring (SHM) of ship piping systems is a core component of predictive maintenance strategies for complex marine engineering systems. During the detection of ship T-shaped pipes using ultrasonic guided waves, signal overlap arises from the diffusion of guided wave branches. To address this issue, an intelligent wave-guidance mechanism based on acoustic metamaterials is proposed for dynamic propagation control of ultrasonic guided waves. First, a metamaterial unit composed of a stainless steel substrate and a copper column is designed. The control of bandgap characteristics by lattice constant, column diameter, and column height is systematically investigated, and a design range of structural parameters with optimal bandgap is obtained. The particle swarm optimization algorithm is used to design and optimize two metamaterials, Acoustic-metamaterials-1 (AMs-1) and Acoustic-metamaterials-2 (AMs-2), which further improve the bandgap performance and achieve a transmission loss of over 30 dB for guided waves at 100 and 150 kHz, respectively. Simulation and experimental verification show that when AMs-1 and AMs-2 are deployed in the left and right branches of the T-shaped pipe, respectively, wave propagation can be achieved according to the excitation frequency. At 100 kHz excitation, the guided wave preferentially propagates along the right branch, while at 150 kHz excitation, it preferentially propagates along the left branch. This method actively regulates the guided wave propagation trajectory at the structural level, thereby preventing signal overlap at the T-shaped pipe and offering a novel technical solution for the efficient damage detection and predictive maintenance in ship pipe systems.Graphic Abstract
Keywords
Ship piping systems are key infrastructures that ensure core functions such as power propulsion, fuel supply, and ballast water regulation. Their structural integrity is directly related to the safety of ship navigation and the stability of offshore operations [1–3]. The T-shaped pipe is the most common branch connection form in piping systems and is widely distributed in key parts such as ship power rooms, fuel tanks, and ballast tanks [4]. Due to long-term service in harsh marine environments such as high salt spray, strong vibration, and variable temperature and pressure, the T-shaped pipe is prone to corrosion, fatigue cracks, and other defects in the body, welded joints, and branch transition areas [5,6]. If these defects are not detected and dealt with in time, they will gradually expand and eventually lead to media leakage or even pipeline structure failure, causing serious safety accidents and economic losses [7,8].
Numerous non-destructive testing (NDT) methods are available for the condition monitoring of ship piping systems, including ultrasonic testing, radiographic testing, and magnetic particle testing [9,10]. Nonetheless, these methods possess intrinsic limits. On the one hand, ship piping systems feature a compact layout and are mostly located in enclosed cabins, double bottoms, and underwater concealed areas with poor accessibility, making detection difficult to implement. On the other hand, these methods usually require point-by-point scanning with low detection efficiency, which cannot realize the rapid screening of long-distance pipelines. Ultrasonic guided wave detection technology, with its unique advantage of achieving long-distance and large-range detection through single-point excitation, enables rapid full-coverage scanning of pipe walls and has become the primary means for health monitoring of ship piping systems [11–13]. Moreover, the integration of advanced intelligent algorithms and physical modulation technology has become a promising trend for high-precision structural detection in various engineering fields [14,15]. Therefore, improving the reliability of ultrasonic guided wave testing for T-shaped pipe has important engineering value for ensuring the safety of ship pipelines throughout their entire life cycle and reducing maintenance costs.
However, the complex shape of the T-shaped pipe presents a challenge to ultrasonic guided wave detection. When the guided wave propagates to the T-shaped pipe, complex mode conversion, energy distribution, and scattering phenomena occur between the branch pipes, resulting in severe overlap of signals from different paths in the time domain [16,17]. The difficulty in separating branch signals has become a bottleneck restricting the reliability of ultrasonic guided wave detection in a T-shaped pipe. On the one hand, the defect signal in one branch pipe may overlap with the signal from the other branch pipe or the end face echo, leading to missed detection or false alarms. On the other hand, the defect signal may be masked by the strong scattering signal at the branch, reducing the detection sensitivity [18]. Guided wave inspection techniques for pipe structures have been further advanced. Zhang et al. [19] investigated guided wave-based inspection for pipe bends in marine seawater pipelines, demonstrating the applicability of guided wave methods in complex marine environments. Jan et al. [20] proposed improved pipeline damage detection using flexural and torsional ultrasonic guided waves, highlighting the potential of multimode guided waves for enhancing detection accuracy. Currently, some algorithms for separating multimode signals have been applied to suppress dispersion effects. El Bakkali et al. [21] proposed a mode-matching method based on the semi-analytical finite element (SAFE) method to establish the guided wave scattering substrate at the bend and achieve accurate separation of non-axisymmetric and axisymmetric waves. Huan et al. [22] proposed a fast calculation method for the reflection coefficient of axisymmetric ultrasonic guided waves in pipelines based on rigorous analytical theory to achieve efficient scattering analysis of L(0, 2) mode in pipelines with circumferential cracks. Ma et al. [23] proposed a lightweight network UMENet for multimode ultrasonic guided wave detection to achieve real-time detection of defects in polyethylene pipelines. However, processing algorithms face multiple limitations, such as large computational load, complex processing, poor real-time performance, strong dependence on prior knowledge, and ambiguous separation boundaries, making it difficult to effectively suppress signal overlap caused by strong scattering and multipath interference at the joint. In addition, investigating physical mechanisms capable of actively regulating guided wave propagation paths and energy distribution can circumvent signal separation difficulties from the front end.
Acoustic metamaterials, as functional materials with artificial periodic structures, provide a new technical approach for the frequency-selective transmission, wavefront manipulation, and mode conversion of elastic waves and sound waves due to their unique acoustic modulation capabilities [24–26]. By introducing local resonant structures or periodic scatterers into specific geometric configurations, acoustic metamaterials can achieve precise modulation of the elastic wave bandgap and block the propagation of sound waves in specific frequency bands [27–30]. Metamaterials have also been applied to the control of wave propagation in pipeline structures. Pillarisetti et al. [31] proposed a metasurface structure consisting of periodic elastic bands attached to the outer surface of a hollow pipe, which achieved group velocity modulation and selective suppression of low-frequency longitudinal and torsional guided wave modes. Xu et al. [32] proposed a thin-layer metamaterial design that periodically attaches a novel local resonant phonon crystal to the outer wall of a natural gas pipeline, and attenuates vibration and noise over a wide frequency band by using a multi-oscillator coupling resonance mechanism. Gao et al. [33] proposed a damage detection method that combines nonlinear ultrasonic guided waves with a metasurface, and achieved sensitive identification and localization of microcracks in circular pipes through a periodically arranged semi-circular groove structure. Okudan et al. [34] proposed integrating gradient refractive index phonon crystal lenses into the pipe structure and achieved unidirectional enhancement and energy focusing of acoustic emission signals through a fan-shaped array of blind holes. Liang et al. [35] proposed a novel rotating metamaterial pipe structure based on the Timoshenko beam model, which achieved broadband and tunable characteristics of the low-frequency flexural wave bandgap through the coupling effect of centrifugal force and local resonance. The extraordinary acoustic modulation characteristics of metamaterials provide a new approach for pipeline inspection. Although acoustic metamaterials have been applied to straight pipe wave control, there is a lack of systematic research on frequency-selective transmission of guided waves in a T-shaped pipe, and the key technical issues of bandgap matching with branch pipe structure and precise frequency control remain unsolved.
This paper proposes a method for controlling the frequency-selective transmission of ultrasonic guided waves in the T-shaped pipe based on acoustic metamaterials. By arranging metamaterial units in the branches of the T-shaped pipe, the guided wave can select its transmission direction according to the frequency. This method achieves active control of the guided wave propagation path at the physical structure level, solving the signal overlap problem at the T-shaped pipe and providing a new technical approach to improve the reliability of ultrasonic guided wave detection in the ship’s T-shaped pipe. The paper is structured as follows: Section 2 describes the methods and principles of this research. Section 3 presents the metamaterial design, optimization, and simulation. Section 4 experimentally verifies the frequency-selective transmission function of the metamaterial. Section 5 summarizes the main research results.
2.1 Design Principles and Regulation Mechanisms of Acoustic Metamaterials
Fig. 1 illustrates the principle of frequency-selective transmission control of ultrasonic guided waves in a T-shaped pipe based on acoustic metamaterials. This study uses a stainless steel T-shaped pipe as the research object, with copper columnar metamaterial units periodically arranged on the outer wall of the pipe. Each metamaterial unit cell consists of a copper column and a stainless steel substrate. This type of structural unit can generate a resonant effect at a specific frequency, thereby creating a bandgap and suppressing the transmission of guided waves. By controlling the geometry of the metamaterial unit cells, two metamaterial units with different band gaps are designed. Acoustic-metamaterials-1 (AMs-1) has a resonant frequency of 100 kHz, and Acoustic-metamaterials-2 (AMs-2) has a resonant frequency of 150 kHz. When the frequency of the incident guided wave matches the resonant frequency of the metamaterial layer, the metamaterial resonates and couples with the guided wave, suppressing the propagation of the guided wave at that frequency along that direction. Conversely, guided waves at unmatched frequencies can continue to propagate through the metamaterial layer.

Figure 1: Principle of frequency-selective transmission regulation of ultrasonic guided waves in T-shaped pipes.
The propagation characteristics of ultrasonic guided waves in a pipe can be described by the equations of elastodynamics. For an isotropic homogeneous elastic medium, the Navier equations of motion can be expressed as [16]:
where ρ is the material density, u is the displacement vector, and λ and μ are Lamé constants.
When ultrasonic guided waves propagate in pipe structures, they mainly exist in three modes: longitudinal guided waves (L-mode), torsional guided waves (T-mode), and flexural guided waves (F-mode). Among these, longitudinal guided waves are the core mode for inspecting T-shaped pipes in ships due to their long propagation distance and high sensitivity to axial defects. Their propagation characteristics are jointly determined by the material properties and geometric parameters of the pipe [36]. The phase velocity vp of longitudinal guided waves in circular pipes satisfies the equation:
where ω is the angular frequency of the guided wave, f is the frequency of the guided wave, and k is the wave number of the guided wave.
The group velocity vg is obtained by taking the derivative of the phase velocity with respect to the angular frequency, and its equation is expressed as:
For a circular pipe with an inner radius of r1 and an outer radius of r2, the wave number k of the longitudinal guided wave must satisfy the governing equation for the longitudinal vibration of the circular pipe. Combining this with the elastic mechanical properties of the pipe’s structural materials, its dispersion relation can be expressed as:
where E is Young’s modulus, J0 and J1 are the zeroth and first order Bessel functions, respectively, and Y0 and Y1 are the zeroth and first order Neumann functions, respectively.
To quantitatively describe the local resonance mechanism, an equivalent mass-spring model is introduced. The copper column is regarded as a concentrated mass, and its coupling with the substrate provides equivalent stiffness, forming local resonance with the characteristic frequency [37]:
where meff is the equivalent mass of the copper column. keff is the equivalent stiffness of the coupling between the copper column and the substrate, which can be approximated as:
where ECu is the Young’s modulus of copper, and A is the cross-sectional area of the copper column, defined as A = π(d/2)2. h is the height of the copper column.
The explicit relationship of the resonant frequencies can be obtained:
This expression indicates that the bandgap frequency is primarily controlled by the height of the copper column (f ∝ 1/h).
Furthermore, near the resonant frequency, the effective dynamic mass Meff(ω) satisfies:
where ω is the angular frequency, and ω0 is the local resonant angular frequency. When ω ≈ ω0, the system exhibits negative effective mass characteristics, thereby suppressing elastic wave propagation and forming a bandgap.
2.2 Finite Element Method for Calculating Bandgap of Acoustic Metamaterials
The band structure calculation of periodic acoustic metamaterials is based on Bloch’s theorem. For an infinitely periodic structure, the displacement field satisfies [38]:
where R is the lattice translation vector, and u(r) is the elastic displacement field vector at position r in the metamaterial unit cell.
A cylindrical coordinate system is adopted for the metamaterial unit cell, with its origin set at the center of the pipe cross-section. The z-axis is along the axial direction of the pipe, corresponding to the arrangement direction of the metamaterial array. The θ is along the circumferential direction of the pipe, and the r-axis is along the radial direction of the pipe, corresponding to the height direction of the copper column.
Since this study mainly focuses on the propagation control of axial guided waves in the T-shaped pipe, the band structure calculation is performed based on the axial periodicity of the metamaterial unit cell. Bloch–Floquet periodic boundary conditions are therefore applied only along the axial direction of the unit cell. In the circumferential direction, cyclic symmetry boundary conditions are employed to characterize the circumferential continuity of the pipe structure. Accordingly, the Bloch wave vector is scanned only along the axial irreducible Brillouin zone, i.e., k ∈ [−π/a, π/a], where a denotes the axial lattice constant of the metamaterial unit cell [39]. The corresponding boundary conditions are illustrated in Fig. 2.

Figure 2: Boundary conditions of the metamaterial.
Applying the boundary conditions to the unit cell can be expressed as:
where m is the circumferential order of the axial guided waves, k is the axial Bloch wave vector, and a is the period length of the unit cell along the axial direction (i.e., the lattice constant of the metamaterial array).
Floquet periodic boundary conditions are applied to the axial boundaries, which satisfy:
where rz=0 and rz=a are the position vectors of the left and right axial boundaries of the unit cell, respectively.
The elastodynamics of the metamaterial unit cell is solved through finite element discretization, where the element stiffness matrix
where Ωe is the integral domain of the element, B is the strain matrix, D is the material constitutive matrix, ρ is the mass density of the material, and N is the displacement shape function matrix.
After assembling the global matrix and applying periodic boundary conditions, the generalized eigenvalue equations are obtained:
where
2.3 Optimization Method for Metamaterial Structures Using Particle Swarm Algorithm
The bandgap properties of acoustic metamaterials are associated with the geometric parameters of the metamaterial units. Optimizing the structure can yield a better bandgap. Particle Swarm Optimization (PSO) is a well-established, robust global optimization algorithm based on swarm intelligence, which is widely adopted for acoustic metamaterial bandgap regulation. It has advantages such as a simple principle, gradient-free global search, fast convergence speed, easy implementation, and strong robustness [40–42]. It does not rely on the gradient information of the objective function and can solve multivariable, nonlinear, and multi-constraint optimization problems. Therefore, this study uses PSO to optimize the key parameters of the metamaterial to achieve the optimal target bandgap.
The optimization objective is to ensure that the bandgap range of the metamaterial precisely matches the frequency-selective transmission requirements of the guided wave. Specifically, the non-target guided wave frequency should remain outside the bandgap to guarantee its normal transmission. Simultaneously, the bandgap center should be as close as possible to the target guided wave frequency to maximize wave attenuation within the bandgap. Therefore, the fitness function is designed as follows:
where fc denotes the target bandgap frequency, and fu represents the target bandgap frequency at the other end of the T-shaped pipe. fup and flow indicate the upper and lower limits of the bandgap, respectively. β is the bandgap margin value, which is 5 kHz, and it can prevent the target frequency of the bandgap at the other end from falling exactly on the bandgap edge.
The optimization flowchart of this study is shown in Fig. 3. The specific steps can be divided into:

Figure 3: The process of optimizing metamaterial using the PSO algorithm.
Step 1: Optimize parameter initialization. This includes initializing the core algorithm parameters and optimization variable bounds, with specific values and setting rationale as follows: population size popSize = 10, maximum number of iterations maxIter = 100, individual learning factor c1 = 2.5, social learning factor c2 = 2.5, initial inertia weight winit = 0.9, minimum inertia weight wmin = 0.2, lower bound of optimization variables lb = [3.00, 3.00], upper bound ub = [10.50, 18.00]. In this study, popSize = 10 balances optimization performance and computational efficiency for this 2D single-objective problem, avoiding high cost from COMSOL simulations. maxIter = 100 ensures full convergence. c1 = c2 = 2.5 balances individual and social learning to avoid local optima. Linearly decreasing inertia weight (0.9 → 0.2) strengthens global search early and local refinement late, for precise bandgap-frequency matching. lb = [3.00, 3.00] and ub = [10.50, 18.00] are set by structural constraints, bandgap requirements, and machinability, fully covering the optimal parameter range. Simultaneously, initialize the particle position (X) and velocity (V). To improve convergence speed, a pre-defined optimal initial particle position can be used.
Step 2: Individual and Global Optimal Initialization. The initial position of each particle is taken as its individual optimal position pBest, and its individual optimal fitness value pBestValue is initialized to infinity. The global optimal position gBest is initialized to the zero vector, and its global optimal fitness value gBestValue is also initialized to infinity.
Step 3: Fitness value calculation. Traverse each particle and substitute the parameters corresponding to the particle position into the COMSOL metamaterial bandgap simulation model. Through joint simulation of MATLAB and COMSOL, update the model parameters and solve for the characteristic frequencies. Calculate the bandgap based on the characteristic frequencies, and calculate the fitness value F of the current particle according to Eq. (14).
Step 4: Individual and Global Optimal Updates. Based on the judgment, update the individual’s optimal position pBest and optimal fitness value pBestValue. Based on the judgment, update the global optimal position gBest and optimal fitness value gBestValue.
Step 5: Particle velocity and position update.
Step 6: Iterative Convergence Check. Record the global optimal position and fitness value of the current iteration, and check whether the maximum number of iterations maxIter has been reached. If it is, stop the iteration and output the global optimal parameters; otherwise, return to step 3 and proceed to the next iteration.
3.1 Acoustic Metamaterials Unit Cell Design and Optimization
The subject of this study is a T-shaped pipe, and its three-dimensional finite element simulation model is shown in Fig. 4a. The excitation array consists of 12 piezoelectric excitation points arranged in a ring at the lower branch of the T-shaped pipe, with a receiving point on each of the left and right branches. The T-shaped pipe has an outer diameter of 45 mm, a wall thickness of 1.5 mm, and is made of stainless steel 304. Specific material parameters are shown in Table 1.

Figure 4: (a) Three-dimensional simulation model of the T-shaped pipe, and (b) phase velocity and group velocity. (c) Frequency-sweeping signal, and (d) its energy distribution in the frequency domain within the T-shaped pipe.

First, the dispersion curve of the ultrasonic guided wave propagation is solved, and the result is shown in Fig. 4b. From the group velocity, it can be seen that the L(0, 2) mode exhibits a relatively gradual change after 50 kHz, which is a detection-friendly region. Then, a suitable frequency range is determined by frequency sweeping, as shown in Eq. (15). The spectrum of the frequency sweep signal is shown in Fig. 4c.
where A0 is the preset amplitude, f1 is the starting frequency (20 kHz), f2 is the cutoff frequency (500 kHz), and T0 is the scan duration (1 ms).
After the excitation array excites the sweep frequency signal, the energy time-domain distribution of the signal at the receiving point is solved. The energy calculation formula is shown in Eq. (16), and the energy distribution result is shown in Fig. 4d. It can be seen that the energy is relatively uniformly distributed in the frequency domain, so guided waves can be excited in the sweep frequency range to detect the pipeline structure.
where xi is a discrete signal of length N. To ensure numerical stability and avoid underflow or division-by-zero errors during subsequent processing, a stabilization term on the order of machine epsilon
It should be noted that complex mode conversion inevitably occurs when the incident L(0, 2) guided wave propagates to the T-shaped pipe. The transient response results of the model in Fig. 4a, excited with a 100 kHz ultrasonic guided wave, are shown in Fig. 5. The geometric discontinuity at the T-joint breaks the axisymmetric propagation condition of guided waves, inducing non-axisymmetric flexural modes. Therefore, the band structure of the metamaterials designed in this study needs to fully take into account all the above-mentioned guided wave modes in order to achieve comprehensive suppression of multimode guided waves at the target frequency.

Figure 5: Complex guided wave mode conversion in the T-shaped pipe under 100 kHz excitation.
In this study, metamaterials are placed at the beginning of the left and right branches of the T-shaped pipe, as shown in Fig. 6a, to achieve frequency-selective propagation of guided waves. The substrate layer of the metamaterial unit is part of the pipe; it is an arc-shaped substrate. Furthermore, to ensure that an integer number of metamaterial units is arranged around the circumference of the pipe, the arc angle α occupied by the metamaterial substrate must satisfy the equation
where Din is the inner diameter of the pipe.


Figure 6: Metamaterial structure: (a) geometry and its arrangement position in the T-shaped pipe, and (b) irreducible Brillouin zone. Band structure for the circumferential order of (c) m = 0, (d) m = 1, (e) m = 2, and (f) m = 3. (g) Variation of bandgap characteristics with lattice constant a, (h) variation of bandgap characteristics with copper column diameter d, and (i) variation of bandgap characteristics with copper column height h.
The core structure of the metamaterial unit is a copper column positioned at the center of a circular arc substrate, with geometric parameters including column diameter d and column height h. The one-dimensional irreducible Brillouin zone for axial guided wave propagation is shown in Fig. 6b. Taking a metamaterial element with α = 30°, d = 8.50 mm, and h = 10.50 mm as an example, the band structures for circumferential orders m = 0, 1, 2, 3 are calculated individually by scanning the axial wave vector k along the irreducible Brillouin zone, as presented in Fig. 6c–f. The orange regions in the figures represent complete band gaps, within which all guided wave modes of the corresponding circumferential order are attenuated and suppressed by the metamaterial. The band structure for axisymmetric modes (m = 0) is presented in Fig. 6c. The bandgap formation originates from the hybridization between the pipe intrinsic guided modes, including longitudinal modes L(0, n) and torsional modes T(0, n), and the local resonance of the copper columns. A complete bandgap for all axisymmetric modes is observed from 85.73 to 102.09 kHz, within which both incident longitudinal guided waves and torsional guided waves are effectively attenuated. The bandgap characteristics of non-axisymmetric flexural modes with circumferential orders m = 1, 2, 3 are subsequently investigated, as presented in Fig. 6d–f. Complete band gaps are observed for all three flexural mode families within the same frequency range: 85.49–101.86 kHz for m = 1, 84.98–101.21 kHz for m = 2, and 84.75–99.78 kHz for m = 3. With an increase in the circumferential order m, the upper limit of the complete bandgap decreases slightly, while the lower limit remains almost unchanged. This trend can be attributed to the enhanced mode coupling between higher-order flexural modes and the local resonance of the resonators, which modifies the dispersion characteristics of the hybridized modes. Notably, the complete bandgap ranges show negligible differences across all investigated circumferential orders. Therefore, this study takes the bandgap characteristics of the m = 0 mode as the main optimization objective in subsequent parametric analysis, which can simultaneously ensure the effective suppression of both the incident longitudinal guided wave and the mode-converted flexural guided wave.
To systematically investigate the evolution of bandgap characteristics with varying metamaterial geometric parameters, simulations are conducted. Fig. 6g shows the bandgap characteristics under varying lattice constant a with d and h fixed at d = 0.8a and h = 0.8a. To satisfy the condition of an integer number of metamaterial elements arranged circumferentially, the arc angle α is taken as 12°, 15°, 18°, 20°, 22.5°, 24°, 30°, and 36°, corresponding to lattice constants a of 4.39, 5.48, 6.57, 7.29, 8.19, 8.73, 10.87, and 12.98 mm, respectively. The results show that as the lattice constant a increases, the bandgap center frequency gradually decreases, and the bandgap width also tends to decrease. This sweep verifies the scaling law of the local-resonance-dominated bandgap: the fixed aspect ratio eliminates geometric interference, confirming the bandgap center frequency scales inversely with unit size, a core feature of local resonance.
After fixing the arc angle α = 22.5° (corresponding to the lattice constant a = 8.19 mm), the influence of the copper column diameter d and column height h on the bandgap is further investigated. Fig. 6h shows the evolution of bandgap characteristics as the column diameter d increases from 4.50 to 8.00 mm. It can be seen that with the increase of d, the bandgap center frequency gradually shifts upward from approximately 120 to 155 kHz, and the bandgap width increases monotonically from approximately 10 to 45 kHz, with the growth rate accelerating significantly when d exceeds 0.8 times the lattice constant. Fig. 6i shows the bandgap variation as the column height h increases from 5.00 to 8.50 mm. The results show that with the increase of h, the bandgap center frequency gradually shifts downward from approximately 165 to 120 kHz, while the bandgap width first increases sharply, reaches a maximum value of approximately 38 kHz at h = 8.00 mm (about 1.0 times the lattice constant), and then decreases slowly.
By combining multiple simulation results, the optimal structural parameter range of the metamaterial unit can be obtained. When the column diameter d is greater than 0.8 times the lattice constant a, and the column height h is about 1.0 times the lattice constant a, the metamaterial unit cell can obtain excellent bandgap performance.
Based on the aforementioned bandgap modulation principles, this study designed two metamaterial units, AMs-1 and AMs-2, to achieve selective propagation at guided wave frequencies of 100 and 150 kHz, respectively, thus enabling independent propagation modulation of the left and right branches of the T-shaped pipe. The frequency selection comprehensively considered both the applicability to pipe structure detection and frequency separation. Both frequencies are within the stable dispersion range of the L(0, 2) mode, and the 50 kHz frequency difference effectively avoids the risk of frequency shunting failure caused by metamaterial bandgap overlap. As determined by Fig. 6a, the lattice constant of the AMs-1 metamaterial unit designed for 100 kHz is 10.87 mm, and the lattice constant of the AMs-2 metamaterial unit designed for 150 kHz is 8.19 mm. Their specific structural parameters are shown in Table 2.

Under the initial structural parameters, the band structures of AMs-1 and AMs-2 are shown in Fig. 7a,f, respectively. It can be seen that both metamaterial units have a bandgap near the target frequency, but the target frequency deviates significantly from the center frequency of the bandgap, and the bandgap width is relatively narrow. In practical applications, such deviations may weaken the suppression effect of the metamaterial due to factors such as fluctuations in material properties or processing errors, making it difficult to achieve precise frequency-selective control. To this end, this study uses the PSO algorithm and Eq. (14) as the fitness function to optimize the copper column diameter d and column height h of the metamaterial unit to improve the bandgap performance. Since previous analyses showed that the complete bandgap ranges corresponding to different circumferential orders exhibit only minor differences, the optimization process is performed based on the m = 0 model to improve computational efficiency.

Figure 7: AMs-1 metamaterial unit cell and optimization results: (a) initial structure and band structure, (b) fitness variation curve, (c) structural parameter variation curve, (d) optimized structure and band structure, and (e) mode shapes at the upper and lower boundaries of the AMs-1 bandgap. AMs-2 metamaterial unit cell and optimization results: (f) initial structure and band structure, (g) fitness variation curve, (h) structural parameter variation curve, (i) optimized structure and band structure, and (j) mode shapes at the upper and lower boundaries of the AMs-2 bandgap.
Fig. 7b,c illustrate the iterative evolution of fitness values and structural parameters during the AMs-1 optimization process. It can be seen that the parameter changes are significant in the early stages of iteration, gradually converging after approximately 30 iterations. The optimized structure and its band structure are shown in Fig. 7d, where the target frequency is closer to the bandgap center, and the bandgap matching is significantly improved. Fig. 7g,h show the iterative curves of fitness values and structural parameters for AMs-2, respectively. This optimization process converges relatively quickly, stabilizing after approximately 15 iterations. The optimized structure and its band structure are shown in Fig. 7i, where the bandgap width is increased by 5.00 kHz, and the target frequency is shifted closer to the bandgap center, resulting in improved bandgap matching to the target frequency. This local resonance mechanism is verified by the mode shapes at the upper and lower boundaries of the bandgap, as shown in Fig. 7e,j. At the lower boundary of the bandgap, the mode shapes show strong axial stretching and bending vibrations of the copper column, with vibration energy highly concentrated in the copper column and minimal deformation of the substrate, corresponding to the fundamental resonant mode of the copper column. At the upper boundary of the bandgap, the vibration is still dominated by the copper column, with only a slight increase in substrate participation. This characteristic confirms that the bandgap originates from the localized resonance of the copper column. The optimized metamaterial structural parameters are shown in Table 3.

Table 4 shows a comparison of the bandgap performance of AMs-1 and AMs-2 before and after optimization. For AMs-1, the optimized bandgap width increased by 120.0%. The effective bandwidth is defined as the minimum difference between the bandgap boundary and the target frequency. The effective width increased from 7.71 to 17.65 kHz, an increase of 128.9%, indicating that the optimization not only expanded the frequency domain coverage of the bandgap but also significantly enhanced its actual suppression capability against the target frequency band. For AMs-2, the optimization effect is even more significant, with the bandgap width increasing by 28.7%. The effective width jumped from 2.21 to 17.78 kHz, an increase of 8.43 times, showing a significant growth. The optimized structure not only expanded the bandgap range but, more importantly, brought the target frequency closer to the bandgap center, thereby enhancing the robustness and suppression effect of the metamaterial in practical applications.

To further evaluate the effectiveness of the optimization strategy, the dispersion relations corresponding to circumferential orders m = 1 and m = 2 are additionally calculated after optimization, as shown in Fig. 8. The results indicate that the complete bandgap ranges under different circumferential orders remain highly consistent, demonstrating that the optimization based on the m = 0 model can effectively represent the bandgap characteristics of different guided wave mode families. Although mode conversion may occur in the T-joint region and generate non-axisymmetric flexural guided wave modes, the optimized metamaterial structure still maintains highly similar complete band gaps for different circumferential orders, indicating its capability for broadband suppression of both axisymmetric and non-axisymmetric guided waves near the target frequency range.

Figure 8: Dispersion relations and complete band gaps of the optimized metamaterial structures under different circumferential orders (m = 0, 1, and 2): (a) optimized AMs-1 and (b) optimized AMs-2.
Considering practical engineering applications, reliable connections between metamaterial units and the pipe substrate are achieved through adhesives. To clarify the role of the adhesive layer, this study uses an optimized metamaterial-T-shaped pipe coupling system as the research object. A 20 μm thick epoxy resin adhesive layer is introduced at the interface of the metamaterial unit connection. The material parameters of the adhesive layer are set as follows: density 1200 kg/m3, Young’s modulus 6 GPa, and Poisson’s ratio 0.35. The simulation model is shown in Fig. 9b to compare and analyze the guided wave transmission characteristics and numerical computation costs under two conditions: with and without the adhesive layer.

Figure 9: The energy band curve of AMs-1, (a) without the adhesive layer and (b) with the adhesive layer.
Comparative analysis of the simulation results under the two conditions shows that the presence of the adhesive layer has a negligible impact on the bandgap characteristics of the metamaterial. The bandgap range of the two models remains basically the same. However, in terms of computational cost, the model with the adhesive layer has a mesh count as high as 60,562, which is about 23.71 times higher than the 2554 meshes in the model without the adhesive layer. Correspondingly, the solution time increases dramatically from 1 min 9 s to 28 min 32 s, an increase of more than 24.81 times. The above results indicate that although the perturbation of the adhesive layer on the core bandgap performance is negligible, it significantly increases the complexity and computational cost of simulation modeling. Therefore, to improve simulation efficiency while ensuring computational accuracy, the modeling of the adhesive layer will no longer be considered in subsequent studies.
3.2 Metamaterial Bandgap Functionality and Frequency-Selective Transmission Simulation
Fig. 10 shows a three-dimensional simulation model of the pipe containing metamaterials. The excitation array consists of 12 piezoelectric elements uniformly distributed circumferentially, and the metamaterial is arranged in 5 rows in the middle of the pipe, with the receiving point located on the other side of the metamaterial. The geometric dimensions and positional parameters are clearly labeled in the figure. The excitation signal is a 10-cycle Hanning window modulated sinusoidal signal with center frequencies of 100 and 150 kHz. To reduce the influence of boundary reflections on the simulation results, a perfectly matched layer (PML) is applied at both ends of the pipe to absorb outgoing guided waves. A low-reflection boundary condition is further imposed at the outer boundary of the PML to suppress residual numerical reflections.

Figure 10: Straight pipe three-dimensional simulation model.
The quantitative results of the frequency-selective transmission characteristics of AMs-1 and AMs-2 in straight pipes are summarized in Table 5. The results confirm that the two metamaterials exhibit the expected passband-stopband characteristics: AMs-1 forms a stopband at 100 kHz and a passband at 150 kHz, while AMs-2 forms a stopband at 150 kHz and a passband at 100 kHz, which is consistent with the bandgap design objectives.

To further verify the frequency selectivity of the designed metamaterial, a wideband sweep frequency analysis is conducted. A sweep frequency signal is applied to the excitation array of the metamaterial-containing pipeline model within the frequency range of 20 to 500 kHz, and the results are shown in Fig. 11. Fig. 11a shows the time-domain signal of the sweep frequency response of the pipeline containing AMs-1, and its corresponding frequency-domain energy distribution is shown in Fig. 11b. It can be seen that an attenuation valley occurs near 100 kHz, indicating that the guided wave near this frequency is attenuated below the effective detection threshold by AMs-1 and cannot penetrate the metamaterial region to propagate to the receiver. Fig. 11c,d shows the sweep frequency results and their frequency-domain energy distribution of the pipeline containing AMs-2, respectively. In contrast to AMs-1, energy attenuation occurs near 150 kHz, confirming that AMs-2 has an attenuation performance on guided waves in this frequency band. The above wideband sweep frequency analysis further confirms the presence of distinct attenuation bands at the target frequencies, demonstrating the frequency-selective response of the two metamaterial structures in the frequency domain.

Figure 11: (a) Frequency-sweep signals and (b) frequency-domain energy distribution of the pipeline with AMs-1. (c) Frequency-sweep signals and (d) frequency-domain energy distribution of the pipeline with AMs-2.
To characterize the suppression effect of metamaterials with different numbers of rows on the target frequency, the transmission characteristics of a T-shaped pipe with 2, 3, 5, 8, and 10 rows of metamaterial arrays at the target frequency are simulated. To quantitatively characterize the suppression performance of the metamaterial array, the transmission loss (TL) of the guided wave is defined as:
where xtrans is the amplitude of the transmitted guided wave signal after passing through the metamaterial array, xinc is the amplitude of the incident guided wave signal in front of the metamaterial array, and n is the number of scattered signal points.
Fig. 12a shows the suppression of 100 kHz guided waves by AMs-1 with different row numbers. The transmitted signal amplitude is much smaller than that of the incident signal, and decreases gradually as the number of metamaterial rows increases, whereas the incident signal remains nearly unchanged. Fig. 12b presents the transmission loss of the 100 kHz guided wave for AMs-1. The attenuation is particularly pronounced from 2 to 5 rows (from −24.78 to −40.16 dB), then levels off between 5 and 10 rows (−41.98 dB for 8 rows, −42.17 dB for 10 rows). This indicates that AMs-1 approaches its optimal attenuation performance at 5 rows, with limited further improvement from additional rows. Fig. 12c depicts the suppression of 150 kHz guided waves by AMs-2, where the transmitted signal attenuates markedly with increasing row number. Fig. 12d gives the corresponding transmission loss of the 150 kHz guided wave, which also converges with row number. Attenuation is significant from 2 to 5 rows (from −18.88 to −37.04 dB) and becomes gradual from 5 to 10 rows (−38.87 dB for 8 rows, −40.91 dB for 10 rows), confirming that AMs-2 is near its optimal performance at 5 rows. Meanwhile, the 5-row array balances excellent suppression performance, structural compactness, and on-site installation convenience for practical ship piping applications, thus being selected as the final design parameter.

Figure 12: AMs-1 with different rows under 100 kHz excitation: (a) wavefield snapshots and the corresponding incident and transmitted signals, (b) transmission loss. AMs-2 with different rows under 150 kHz excitation: (c) wavefield snapshots and the corresponding incident and transmitted signals, (d) transmission loss.
In order to isolate the inhibitory effect of this metamaterial on a specific branch and distinguish it from the inherent T-shaped pipe scattering as well as the interference caused by the coupling between the arrays, two sets of single-branch metamaterial simulations are conducted. As shown in Fig. 13, under 100 kHz excitation, the left branch with AMs-1 achieves a transmission loss of −40.16 dB, while the right branch without metamaterial has a transmission loss of only −1.74 dB, with an amplitude ratio of 23.08 between the two branches. Under 150 kHz excitation, the right branch with AMs-2 achieves a transmission loss of −37.04 dB, while the left branch without metamaterial has a transmission loss of only −1.68 dB, with an amplitude ratio of 22.04. This result verifies the independent and strong suppression capability of the proposed metamaterials on the target frequency guided waves.

Figure 13: Guided wave transmission characteristics of T-shaped pipe with single-branch acoustic metamaterials. (a) Wavefield snapshots and transmission loss of AMs-1 under 100 kHz excitation. (b) Wavefield snapshots and transmission loss of AMs-2 under 150 kHz excitation.
Fig. 14a shows the three-dimensional simulation model of the T-shaped pipe containing metamaterials AMs-1 and AMs-2. The excitation array is arranged in the bottom branch of the T-shaped pipe, with 5 rows of AMs-1 located in the left branch and 5 rows of AMs-2 located in the right branch. A receiving point is set at the end of each branch. The structural geometry and position parameters are marked in detail in the figure. The excitation signal is a 10-cycle Hanning window modulated sinusoidal signal with center frequencies of 100 and 150 kHz, respectively. To reduce the influence of boundary reflections on the simulation results, low-reflection boundary conditions are set at each port of the T-shaped pipe.


Figure 14: (a) Simulation model of the T-shaped pipe. (b) Transient simulation results under 100 kHz excitation and (c) received signals on the left and right sides. (d) Transient simulation results under 150 kHz excitation and (e) received signals on the left and right sides. (f) Average amplitude and transmission loss on the left and right sides at 100 kHz, and (g) average amplitude and transmission loss on the left and right sides at 150 kHz.
Fig. 14b shows a snapshot of the wavefield under 100 kHz excitation. It can be seen that the guided wave mainly propagates along the right branch, while the left branch exhibits virtually no vibration due to the suppression effect of AMs-1. The corresponding received signal is shown in Fig. 14c, where the signal amplitude on the left is extremely low, while the signal on the right is very significant, creating a stark contrast. Fig. 14f shows the average signal amplitude; the average amplitude on the right reaches 3.39 × 10⁻⁴, approximately 24.57 times that of the average amplitude on the left (1.38 × 10⁻⁶). The average amplitude is used here to stably characterize the overall transmission level of the guided wave, avoiding the deviation caused by the instantaneous peak oscillation of the dispersive signal. Quantitatively, the transmission loss of the AMs-1 array in the left branch reaches −37.32 dB at 100 kHz, while the transmission loss of the right branch with AMs-2 at the same frequency is only −4.67 dB. This result confirms that under 100 kHz excitation, the guided wave can only effectively propagate through the right branch where AMs-2 is located.
Fig. 14d shows a snapshot of the wavefield under 150 kHz excitation. At this point, the left branch exhibits significant vibration, while the right branch shows almost no response. As shown in Fig. 14e, the received signal also indicates a significant signal on the left and a negligible signal on the right. As shown in Fig. 14g, the average amplitude statistics show that the average amplitude on the left is 2.08 × 10⁻⁴, approximately 11.18 times the average amplitude on the right (1.86 × 10⁻⁵). Quantitatively, the transmission loss of the AMs-2 array in the right branch reaches −33.15 dB at 150 kHz, while the transmission loss of the left branch with AMs-1 at the same frequency is only −6.83 dB. Therefore, under 150 kHz excitation, the guided wave can only penetrate the AMs-1 and propagate along the left branch. The above results fully verify the frequency-selective propagation characteristics of the designed metamaterial structure and realize the precise control of the guided wave propagation path in the T-shaped pipe according to the excitation frequency.
To verify the robustness of the proposed metamaterial design against practical machining and assembly tolerances, a systematic tolerance sensitivity simulation analysis is conducted. In the simulation, the random tolerance ranges for the copper column diameter and height are set to ±0.05 mm. Additionally, the random error ranges for the copper column bonding position in both the circumferential and axial directions are set to ±0.05 mm, covering the assembly errors introduced by epoxy bonding. Fig. 15a shows a snapshot of the wavefield under 100 kHz excitation and a comparison of the received signals of the two branches. Fig. 15c shows a snapshot of the wavefield under 150 kHz excitation and a comparison of the received signals of the two branches. It can be seen that within the set tolerance distribution range, AMs-1 and AMs-2 can still achieve stable frequency-selective transmission of the target frequency guided wave, and the frequency-selective transmission control effect is not significantly degraded by the tolerance. Fig. 15b shows the quantization results of the transmission loss of the two branches under 100 kHz excitation. The transmission loss of the AMs-1 array in the left branch is −36.29 dB, and the transmission loss of the AMs-2 array in the right branch is −6.90 dB. Fig. 15d shows the quantization results of the transmission loss of the two branches under 150 kHz excitation. The transmission loss of the AMs-1 array in the left branch is −6.92 dB, and the transmission loss of the AMs-2 array in the right branch is −32.08 dB. The above results fully demonstrate that the optimized metamaterial design in this study has excellent robustness. Within the tolerance range of actual processing and assembly, it can still stably realize the guided wave frequency selective transmission function at the target frequency, and has good engineering applicability.

Figure 15: Guided wave responses of the T-shaped pipe under different excitation frequencies. (a) Wavefield snapshot and comparison of received signals at the left and right branches under 100 kHz excitation. (b) Transmission loss under 100 kHz excitation. (c) Wavefield snapshot and comparison of received signals at the left and right branches under 150 kHz excitation. (d) Transmission loss under 150 kHz excitation.
4 Experimental Results and Discussion
4.1 Experimental Platform and Setup
The experimental platform used in this study is shown in Fig. 16a, mainly consisting of a computer with a built-in Sichuan Top Measurement & Control PCI-20614 data acquisition card, an Aigtek ATA-4315 high-voltage power amplifier, and a Keysight Technologies 33520B arbitrary waveform generator. The metamaterial unit is fabricated using a Computer Numerical Control (CNC) machine tool with a machining accuracy of ±0.03 to ±0.05 mm, and its physical form is shown in Fig. 16b. To characterize the machining consistency of the fabricated metamaterial units, the copper column diameter d and height h of 20 sets of AMs-1 and 20 sets of AMs-2 units are measured using a digital vernier caliper. The statistical results of the measured dimensions are shown in Table 6. All units have machining tolerances controlled within ±0.05 mm, with extremely small deviations from the design values, ensuring high consistency between the actual bandgap performance of the fabricated samples and the design target. Fig. 16c shows the experimental T-shaped pipe sample, with the metamaterial unit adhered to the pipe surface using epoxy resin adhesive. Both the excitation and receiving sensors are square PZT-5H piezoelectric transducers with dimensions of 7 mm × 3 mm × 1 mm. The core performance parameters are as follows: piezoelectric strain constant d33 = 460 pC/N, relative permittivity ε33/ε0 = 1156–1700, planar electromechanical coupling coefficient kp = 0.60, thickness electromechanical coupling coefficient kt = 0.55, and mechanical quality factor Qm = 64. For sensor installation, 12 excitation PZTs are uniformly arranged in a circumferential ring on the lower branch, and two receiving PZTs are mounted at the ends of the left and right branches, respectively, with all positions fully consistent with the simulation model. All sensors are bonded with uniform epoxy resin coating and cured at room temperature for 24 h to ensure reliable bonding and signal repeatability. The geometric dimensions and sensor positions of the experimental sample are consistent with the simulation model shown in Fig. 14a.

Figure 16: (a) Experimental platform, (b) metamaterial sample, (c) T-shaped pipe experimental sample with metamaterial, and (d) connection between the experimental platform and the experimental sample.

Fig. 16d shows the wiring diagram of the experimental system. During the experiment, the computer-controlled arbitrary waveform generator generates a preset excitation signal. This signal is amplified by the high-voltage power amplifier and then applied to the excitation sensor, thereby exciting ultrasonic guided waves in the stainless steel T-shaped pipe. The receiving sensor picks up the structural vibration signal and converts it into an electrical signal, which is then transmitted to the computer for acquisition and analysis via the data acquisition card. The excitation signal uses a 10-cycle Hanning window modulated sinusoidal signal with center frequencies of 100 and 150 kHz. The output amplitude of the arbitrary waveform generator is 3 V, which is amplified 50 times by the power amplifier and then applied to the excitation sensor. The sampling rate of the data acquisition card is set to 10 MHz. The amplitude results presented in this paper are the average of 50 valid measurements, and the random noise from a single acquisition is eliminated through multiple averaging.
4.2 Experiment and Analysis on Frequency-Selective Transmission of Guided Waves in T-Shaped Pipe
To verify the frequency-selective transmission characteristics of the designed metamaterial, frequency sweep analysis is performed on the T-shaped pipe with and without the metamaterial. Fig. 17 shows the frequency domain energy distribution results of the corresponding received signals. Fig. 17a,b is the frequency domain energy spectra of the left and right branches of the T-shaped pipe without the metamaterial, respectively. It can be seen that the energy distribution is relatively uniform throughout the entire analysis frequency band, and no obvious energy attenuation bandgap appears, indicating that the guided wave can propagate freely without the metamaterial. Fig. 17c shows the frequency domain energy distribution of the left branch after AMs-1 is installed. Under the action of AMs-1, significant energy attenuation occurs in the frequency band near 100 kHz, forming a clear bandgap region, indicating that the guided wave propagation in this frequency range is suppressed. Fig. 17d corresponds to the frequency domain energy spectrum of the right branch after AMs-2 is installed. AMs-2 shows an obvious stopband near 150 kHz, and the energy in this frequency band drops sharply, verifying its suppression effect on the guided wave of the target frequency. The above results confirm frequency-selective characteristics of the two metamaterial structures from a frequency-domain perspective. AMs-1 and AMs-2 can form a bandgap for 100 and 150 kHz, respectively, while having no significant impact on the guided wave propagation of other frequency components.

Figure 17: Frequency-domain energy distributions of received signals from the T-shaped pipe: (a) left branch without metamaterials, (b) right branch without metamaterials, (c) left branch with metamaterials, and (d) right branch with metamaterials.
To verify the frequency-selective propagation characteristics of metamaterials, guided wave signals of 100 and 150 kHz are excited in a T-shaped pipe with metamaterials. Fig. 18a shows the received signal waveforms of the left and right branches of the T-shaped pipe under 100 kHz guided wave excitation. It can be clearly observed from the figure that the left branch with the AMs-1 array attached has an extremely low received signal amplitude, with almost no effective signal detected. However, the right branch with the AMs-2 array attached can receive a guided wave signal with a significant amplitude and complete waveform, indicating that the 100 kHz guided wave can successfully propagate through the AMs-2 array. Fig. 18b shows the average amplitude quantization analysis results of the two received signals. The average amplitude of the received signal in the left branch is only 1.52 × 10⁻³ mV, while the average amplitude of the received signal in the right branch reaches 1.31 × 10⁻² mV, the latter being 8.62 times that of the former. Quantitatively, the transmission loss of the AMs-1 array in the left branch reaches −35.02 dB at 100 kHz, while the transmission loss of the right branch with AMs-2 at the same frequency is only −11.89 dB. The quantification results further corroborate that AMs-1 strongly suppress it, while AMs-2 does not significantly suppress it, thus enabling the preferential propagation of the guided wave in the right branch.

Figure 18: Received signals from the left and right branches of the T-shaped pipe with metamaterials: (a) time-domain signals and (b) average amplitude and transmission loss under 100 kHz excitation; (c) time-domain signals and (d) average amplitude and transmission loss under 150 kHz excitation.
Fig. 18c shows the received signal waveforms of the left and right branches of the T-shaped pipe at 150 kHz. When the excitation signal frequency is switched to 150 kHz, the propagation of the guided wave is significantly reversed. At this time, the left branch with AMs-1 attached can receive a guided wave signal with significant amplitude and a clear waveform, while the right branch with AMs-2 attached can hardly detect any effective received signal. This indicates that AMs-2 has a strong suppression effect on the 150 kHz guided wave, while AMs-1 has no obvious suppression effect on the guided wave at this frequency. The waveform differences between 100 and 150 kHz in experiments are caused by minor group velocity dispersion, multimode interference, and non-ideal experimental factors. Fig. 18d shows the average amplitude quantization results of the two received signals under 150 kHz excitation. The average amplitude of the received signal in the left branch is 1.98 × 10⁻² mV, while the average amplitude of the received signal in the right branch is only 2.10 × 10⁻³ mV. The amplitude of the left branch is 9.43 times that of the right branch. Quantitatively, the transmission loss of the AMs-2 array in the right branch reaches −30.82 dB at 150 kHz, while the transmission loss of the left branch with AMs-1 at the same frequency is only −9.51 dB, further verifying the strong suppression effect of AMs-2 on the target frequency guided wave.
The experimental results show that AMs-1 and AMs-2 arrays possess a clear frequency-selective propagation control function. When the excitation frequency is 100 kHz, the guided wave is suppressed by AMs-1 but can propagate smoothly through AMs-2, achieving frequency-selective transmission in the right branch of the T-shaped pipe. When the excitation frequency is 150 kHz, the guided wave is suppressed by AMs-2 but can propagate smoothly through AMs-1, achieving frequency-selective transmission in the left branch of the T-shaped pipe. This result demonstrates selective transmission and suppression of guided waves at different frequencies, providing support for the frequency-selective control of guided waves.
To provide further comparison, guided waves of 100 and 150 kHz are excited in the T-shaped pipe without metamaterials. Fig. 19a shows the received signal waveforms of the left and right branches of the T-shaped pipe without metamaterials under 100 kHz guided wave excitation. As can be seen from the figure, without metamaterial control, both the left and right branches of the T-shaped pipe can receive guided wave signals with significant amplitude and complete waveforms, without obvious signal suppression. Fig. 19b shows the average amplitude quantization results of the two received signals at this frequency. The average amplitude of the signal received in the left branch is 4.67 × 10⁻² mV, and the average amplitude of the signal received in the right branch is 4.12 × 10⁻² mV. The difference in amplitude between the two is small, with no obvious distinction. This indicates that without metamaterials, the 100 kHz guided wave can propagate simultaneously in both branches of the T-shaped pipe without frequency-selective transmission.

Figure 19: Received signals from the left and right branches of the T-shaped pipe without metamaterials: (a) time-domain signals and (b) average amplitudes under 100 kHz excitation; (c) time-domain signals and (d) average amplitudes under 150 kHz excitation.
Fig. 19c shows the received signal waveforms of the left and right branches of the T-shaped pipe without metamaterial under 150 kHz guided wave excitation. Consistent with the results under 100 kHz excitation, both branches can receive guided wave signals with significant amplitude and clear waveforms, without any signal suppression effect. Fig. 19d shows the average amplitude quantization results of the two received signals under 150 kHz excitation. The average amplitude of the signal received by the left branch is 4.98 × 10⁻² mV, and the average amplitude of the signal received by the right branch is 4.96 × 10⁻² mV. The amplitudes are basically the same, further verifying that the guided wave propagates indiscriminately in the two branches of the T-shaped pipe without the metamaterial. This result contrasts sharply with the frequency-selective transmission results after loading the metamaterial, further verifying the modulating effect of the metamaterial array on the frequency-selective propagation of the guided wave. It should be noted that the experimentally observed amplitude ratios between the two branches are consistently lower than the corresponding simulation predictions. For example, under 100 kHz excitation, the simulated amplitude ratio (right/left) is 24.57, whereas the experimental ratio is 8.62; under 150 kHz excitation, the simulated ratio (left/right) is 11.18, while the experimental ratio is 9.43. This indicates that the actual suppression performance of the metamaterials in the experiment is somewhat weaker than in the ideal simulation.
This discrepancy can be directly attributed to three non-ideal experimental factors that are inevitably simplified or omitted in numerical models: (1) Geometric and assembly imperfections: The numerical model assumes a perfectly periodic metamaterial array with exact structural dimensions. In contrast, the fabricated samples have machining tolerances of ±0.05 mm and minor assembly errors when bonded to the pipe surface. These imperfections break the ideal periodicity and degrade the local resonance condition, thereby reducing the effective bandgap attenuation. (2) Adhesive layer effects: Although the adhesive layer (epoxy resin) is shown in Fig. 9 to have a negligible effect on the simulated bandgap, this conclusion assumes a uniform, perfectly bonded layer. In practice, the epoxy layer exhibits thickness non-uniformity, small voids, and variable coupling stiffness, which introduce additional wave scattering and reduce the energy transfer efficiency from the pipe wall to the copper columns, weakening the resonant suppression. (3) Material damping and property deviations: The numerical model assumes purely elastic, lossless materials. In reality, stainless steel and copper exhibit intrinsic material damping, and the actual Young’s moduli and densities may deviate slightly from the ideal values listed in Table 1. Nevertheless, the experimental amplitude ratios still exhibit significant statistical discrimination and a clear frequency-selective transmission effect, fully validating the core conclusion of frequency-selective transmission.
This paper presents a systematic study on the frequency-selective transmission manipulation of ultrasonic guided waves in a T-shaped pipe. The design, optimization, numerical simulation, and experimental validation of acoustic metamaterials are carried out, which effectively address the issue of signal overlap between branches in guided wave testing of a T-shaped pipe. The main research achievements and conclusions are summarized as follows:
(1) A metamaterial unit consisting of a stainless steel substrate and a copper column is proposed. The mapping relationships between lattice constant, column diameter, column height, and bandgap characteristics are established. The bandgap width with good performance appears when the column diameter is about 0.8 times the lattice constant and when the column height is about 1.0 times the lattice constant. This law provides a theoretical basis for the rapid preliminary design of metamaterials.
(2) The PSO algorithm is employed to optimize the structural parameters of AMs-1 and AMs-2. After optimization, the bandgap width of AMs-1 is increased by 120.0%, with an effective bandwidth of 17.65 kHz. For AMs-2, the bandgap width is improved by 28.7%, and the effective bandwidth reaches 17.78 kHz, which is 8.43 times that of the initial design. The two metamaterials can accurately suppress guided waves at 100 and 150 kHz, respectively, realizing efficient optimization and precise matching of the target frequency bandgap. Tolerance sensitivity analysis shows that the design has excellent robustness against machining and assembly tolerances within ±0.05 mm.
(3) Both numerical simulations and experiments verify the frequency-selective propagation characteristic of the metamaterials. After integrating AMs-1 and AMs-2 into the left and right branches of the T-shaped pipe, guided waves only propagate along the right branch under 100 kHz excitation, and only along the left branch under 150 kHz excitation. Experimental results show that under 100 kHz excitation, the average amplitude of the signal in the right branch is 8.62 times that in the left branch; under 150 kHz excitation, the average amplitude of the signal in the left branch is 9.43 times that in the right branch. In the control group without metamaterials, the signal amplitudes in the two branches are nearly identical, showing no frequency-selective transmission behavior. These results confirm that the metamaterials enable precise manipulation of guided wave propagation paths.
The method proposed in this paper realizes active control of guided wave propagation paths and effectively eliminates signal overlap at the T-shaped pipe. It provides a novel technical route for efficient and reliable damage detection of ship piping systems. A limitation of this work is the lack of detailed characterization of T-junction mode conversion effects, as it focuses on metamaterial-based frequency-selective transmission design. Future research will deepen the analysis of mode conversion details and their engineering application in pipeline damage detection.
Acknowledgement: Not applicable.
Funding Statement: This work was supported in part by the National Natural Science Foundation of China under Grant 52375537 and 52405105.
Author Contributions: The authors confirm contribution to the paper as follows: study conception and design: Weiguo Chen, Xiaobin Hong, Bin Zhang; data collection: Weiguo Chen, Kai Chen, Yunyun Deng; analysis and interpretation of results: Weiguo Chen, Xiaobin Hong, Kai Chen; draft manuscript preparation: Weiguo Chen, Xiaobin Hong, Bin Zhang. All authors reviewed and approved the final version of the manuscript.
Availability of Data and Materials: The data that support the findings of this study are available from the corresponding author, Xiaobin Hong, upon reasonable request.
Ethics Approval: Not applicable. This study does not involve human participants or animal subjects.
Conflicts of Interest: The authors declare no conflicts of interest.
References
1. Fraga-Lamas P, Noceda-Davila D, Fernández-Caramés TM, Díaz-Bouza MA, Vilar-Montesinos M. Smart pipe system for a shipyard 4.0. Sensors. 2016;16(12):2186. doi:10.3390/s16122186. [Google Scholar] [PubMed] [CrossRef]
2. Guo Z, Liu X, Rao X, Yuan C. Effect of defects on the structural integrity of ship piping welds under simulated piping conditions. Ocean Eng. 2024;308(11):118372. doi:10.1016/j.oceaneng.2024.118372. [Google Scholar] [CrossRef]
3. Su P, Wu J, Chang G, Liu S, Feng X. The leakage identification and location of ship pipeline system based on vibration signal processing. Complexity. 2023;2023(1):9646710. doi:10.1155/2023/9646710. [Google Scholar] [CrossRef]
4. Zhao Y, Liu H, Tan M, Wu X, Hua R, Wang K, et al. Flow noise characteristics in a three-way pipe and its bionic optimization. Phys Fluids. 2025;37(7):075161. doi:10.1063/5.0275508. [Google Scholar] [CrossRef]
5. Kozuh S, Gojic M, Vrasalovic L, Ivkovic B. Corrosion failure and microstructure analysis of AISI 316L SS for shio pipeline before and after welding. Kovove Mater. 2021;51(1):53–61. doi:10.4149/km_2013_1_53. [Google Scholar] [CrossRef]
6. Makarenko VD, Chygyrynets OE, Vynnykov YL, Gots VI, Maksymov SY, Pipa VV, et al. Degradation of ship pipe metal due to long-term operation. Strength Mater. 2024;56(2):292–7. doi:10.1007/s11223-024-00648-2. [Google Scholar] [CrossRef]
7. Lawal SL, Afolalu SA, Jen TC, Akinlabi ET. Corrosion control and its application in marine environment—a review. SSP. 2024;355:61–73. doi:10.4028/p-634sdi. [Google Scholar] [CrossRef]
8. Lin H, Huang X, Chen Z, He G, Xi C, Li W. Matching pursuit network: an interpretable sparse time-frequency representation method toward mechanical fault diagnosis. IEEE Trans Neural Netw Learn Syst. 2025;36(7):12377–88. doi:10.1109/TNNLS.2024.3483954. [Google Scholar] [PubMed] [CrossRef]
9. Ho M, El-Borgi S, Patil D, Song G. Inspection and monitoring systems subsea pipelines: a review paper. Struct Heal Monit. 2020;19(2):606–45. doi:10.1177/1475921719837718. [Google Scholar] [CrossRef]
10. Ma Q, Tian G, Zeng Y, Li R, Song H, Wang Z, et al. Pipeline in-line inspection method, instrumentation and data management. Sensors. 2021;21(11):3862. doi:10.3390/s21113862. [Google Scholar] [PubMed] [CrossRef]
11. Lowe MJS, Alleyne DN, Cawley P. Defect detection in pipes using guided waves. Ultrasonics. 1998;36(1–5):147–54. doi:10.1016/S0041-624X(97)00038-3. [Google Scholar] [CrossRef]
12. Yue Y, Chen T, Zhang L, Abdelsalam M, Musanyufu J. The frequency selection of SH0 waves for total transmission and its application in the damage detection of aircrafts. Comput Model Eng Sci. 2020;122(1):259–72. doi:10.32604/cmes.2020.07218. [Google Scholar] [CrossRef]
13. Zang X, Xu ZD, Lu H, Zhu C, Zhang Z. Ultrasonic guided wave techniques and applications in pipeline defect detection: a review. Int J Press Vessels Pip. 2023;206(4):105033. doi:10.1016/j.ijpvp.2023.105033. [Google Scholar] [CrossRef]
14. Chen Z, Shen J, Xia J, He J, Lin H, Gao Y, et al. MS-DAWCAE: multi-scale deep adversarial wavelet convolutional autoencoder toward unseen fault diagnosis with limited data. Mech Syst Signal Process. 2026;249(13):114042. doi:10.1016/j.ymssp.2026.114042. [Google Scholar] [CrossRef]
15. Yang Z, Yang H, Tian T, Deng D, Hu M, Ma J, et al. A review on guided-ultrasonic-wave-based structural health monitoring: from fundamental theory to machine learning techniques. Ultrasonics. 2023;133(4):107014. doi:10.1016/j.ultras.2023.107014. [Google Scholar] [PubMed] [CrossRef]
16. Rose JL. Ultrasonic guided waves in solid media. Cambridge, UK: Cambridge University Press; 2014. doi:10.1017/cbo9781107273610. [Google Scholar] [CrossRef]
17. Maruyama T, Matsuo T, Nakahata K. Numerical study on guided-wave reflection and transmission at water pipe joint using hybrid finite element method. Comput Mech. 2025;75(1):285–300. doi:10.1007/s00466-024-02505-0. [Google Scholar] [CrossRef]
18. Chen W, Hong X, Yue J, Chen J, Xu G, Zhang B. Wide-bandgap waves control metamaterial design and inner layer damage visualisation method for layered thin-walled metal structures using ultrasonics guided waves. Nondestruct Test Eval. 2025:1–28. doi:10.1080/10589759.2025.2548339. [Google Scholar] [CrossRef]
19. Zhang Y, Wu W, Wu W, Wang L, Zhang B. Guided wave-based inspection for pipe bends in marine seawater pipelines. IEEE Access. 2025;13:167493–500. doi:10.1109/ACCESS.2025.3612291. [Google Scholar] [CrossRef]
20. Jan H, Sulaiman M, Ahmad Khan N, Alshammari FS, Laouini G, Ashraf R, et al. Improved pipeline damage detection using flexural and torsional ultrasonic guided waves. Res Math. 2026;13(1):2648988. doi:10.1080/27684830.2026.2648988. [Google Scholar] [CrossRef]
21. El Bakkali M, Lhémery A, Baronian V, Chapuis B. Guided wave propagation and scattering in pipeworks comprising elbows: theoretical and experimental results. J Phys Conf Ser. 2015;581(1):012011. doi:10.1088/1742-6596/581/1/012011. [Google Scholar] [CrossRef]
22. Huan H, Liu L, Liu J, Huang L, Peng C, Wang H, et al. Modeling of axisymmetric ultrasonic waves reflected from circumferential notches in a pipe based on a rigorous analytical theory and implementation on distributed devices. J Nondestruct Eval. 2024;43(3):97. doi:10.1007/s10921-024-01117-1. [Google Scholar] [CrossRef]
23. Ma L, Bao R, Zhu J, Zeng T, Cheng L, Zhang J, et al. A lightweight network for defect detection in polyethylene pipelines using multi-mode ultrasonic guided waves. Eng Res Express. 2025;7(3):035551. doi:10.1088/2631-8695/adfa6e. [Google Scholar] [CrossRef]
24. Cummer SA, Christensen J, Alù A. Controlling sound with acoustic metamaterials. Nat Rev Mater. 2016;1(3):16001. doi:10.1038/natrevmats.2016.1. [Google Scholar] [CrossRef]
25. Chen W, Hong X, Chen J, Yang D, Zhang A, Yue J. S0 mode selective metamaterial-based ultrasonic guided wave damage detection in thin-walled metal plate. IEEE Trans Instrum Meas. 2025;74:3549312. doi:10.1109/TIM.2025.3588934. [Google Scholar] [CrossRef]
26. Liu Z, Shan S, Zhang C, Cheng L. Effective generation of shear horizontal waves from Lamb waves by meta-converters. Mech Syst Signal Process. 2025;241:113516. doi:10.1016/j.ymssp.2025.113516. [Google Scholar] [CrossRef]
27. Wu W, Wang Y, Gao Z, Liu P. Topology optimization of metamaterial microstructures for negative Poisson’s ratio under large deformation using a gradient-free method. Comput Model Eng Sci. 2024;139(2):2001–26. doi:10.32604/cmes.2023.046670. [Google Scholar] [CrossRef]
28. Oudich M, Gerard NJ, Deng Y, Jing Y. Tailoring structure-borne sound through bandgap engineering in phononic crystals and metamaterials: a comprehensive review. Adv Funct Mater. 2023;33(2):2206309. doi:10.1002/adfm.202206309. [Google Scholar] [CrossRef]
29. Chen W, Hong X, Yang D, Chen J, Li Z. Multi-bandgap metamaterial-based suppression of nonlinear multi-harmonic signals in ultrasonic guided wave. Appl Acoust. 2026;246(12):111248. doi:10.1016/j.apacoust.2026.111248. [Google Scholar] [CrossRef]
30. Aslam M, Boris I, Lee J. Numerical investigation of bandgap characteristics in integrated metallic metafilters for nonlinear guided wave applications. APL Mater. 2024;12(11):111109. doi:10.1063/5.0219860. [Google Scholar] [CrossRef]
31. Pillarisetti LSS, Lissenden CJ, Shokouhi P. Control of low-frequency guided elastic wave modes in a hollow pipe using a meta-surface. AIP Adv. 2022;12(8):085027. doi:10.1063/5.0098576. [Google Scholar] [CrossRef]
32. Xu J, Yang H, Chen J, Sui D, Zhou J, Xiao H, et al. Novel surface-attached resonant acoustic metamaterials for vibration and noise reduction in the natural gas pipeline. Compos Struct. 2026;376(6):119831. doi:10.1016/j.compstruct.2025.119831. [Google Scholar] [CrossRef]
33. Gao M, Ng CT, Lin J, Kotousov A. Damage detection in circular tubes using nonlinear ultrasonic guided waves with metasurface. Thin Walled Struct. 2025;214:113384. doi:10.1016/j.tws.2025.113384. [Google Scholar] [CrossRef]
34. Okudan G, Danawe H, Zhang L, Ozevin D, Tol S. Enhancing acoustic emission characteristics in pipe-like structures with gradient-index phononic crystal lens. Materials. 2021;14(6):1552. doi:10.3390/ma14061552. [Google Scholar] [PubMed] [CrossRef]
35. Liang F, Chen Y, Guan D, Li J. Low-frequency band gap characteristics of a novel spinning metamaterial pipe with Timoshenko model. J Sound Vibr. 2022;541(1):117316. doi:10.1016/j.jsv.2022.117316. [Google Scholar] [CrossRef]
36. Li P, Zhang Z, Wang W, Ji W, Yu T, Gao P. Vibration manipulation properties of phononic crystals and acoustic metamaterials for fluid-conveying pipeline systems: a review. J Vibr Eng Technol. 2025;13(1):114. doi:10.1007/s42417-024-01673-w. [Google Scholar] [CrossRef]
37. Wu TT, Huang ZG, Tsai TC, Wu TC. Evidence of complete band gap and resonances in a plate with periodic stubbed surface. Appl Phys Lett. 2008;93(11):111902. doi:10.1063/1.2970992. [Google Scholar] [CrossRef]
38. Nobrega ED, Gautier F, Pelat A, Dos Santos JMC. Vibration band gaps for elastic metamaterial rods using wave finite element method. Mech Syst Signal Process. 2016;79(2):192–202. doi:10.1016/j.ymssp.2016.02.059. [Google Scholar] [CrossRef]
39. Hakoda C, Rose J, Shokouhi P, Lissenden C. Using Floquet periodicity to easily calculate dispersion curves and wave structures of homogeneous waveguides. AIP Conf Proc. 2018;1949:020016. doi:10.1063/1.5031513. [Google Scholar] [CrossRef]
40. Tikani V, Ziaei-Rad S, Moosavi H. Bandgap and wave attenuation optimization of tetra-chiral metamaterial using PSO algorithm. J Vibr Control. 2024;30(11–12):2402–13. doi:10.1177/10775463231177489. [Google Scholar] [CrossRef]
41. Chen W, Zhang A, Chen J, Hong X. Gradient acoustic focusing metamaterial-based ultrasonic guided wave energy enhancement for minor damage detection. Measurement. 2026;276(2):121407. doi:10.1016/j.measurement.2026.121407. [Google Scholar] [CrossRef]
42. Pan T, Yang F, Jiang C, Shen X, Yang X, Peng W, et al. Structural optimization and performance analysis of acoustic metamaterials with parallel unequal cavities. Materials. 2025;18(13):3087. doi:10.3390/ma18133087. [Google Scholar] [PubMed] [CrossRef]
Cite This Article
 Copyright © 2026 The Author(s). Published by Tech Science Press.
This work is licensed under a Creative Commons Attribution 4.0 International License , which permits unrestricted use, distribution, and reproduction in any medium, provided the original work is properly cited.
 Downloads
 Citation Tools