
 Login
Login Register
 Submit a Paper
 Propose a Special lssue
 Open Access
ARTICLE
Novel Dynamic Security Assessment Technique for Data Driven Stability Analysis with False Data Injection Attack Prediction in Smart Grid
1 Center for Cyber Security, Faculty of Information Science and Technology, Universiti Kebangsaan Malaysia (UKM), Bangi, Hulu Langat, Malaysia
2 Institute of Computer Science and Digital Innovation, UCSI University, Kuala Lumpur, Malaysia
3 Centre for Telecommunication Research and Innovation, Fakulti Teknologi dan Kejuruteraan Elektronik dan Komputer, Universiti Teknikal Malaysia Melaka, Durian Tunggal, Melaka, Malaysia
4 Department of Information Technology and Systems, Victorian Institute of Technology, Melbourne, Australia
* Corresponding Authors: Mohammad Kamrul Hasan. Email: ; Shayla Islam. Email:
; A. K. M. Zakir Hossain. Email:
Computer Modeling in Engineering & Sciences 2026, 148(3), 48 https://doi.org/10.32604/cmes.2026.083521
Received 05 April 2026; Accepted 24 June 2026; Issue published 28 September 2026
 View Full Text
 Download PDF
Abstract
Dynamic security assessment (DSA) of power system devices in smart grid (SG) power systems is currently essential for minimizing widespread blackouts and preventing cyberattacks. For stability processes that are difficult to perform in real time, security evaluation approaches for current SG devices may therefore require extensive historical domain training. Given that predictions are instantaneous, machine learning (ML) can be used to predict DSA. To classify and predict the time margin and transient energy margin (TEM) for a specific fault position and operating condition, input features, reactive power outputs, SG device transient energy function (TEF) terms, and fault location are used. False data injection (FDI) attacks are analyzed to predict the vulnerability using the developed Stacked Autoencoder (SAE) with ML models. In particular, the hybrid voting machine classifier (VMC) values are modified, and the data features are used to identify attack targets. The proposed technique is more effective because it uses ML models to develop an instance-based DSA method that identifies high-importance features to inform effective predictive countermeasures against FDI attacks in the SG system. The proposed algorithm’s viability is confirmed using test power systems on the real-time 128-feature IEEE 3-bus dataset and our developed Industrial Internet of Things (IIoT) dataset, namely the UKMNCT_IIoT_FDIA dataset (Published in Data in Brief; dataset available at: https://zenodo.org/records/14864902).Keywords
There are significant changes in how the power system operates and in power system equipment (e.g., smart meters, consumer-based power generation, voltage or current controllers, smart relays, power converters, etc.) in SG, which constitute the modern form of the electric grid system. Power consumption may be considered flexible and controllable rather than production [1–3]. It is especially difficult to assess the reliability and stability of electronic device systems due to growing uncertainty [4–6]. The potential of an integrating power grid to maintain synchronism during a significant disturbance is referred to as transient stability.
Transient stability assessment (TSA) evaluations are the most computationally demanding and typically require substantial computing time. For time-limited assessments in real-time operations and control planning, traditional model-based approaches are sufficient for reliable TSA. The power system’s stability is evaluated using real-time dynamic security assessments (DSA) across several plausible scenarios. The DSA is a viable means of safeguarding the power system against these threats, enabling operators to maintain reliable, secure operation despite growing complexity and unpredictability. Modern power systems collect and use extensive real-time data from power system devices; therefore, data-driven approaches can be a valuable resource for DSA to address these issues. The increasing number of data-driven methods has made robustness, classification/prediction, and feature-selection enhancement crucial to improving DSA’s accuracy, effectiveness, and resilience in SG power system devices. This research necessitates the numerical solution of several nonlinear differential and algebraic equations. Because conventional techniques require extensive computational processing, their solutions are insufficient [7–9]. For reliable, Internet of Things (IoT)-enabled phasor measurement unit (PMU)-and Supervisory Control and Data Acquisition (SCADA)-based SG operation and control, DSA is essential. Because of growing demand, privatization, and competitiveness in the electrical industry, modern power systems must function in stressful situations close to their stability limitations, and the response from grid-forming converters’ inertia constant is 10 s [10]. In these circumstances, even a small disruption may cause the system to become unstable. Therefore, an evaluation of online security in SG devices is urgently needed.
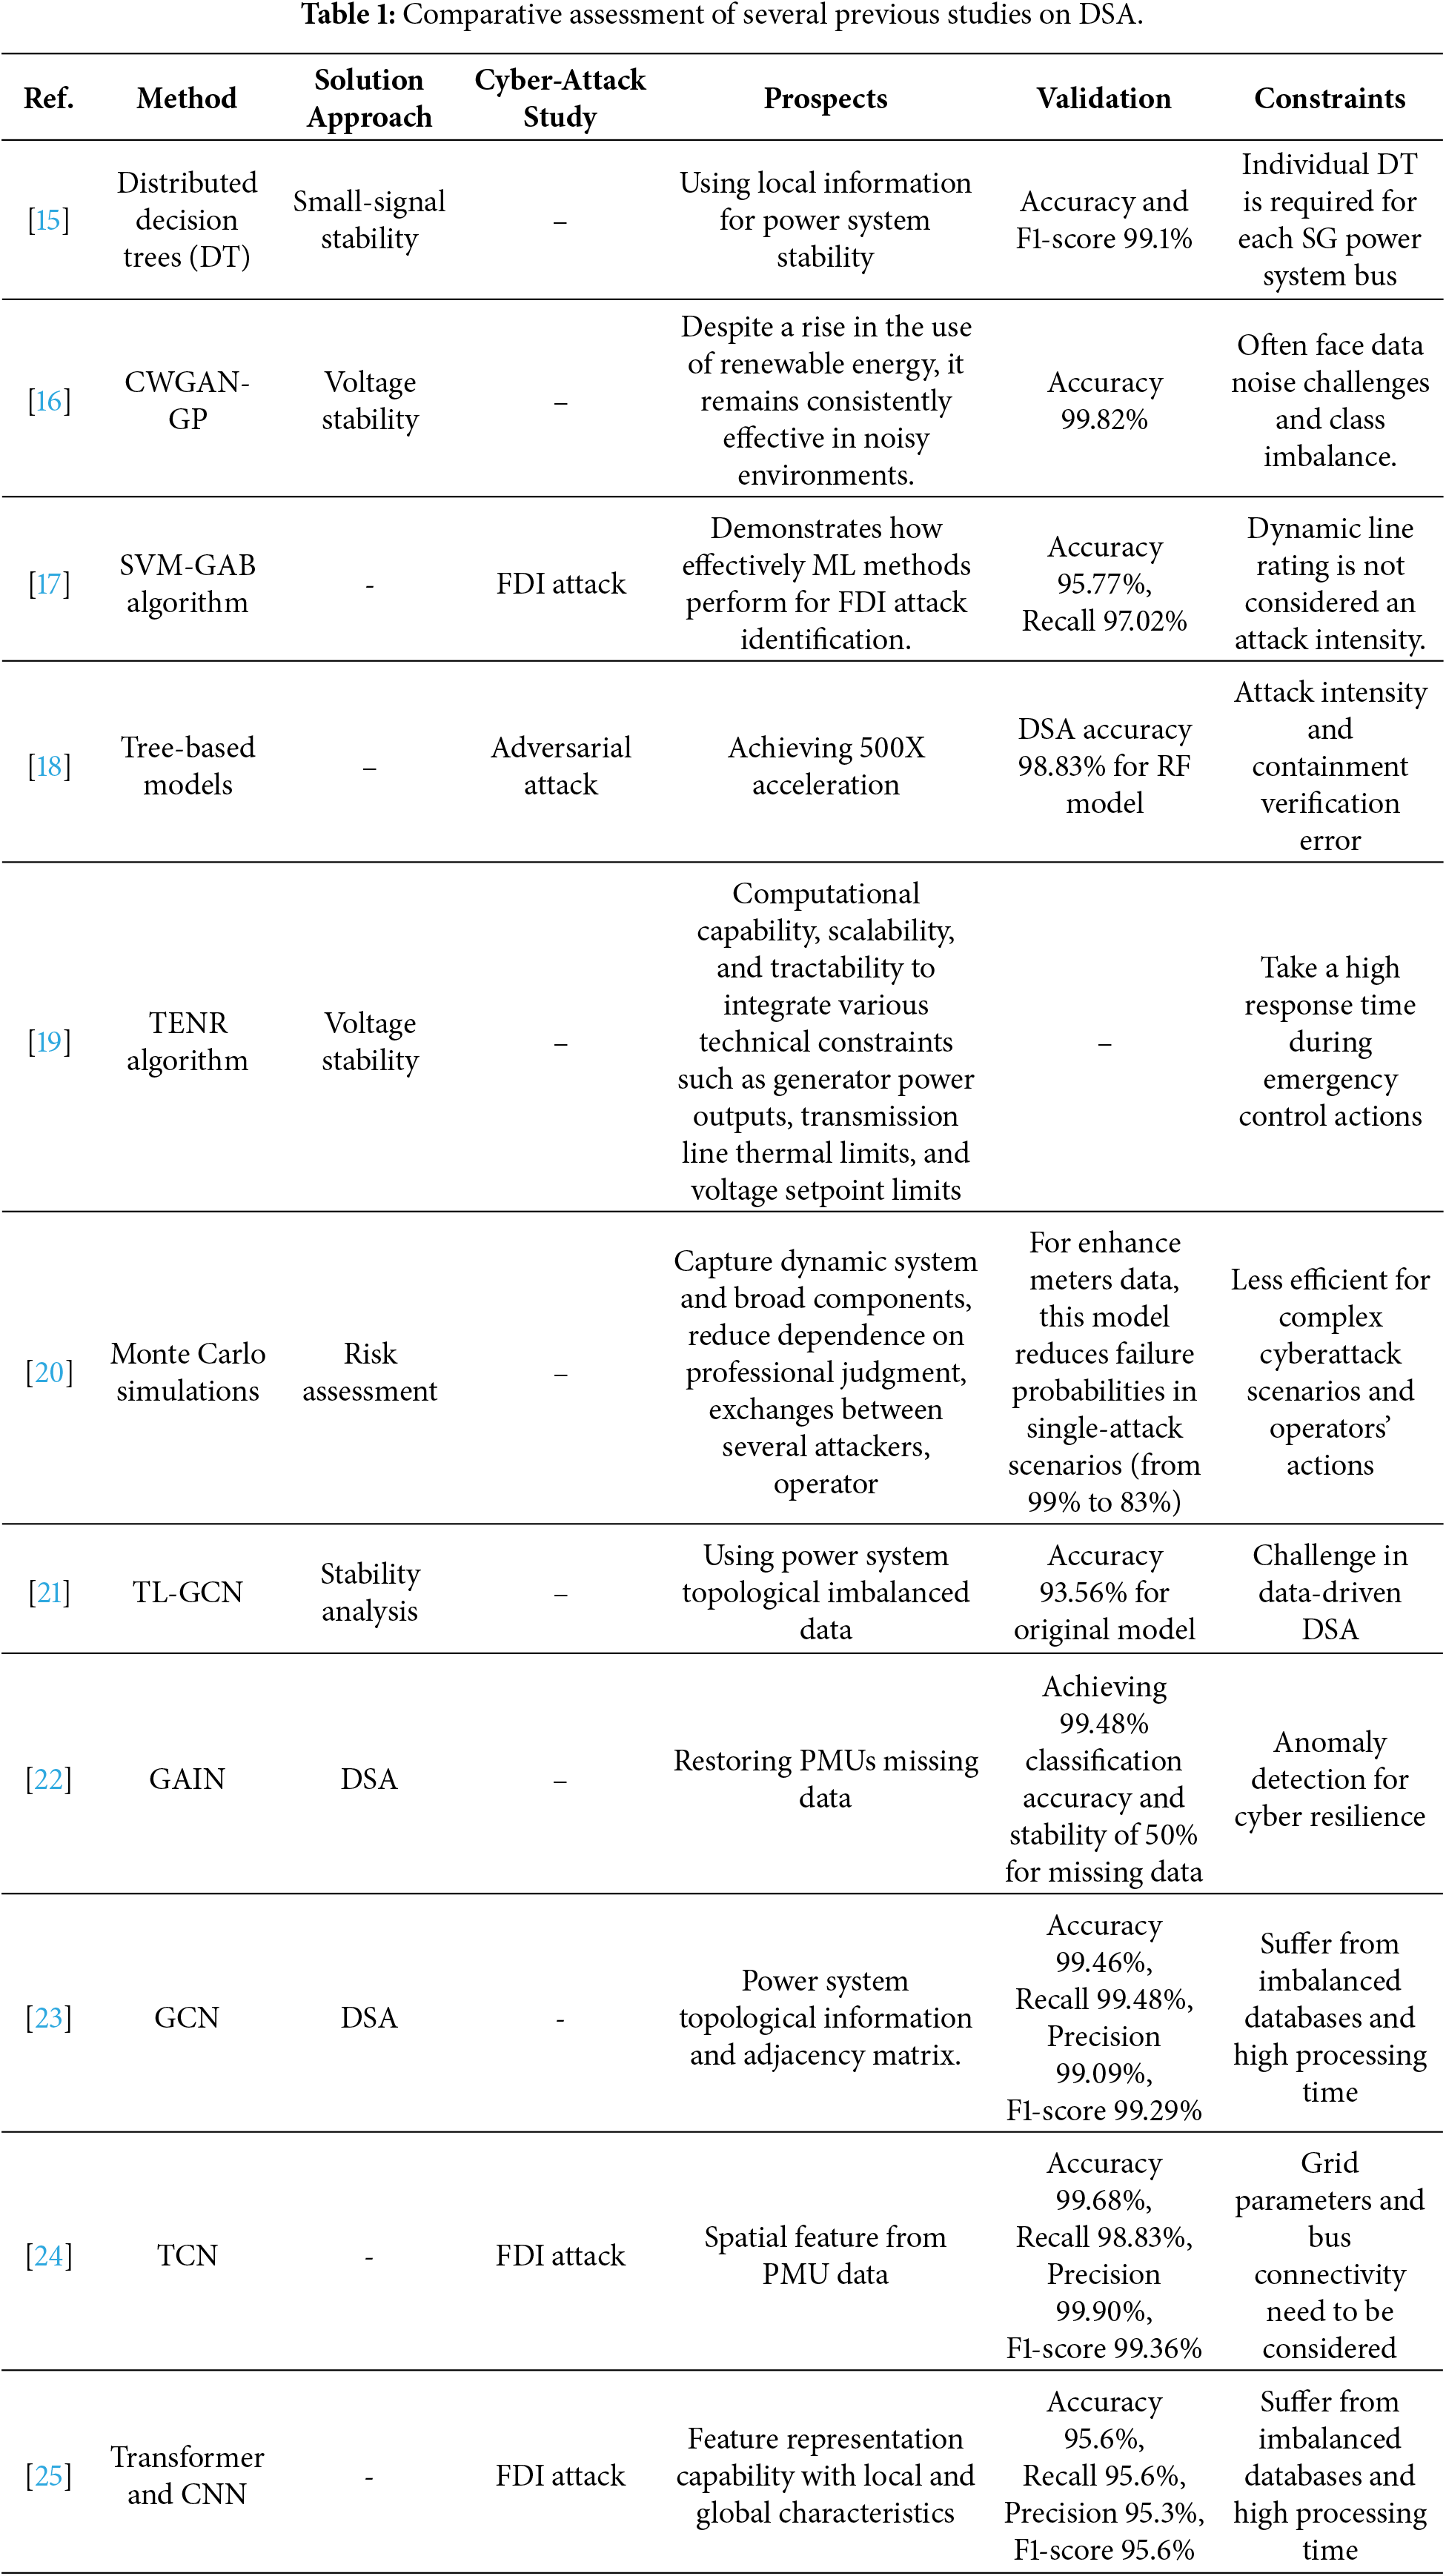
Measurements, communication, modeling, computation, and visualization are the categories in which all online DSA activities occur. After reviewing current traditional approaches to power system DSA, it is determined that, due to their computational complexity, none are appropriate for online DSA. As a result, this study aims to develop a rapid, straightforward, and reliable method for real-time DSA. Data-driven techniques for rapid and effective Hybrid extreme learning machine (ELM)-based DSA algorithms have recently been proposed, achieving 100% classification accuracy for transient stability [8]. These techniques build assessment models using ELM algorithms and large volumes of simulation data. Although hybrid approaches integrating ML models with other methods have also been investigated, power system operators often disregard ML models and their forecasts, even though their accuracy has long been recognized. Evaluating the credibility of the ML model and each prediction is essential to ensuring that the Stacked Autoencoders-Machine Learning (SAE-ML) algorithm operates successfully on real-world data and produces accurate predictions. The developed models may produce inaccurate results due to environmental factors and various cyber-attacks (such as FDI attacks, Denial of Service (DoS), Distributed Denial of Service (DDoS), Man-in-the-Middle (MITM), and Adversarial attacks) throughout data transfer and storage [11–14]. The FDI attack in data-driven DSA algorithms could represent significant security risks to power systems during implementation. A summary of recent studies on DSA is presented in Table 1.
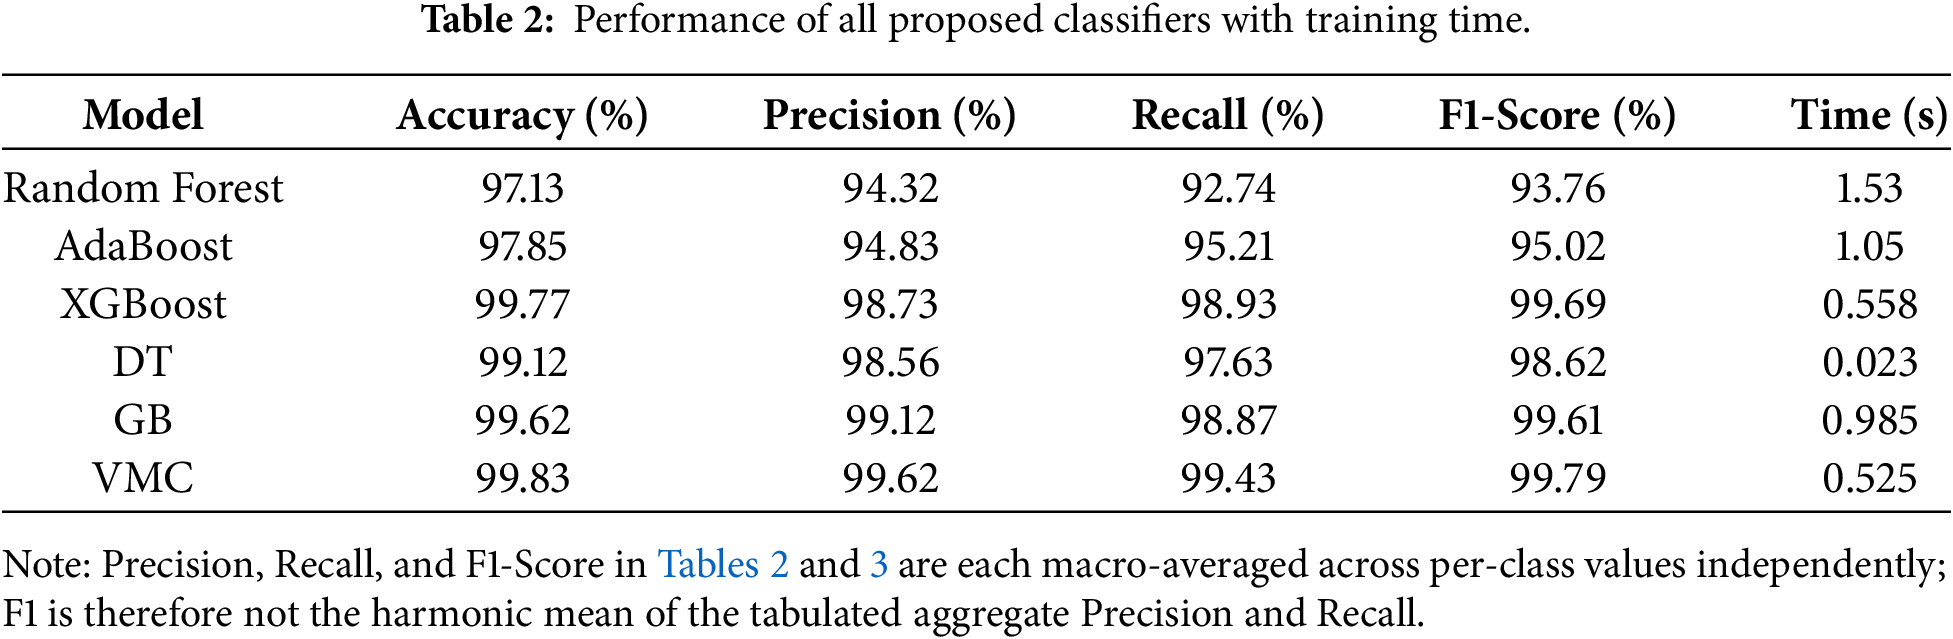
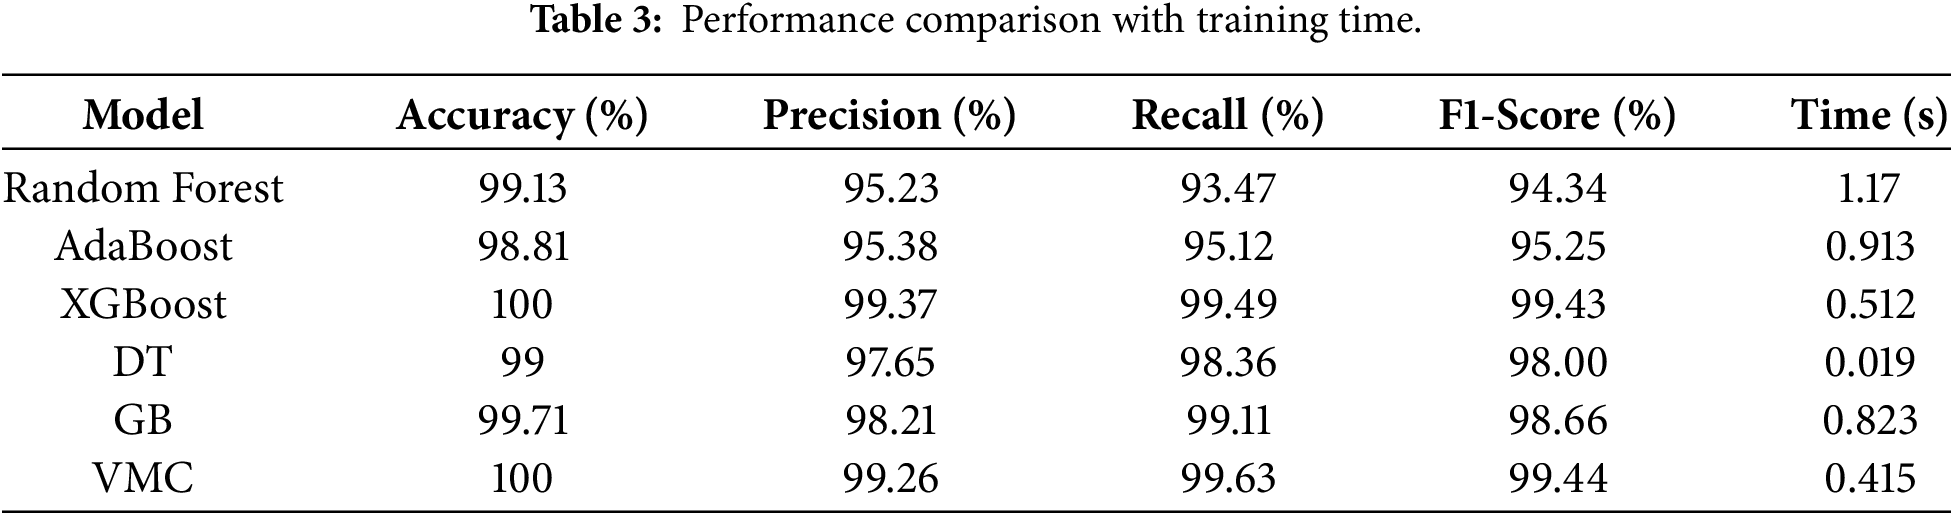
This study proposed a novel Stacked Autoencoder and Voting Machine Classifier (SAE-VMC) model for a dynamic security assessment technique for smart grid voltage stability and risk assessment with FDI attack prediction. The proposed model achieved 99.83% accuracy and 99.79% F1-score with a trade-off performance of 0.525 s.
Adversarial models may help users better understand the algorithm's framework, such as how decision boundaries are established and what each data characteristic indicates. Interpretable ML provides a more comprehensive explanation of ML projections as well as a deeper grasp of the value of the features. Furthermore, interpreting the ML model can identify possible methods to modify the model’s design to make it more resilient to these hostile circumstances. According to the existing literature highlighted in Table 1, cyberattacks might instantly cause undetectable disruptions to a well-performing learning model. Such FDI attacks in data-driven DSA models could create significant security risks to power systems during implementation. Classifications of disturbed data during training, the application of FDI training approaches from the field of ML has demonstrated potential in enhancing model generalization, according to the studies that are currently available. This motivates the model to acquire characteristics that are resistant to possible gaps, power system stability, or intrusion detection. The robustness of SAE-VMC algorithms can be enhanced by effectively utilizing certain FDI instances. It is essential to consider the types of FDI that could disrupt models and to develop effective defenses against them, while simultaneously developing robust SAE-VMC models to counter FDI attacks.
Previously published works in the literature review only focus on stability analysis, risk assessment, or FDI attack detection. To the best of our knowledge, this study is the first to present DSA (stability analysis or risk assessment) under an FDI attack prediction for the power system of an SG electronic device that relies on a multi-stage learning system-based ML algorithm, addressing the aforementioned problems. The proposed method uses DSA interpretability to construct more effective false data instances for FDI attacks, which in turn strengthens model robustness for data-driven DSA, risk assessment, and FDI attack prediction. The study's primary contributions are as follows:
• For DSA, a multi-stage learning system based on a novel SAE-VMC ensemble method is proposed. This method can increase the accuracy of the presented system while addressing instability, risk factors, and overtraining problems. The theoretical analysis is presented in Section 2, and the experimental results are presented in Sections 5 and 5.2.
• For effective implementation of preventative control measures, a time margin-based analysis is conducted. The theoretical analysis is presented in Section 3.
• The real-time power system DSA dataset and IIoT dataset are used to train tree-based classifiers, and each classifier performs a statistical analysis based on SAE-Voting Machine Classifier (VMC) for smart grid applications. This allows for the quantification of feature relevance, expressing the FDI attack prediction and the magnitude of each characteristic’s impact on the proposed solution for electronics devices. The experimental results are presented in Sections 5 and 5.4.
• We explain our proposed DSA algorithm architecture, which can significantly improve the explainability and interpretability of cybersecurity systems in SG and IIoT device networks.
The remainder of the manuscript is organized as follows. Section 2 presents the literature review. Section 3 discusses power system stability, risk assessment, and FDI attack state estimation. Section 4 presents the SAE-VMC model training for DSA. The proposed model simulation and results are presented in Section 5. Finally, this manuscript is concluded in Section 6.
2.1 Reliability and Stability Analysis
Adequacy and security are two requirements for the reliability of the power system in an SG. In the SG system, adequacy refers to the ability of the power system to continue supplying sufficient electrical power to end users despite failures of system resources. Adequacy is often indicated by metrics such as the predicted electricity deficit or the probability of demand loss over hours, days, weeks, months, or years. The amount of expected electricity system disruptions or emergencies that the system can withstand without compromising service to end users is referred to as the system’s security [26,27]. Both security and adequacy are necessary for the grid to be reliable. The capability of the electrical grid to consistently provide power to end consumers with a sufficiently high probability, given system resource interruptions, is known as adequacy. Therefore, adequacy concerns the availability function over an extended period, while security emphasizes short-term or real-time requirements and operational control methods [28]. The probability of modifications and the current state of the system’s operation determine its security. Static and DSA are two aspects that must be separated when examining the SG system’s security. It is critical to determine how well the newly established post-disturbance operating situation, once the electricity network has settled, satisfies the physical limits of power systems that have experienced a disturbance of any scale. This is known as a static security assessment, which combines confirmation that the machinery’s specifications and voltage limits are still met with a steady-state investigation of the post-disturbance functional state. By simulating energy regulations, obstacles, and machinery assessments for both pre- and post-fault operational situations associated with stability-constrained optimization of electricity transfer issues, static security can be taken into consideration in real-time operation [29–31]. Analyzing how the system maintains itself following the shift during the pre-to-post-disturbance situation is known as the DSA. It is challenging to consider DSA in operations, and it is frequently ignored in favor of more restrictive static security limitations. Typically, the DSA involves examining a variety of power system stability phenomena, including rotor angle stability, voltage stability, and frequency stability as defined in [32]. The ability of the SG power system to maintain a constant frequency during an anomaly with significant discrepancies between power production and consumption is referred to as frequency stability. These stability processes are differentiated to properly handle the stability assessment, even though there is a single problem that refers to the continuation of functioning operations during a disturbance. Various variables and analytical techniques are usually employed to evaluate these specific occurrences. A summary of the assessment of many different types of stability is presented in [32–34]. Time-domain computations may be necessary for evaluating nonlinear systems, which is essential for studying specific instances of these stability conditions, such as transient stability, voltage stability, and frequency stability. Because stability assessment is an important aspect of a comprehensive assessment of dynamic security, evaluating DSA in real time for every potential disruption is computationally difficult [35,36]. Because operating circumstances are typically unpredictable and becoming increasingly sophisticated, it might be difficult to evaluate DSA in advance of real-time operation. As a result, there may be several potential operational situations that require careful consideration. More details of reliability and stability analysis are in Sections 3.1–3.3.
2.2 Dynamic Security Assessment
To ensure a continuous supply of power for users and enhance system reliability, dynamic security must be assessed and predicted during the development and execution of complex electric power systems (EPSs). Furthermore, the EPS must manage several intermittent renewable energy (RE) sources and various customer types, which contribute to the complicated nature of system operation, making secure operation difficult to achieve. In consideration of this specific difficulty, studies aimed at enhancing DSA are crucial for ensuring secure operation and enabling the transmission system operator (TSO) to carry out appropriate control operations in continuous time [19,37,38]. However, it is difficult for the TSO to identify instability risk in real-time using an analytical model. Through the DSA framework, small-signal stability assessment measures the power system’s resilience to maintain synchronism following an insignificant interruption [39]. This issue is associated with the investigation of the intrinsic electromechanical oscillations in electrical grids. Therefore, determining whether the framework can maintain or attain an improved stable operating state during the post-disturbance stage becomes the primary goal of the analysis. Finding out whether the overall electrical damping ratio corresponds to the minimum transmission threshold at a particular operational position is the next stage, assuming the arrangement is stable. They can induce blackouts and system instability if they are not sufficiently minimized [15]. Since the EPS must manage multiple variable sources and various RE sources, which raises the complexity of communication management, secure operation becomes difficult to accomplish.
The linearized formulation associated with EPS enables an analytical method for identifying electrical oscillations and would be suitable for small disruption investigations. Inadequately dampening oscillations might exhibit several effects and causes, which can be analyzed using a linearized state matrix [40,41]. For the TSO, identifying instability risk in real time using a theoretical framework is a difficult task. The integrated electrical system model’s capacity to accurately capture the dynamic behavior of the EPS may be limited by its susceptibility to uncertainty. Furthermore, the main attributes of an SG are variation, diversity, and flexibility, which increase the uncertainty of a model-based approach [42].
The SG environment presents a setting containing a significant quantity of available metrics, enabling real-time monitoring with an extensive possibility for performance optimization, despite the growth of configurations making modeling EPSs problematic. Data analytics can be used to create stability analysis predictive models utilizing a global positioning system (GPS) synchronized with PMUs. These models can be used in real time to assist decisions [15,43,44]. There are still many issues with DSA reliability management. Considering DSA in real-time processes presents a technological barrier. In real-time scenarios, most operators still choose higher static security limitations over DSA. The technical limitation that keeps DSA from being considered in real-time operations is the computing complexity of the current challenge. To address this technical problem, this work suggests using ML within DSA vulnerability evaluation.
2.3 Machine Learning for Dynamic Security Assessment
The DSA reliability management has been suggested to benefit from using ML. Security vulnerabilities frequently discovered in sensing and control devices incorporated into SG for mission-critical monitoring exacerbate the previously identified cybersecurity problem. For instance, real-time power quality data transmitted over a SCADA network and synchronous data gathered by PMUs are commonly used by ML-based SG applications. It has been reported that this particular SCADA data is vulnerable to covert manipulation [45–47]. However, power systems are vulnerable to cyberattacks due to the flaws in IoT-based devices. To overcome the technical obstacle of instantaneous DSA being too computationally expensive, ML is being used in DSA [8,16]. The theory indicates that the ML approach may directly anticipate the DSA included in these stability studies, or it can forecast the result of a stability analysis without performing the analysis using standard stability methods. Fig. 1 shows how ML is used in the DSA context. Compared with traditional methods such as computationally demanding time-domain simulations, ML offers the advantage of immediate forecast availability. A select group of power system operations in Canada and in a large-scale European project called an effective resource for EPS security for large areas (iTesla) project investigated the suitability of these ML techniques for real-time operations in control rooms [48]. The results showed promise, though many challenges remain to be overcome. This training process, which usually consists of five steps as shown in Fig. 1, is completed effectively in advance of real-time operations. The first stage is generating data from the EPS; the second is data pre-processing; the third is training the model; the fourth is learning the model (training security rules); and the fifth is updating and validating the ML model.
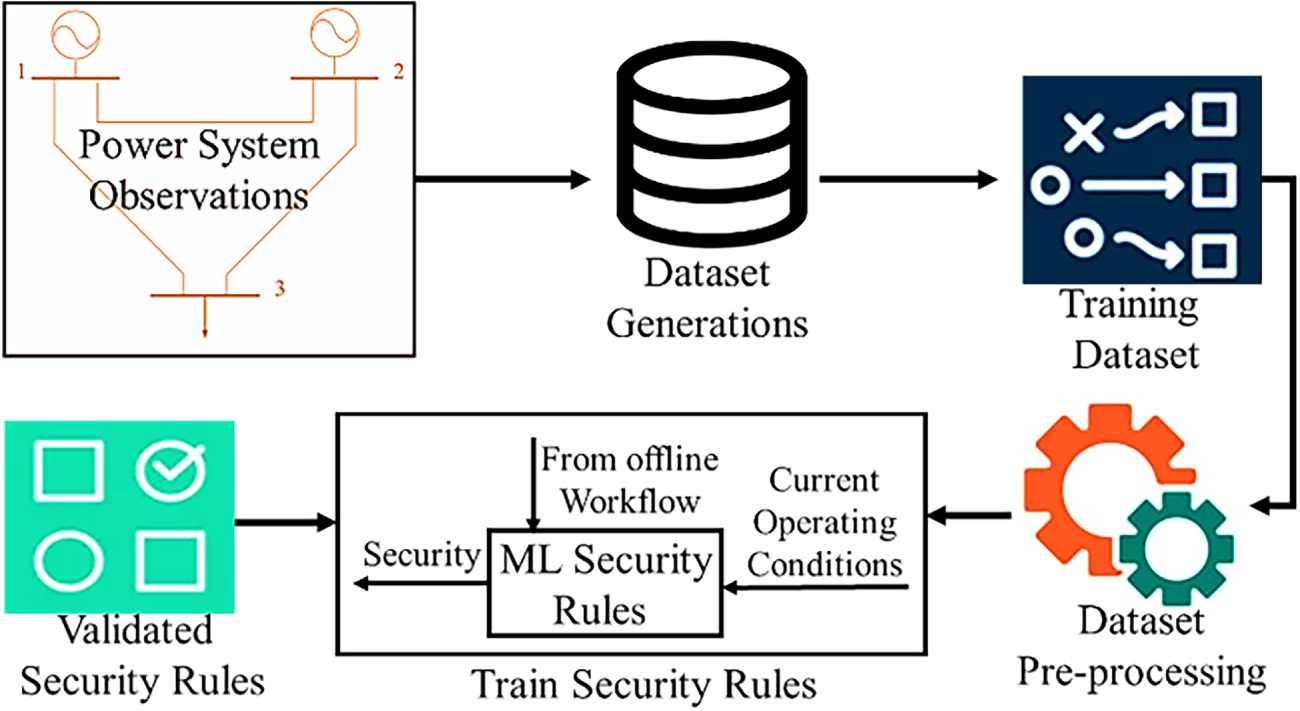
Figure 1: ML-based offline DSA.
By doing it this way, risky scenarios and unstable EPS conditions might be identified ahead of time, and preventive actions like rescheduling generation would be implemented to bring the entire system closer to a safe operating point. Given the abundance of real-time data gathered and employed in contemporary EPS, data-driven techniques can be an effective tool for DSA in addressing these issues. The development of data-driven approaches has led to the identification of feature selection and classification, actual load forecast, cyberattack prediction, and stability enhancement as critical areas for improving DSA’s accuracy, efficiency, and resilience [11,18,49]. As stated previously, the advancement of wide-area measurement (WAM) systems made it possible to use ML methods for handling power system security evaluation and real-time prediction.
Currently, many ML techniques have been used, such as support vector machines (SVM) [50,51], random vector functional links [18,52], tree-based models [15,18], extreme learning machines [18,53], and game theory models for anomaly detection [54,55]. These models use system parameters, synchronized metrics, and historical data to describe the EPS dynamic features and nonlinear interactions. Furthermore, EPS data exhibits complex relationships that can be effectively captured by ensemble methods such as gradient boosting [56,57] and random forests [58], improving data classification and attack prediction accuracy. In addition, dimensionality reduction and feature selection techniques are used to identify pertinent and instructive features for DSA because of the high dimensionality of power system data [59]. However, due to its complex structure, ML is often used as a black-box approach. It remains an issue because EPS operators might not trust the ML model and the forecasts, even though they are highly accurate. This is true even though ML techniques have also been investigated for combination with alternatives as hybrid approaches. Evaluating the reliability of the ML techniques and each of their predictions is essential to ensure that the algorithm works effectively with real-world data and produces accurate predictions. Numerous recent studies have been published to clarify and assess ML techniques, which can offer transparency and assist in evaluating complex-conditioned algorithms [60,61].
Furthermore, incorrect outcomes from established algorithms may arise from hardware degradation, the environment, or man-made attacks, such as DoS, DDoS, and FDI attacks on data during transfer or storage [62,63]. One method is to incorporate domain expertise into data-driven frameworks to make them more robust to harsh environments. Indeed, it has been discovered that ML models are susceptible to intentionally created hostile situations, such as adversarial ones, which could quickly harm a well-functioning ML framework with subtle disturbances. Such attacks on data-driven DSA models during deployment may pose significant security risks to power systems.
In [15], a systematic approach based on decision trees (DTs) and association identification was presented to forecast the system’s voltage-stability tolerance using real-time PMU data. DTs are unique among ML approaches used in EPS security assessments for their ease of understanding and high accuracy, enabling the TSO to make decisions quickly [56,64]. Current approaches rarely consider both the understanding and the durability of ML models under adversarial attacks. On the other hand, it is maintained that both are conceptually related, and research on one may offer important new perspectives on the other [65,66]. Adversarial cases might help users understand the model’s architecture, including decision restrictions and the ML of individual data features. Conversely, interpretable ML offers a more thorough comprehension of the significance of each attribute and a more compelling explanation of the predictions [67,68]. Furthermore, the ML model’s assessment can identify avenues to strengthen its architecture and make it more resilient to such hostile events. Finding the main energy sources can help optimize municipal energy management. Still, investing in strategies that enable secure and safer communications and offer end-to-end visibility is also critical. Threats/anomalies involving such time-sensitive data necessitate ML [43,62]. Due to the prohibitive costs of ensuring that every smart meter or sensor is installed in frameworks, the protection approach becomes relevant for sensors, smart meters, and grid systems, as well as accompanying testing. The detection barrier for FDI attacks is based on overcoming harsh estimates. In either case, the well-developed, multifaceted complexity of computing technology is suggested for FDI attack detection methods in an extensive energy system [69–71]. Cooperative outcomes have been reached using an attack detection approach: sparse, single, random, and dense multiple expenditures for fake measurement data. This state estimation (SE) compares four scenarios that might be achieved in successful FDI attack sites. More details of ML-based DSA analysis are in Section 4.
3 Power System Stability, Risk Assessment and FDI Attack
The DSA will evaluate the electricity system’s future security using the stability and risk index in SG devices in electric power systems (EPSs). However, forecasts of potential future operating conditions are necessary for this kind of assessment of the power system.
3.1 Transient Energy Function Technique
An alternative strategy for power system TSA, known as the direct method, was developed based on the Lyapunov approach [72]. By computing the transient energy margin (TEM) and avoiding the need for computer simulation, the direct method addresses the issue mathematically and provides immediate stability assessment. The energy difference between the energy obtained and the critical energy during a given time can usually be calculated using an energy function known as the TEM. Energy lower than the critical value indicates that the system is stable; if not, it may be unstable.
Eq. (1) provides the mathematical model of the system that uses a Lyapunov function and was constructed early in 1947 [72]. Nevertheless, analytical Lyapunov functions have to be used when the transfer constraints are zero
here,
here, the number of system synchronous generators is
The COI reference frame references the entire system, then the position (
here,
here,
As
here,
and the post-fault stable equilibrium
The potential energy integral term value calculations, including
The TEM is defined as the difference between the highest potential energy generated during the faulted period and the combined value of the potential and kinetic energies at the clearing time. Eq. (7) defines the TEM for a specific contingency.
where
here,
Remark 1: Using data measurements from PMUs at neighboring buses, a mathematical voltage stability indicator was used to identify voltage insecurity at the target bus. However, conventional centralized techniques have also been applied to rotor angle stability analysis. To identify groups of generators with comparable dynamic behavior under unstable conditions and predict transient stability, different machine-learning methods, including XGBoost, DT, and GB as base learners and a VMC ensemble classifier, were employed based on post-disturbance rotor angle swings measured by PMUs installed at generator buses. Simulations were carried out implementing into consideration the requirement for contingencies along with load variations to build the database of the framework’s dynamic reactions [8,15,48], and more information on TEF and risk indices is addressed in [8].
When small disturbances are applied to the power system devices EPS, their dynamic behavior can be effectively modeled linearly. The nonlinear differential-algebraic structure is linearized with an operational condition to generate this model. Kundur [32] demonstrates the power system linearized operation model at the point
The system state variable is
A risk index is used across probabilistic security assessments to evaluate the power system’s future security. Operating decisions regarding future conditions can then be made using the assessment’s results. It is crucial to consider the uncertainty and inaccuracy of the impact estimates when applying ML to probabilistic security evaluations. This uncertainty must be considered because it carries an additional risk. As explained further, the goal of this work is to calculate this risk using ML and take it into account in probabilistic dynamic security evaluations. The estimation of a power system’s operational state using the available metering devices. This essay focuses on SG devices EPS, which have gained popularity because of their increased controllability, dependability, and integration with energy storage systems and RE sources. Eq. (10) expresses the representation between the n-dimensional system state
where,
For example, a load flow analysis integrating the state estimation results with future load forecasts can yield the operational conditions
and then decide on operational measures to reduce this risk. In the risk formulation,
This excludes and disregards the risk of errors. When utilizing ML in DSA, the risk is
The risk estimate, represented by
here,
3.4 FDI Attack State Estimation in EPS
Using the threshold τ for l2-norm measurement error, the probability of system errors or compromises can be identified. Because of this, the intrusion detector in this instance is only going to inform the user about an attack when one appears in Eq. (15).
From our previous study [11], during an FDI attack, the vector attack Ā is constructed as a linear combination of the Jacobian matrix H, and can be expressed as Ā = Hx. For an n-dimensional system, the vector n × 1 becomes non-zero arbitrary c, an arbitrary vector independent of the measurements. From [11], the vector modeling for FDI attack is as follows;
The new estimated state vector attack Ā satisfies the equation
The SG power system equipment attempts to control and trigger an alarm to prevent measurement values from exceeding the maximum modifying tolerance value c, [24,73]. Therefore, the false data set vector
From Eq. (11), it is proven that ra(bad) = r, if Ā = Hc meets the requirement. It has become exceedingly clear that attackers can introduce a false data set into the SG without altering any measurement data sets. An attacker attacks the DC/AC power system with FDI through a similar data set. The attacker changes their plan before altering any measurements; then the SE model becomes:
To protect the SG power grid, many scholars are investigating FDI attacks to secure data from power system equipment, EPS, SCADA, PMU, and communication systems. The DSA in the SG system may be affected when an FDI attack is triggered.
3.5 ML Techniques in Power System Stability, Risk Assessment, and Control
Conventional methods become challenging to use in power system analysis due to the growing complexity of the data. This is because processing such data correctly requires significant computer resources and time, leading to longer computation times and a higher level of accuracy. Furthermore, traditional methods may struggle to process such data. With rising energy consumption and expansion of current electrical communication networks and lines, the modern power infrastructure is operating near its limits. Therefore, it is crucial to continuously monitor the power system network and offer more reliable data than was previously considered necessary for operational control and power systems while minimizing risk under such circumstances. ML is one of these computing technologies that has recently acquired prominence and has been applied to several power system applications for stability, risk assessment, control, and attack prediction. In terms of resilience, stability, risk assessment, attack prediction, and response speed, ML methods perform better than traditional methods, which rely on memory to complete these tasks. AI programs have extra features, but they are more costly than traditional methods.
Although recent developments in the use of ML algorithms in power grid applications such as fault detection, demand forecasting, and grid optimization have shown great promise, many claims about their effectiveness are unsupported by conventional quantitative analysis. As the use of ML in emerging electric power grids grows, it is imperative to prioritize evidence-based research that validates model effectiveness through real-world datasets, standardized methods, and comparative analyses. Grid operators can ensure that ML implementation is both reliable and compliant with power grid sector demands.
The Smart Grid has many uses for ML. The following are specific details on the ML methods and applications that are employed in the smart grid.
• ML-based attack detection methods have demonstrated promising performance due to their remarkable characterization accuracy and scalability. Additionally, the present analysis demonstrates the robustness of supervised learning strategies for attack location in this field.
• Most studies on energy dispatch basically use multi-disciplinary framework hypotheses to solve the dispatch problem in smart networks, which necessitates an accurate computational framework for the extensive work. However, recently, an increasing number of research studies have used AI, such as XGBoost models, to address the energy management problems.
4 Machine Learning Model Training for DSA
The future security, stability, and risk of SG devices’ EPS will be assessed using an FDI attack vulnerability index as part of the DSA. Several methods are used for DSA, such as the TEF method [8] for stability and risk assessment, decentralized DT [15] for stability analysis, and DT and XGBoost [18,49] for FDI attack prediction. To improve dataset accuracy, encoding, decoding, and feature selection involve eliminating repetitive and unrelated features based on an evaluation score. Feature selection techniques fall into three categories: filter, wrapper, and embedded. Embedded approaches establish a closer integration between classifier construction and feature selection, where the feature subset is selected as part of the model training process. When the classifier is built using embedded approaches (ML-based ensemble model), feature subsets are created. The ensemble methods used in this investigation that are briefly described below. The proposed architecture, illustrated in Fig. 2, is designed to handle imbalanced datasets using SAE and to employ sophisticated ML methods to identify FDI attacks. Data preprocessing and acquisition are the first steps, when raw data is cleansed and prepared for evaluation.
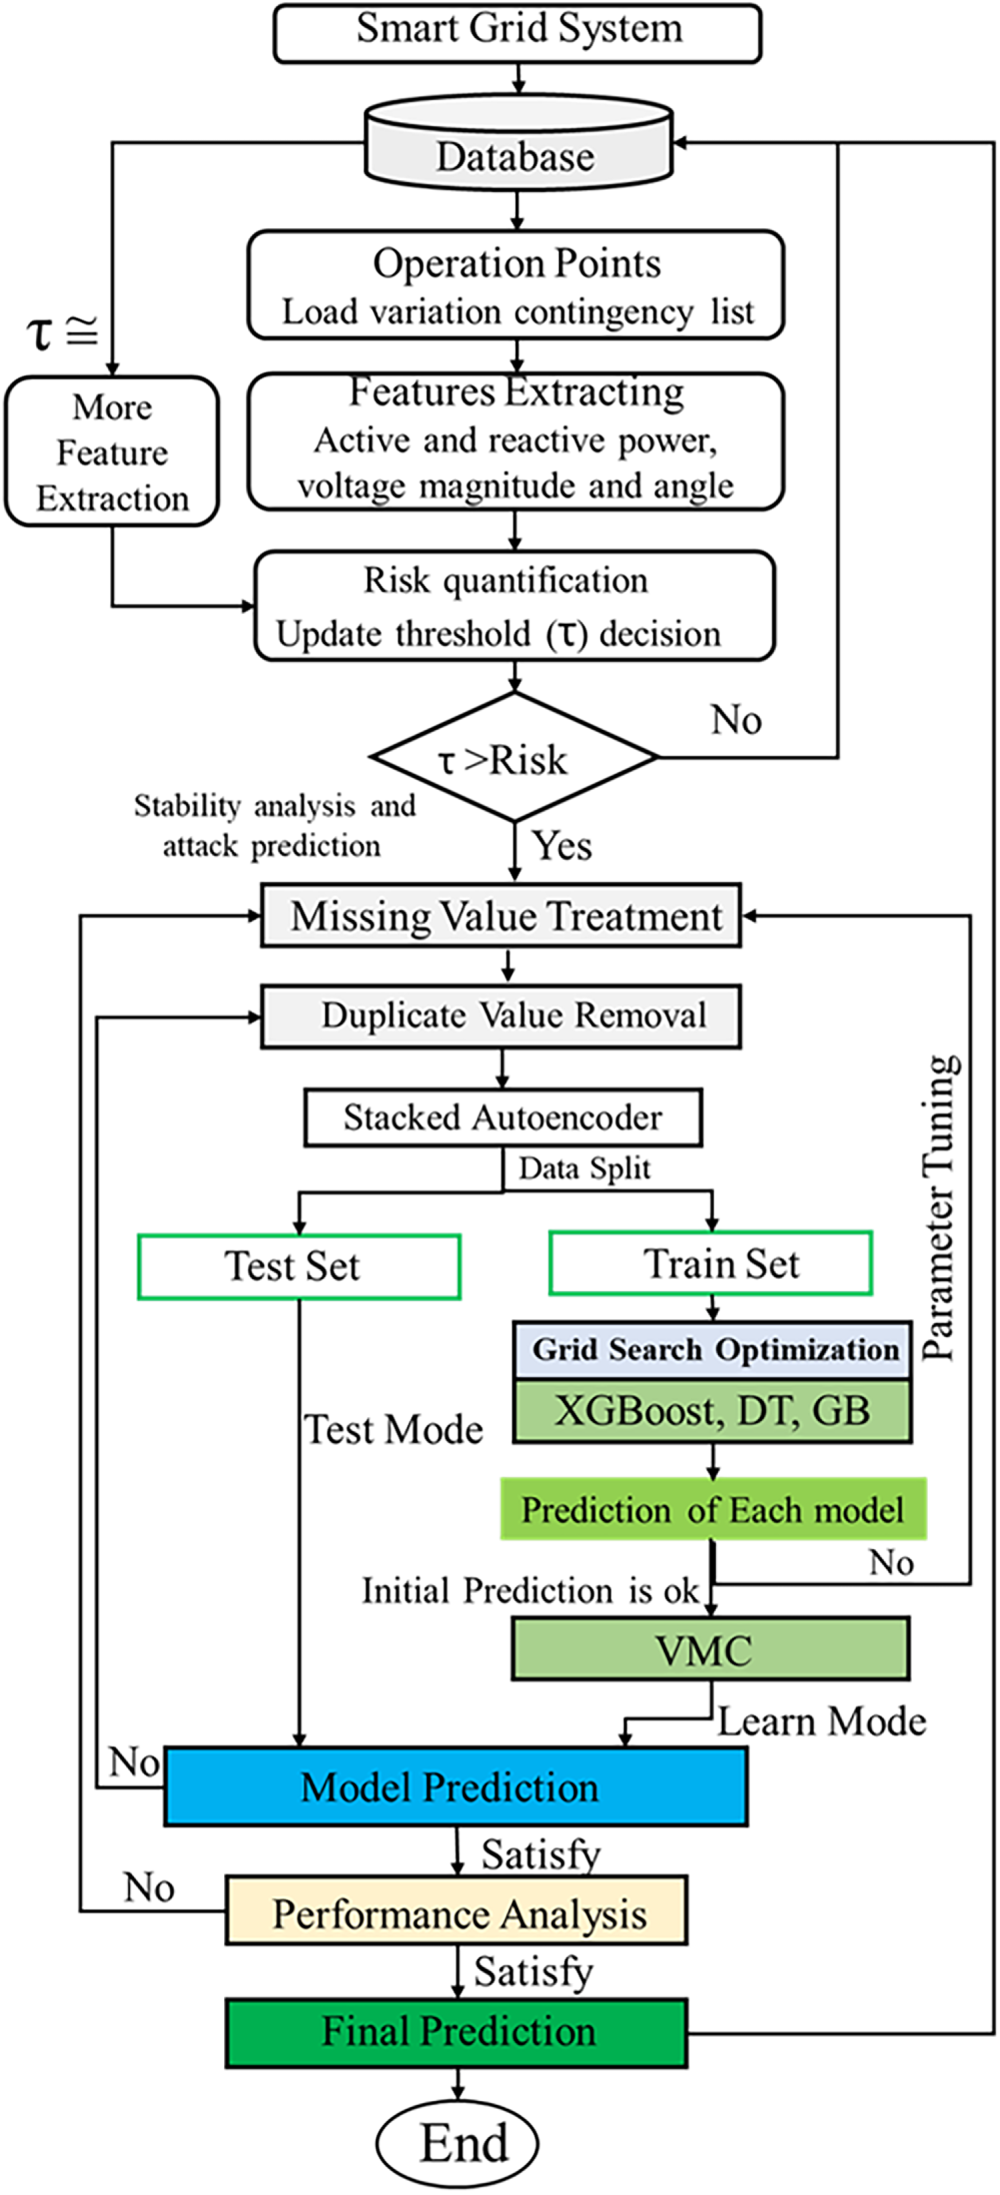
Figure 2: General flowchart of proposed transient energy margin and SAE-VMC-based DSA model.
For SAE-VMC models, hyperparameter tuning is frequently done by trial and error, particularly in domain-specific operations like power system security assessment. We used an identical empirical tuning method in this research to get the ideal values for important variables, including learning rate and dropout rate, where model performance is assessed by training stability, F1-score, accuracy, and computational efficiency, which were weighed through trial-and-error. When developing an effective model and facilitating learning rate, hyperparameters are fundamentally necessary. We selected hyperparameters that produced reliable and broadly applicable results for the specified models by repeatedly testing various configurations and assessing validation performance. When implementing adjustments to these parameters, careful consideration should be taken because they have direct effects on the final predictive model properties. For training the SAE-VMC model, 70% of the samples were used as training data, and the remaining 30%. This 30% test partition was held out entirely during hyperparameter tuning (which used k-fold cross-validation within the 70% training data) and was used as test data for the subsequent simulation. The hyperparameter learning rate, which controls how much the network weights are modified in response to the loss gradient, is set at 0.01 in this instance. To improve model performance and ensure that the best configurations are chosen for accurate identification, hyperparameter tuning is carried out via k-fold cross-validation on the training data. Only models that meet the required cross-validation performance standards move on to final evaluation on the held-out test set, which is not used during tuning.
4.1 Stacked Autoencoders (SAE)
By learning compressed representations in a lower-dimensional latent space, the SAE serves as an effective dimensionality reduction technique. Additionally, the latent representations learned by the SAE can be used as input features for conventional classifiers such as SVM, RF, DT, and XGBoost. This combination creates a powerful hybrid framework that leverages unsupervised feature learning for supervised classification. Labeled data can be utilized to fine-tune all aspects of the architecture, comprising the classifier and autoencoder (AE), enhancing classification accuracy and handling complicated data structures. In addition to its feature learning capability, SAE can learn robust feature representations that may improve classification performance on imbalanced datasets.
The SAE is a deep learning model comprising several layers arranged sequentially. Every autoencoder has two layers: one for encoding, which compresses the data, and another for decoding, which reconstructs it. Additionally, the bottleneck is the layer that holds the encoded form of the compressed input data. Several autoencoders can be stacked to produce an SAE.
Encoding: The input to the subsequent layer is the encoder’s output from the previous layer.
Layer 1: Let
where the weight matrix is
Layer 2: The latent representation
Decoding: Decoding backward across the layers constitutes a component of the reconstruction process.
where the weight matrix is
Utilizing the Mean Squared Error, the reconstruction error is minimized by
where
Regularization techniques are used to enhance performance:
Denoising AEs: During training, increase resilience by introducing noise to the input
Dropout: To avoid overfitting, drop components randomly throughout training.
Sparsity Constraint: Promote the inactivity of certain hidden units:
where
Remark 2: In this study, we concentrated on four crucial hyperparameters in the design and implementation of the SAE. The first hyperparameter is the number of nodes in the latent code (or middle layer). The choice controls the AE’s compression ratio. The second hyperparameter is the number of lasyers (l). SAEs use several hidden layers, allowing for the detection of complicated patterns in data, and the dropout rate is 0.2. The depth of the SAE is an important hyperparameter that must be carefully chosen to balance performance and computational costs. The third hyperparameter is activation functions and weights: Typically, the hidden layers use ReLU to introduce non-linearity and alleviate the vanishing gradient problem. The final output layer usually uses Sigmoid. In SAEs, the decoder’s weight matrices are often constrained to be the transpose of the encoder’s weight matrices. The number of trainable parameters speeds up training. The fourth hyperparameter is the loss function. In this study, mean squared error is used as the most common loss function for reconstruction.
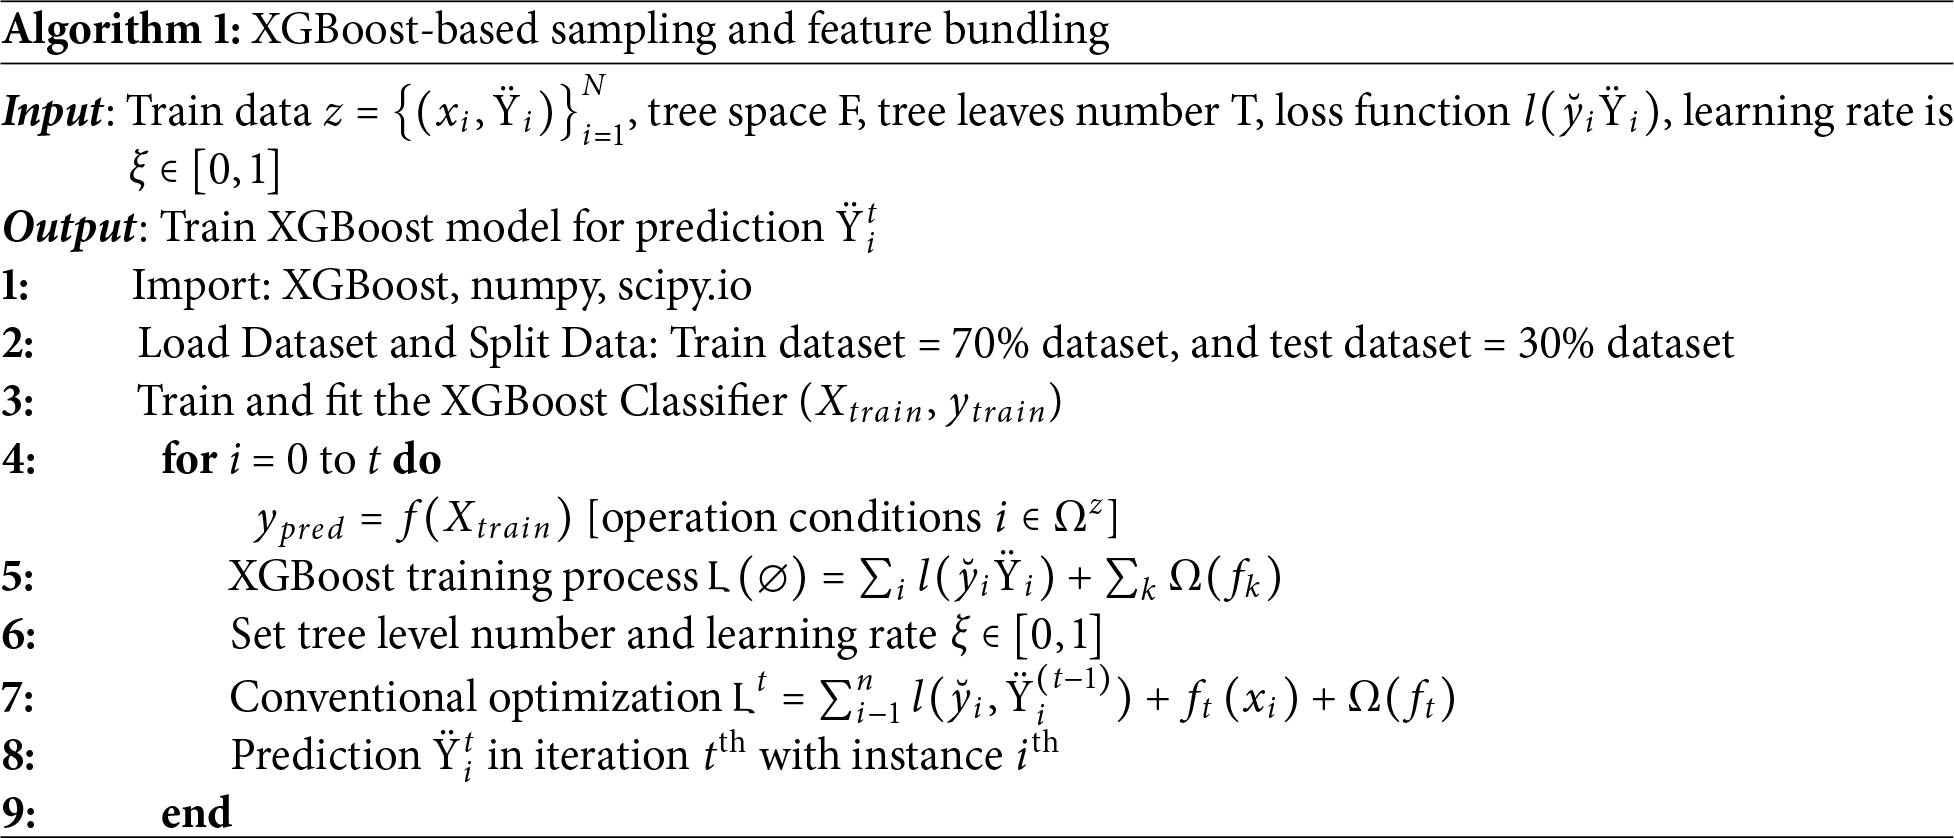
This section trains the XGBoost classifier, which is an ensemble ML algorithm that functions like a decision-tree-based gradient-boosting framework. We chose XGBoost because of its great scalability and generalization performance. Assume that the power system dataset has
here,
where the convex loss function
Similar to the conventional Gradient Boosting Decision Tree (GBDT) technique, the inclusion of an extra regularization term assists in mitigating overfitting by smoothing the final learning weights. Eq. (28) presents the tree ensemble model that is trained additively using conventional optimization techniques in Euclidean space.
Let,
For efficient optimization, apply the second-order approximation in a general setting as
where,
In real terms, the split candidates’ evaluation loss reduction is provided by
here,
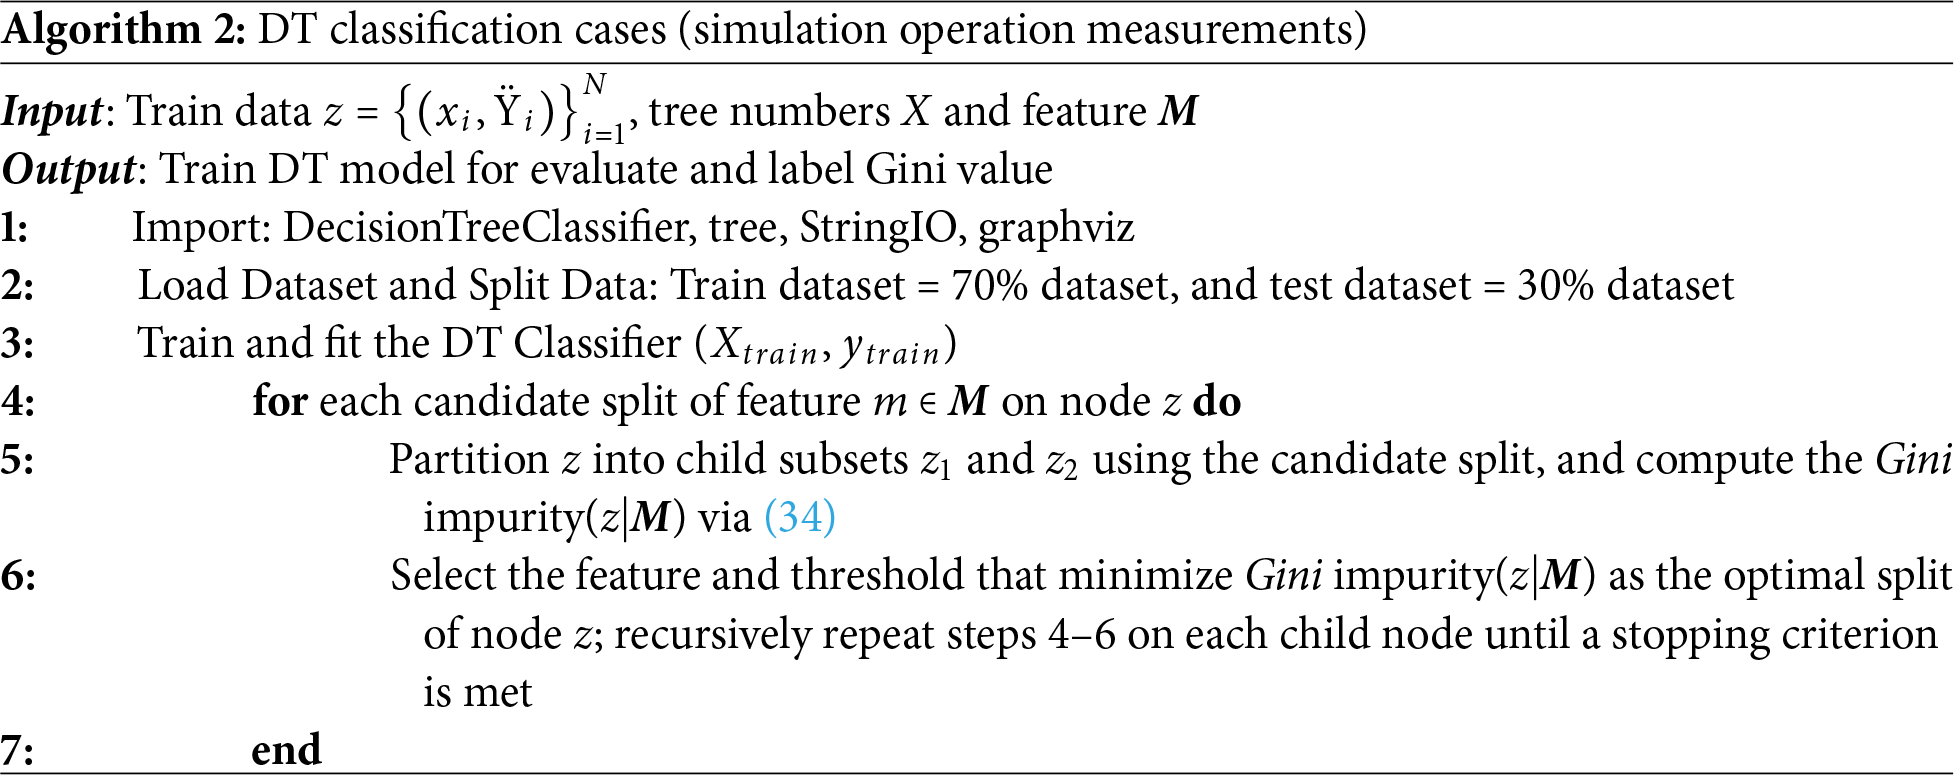
This section trains a DT classifier using the Gini impurity, a Classification and Regression Trees (CART) technique that measures the distribution of deviation for a certain field based on instance results. The training model Gini value is calculated from the power system dataset
here, probability
and the best feature during segmentation inside the present node can be identified as the feature with the lowest Gini impurity value, and Algorithm 2 presents the DT classification method.
4.4 Gradient Boosting Classifier
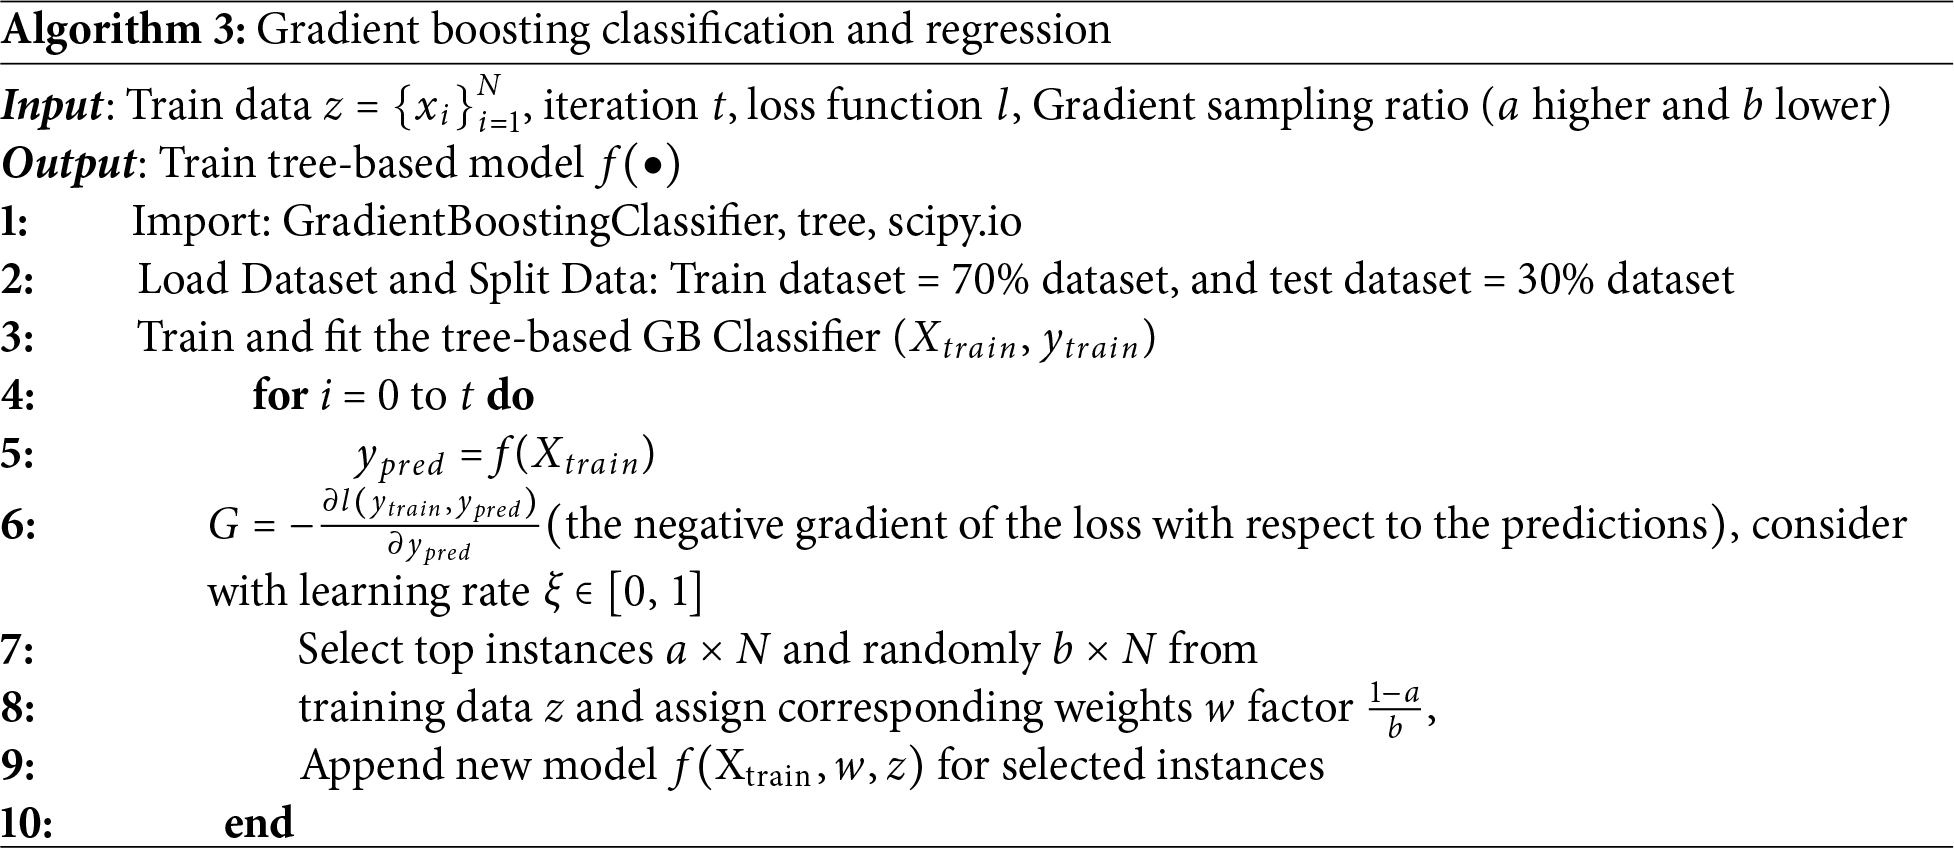
The Gradient Boosting (GB) classifier will be trained with a highly efficient and novel tree-based GB approach to deal with high-dimensional system state
Remark 3: All of the tree-based DSA models have been thoroughly trained, and the hyperparameters have been adjusted to prevent underfitting and overfitting to ensure the best DSA performance and fair comparison. Ensemble tree-based models do not always achieve higher DSA accuracy than a single DT—for example, Tables 2 and 3 show DT attaining slightly higher accuracy than the bagging (Random Forest) and boosting (AdaBoost) ensembles on both datasets. The robust index for tree-based models and verification errors of bagging ensemble techniques are worse than those of boosting ensemble methods, despite the bagging ensemble methods’ improved DSA accuracy. It can be proven that the accuracy index is not enough to represent the performance of the tree-based DSA models. DT: For selecting the optimal split, every feature is taken into consideration. Gini impurity is used to measure the quality of the split. GB and XGBoost: There are 300 boosting stages for ensemble tree-type approaches, respectively. Verification errors decrease, while processing efficiency improves, as the robustness index for tree-based boosting methods.
4.5 Voting Machine Classifier Interpretation
This manuscript presents a voting machine classifier (VMC) for DSA interpretation analysis for attack prediction and risk assessment. Among its unique elements are:
• An ensemble-weighted feature-attribution approach that applies Shapley additive explanations (SHAP) [74] across the combined XGBoost, DT, and GB voting classifiers.
• The additive decomposition in Eq. (35) satisfies the local accuracy and consistency properties of Shapley values, so each base classifier’s feature-attribution values sum exactly to the VMC’s overall prediction for that instance.
For individual predictions, VMC employs an attractive feature-attribution approach to justify each prediction by assigning an importance value to each feature. This follows the Shapley additive explanations (SHAP) framework [74], adapted here to the combined XGBoost, DT, and GB voting ensemble to quantify each base classifier’s contribution to the final prediction. Considering the training set (
The contributed feature start value
This indicates that the optimal weights associated with the base classifiers must be identified through an ensemble-level optimization. Let
Instead of using uniform weights for the entire dataset, weights are modified based on whether the model performs well in particular areas of the input space. The sum
where
The expected output for a coalition that additionally includes feature
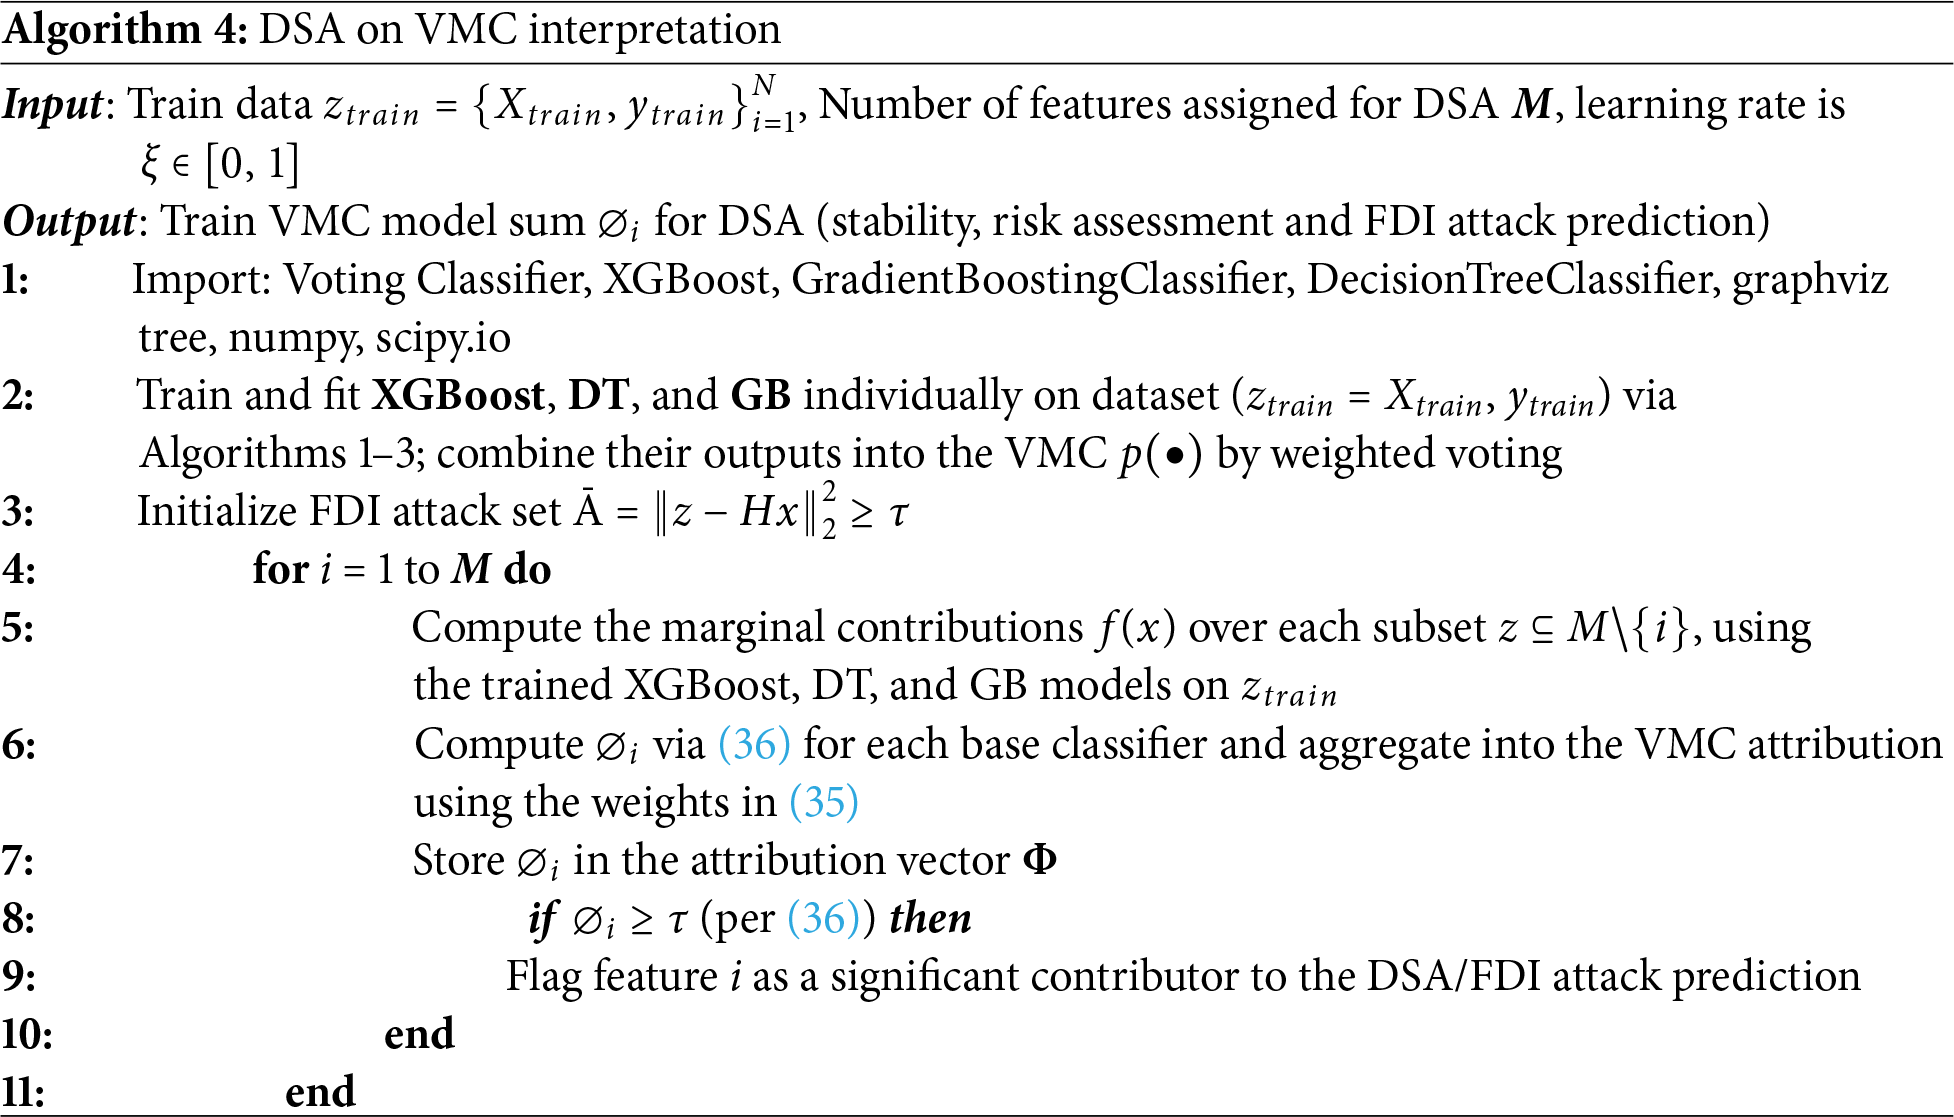
The proposed VMC interpretation process is presented in Algorithm 4. The purpose of the VMC implementation for the DSA is to explain the trained models using the data, followed by a data-driven approach to predict FDI attacks and to derive defense strategies for current frameworks, supporting robustness measurement. A data sample is followed by VMC interpretation employing the trained model, represented in this algorithm, and every input feature is subsequently assigned a VMC value. This VMC value shows how important the data associated with this feature is in the trained model to influence the final output. The overall results for VMC are the final output. Technically, data features with higher values dominate the simulation process; as a result, they appear to be vulnerable to variation applied to these features, which may create more structural disruptions to the final outputs and increase the risk of misinterpretation compared to other features. Thus, VMC interpretation offers an effective means to identify the exact targets of FDI attack and carry out successful defensive measures against cyberattacks.
4.6 Attack Prediction Strategy
The FDI example is used to strengthen FDI training for achieving robustness. Different FDI occurrences are randomly sampled and added to the training set to assess the robustness relationship, whereas robustness denotes the attack failure rate in this paper. Initially, the training set is constructed using FDI attack samples generated from successful attack scenarios. The FDI model training process is mathematically presented as
Specifically, FDI examples of the generated set
One of the most important elements of ML techniques is the dataset, since it can yield trustworthy results when it contains the right features. This simulation is conducted on Google Colab, a Lenovo ThinkPad T460p with an Intel Core i5-6440HQ CPU, 8 GB of RAM, and a 64-bit operating system. We used Python in the Conda Forge Jupyter Notebook 6.5.2.
Dataset 1: In this manuscript, well-known real-time IEEE 3-Bus three-phase (3ϕ) power system attack datasets from Mississippi State University and Oak Ridge National Laboratory (MSU-ORNL) were used [75], and 15 different datasets were generated [76] for examination. This dataset comprises 29 types of measurements. With 128 features, there are 4 PMUs that measure 29 features for 116 PMU measurement columns total. Finally, 4966 functional occurrences with matching security status were collected; of these, 70% (3476 samples) were used as training data, and the remaining 30% (1490 samples) were used as test data for the subsequent simulation.
Dataset 2: During my PhD study, we developed an FDI attack-based Industrial Internet of Things (IIoT) dataset, namely UKMNCT_IIOT_FDIA [77]. This dataset comprises 15,425 instances and 30 features.
Data preprocessing: To create new datasets, the autoencoders were applied to data gathered from typical situations. The various layers of a SAE constitute an autoencoder that adapts to encode and decode the input data. It is particularly useful for feature learning and reducing dimensionality since it learns a condensed and effective characterization of the input data. The autoencoder is trained using the minority class to synthesize the resulting data, enabling it to recognize and restore basic patterns of that particular class. The decoder creates artificial instances corresponding to the minority class by reconstructing the encoded samples after random noise is injected. This approach improves the model’s capacity to generalize and lessen bias by effectively augmenting the minority class data. Using the min-max normalization technique for normalization of the dataset, as follows,
where
5.2 Interpretation of Risk and Stability Results
This investigation focuses on the DSA as a standard classification and regression challenge. The classification problem uses TEM values to classify grid network topologies as secure or insecure for transient stability, while the regression problem forecasts the TM value for a given grid network topology. The proposed approach is an effective choice for standard DSA applications since it achieves 100% classification accuracy in the security classification task; TM value prediction performance is illustrated qualitatively via the TEM simulation results in Fig. 3, as no dedicated regression accuracy metric (e.g., R², MSE) is reported for this task.
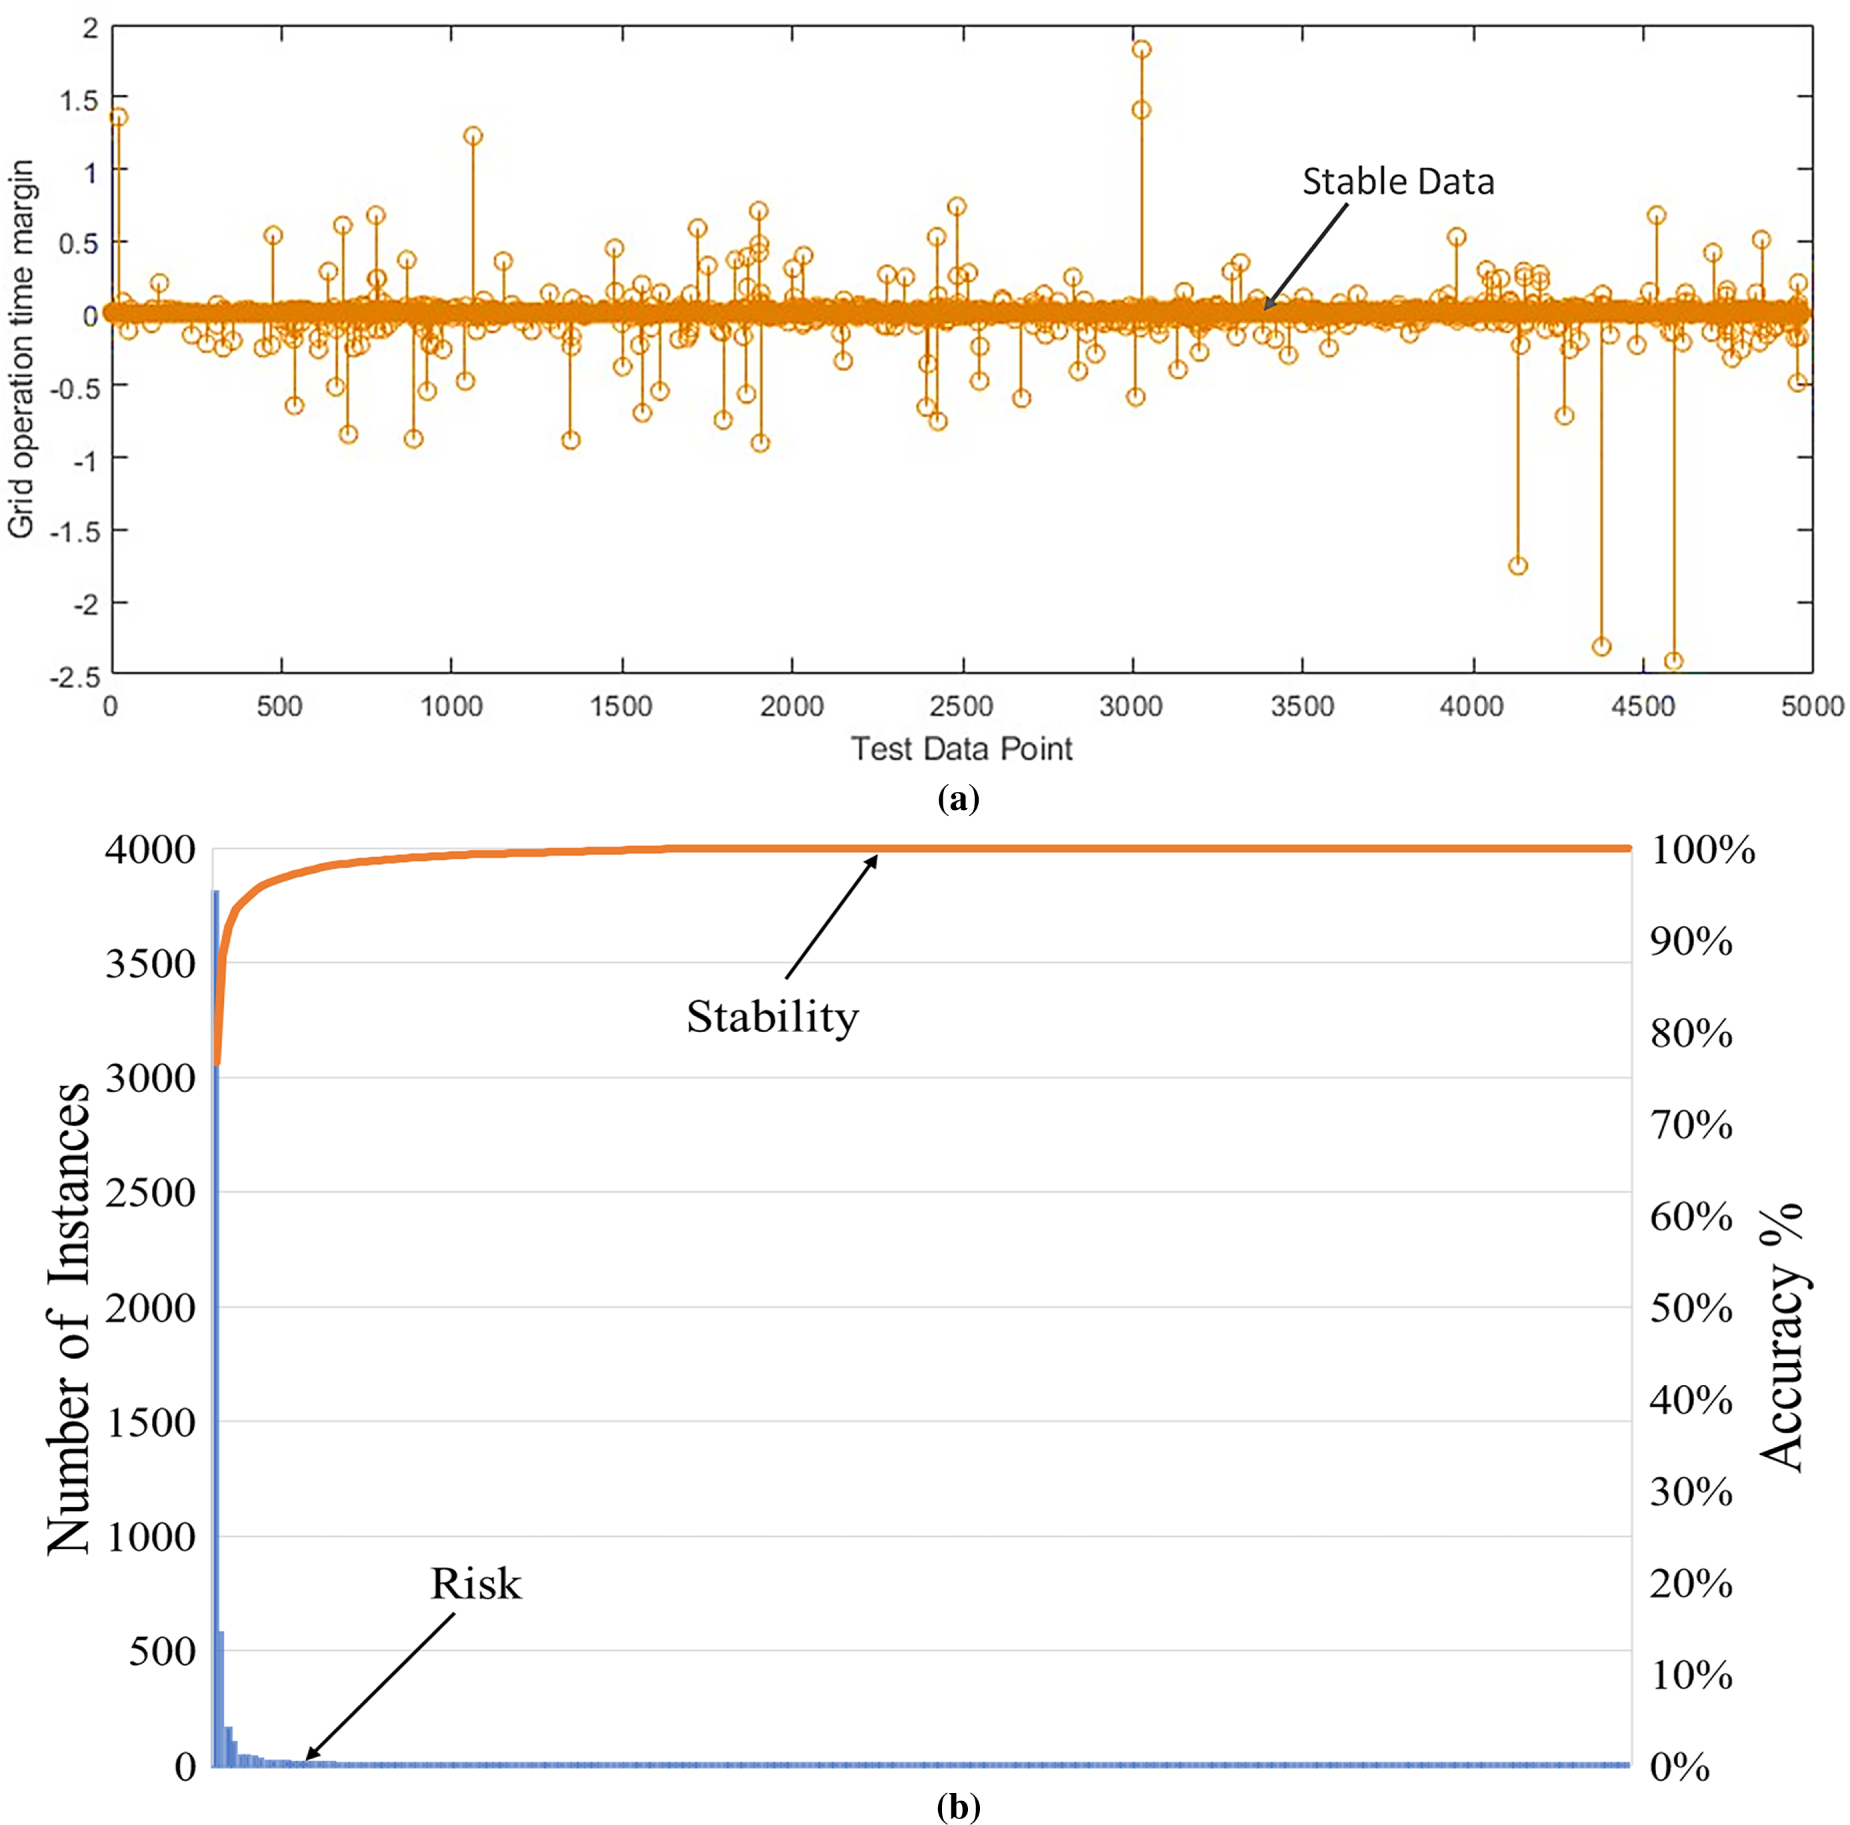
Figure 3: Proposed approach contingencies; (a) before operating conditions and (b) after operating conditions.
Using the real-time IEEE-3 bus MSU-ORNL power grid datasets, the TEM simulation addresses the issue and provides an immediate stability assessment, as shown in Fig. 3. Fig. 3a presents the “stable” and “risk” instances in the grid dataset during the operation period. After training, the system identifies and mitigates these risk instances, stabilizing the grid, as shown in Fig. 3b. Here, the “stable” and “risk” samples are selected from the training set to present the TEM model results. Fig. 3b illustrates that as the number of risk instances increases, the grid system is unstable; thereafter, the risk decreases to near zero, after which the grid system becomes stable.
Intelligent Electronic Devices (IEDs) can turn power grid breakers on or off as needed. Each breaker is autonomously controlled by an IED. The validation of the proposed hybrid model presented in Fig. 4a is based on real-time IEEE-3 bus MSU-ORNL power grid datasets, which illustrate the randomly selected actual and predicted values of test data points. Fig. 4b presents the results for the UKMNCT_IIoT_FDIA dataset. Using TEM values, the classification problem classifies network configurations as secure or insecure for transient stability, whereas the regression problem forecasts the time margin for the specified network architecture. By comparing the actual and predicted values, we found that the developed TEM method provides reliable predictions.

Figure 4: Predicted time margin for IED-based grid relay control test data points; (a) MSU-ORNL dataset, (b) UKMNCT_IIoT_FDIA dataset.
5.3 Stacked Autoencoders (SAE) Based Data Preprocessing Result
To balance the datasets, given the severity of this class imbalance, the study employs SAE. The SAE layout was built by isolating the minority (attack) class instances. To create a new data collection, the autoencoders were trained on the minority class data. The decoder reconstructs the original samples from the encoded samples after adding random noise. Fig. 5 displays the concatenated distribution for the class. In this study, the MSU-ORNL smart grid dataset and UKMNCT_IIoT_FDIA were used as commonly used IIoT datasets. This method validated the efficacy of new data generation and facilitated visualization of the dataset in a lower-dimensional space.
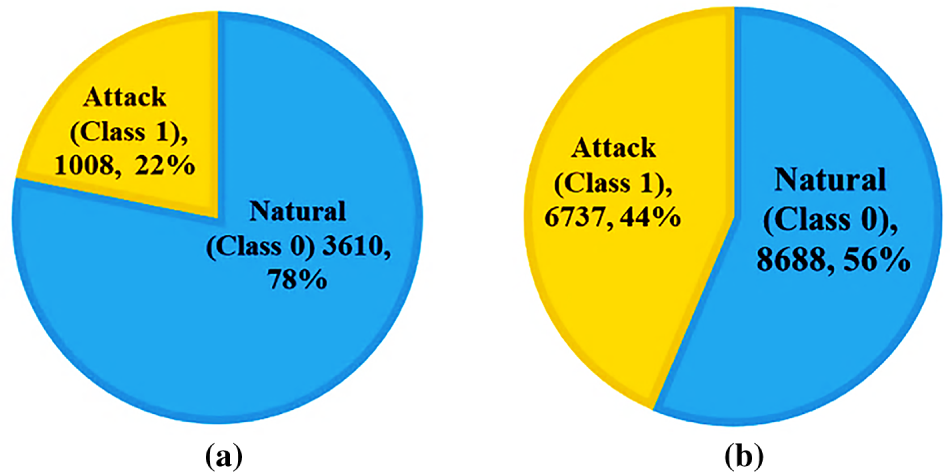
Figure 5: Dataset class (attack and normal) distribution; (a) MSU-ORNL smart grid dataset, (b) UKMNCT_IIoT_FDIA dataset.
5.4 FDI Attack Prediction Test Results
Fig. 6 presents the evaluation metrics for the proposed VMC-based FDI attack prediction system.
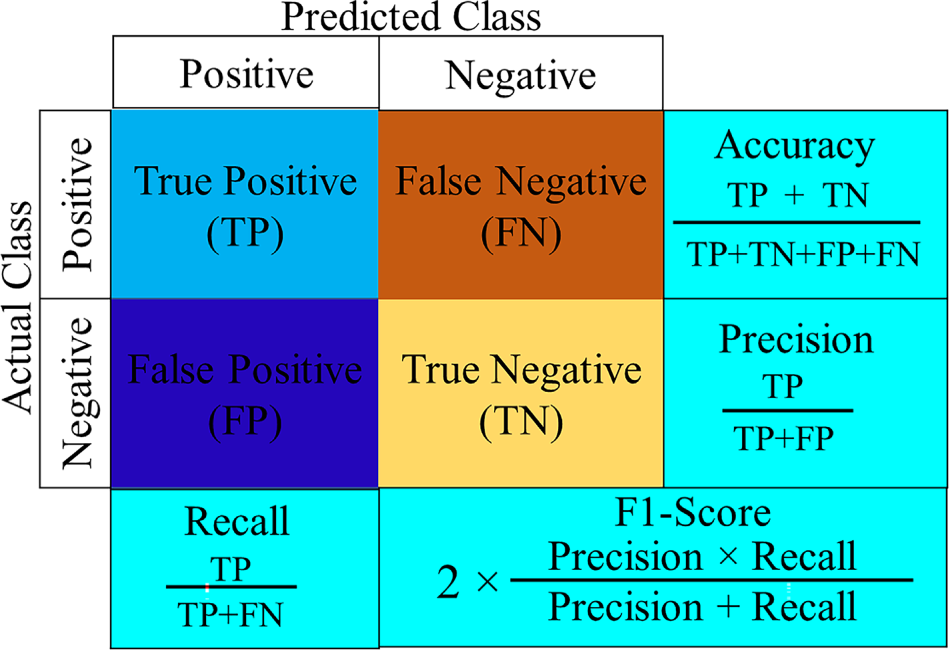
Figure 6: FDI attack prediction system evaluated metrics.
Real-time IEEE 3-Bus MSU-ORNL datasets: This study focuses on DSA for classifying system stability and predicting FDI attacks. The proposed method tests all issues. For the FDI attack prediction, we test 15 different datasets and analyze them with XGBoost, DT classifier, GB classifier, and VMC, respectively, in Fig. 7a–d. Fig. 7a–d shows the effective attack prediction rates on the original training set assigned to 126. The FDI attack prediction results show that several false features were chosen by dataset 1. Information could be obtained through this method. The attack prediction classification results are evaluated using accuracy, precision, recall, and F1 score. Among the ML models, the individual DT classifier has lower performance but takes less time; XGBoost achieves the highest performance, and the GB classifier takes much longer compared to the XGBoost model. Finally, our proposed hybrid VMC method overall achieves high accuracy and F1-score. The average performance comparison of the proposed classifiers is presented in Table 2, along with training time.
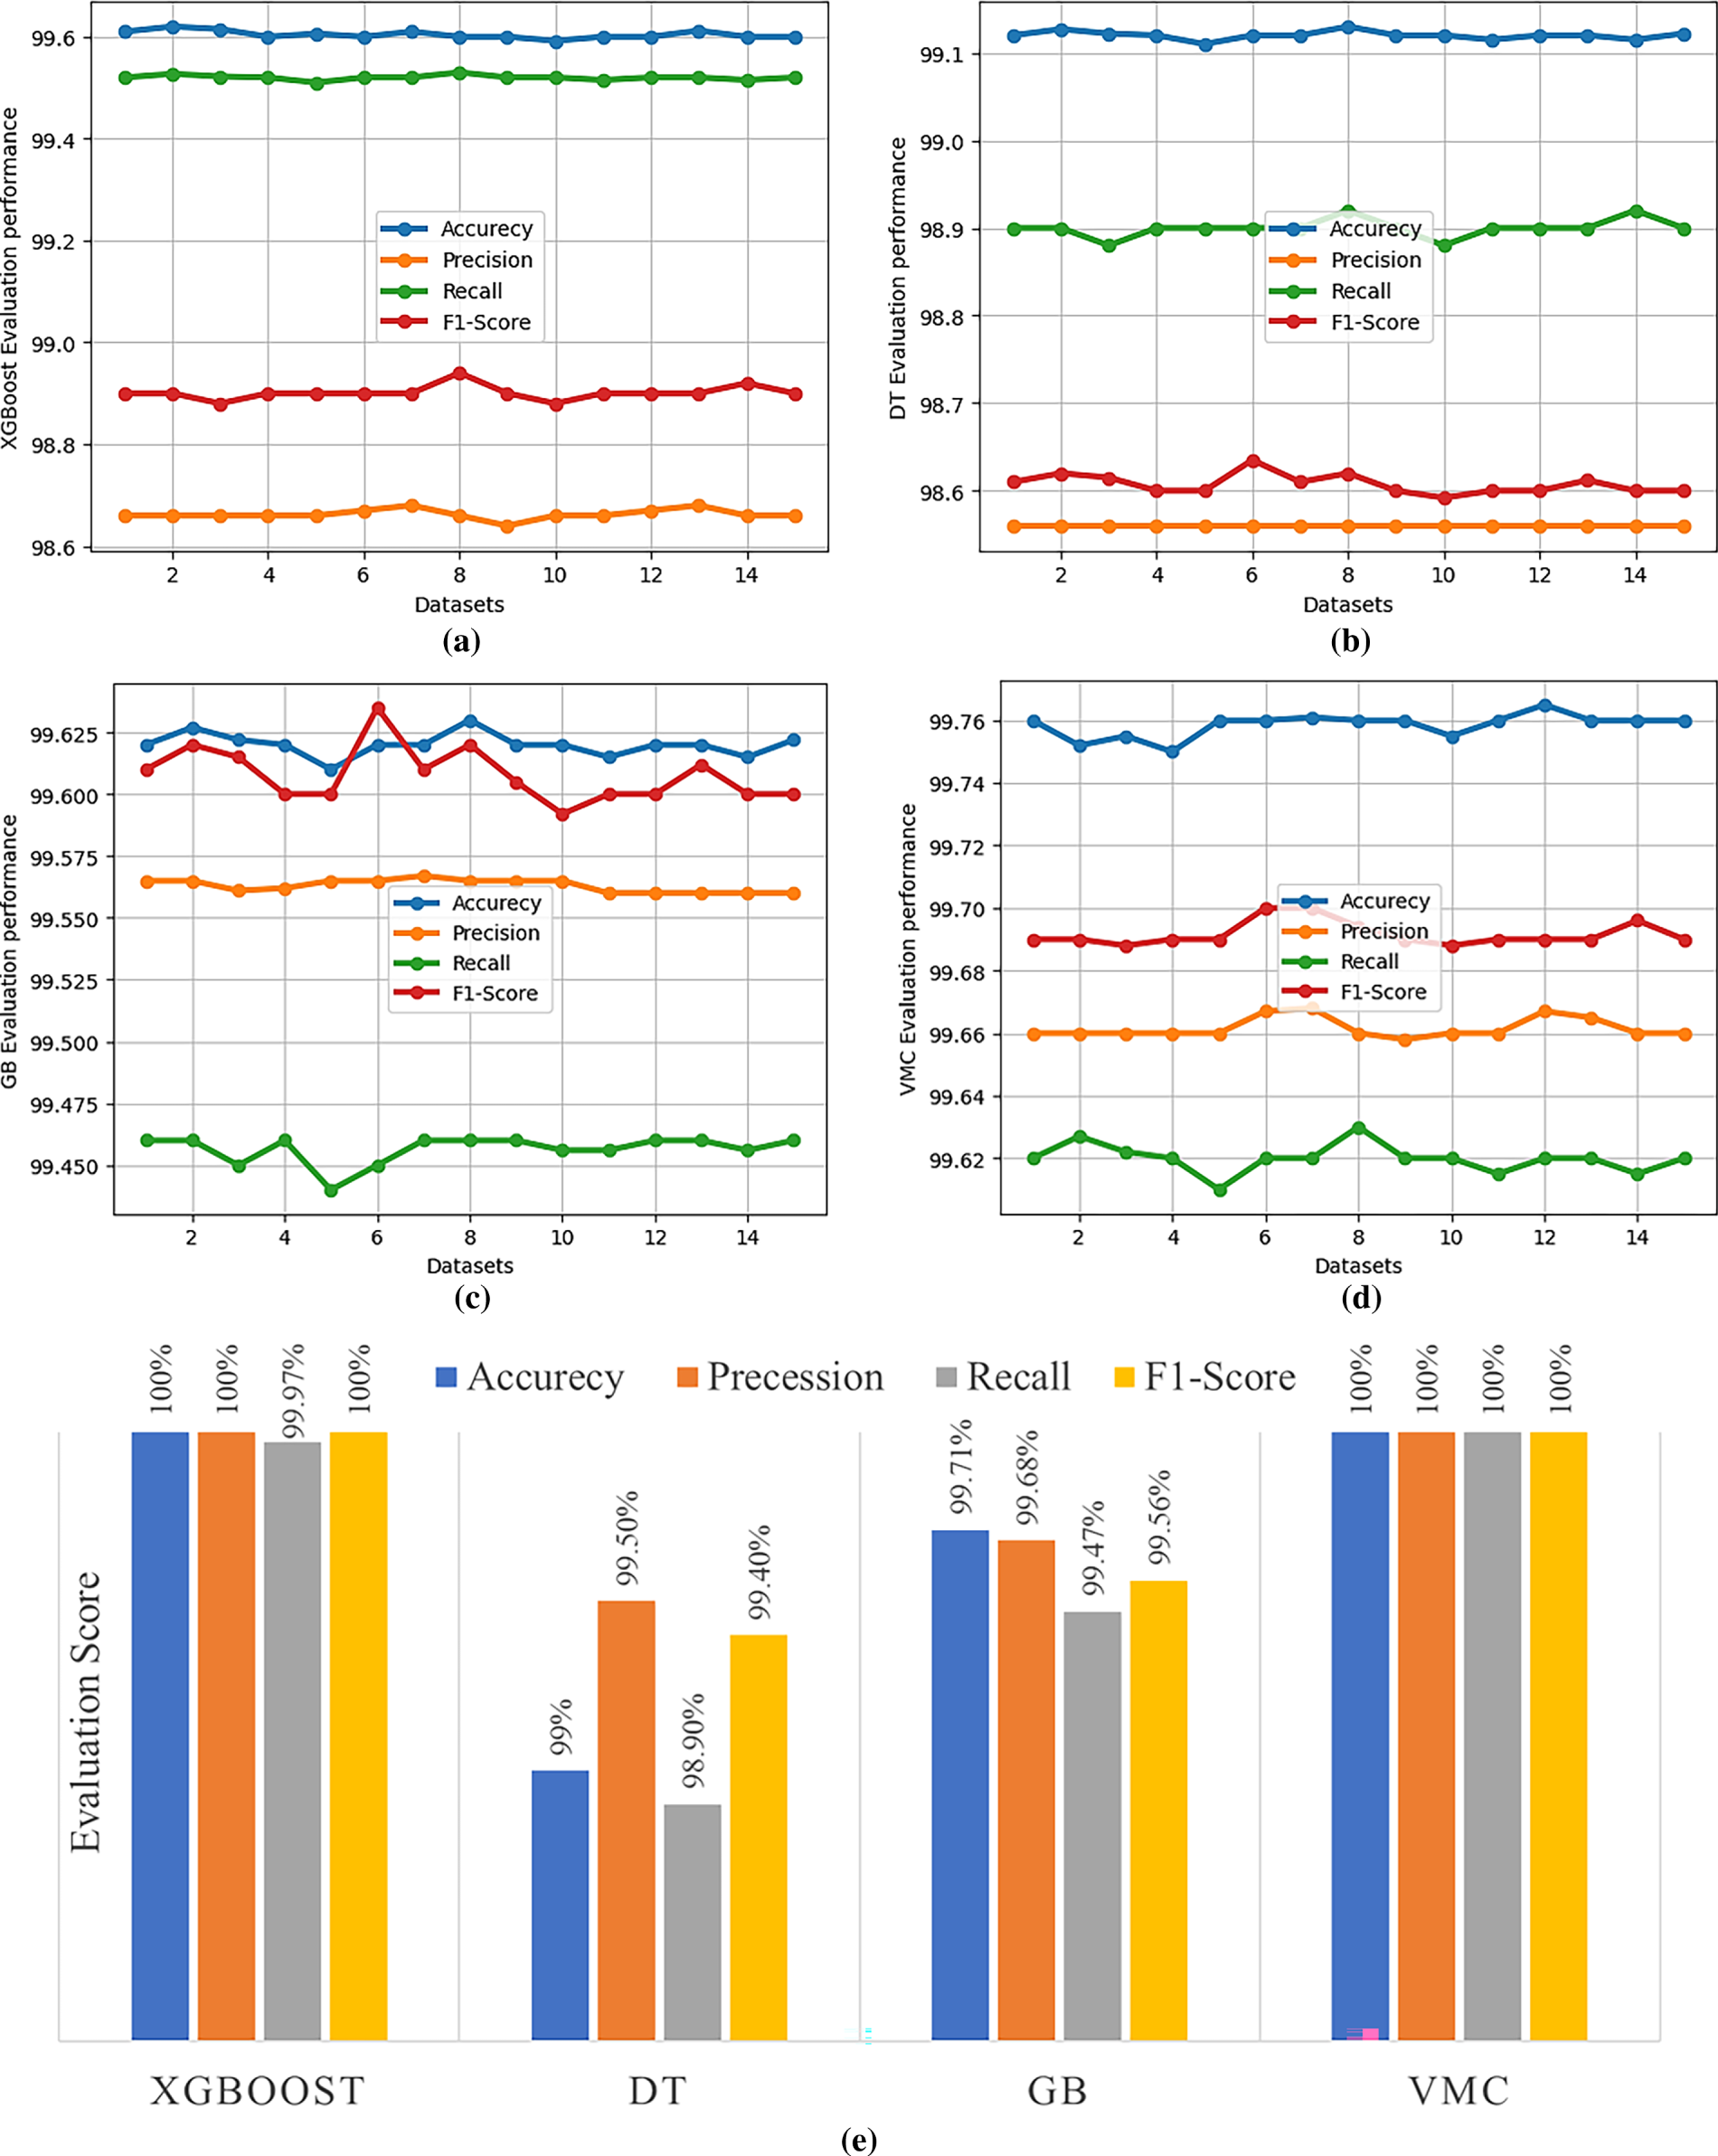
Figure 7: Successful FDI attack prediction rate performance evaluation matrices in real-time IEEE 3-Bus MSU-ORNL datasets; (a) XGBoost classifier, (b) DT classifier, (c) GB classifier, (d) proposed hybrid-VMC, and (e) proposed model performance evaluation using the UKMNCT_IIoT_FDIA dataset.
UKMNCT_IIoT_FDIA dataset: The classification results of the proposed learning-based model are presented in Fig. 7e. Fig. 7e illustrates that the XGBoost classifier individually achieves high accuracy (100%) and F1-Score (99.44%) but takes training time. The DT classifier achieves lower accuracy (99%) and F1-Score (98.00%) with very few training iterations. The GB classifier achieves a comparable accuracy & F1-Score to the XGBoost classifier. Our proposed hybrid VMC achieves 100% accuracy with minimum training time. The performance of the evaluation matrix for all classifiers, along with training time, is presented in Table 3.
Increased robustness would come from training models with attack scenarios. Nevertheless, increasing the number of FDI attack cases used during training cannot guarantee a more effective model, as accuracy and robustness may not be enhanced simultaneously. Additionally, comparisons of attack detection models show that choosing the right number of compromised instances can yield superior models; excessive compromise won’t yield the greatest results in terms of accuracy or robustness. Nevertheless, model robustness depends on the intended task, and it is not readily apparent during training. Table 3 shows each model’s performance when trained on all features. Fig. 8 illustrates an identical pattern in the ROC values.
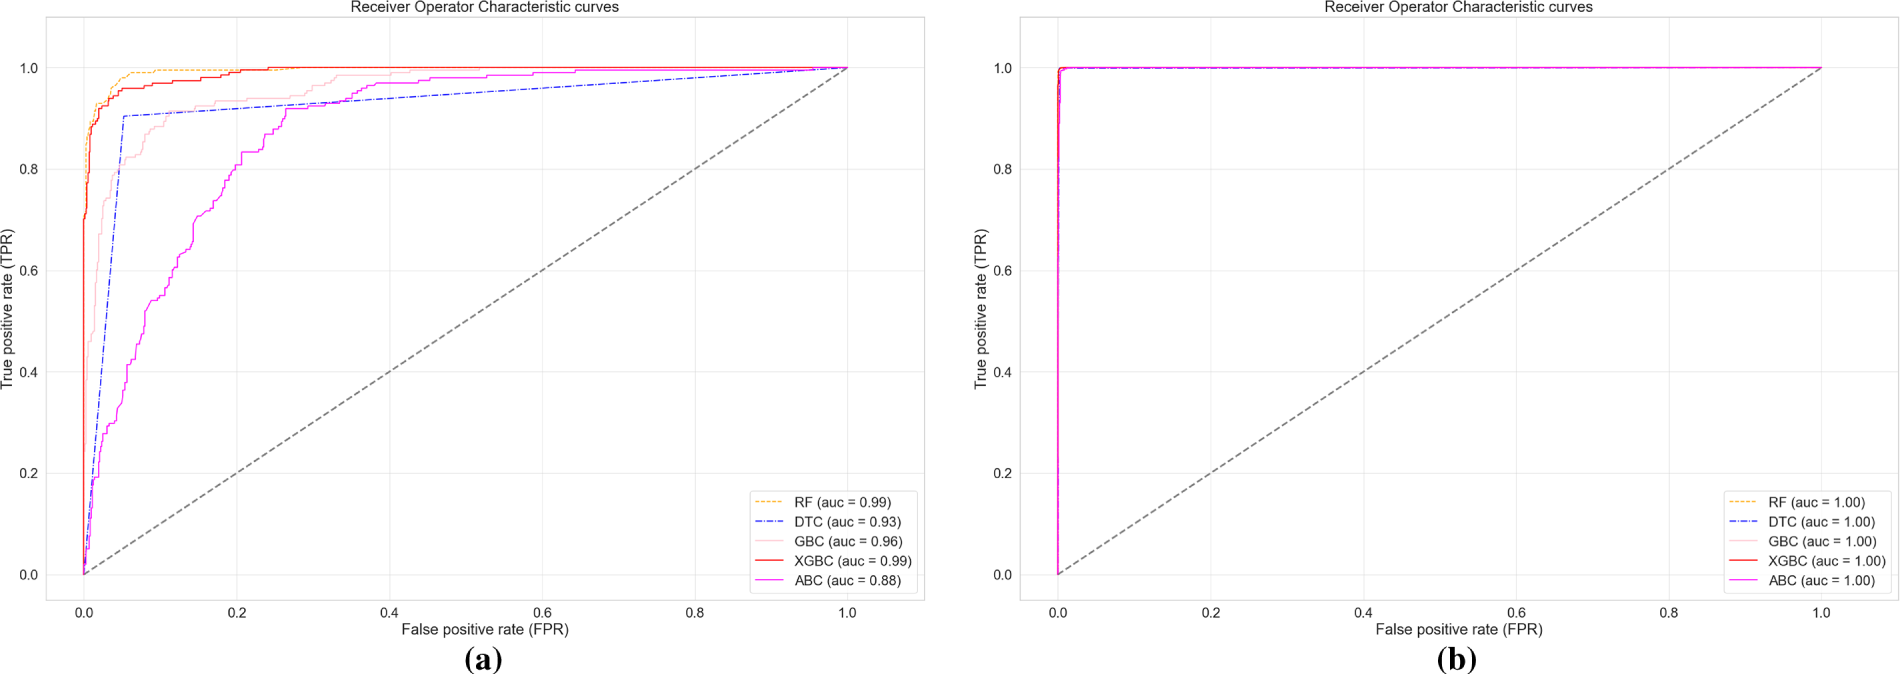
Figure 8: ROC curve for all features; (a) MSU-ORNL power system datasets; (b) UKMNCT_IIoT_FDIA dataset.
To validate the proposed model, this study uses IEEE 118-bus real-power grid data for testing [78]. This dataset comprises 12 types of measurements, primarily voltage magnitude and phase angle, active and reactive power, area, bus number, base KV, etc. Using a common time source for synchronization, a PMU (phasor measurement unit) is a device that measures power disturbances on an electrical grid. During the experiment, the individual DT model had lower accuracy, precision, recall, and F1-score. The XGBoost model performed satisfactorily, achieving the highest precision and F1-score. Finally, the proposed hybrid VMC model achieved the highest accuracy and recall, as shown in Fig. 9.

Figure 9: Proposed model performance evaluation using standard IEEE 118 bus dataset.
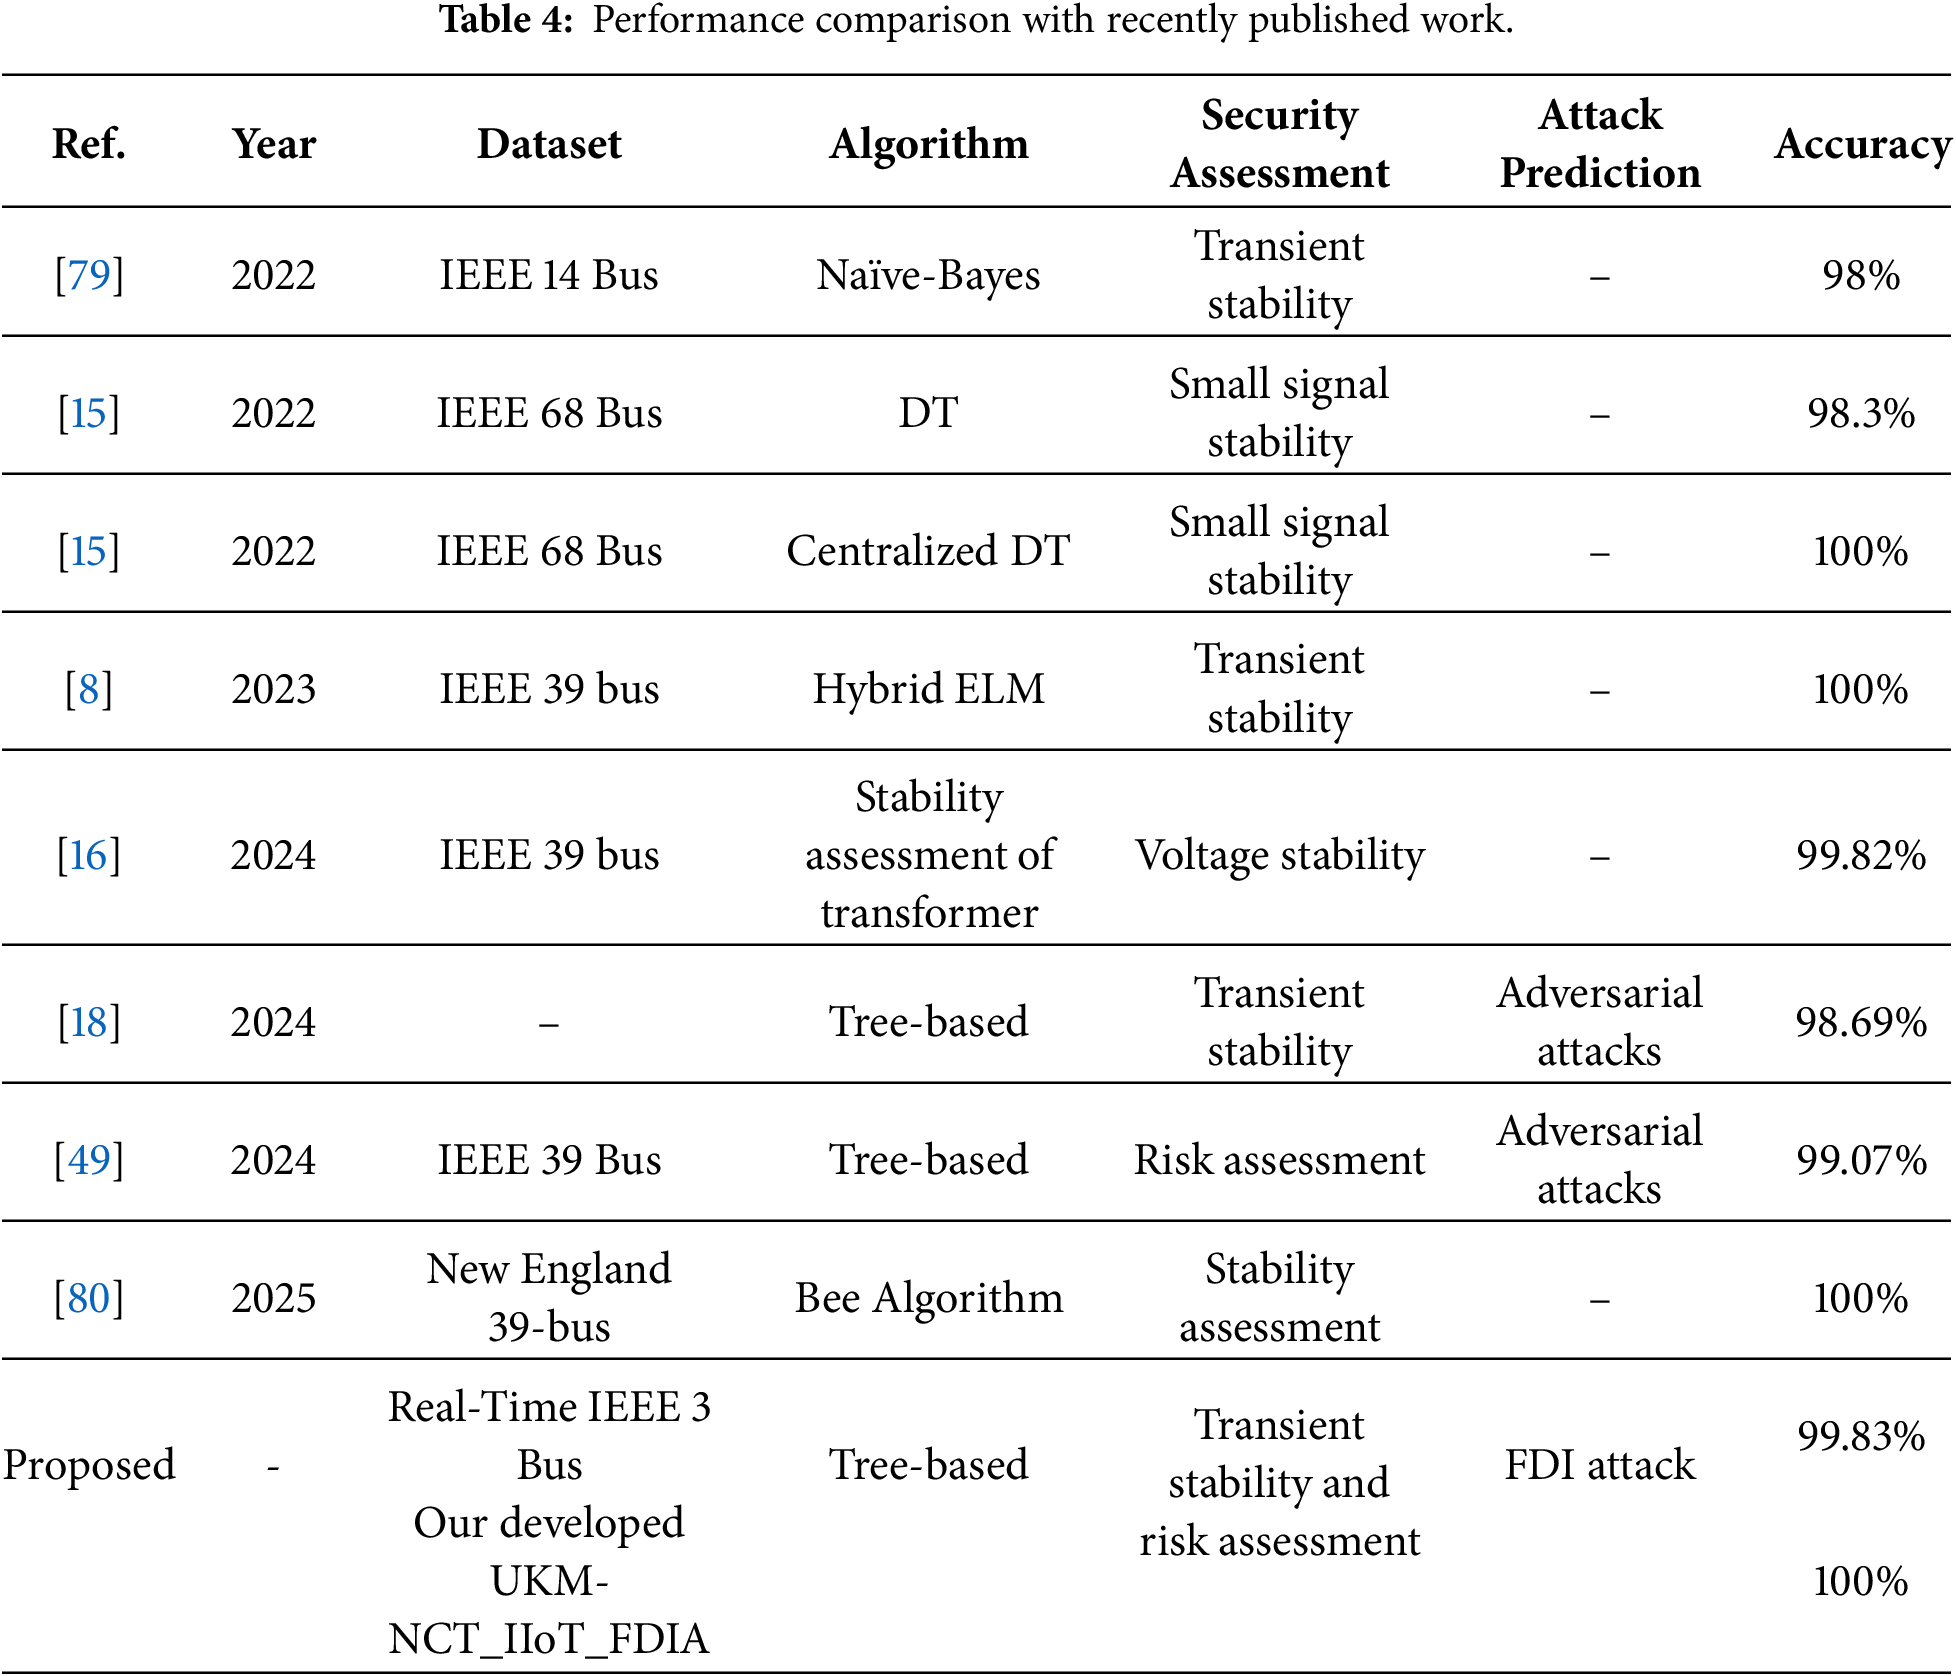
Recently, data-driven techniques have been used to create fast and efficient DSA systems. The performance of several centralized techniques was examined in the DSA domain (small-signal and transient stability). The classification of system stability is summarized in Table 4, based on prior research. All works achieved high accuracy (over 95%), despite their unique characteristics. Although it achieves comparable accuracy, the tree-based ensemble method proposed in this work is a viable alternative.
This study presents a DSA technique for stability, risk analysis, and cyberattack prediction in the SG-EPS. Additionally, the experiment was conducted using a consumer-electronics-based IIoT dataset. Data augmentation is an effective and cost-effective method for dynamically supplementing training datasets, though scenario prediction can be performed directly to develop a substantial, appropriate database. However, it can be demonstrated that even when an ML-based classifier can be effectively trained for an individual topology. The simulation results validated the successful performance and high accuracy of the proposed approach, which uses a hybrid VMC algorithm based on transient stability, risk assessment, and FDI attack detection to conduct DSA. Using this universal tool, train numerous models across various topologies. Furthermore, the DSA model’s performance could be improved by integrating adaptive batch normalization and training with a deep learning model, along with other commonly used domain adaptation strategies. As a result, improvements will also be carried out in this area. The results highlight how crucial algorithm selection is, especially when working with smaller datasets and limited unlabeled data. Analyzing federated learning can enhance model training privacy. Clarifying model explainability and prediction techniques such as Local Interpretable Model-agnostic Explanations (LIME) and Shapley Additive Explanations (SHAP) can be incorporated to improve assurance and highlight important aspects to consider while creating an ML model. These steps will contribute to the development of more robust and comprehensible models. The cybersecurity solutions for SG will be more scalable.
Acknowledgement: A. K. M. Ahasan Habib wants to thank Malaysia International Scholarship (MIS) for supporting the PhD study.
Funding Statement: This work has been supported by the Universiti Kebangsaan Malaysia, under the research grant DIP 2024-033.
Author Contributions: The authors confirm contribution to the paper as follows: Conceptualization, A. K. M. Ahasan Habib and Mohammad Kamrul Hasan; methodology, A. K. M. Ahasan Habib and Mohammad Kamrul Hasan; software, A. K. M. Ahasan Habib; validation, Mohammad Kamrul Hasan, A. K. M. Ahasan Habib, Shayla Islam, A. K. M. Zakir Hossain, Masrullizam Mat Ibrahim, Rosilah Hassan, Rahul Thakkar and Nguyen Vo; formal analysis, A. K. M. Ahasan Habib and Mohammad Kamrul Hasan; investigation, A. K. M. Ahasan Habib; data curation, A. K. M. Ahasan Habib and Mohammad Kamrul Hasan; writing—original draft preparation, A. K. M. Ahasan Habib; writing—review and editing, A. K. M. Ahasan Habib, Mohammad Kamrul Hasan, Shayla Islam, A. K. M. Zakir Hossain, Masrullizam Mat Ibrahim, Rosilah Hassan, Rahul Thakkar and Nguyen Vo; visualization, supervision, Mohammad Kamrul Hasan; project administration, Mohammad Kamrul Hasan; funding acquisition, Mohammad Kamrul Hasan. All authors reviewed and approved the final version of the manuscript.
Availability of Data and Materials: The data are available through these links: for MSU-ORNL datasets: https://www.kaggle.com/datasets/bachirbarika/power-system; UKMNCT_IIoT_FDIA dataset: https://zenodo.org/records/14864902 and IEEE 118-Bus dataset: https://github.com/power-grid-lib/pglib-opf/blob/master/pglib_opf_case118_ieee.m.
Ethics Approval: Not applicable.
Conflicts of Interest: The authors declare no conflicts of interest.
References
1. Hasan MK, Alkhalifah A, Islam S, Babiker NBM, Habib AKMA, Aman AHM, et al. Blockchain technology on smart grid, energy trading, and big data: security issues, challenges, and recommendations. Wirel Commun Mob Comput. 2022;2022(1):9065768. doi:10.1155/2022/9065768. [Google Scholar] [CrossRef]
2. Hasan MK, Habib AA, Islam S, Balfaqih M, Alfawaz KM, Singh D. Smart grid communication networks for electric vehicles empowering distributed energy generation: constraints, challenges, and recommendations. Energies. 2023;16(3):1140. doi:10.3390/en16031140. [Google Scholar] [CrossRef]
3. Almutairi A, Abiyo S, Hyejian J. Secured and smart system for energy management in microgrids using deep reinforcement learning. IEEE Trans Consum Electron. 2025;71(3):8339–46. doi:10.1109/TCE.2025.3576696. [Google Scholar] [CrossRef]
4. Ahmed MMR, Mirsaeidi S, Ali Koondhar M, Karami N, Tag-Eldin EM, Ghamry NA, et al. Mitigating uncertainty problems of renewable energy resources through efficient integration of hybrid solar PV/wind systems into power networks. IEEE Access. 2024;12(2):30311–28. doi:10.1109/ACCESS.2024.3370163. [Google Scholar] [CrossRef]
5. Alzubaidi M, Hasan KN, Meegahapola L. Probabilistic steady-state and short-term voltage stability assessment considering correlated system uncertainties. Electr Power Syst Res. 2024;228:110008. doi:10.1016/j.epsr.2023.110008. [Google Scholar] [CrossRef]
6. Ren C, Zhao YD, Skoglund M, Gao Y, Wang T, Zhang R. Enhancing dynamic security assessment in smart grids through quantum federated learning. IEEE Trans Autom Sci Eng. 2026;23(1):3255–67. doi:10.1109/TASE.2024.3486070. [Google Scholar] [CrossRef]
7. Zhu D, Ma Y, Li X, Fan L, Tang B, Kang Y. Transient stability analysis and damping enhanced control of grid-forming wind turbines considering current saturation procedure. IEEE Trans Energy Convers. 2025;40(3):2496–507. doi:10.1109/TEC.2024.3442925. [Google Scholar] [CrossRef]
8. Singh M, Chauhan S. A hybrid-extreme learning machine based ensemble method for online dynamic security assessment of power systems. Electr Power Syst Res. 2023;214(2):108923. doi:10.1016/j.epsr.2022.108923. [Google Scholar] [CrossRef]
9. Arjmand M, Akbari B, Ghaeini HR. From voltage to vulnerability: a comprehensive survey of dynamic security risk assessment techniques in smart grids. Int J Inf Secur. 2025;25(1):7. doi:10.1007/s10207-025-01173-2. [Google Scholar] [CrossRef]
10. Kkuni KV, Yang G. Effects of current limit for grid forming converters on transient stability: analysis and solution. Int J Electr Power Energy Syst. 2024;158(2):109919. doi:10.1016/j.ijepes.2024.109919. [Google Scholar] [CrossRef]
11. Habib AA, Hasan MK, Alkhayyat A, Islam S, Sharma R, Alkwai LM. False data injection attack in smart grid cyber physical system: issues, challenges, and future direction. Comput Electr Eng. 2023;107(4):108638. doi:10.1016/j.compeleceng.2023.108638. [Google Scholar] [CrossRef]
12. Vigneshwaran P, Thuseethan S, Shanmugam B, Thennadil S. Cyber attack detection in smart grids: a survey of methods, challenges and future directions. Comput Sci Rev. 2026;60(5):100915. doi:10.1016/j.cosrev.2026.100915. [Google Scholar] [CrossRef]
13. Tufail S, Iqbal H, Tariq M, Sarwat AI. A hybrid machine learning-based framework for data injection attack detection in smart grids using PCA and stacked autoencoders. IEEE Access. 2025;13(18):33783–98. doi:10.1109/ACCESS.2025.3543751. [Google Scholar] [CrossRef]
14. Zha L, Miao J, Liu J, Tian E, Peng C. Data-driven decentralized resilient control for large-scale systems under DoS attacks. IEEE Trans Consum Electron. 2025;71(2):5310–20. doi:10.1109/TCE.2025.3576804. [Google Scholar] [CrossRef]
15. da Cunha GL, Fernandes RAS, Fernandes TCC. Small-signal stability analysis in smart grids: an approach based on distributed decision trees. Electr Power Syst Res. 2022;203(3):107651. doi:10.1016/j.epsr.2021.107651. [Google Scholar] [CrossRef]
16. Li Y, Cao J, Xu Y, Zhu L, Dong ZY. Deep learning based on transformer architecture for power system short-term voltage stability assessment with class imbalance. Renew Sustain Energy Rev. 2024;189(Pt B):113913. doi:10.1016/j.rser.2023.113913. [Google Scholar] [CrossRef]
17. Xiong X, Hu S, Sun D, Hao S, Li H, Lin G. Detection of false data injection attack in power information physical system based on SVM-GAB algorithm. Energy Rep. 2022;8:1156–64. doi:10.1016/j.egyr.2022.02.290. [Google Scholar] [CrossRef]
18. Ren C, Zou C, Xiong Z, Yu H, Dong ZY, Dusit N. Achieving 500X acceleration for adversarial robustness verification of tree-based smart grid dynamic security assessment. IEEE/CAA J Autom Sin. 2024;11(3):800–2. doi:10.1109/JAS.2023.124053. [Google Scholar] [CrossRef]
19. Baluev D, Ali M, Gryazina E. State of the art approach for comprehensive power system security assessment—real case study. Int J Electr Power Energy Syst. 2024;155(4):109594. doi:10.1016/j.ijepes.2023.109594. [Google Scholar] [CrossRef]
20. Diao X, Zhao Y, Smidts C, Vaddi PK, Li R, Lei H, et al. Dynamic probabilistic risk assessment for electric grid cybersecurity. Reliab Eng Syst Saf. 2024;241(9):109699. doi:10.1016/j.ress.2023.109699. [Google Scholar] [CrossRef]
21. Azad S, Ameli MT. An imbalanced deep learning framework for pre-fault flexible multi-zone dynamic security assessment via transfer learning based graph convolutional network. Results Eng. 2025;25(5):104172. doi:10.1016/j.rineng.2025.104172. [Google Scholar] [CrossRef]
22. Boronuosi F, Azad S, Ameli MT, Shadi MR. Dynamic security assessment of power systems using a deep learning and GAIN-based approach for addressing missing data. Results Eng. 2025;27:106585. doi:10.2139/ssrn.4928644. [Google Scholar] [CrossRef]
23. Azad S, Ameli MT, Anvari-Moghaddam A, Shafie-Khah M. A transfer learning-based graph convolutional network for dynamic security assessment considering loss of synchronism of wind turbines and unknown faults. E Prime Adv Electr Eng Electron Energy. 2025;12(7):101012. doi:10.1016/j.prime.2025.101012. [Google Scholar] [CrossRef]
24. Wang X, Hu M, Luo X, Guan X. A detection model for false data injection attacks in smart grids based on graph spatial features using temporal convolutional neural networks. Electr Power Syst Res. 2025;238(2):111126. doi:10.1016/j.epsr.2024.111126. [Google Scholar] [CrossRef]
25. Pan H, Yang H, Na C, Jin J. A transformer and CNN-based hybrid model for localization detection of false data injection attacks in smart grids. Sustain Energy Grids Netw. 2026;45(3):102150. doi:10.1016/j.segan.2026.102150. [Google Scholar] [CrossRef]
26. Priesmann J, Münch J, Tillmanns M, Ridha E, Spiegel T, Reich M, et al. Artificial intelligence and design of experiments for resource adequacy assessment in power systems. Energy Strategy Rev. 2024;53:101368. doi:10.1016/j.esr.2024.101368. [Google Scholar] [CrossRef]
27. Mishra DK, Eskandari M, Abbasi MH, Sanjeevikumar P, Zhang J, Li L. A detailed review of power system resilience enhancement pillars. Electr Power Syst Res. 2024;230(5):110223. doi:10.1016/j.epsr.2024.110223. [Google Scholar] [CrossRef]
28. Ojo KE, Saha AK, Srivastava VM. Microgrids’ control strategies and real-time monitoring systems: a comprehensive review. Energies. 2025;18(13):3576. doi:10.3390/en18133576. [Google Scholar] [CrossRef]
29. Park B. Stochastic power system dynamic simulation using parallel-in-time algorithm. IEEE Access. 2024;12(7):28500–10. doi:10.1109/access.2024.3367358. [Google Scholar] [CrossRef]
30. Nazir Z, Bollen M. Operational risk assessment of transmission systems: a review. Int J Electr Power Energy Syst. 2024;159(4):109995. doi:10.1016/j.ijepes.2024.109995. [Google Scholar] [CrossRef]
31. Hailu E, Nyakoe GN, Muriithi CM. Techniques of power system static security assessment and improvement: a literature survey. Heliyon. 2023;9(3):e14524. doi:10.1016/j.heliyon.2023.e14524. [Google Scholar] [CrossRef]
32. Kundur P. Power system stability and control. New York, NY, USA: McGraw Hill; 1994. [Google Scholar]
33. Alimi OA, Ouahada K, Abu-Mahfouz AM. A review of machine learning approaches to power system security and stability. IEEE Access. 2020;8:113512–31. doi:10.1109/access.2020.3003568. [Google Scholar] [CrossRef]
34. Batchu S, Teeparthi K. Transient stability assessment and enhancement in the realm of power system dynamic security analysis: a review and scope of methods. In: Proceedings of the 2023 4th IEEE Global Conference for Advancement in Technology (GCAT); 2023 Oct 6–8; Bangalore, India. p. 1–8. doi:10.1109/GCAT59970.2023.10353368. [Google Scholar] [CrossRef]
35. Yang Y, Lin S, Chen S, Liu M, Li Q. A non-sampling time-domain simulation framework for transient stability assessment under stochastic continuous disturbances. IEEE Trans Power Syst. 2025;40(1):1130–43. doi:10.1109/TPWRS.2024.3416150. [Google Scholar] [CrossRef]
36. Lara JD, Henriquez-Auba R, Ramasubramanian D, Dhople S, Callaway D, Sanders S. Revisiting power systems time-domain simulation methods and models. In: Proceedings of the 2024 IEEE Power & Energy Society General Meeting (PESGM); 2024 Jul 21–25; Seattle, WA, USA. doi:10.1109/PESGM51994.2024.10689098. [Google Scholar] [CrossRef]
37. Gao Y, Lakshminarayana S, Avramidis II, Konstantinou C. Modeling and impact assessment of load-altering attacks in TSO-DSO coordinated power systems. IEEE Trans Smart Grid. 2026;(99):3668376. doi:10.1109/TSG.2026.3668376. [Google Scholar] [CrossRef]
38. Uzum B, Yoldas Y, Bahceci S, Onen A. Comprehensive review of transmission system operators–distribution system operators collaboration for flexible grid operations. Electr Power Syst Res. 2024;227:109976. doi:10.1016/j.epsr.2023.109976. [Google Scholar] [CrossRef]
39. Huang J, Guan L, Guo M, Cai Z, Zhu S, Lin Y. Edge-graph convolution and multi-hop attention jointly driven small-signal stability assessment against topology changes. Int J Electr Power Energy Syst. 2024;157(8):109846. doi:10.1016/j.ijepes.2024.109846. [Google Scholar] [CrossRef]
40. Yuan S, Wang LY, Yin G, Nazari MH. Stochastic hybrid system modeling and state estimation of modern power systems under contingency. arXiv:2401.16568. 2024. doi:10.48550/arxiv.2401.16568. [Google Scholar] [CrossRef]
41. Yu J, Li Z, Zhang J, Bai X, Ge H, Zheng JH, et al. Efficient contingency analysis of power systems using linear power flow with generalized warm-start compensation. Int J Electr Power Energy Syst. 2024;156:109692. doi:10.1016/j.ijepes.2023.109692. [Google Scholar] [CrossRef]
42. Jin Y, Xiong X, Zhang J, Pan L, Li Y, Wu X, et al. A prospective review on the design and operation of integrated energy system: the spotlight cast on dynamic characteristics. Appl Therm Eng. 2024;253:123751. doi:10.1016/j.applthermaleng.2024.123751. [Google Scholar] [CrossRef]
43. Habib AKMA, Hasan MK, Hassan R, Islam S, Thakkar R, Vo N. Distributed denial-of-service attack detection for smart grid wide area measurement system: a hybrid machine learning technique. Energy Rep. 2023;9:638–46. doi:10.1016/j.egyr.2023.05.087. [Google Scholar] [CrossRef]
44. Swain KP, Sharma A, Karkare A, Chakrabarti S, Gryazina E, Terzija V. Network-level vulnerability assessment of synchrophasor measurement devices. IEEE Access. 2024;12:72491–503. doi:10.1109/access.2024.3403456. [Google Scholar] [CrossRef]
45. Zhang Z, Yang Z, Yau DKY, Tian Y, Ma J. Data security of machine learning applied in low-carbon smart grid: a formal model for the physics-constrained robustness. Appl Energy. 2023;347:121405. doi:10.1016/j.apenergy.2023.121405. [Google Scholar] [CrossRef]
46. Zhang Z, Liu M, Sun M, Deng R, Cheng P, Niyato D, et al. Vulnerability of machine learning approaches applied in IoT-based smart grid: a review. IEEE Internet Things J. 2024;11(11):18951–75. doi:10.1109/JIOT.2024.3349381. [Google Scholar] [CrossRef]
47. Wali S, Farrukh YA, Khan I, Hamilton JA. Covert penetrations: analyzing and defending SCADA systems from stealth and Hijacking attacks. Comput Secur. 2025;156(1):104449. doi:10.1016/j.cose.2025.104449. [Google Scholar] [CrossRef]
48. Cremer JL, Strbac G. A machine-learning based probabilistic perspective on dynamic security assessment. Int J Electr Power Energy Syst. 2021;128(5):106571. doi:10.1016/j.ijepes.2020.106571. [Google Scholar] [CrossRef]
49. Chen Z, Ren C, Xu Y, Dong ZY, Li Q. Data-driven power system dynamic security assessment under adversarial attacks: risk warning based interpretation analysis and mitigation. IET Energy Syst Integr. 2024;6(1):62–72. doi:10.1049/esi2.12118. [Google Scholar] [CrossRef]
50. Venkata P, Pandya V, Sant A. Data mining and SVM based fault diagnostic analysis in modern power system using time and frequency series parameters calculated from full-cycle moving window. J Oper Autom Power Eng. 2024;12(3):206–14. doi:10.1016/j.matpr.2022.03.035. [Google Scholar] [CrossRef]
51. Tan Y, Du Z, Zhou W, Chen B. Distributed feature selection for power system dynamic security region based on grid-partition and fuzzy-rough sets. Electronics. 2024;13(5):815. doi:10.3390/electronics13050815. [Google Scholar] [CrossRef]
52. Ren C, Xu Y. A fully data-driven method based on generative adversarial networks for power system dynamic security assessment with missing data. IEEE Trans Power Syst. 2019;34(6):5044–52. doi:10.1109/TPWRS.2019.2922671. [Google Scholar] [CrossRef]
53. Chen Z, Ren C, Xu Y. An improved AdaBoost-based ensemble learning method for data-driven dynamic security assessment of power systems. In: Proceedings of the 2022 IEEE Power & Energy Society General Meeting (PESGM); 2022 Jul 17–21; Denver, CO, USA. p. 1–5. doi:10.1109/PESGM48719.2022.9917151. [Google Scholar] [CrossRef]
54. Yao P, Yan B, Yang Q. Game theoretical decision-making of dynamic defense in cyber-physical power systems under cyber-attacks. ACM Trans Cyber Phys Syst. 2025;9(2):1–21. doi:10.1145/3719658. [Google Scholar] [CrossRef]
55. Zhao Y, Zhao Y, Wan C, Du D. Dynamic attacks on smart meters over wireless channels in smart grid and the corresponding defensive policy: a Bayesian game model approach. Meas Control. 2025;2025:00202940251398968. doi:10.1177/00202940251398968. [Google Scholar] [CrossRef]
56. Gao H, Cai G, Yang D, Wang L. Real-time long-term voltage stability assessment based on eGBDT for large-scale power system with high renewables penetration. Electr Power Syst Res. 2023;214:108915. doi:10.1016/j.epsr.2022.108915. [Google Scholar] [CrossRef]
57. Yang Y, Wang Y, Zhang X. Research on power system small signal stability analysis and correction based on LightGBM algorithm. Electr Eng. 2024;106(4):4469–86. doi:10.1007/s00202-023-02226-2. [Google Scholar] [CrossRef]
58. Senyuk M, Safaraliev M, Kamalov F, Sulieman H. Power system transient stability assessment based on machine learning algorithms and grid topology. Mathematics. 2023;11(3):525. doi:10.3390/math11030525. [Google Scholar] [CrossRef]
59. Dong J, Mandich M, Zhao Y, Liu Y, You S, Liu Y, et al. AI-based faster-than-real-time stability assessment of large power systems with applications on WECC system. Energies. 2023;16(3):1401. doi:10.3390/en16031401. [Google Scholar] [CrossRef]
60. Letzgus S, Müller KR. An explainable AI framework for robust and transparent data-driven wind turbine power curve models. Energy AI. 2024;15(6):100328. doi:10.1016/j.egyai.2023.100328. [Google Scholar] [CrossRef]
61. Bin Akter S, Sarkar Pias T, Rahman Deeba S, Hossain J, Abdur Rahman H. Ensemble learning based transmission line fault classification using phasor measurement unit (PMU) data with explainable AI (XAI). PLoS One. 2024;19(2):e0295144. doi:10.1371/journal.pone.0295144. [Google Scholar] [CrossRef]
62. Yaacoub JPA, Noura HN, Salman O, Chahine K. Toward secure smart grid systems: risks, threats, challenges, and future directions. Future Internet. 2025;17(7):318. doi:10.3390/fi17070318. [Google Scholar] [CrossRef]
63. Hasan MK, Abdulkadir RA, Islam S, Gadekallu TR, Safie N. A review on machine learning techniques for secured cyber-physical systems in smart grid networks. Energy Rep. 2024;11:1268–90. doi:10.1016/j.egyr.2023.12.040. [Google Scholar] [CrossRef]
64. Fernandes FS, Bessa RJ, Lopes JP. Evolving symbolic model for dynamic security assessment in power systems. J Mod Power Syst Clean Energy. 2025;13(4):1113–26. doi:10.35833/MPCE.2024.000478. [Google Scholar] [CrossRef]
65. Liu F, Wang X, Li T, Huang M, Hu T, Wen Y, et al. An automated and interpretable machine learning scheme for power system transient stability assessment. Energies. 2023;16(4):1956. doi:10.3390/en16041956. [Google Scholar] [CrossRef]
66. Baur L, Ditschuneit K, Schambach M, Kaymakci C, Wollmann T, Sauer A. Explainability and interpretability in electric load forecasting using machine learning techniques—a review. Energy AI. 2024;16:100358. doi:10.1016/j.egyai.2024.100358. [Google Scholar] [CrossRef]
67. Noura HN, Yaacoub JPA, Salman O, Chehab A. Advanced machine learning in smart grids: an overview. Internet Things Cyber Phys Syst. 2025;5:95–142. doi:10.1016/j.iotcps.2025.05.002. [Google Scholar] [CrossRef]
68. Cifci A. Interpretable prediction of a decentralized smart grid based on machine learning and explainable artificial intelligence. IEEE Access. 2025;13(4):36285–305. doi:10.1109/ACCESS.2025.3543759. [Google Scholar] [CrossRef]
69. Haghshenas SH, Hasnat MA, Naeini M. A temporal graph neural network for cyber attack detection and localization in smart grids. In: Proceedings of the 2023 IEEE Power & Energy Society Innovative Smart Grid Technologies Conference (ISGT); 2023 Jan 16–19; Washington, DC, USA. p. 1–5. doi:10.1109/ISGT51731.2023.10066446. [Google Scholar] [CrossRef]
70. Musleh AS, Chen G, Zhao YD, Wang C, Chen S. Spatio-temporal data-driven detection of false data injection attacks in power distribution systems. Int J Electr Power Energy Syst. 2023;145:108612. doi:10.1016/j.ijepes.2022.108612. [Google Scholar] [CrossRef]
71. Chen B, Wu QH, Li M, Xiahou K. Detection of false data injection attacks on power systems using graph edge-conditioned convolutional networks. Prot Control Mod Power Syst. 2023;8:16. doi:10.1186/s41601-023-00287-w. [Google Scholar] [CrossRef]
72. Magnusson PC. The transient-energy method of calculating stability. Trans Am Inst Electr Eng. 1947;66(1):747–55. doi:10.1109/t-aiee.1947.5059502. [Google Scholar] [CrossRef]
73. Vincent E, Korki M, Seyedmahmoudian M, Stojcevski A, Mekhilef S. Detection of false data injection attacks in cyber–physical systems using graph convolutional network. Electr Power Syst Res. 2023;217:109118. doi:10.1016/j.epsr.2023.109118. [Google Scholar] [CrossRef]
74. Lundberg SM, Lee SI. A unified approach to interpreting model predictions. Adv Neural Inf Process Syst. 2017;30:1–10. [Google Scholar]
75. Borges Hink RC, Beaver JM, Buckner MA, Morris T, Adhikari U, Pan S. Machine learning for power system disturbance and cyber-attack discrimination. In: Proceedings of the 2014 7th International Symposium on Resilient Control Systems (ISRCS); 2014 Aug 19–21; Denver, CO, USA. p. 1–8. doi:10.1109/ISRCS.2014.6900095. [Google Scholar] [CrossRef]
76. Power system smart grid monitoring power [Internet]. 2014 [cited 2026 Jan 1]. Available from: https://www.kaggle.com/datasets/bachirbarika/power-system. [Google Scholar]
77. Habib AKMA, Hasan MK, Hassan R, Islam S, Abbas HS. False data injection attack dataset for classification, identification, and detection for IIoT in Industry 5.0. Data Brief. 2025;61:111692. doi:10.1016/j.dib.2025.111692. [Google Scholar] [CrossRef]
78. Power flow data for IEEE 118 bus test case [Internet]. 2023 [cited 2026 Jan 1]. Available from: https://github.com/power-grid-lib/pglib-opf/blob/master/pglib_opf_case118_ieee.m. [Google Scholar]
79. Oladeji I, Makolo P, Zamora R, Lie TT. Density-based clustering and probabilistic classification for integrated transmission-distribution network security state prediction. Electr Power Syst Res. 2022;211:108164. doi:10.1016/j.epsr.2022.108164. [Google Scholar] [CrossRef]
80. Alaerjan A, Jabeur R. An online learning method for assessing smart grid stability under dynamic perturbations. Sci Rep. 2025;15(1):10559. doi:10.1038/s41598-025-94718-3. [Google Scholar] [CrossRef]
Cite This Article
 Copyright © 2026 The Author(s). Published by Tech Science Press.
This work is licensed under a Creative Commons Attribution 4.0 International License , which permits unrestricted use, distribution, and reproduction in any medium, provided the original work is properly cited.
 Downloads
 Citation Tools
