
 Submit a Paper
 Propose a Special lssue
 Open Access
ARTICLE
Evaluating the Nighttime Human Activity in Green Spaces among Three Major Urban Agglomerations in China Using Green Lighting Index
1 Key Laboratory of Digital Earth Science, Aerospace Information Research Institute, Chinese Academy of Sciences, Beijing, 100094, China
2 International Research Center of Big Data for Sustainable Development Goals, Beijing, 100094, China
3 College of Resources and Environment, University of Chinese Academy of Sciences, Beijing, 100049, China
4 Institute of Space Earth Science, Nanjing University, Suzhou, 215163, China
* Corresponding Authors: Mingyang Lv. Email: ; Huadong Guo. Email:
Revue Internationale de Géomatique 2025, 34, 169-185. https://doi.org/10.32604/rig.2025.063997
Received 31 January 2025; Accepted 03 March 2025; Issue published 09 April 2025
 View Full Text
 Download PDF
Abstract
Green space plays an important role in the sustainable urban development. This study proposes the Green Lighting Index (GLI), integrating nighttime light data from SDGSAT-1 and the Normalized Difference Vegetation Index (NDVI) from Sentinel-2, to explore the nighttime human activity in green spaces across three major urban agglomerations in China: Beijing-Tianjin-Hebei (BTH), the Yangtze River Delta (YRD), and the Greater Bay Area (GBA). The findings reveal that, for most green spaces, the relationship between nighttime lighting and green spaces is predominantly exclusionary. However, a synergistic relationship is observed in some vibrant green spaces characterized by abundant nighttime lighting. This synergy is evident in high GLI levels, which are strongly positively correlated with per capita Gross Domestic Product (GDP). This research underscores the importance of integrating nighttime perspectives into green space studies. We believe GLI could be used in the assessment of green space quality and contribute to the development of sustainable cities.Keywords
Green spaces as defined by the World Health Organization are urban land covered with any form of vegetation, encompassing open spaces in cities used as parks or other green areas [1]. These spaces play a crucial role in promoting social and individual health and well-being. Research on green spaces focuses on the natural, semi-natural, and man-made ecological networks at various spatial scales within, around, and between urban areas [2], which help mitigate the urban heat island effect [3,4], reduce air pollution [5], and regulate the climate [6]. Promoting the development of green infrastructure is one of the key goals for achieving sustainable urban development. The Sustainable Development Goals (SDGs) were proposed by the United Nations in 2015 as a shared blueprint for peace and prosperity for people and the planet, both now and in the future [7]. Through the 17 SDGs, calls are made to end poverty and other forms of deprivation while implementing strategies that improve health and education, reduce inequality, and promote economic growth [7]. Specifically, SDG 11.7 emphasizes the need to provide universal access to safe, inclusive, and accessible green and public spaces by 2030. Many researchers have assessed green space quality through availability [8], biodiversity [9], and cooling effects [10]. The significance of green space lies in its ability to serve residents and enhance their health and well-being. An in-depth exploration of the relationship between green space and human activities is of great value [11,12] based on green space and population mapping have shown a reduction in global green space exposure inequality between 2000 and 2018 [13] further investigated the associations between green space and indicators such as residents’ income, education, language isolation, race/ethnicity, and age. Nighttime light data is highly correlated with the intensity of human activities [14]; however, the integration of nighttime perspectives into green space research remains underexplored. Incorporating a nighttime perspective can provide new insights into assessing the accessibility and equity of green spaces, as well as the sustainability of cities.
Remote sensing imagery allows for continuous and large-scale nighttime light data collection. Following the United States Defense Meteorological Satellite Program (DMSP) [15] and Suomi National Polar-orbiting Partnership (NPP) [16,17], the Sustainable Development Scientific Satellite-1 (SDGSAT-1) has further enhanced the spatial resolution of publicly available nighttime light data. Equipped with the Glimmer Imager sensor, SDGSAT-1 is capable of capturing panchromatic imagery with a spatial resolution of 10 m, as well as RGB bands with a spatial resolution of 40 m [18], and has already been effectively applied in studies on poverty evaluation [19], built-up area extraction [20,21], and other research areas. And sentinel-2 imagery provides red and near-infrared bands with a spatial resolution of 10 m. Them could perform detailed assessments of green spaces, which are increasingly fragmented and complex in nature [22].
Contrary to studies based on the individual exposure levels of surveyed residents, which suggest a mutually exclusive relationship (
Currently, the relationship between nighttime light and green spaces, particularly through satellite remote sensing imagery, remains an underexplored area. To fill this gap and test our hypothesis, we proposed the Green Lighting Index (GLI) to integrate nighttime lighting conditions and vegetation conditions. Our study is based on the three major urban agglomerations in China: the Beijing–Tianjin–Hebei urban agglomeration (BTH), the Yangtze River Delta urban agglomeration (YRD), and the Greater Bay Area urban agglomeration (GBA) (Fig. 1). These regions have experienced large-scale urbanization and feature various types of green spaces [26], including natural forests, farmland, and artificially created green landscapes, all of which cover substantial areas. This paper focuses on these three regions to examine the impact of nighttime light on green spaces.

Figure 1: Spatial location of three urban agglomerations: (a) BTH, (b) YRD, (c) GBA
The contribution of this study lies in two main aspects related to evaluating the nighttime human activity in green spaces. First, we constructed GLI for the three urban agglomerations in China, to evaluate the relationship between nighttime light and green spaces and analyze the similarities and differences among the urban agglomerations. Second, we demonstrated a strong positive correlation between GLI and per capita Gross Domestic Product (GDP), which is typically used as an indicator of residents’ well-being [27], highlighting the potential of GLI as a tool to assess urban sustainability in terms of accessible green and public spaces.
The BTH is located in North China Plain (36–42° N, 113–120° E). The region extends from the northwest mountain ranges (Yanshan-Taihang Mountains) to the southeast plain, presenting a terrain feature of higher northwest and lower southeast. It has a warm-temperate continental monsoon climate, covering an area of approximately 218,000 km2 and a permanent population of about 110 million. As the “Capital Economic Circle” centered around Beijing, the BTH includes Beijing and Tianjin, along with cities in Hebei Province, such as Baoding, Tangshan, Langfang, Shijiazhuang, Qinhuangdao, Zhangjiakou, Chengde, Cangzhou, Hengshui, Xingtai, Handan, and Anyang city in Henan Province. In 2023, the BTH region’s GDP was 10.44 trillion RMB [28], accounting for 8.5% of the total national economic of China.
The YRD is located in the alluvial plain before the Yangtze River flows into the sea (27–34° N, 116–122° E), with a subtropical monsoon climate. Covering an area of approximately 211,700 km2, it has a permanent population of about 225 million. The region includes Shanghai, as well as cities in Jiangsu Province (Nanjing, Wuxi, Changzhou, Suzhou, Nantong, Yancheng, Yangzhou, Zhenjiang, Taizhou), Zhejiang Province (Hangzhou, Ningbo, Wenzhou, Jiaxing, Huzhou, Shaoxing, Jinhua, Zhoushan, Taizhou), and Anhui Province (Hefei, Wuhu, Ma’anshan, Tongling, Anqing, Chuzhou, Chizhou, Xuancheng). Despite accounting for only 2.1% of China’s total land area, the YRD holds a quarter of China’s economic output. In 2023, its GDP reached 30.5 trillion RMB [29], making it the most economically developed and urbanized region in China.
The GBA is located south of the Tropic of Cancer, on China’s largest alluvial plain in the South Asian subtropical zone (21–24° N, 111–115° E). It has a long coastline, a rich port cluster, and vast sea areas, with a subtropical monsoon climate. The GBA covers an area of approximately 55,900 km2, with a permanent population of around 86.44 million. The region includes Hong Kong and Macau Special Administrative Regions, as well as nine cities in Guangdong Province: Guangzhou, Shenzhen, Zhuhai, Foshan, Huizhou, Dongguan, Zhongshan, Jiangmen, and Zhaoqing. In 2023, the GDP of the GBA reached 14 trillion RMB [28], making it one of the world’s leading bay areas and urban agglomerations.
The SDGSAT-1 satellite was launched by the Chinese Academy of Sciences (CAS) in November 2021 and is managed under the Big Earth Data Science Engineering Program of CAS. It operates in a sun-synchronous orbit with an inclination angle of 97.5°, a swath width of 300 km, and a revisit cycle of 11 days. SDGSAT-1 is equipped with three key payloads: the High-Resolution Thermal Infrared Spectrometer, the Glimmer Imager, and the Multispectral Imager. Designed to accurately capture human activity footprints, the Glimmer Imager operates at 9:30 PM local time, which is almost coincident with the period of high-intensity human activity. And it includes a single panchromatic band (ranging from 450 to 900 nm) with a 10-m resolution and three color bands—red (615–690 nm), green (520–615 nm), and blue (430–520 nm)—each with a 40-m resolution [30].
The standard SDGSAT-1 products, processed through relative radiometric correction, band registration, high dynamic range (HDR) fusion, rational polynomial coefficients (RPC) correction, and orthorectification [31], can be accessed from the SDGSAT-1 Open Science Program. The data source is available at: http://www.sdgsat.ac.cn (accessed on 1 January 2025). We have applied for RGB lighting data from the study area for the year 2024 (from January to December) as experimental data. Most of the data were acquired in summer (between June and September), while several images from other months were used to make up data voids caused by cloud and ice. When cloud cover appears in nighttime lighting images, it causes blurring. In this experiment, we select images with no cloud cover at all.
2.2.2 Sentinel-2 Multispectral Data
The Sentinel-2 multispectral data is used to calculate the Normalized Difference Vegetation Index (NDVI) as an indicator of green space coverage. This data comes from a wide-swath, high-resolution multispectral imaging mission supported by the European Space Agency (ESA) and is integral to Copernicus Land Monitoring studies. We utilized Sentinel-2 image from June to October 2024, obtained from Google Earth Engine (GEE, https://earthengine.google.com/ (accessed on 10 January 2025)), which is a platform designed for petabyte-scale scientific analysis and visualization of geospatial datasets, and it is freely available for research, education, and nonprofit use. We used Sentinel-2 Level-2A surface reflectance products, which have undergone radiometric calibration, geometric calibration, and atmospheric correction to remove the interference caused by atmospheric aerosols and water vapor. In the GEE platform, Sentinel-2 images selected based on date and cloud cover criteria were composited, and the red band (Wavelength: 664.5 nm, Pixel Size: 10 m) and the near-infrared band (Wavelength: 835.1 nm, Pixel Size: 10 m) were used to calculate the NDVI.
The annual GDP data for the cities within the three urban agglomerations were obtained from China’s urban statistical yearbooks, which are publicly available through the statistical bureaus of Jiangsu Province, Zhejiang Province, Anhui Province, Guangdong Province (including data for Hong Kong and Macau), Hebei Province, Henan Province, Beijing, Tianjin, and Shanghai. Due to the inherent lag in statistical reporting, the per capita GDP data for each city in the study were based on 2022 statistics (shown in Table 1).
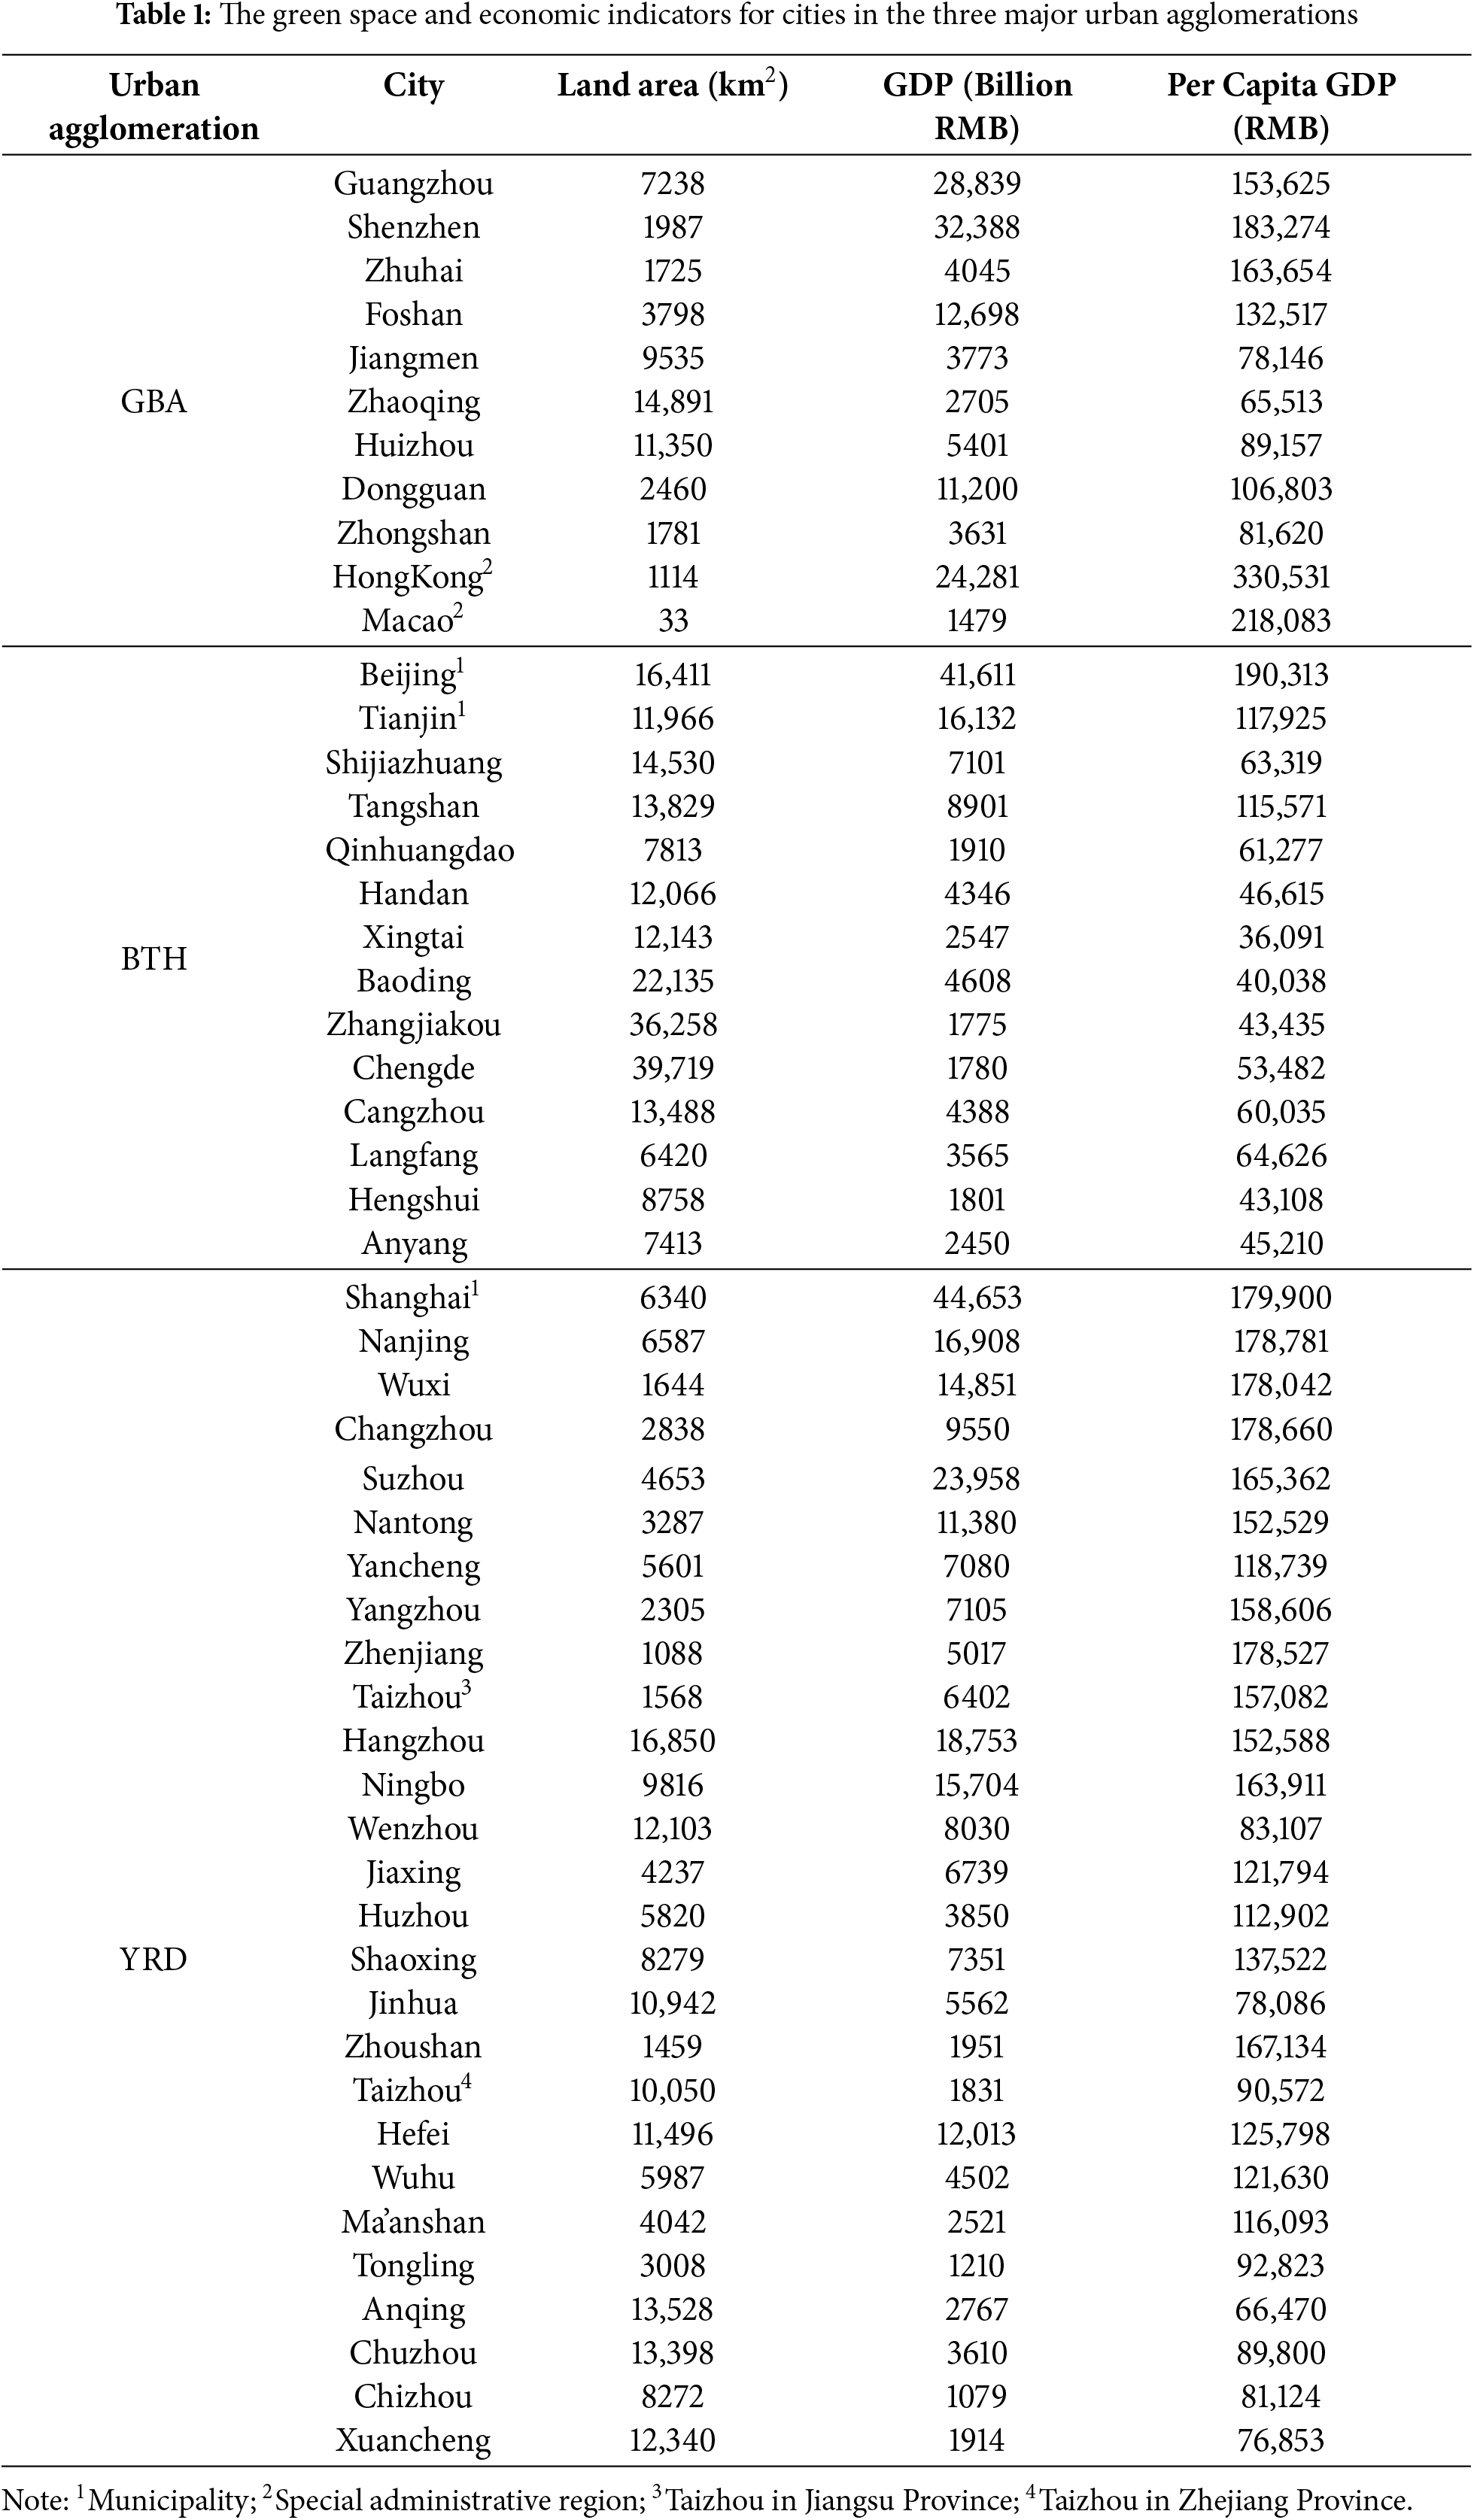
Table 1 summarizes the statistical data for 11 cities in the GBA, 14 cities in the BTH, and 27 cities in the YRD. The data include urban land area, GDP, and per capita GDP.
After preprocessing the SDGSAT-1 glimmer image and Sentinel-2 multispectral images for the three urban agglomerations, nighttime light map was extracted from the glimmer image, and NDVI was calculated using the red and infrared bands of Sentinel-2. The GLI was then computed by combining the NDVI within the green space areas with the nighttime light data (Fig. 2).

Figure 2: The flow of calculating GLI (the GBA as an example)
A fixed threshold for NDVI was used to define the extent of green spaces. For NDVI values standardized to the range of −1 to 1, values below 0.2 were non-vegetation (including barren areas, built-up areas, and road networks), values between 0.2 and 0.5 were low vegetation (including shrubland and grasslands), and values above 0.5 were high vegetation (including temperate and tropical urban forests) [32]. In our study, areas with NDVI values greater than 0.2 were designated as green spaces.
The 1% maximum linear stretching is applied to SDGSAT-1 glimmer images to mitigate the impact of outlier values and enhance the image contrast and visualization. This step is necessary because nighttime light imagery is inherently sparse, with most pixels exhibiting low values and a small fraction of extremely high values. Without stretching, these extreme high values dominate the contrast scale, making it difficult to discern the variations in regions with low to moderate values, which are often the primary areas of interest in analysis. Then, the pixel values in the raw data product, which represent the digital number (
where,
This study utilizes the already atmospherically corrected Sentinel-2 Level-2A product. In the GEE platform, we filtered the images with cloud coverage of less than 3% in the study area, and performed cloud removal using the scene classification layer band from Sentinel-2 data. The cloud shadows, cloud medium probability, cloud high probability, thin cirrus and snow pixels were removed, leaving only valid surface information. Then, NDVI was calculated using the red and near-infrared bands.
Both nighttime light data and NDVI were normalized to a 0 to 1 scale to reduce disparities between these two datasets. The NDVI was downscaled to 40 m resolution to align with the nighttime light data for joint analysis. All spatially referenced data used in this experiment were reprojected onto the WGS 1984 Web Mercator system (World Geodetic System 1984) to ensure geographical consistency.
We proposed the Green Lighting Index (GLI) to integrate nighttime lighting conditions and vegetation conditions, inspired by the Vegetation Health Index (VHI). VHI, widely used in remote sensing for drought monitoring, integrats vegetation condition and thermal condition to assess vegetation health under thermal environmental stress [33,34]. We found that the distribution of nighttime light in the three urban agglomerations follows a strong positive skew and it agrees well with a power law (Fig. 3). The
where,

Figure 3: Light intensity distribution of the three major urban agglomerations and the power-law fitting results, with the
In this study, we applied the GLI to green space cover to mitigate interference from extreme high-intensity lighting, which could otherwise lead to artificially high GLI values. This approach enables the GLI to more accurately characterize areas with both lush vegetation and abundant lighting.
In the GBA, the higher GLI values are primarily contributed by the coastal areas along the Pearl River Estuary and Shiziyang (Fig. 4a), including Macau, Zhuhai, Foshan, Southern Guangzhou, Dongguan, Shenzhen, and Hong Kong Island. These areas correspond to the top 8 cities in the GBA based on per capita GDP in 2022. In contrast, the western regions, such as Zhongshan, Jiangmen, Zhaoqing, and the eastern region of Huizhou, contribute more to the lower GLI values of the GBA, with their per capita GDP below 10,000 RMB, ranking in the bottom 3 cities of the GBA.

Figure 4: The impact of nighttime light on green spaces in the GBA, (a) Overview of GLI spatial distribution in the GBA; (b) Regional Composition of GLI in the GBA; (c–e) detailed GLI and Sentinel-2 true color views of GLI spatial distribution by varying degrees, with samples outlined with green lines and selected from Panyu District, Guangzhou, corresponding to the area marked in (a): (c) Chimelong Safari Park, (d) Dafu Mountain Forest Park, (e) Shiba Luohanshan Forest Park
In the Regional Composition of GLI in the GBA (Fig. 4b), Guangzhou, Zhuhai, Hong Kong, and Macau follow a leftward arrow structure, with their GLI share gradually increasing from low to high values, reaching the highest share at GLI = 1. These four cities contribute over 60% of the extremely high GLI values (0.9–1) in the GBA. Shenzhen, Foshan, Dongguan, and Zhongshan display a spindle-shaped structure, characterized by sharp ends and a broader middle, indicating that their GLI values are more evenly distributed in the middle range, with minimal shares in both the extreme high and low values. Jiangmen, Zhaoqing, and Huizhou exhibit a rightward arrow structure, where the share of GLI values decreases from low to high, suggesting that these areas have more pristine, unlit green spaces, and very little green space with adequate lighting for human activities at night.
In the BTH, GLI values are generally low across vast areas, with a large region of high GLI values concentrated primarily in Beijing, which is centrally located. Apart from Beijing, some other cities such as Tianjin, Tangshan, and Qinhuangdao near the Bohai Bay, as well as Langfang, which is close to Beijing, and Shijiazhuang, the capital of Hebei Province, also show certain ranges of high GLI values, while other cities generally exhibit very low GLI values, suggesting less intense urbanization and economic activity (Fig. 5a). The data corresponding to this situation is that in the BTH, the cities with a per capita GDP over 10,000 RMB in 2022 are Beijing, Tianjin, and Tangshan.

Figure 5: The impact of nighttime light on green spaces in the BTH, (a) Overview of GLI spatial distribution in the BTH; (b) Statistics on the extent to GLI, by city
In the Regional Composition of GLI in the BTH (Fig. 5b), the GLI proportion in Beijing exhibits an unusual and sharp increase within the range of 0.9–1, reaching 40%. And the remaining contributions to high GLI values primarily come from Tianjin, Shijiazhuang, Qinhuangdao, Baoding, and Hengshui. Due to the dominant share of GLI values in Beijing and Tianjin, the distribution in other cities is relatively even, with the exception of Chengde, which has approximately 20% of its GLI in the very low range.
In the YRD, GLI values are generally higher in the eastern areas, including the Yangtze River estuary and the delta region, covering cities such as Shanghai, Suzhou, Changzhou, Wuxi, Jiaxing, Hangzhou, Shaoxing, and Ningbo. And larger areas of high GLI values are also found in Nanjing and Hefei, which are located inland (Fig. 6a). The majority of cities in the YRD have a relatively high per capita GDP. Out of the 27 cities, 8 have a per capita GDP that does not exceed 10,000 RMB. In the Regional Composition of GLI in the YRD, the highest GLI values are primarily contributed by Shanghai, Suzhou, Yancheng, and Wenzhou. And Nanjing, Yangzhou, Ningbo, and Hefei show a typical spindle shape, with substantial contributions from the middle range of GLI values.

Figure 6: The impact of nighttime light on green spaces in the YRD, (a) Overview of GLI spatial distribution in the YRD; (b) Regional Composition of GLI in the BTH
5.1 Exclusionary and Synergistic Relationships between Green Spaces and Night Lighting
In recent studies, there has been no consensus regarding the relationship between green spaces and nighttime light. On one hand, Refs. [23–25] suggests that there is spatial and exclusive competition between natural and artificial infrastructure in urban areas, proposing that places with abundant nighttime light are likely to be areas with sparse green spaces, such as commercial and industrial zones, and contrastly areas with rich green spaces are often those with insufficient nighttime lighting, such as suburban areas, where lower population density and fewer economic activities result in relatively lower levels of nighttime illumination. The negative correlation between green spaces and nighttime light has been confirmed in several studies. Field investigations in Australian major cities [35] and Hong Kong, China [23] have shown a clear opposition in the spatial distribution of green spaces and nighttime light, and emphasizing that it is rare to find areas where both green spaces and nighttime light are either abundant or scarce at the same time.
On the other hand, Ref. [36] reveals that illumination at night alters the perception of the spatial configuration, meaning that green spaces that provide better lighting at night are perceived as safer, which in turn leads to higher foot traffic. From this perspective, green spaces with abundant lighting are better able to serve residents. While both perspectives offer valuable insights, in urban expansion, pristine green spaces with abundant vegetation and no nighttime lighting are transformed into road networks or buildings with high nighttime light intensity to accommodate human activities. Meanwhile, due to residents’ needs for daytime and nighttime activities in green spaces, some of these green spaces are preserved, renovated, and developed, maintaining high vegetation cover while providing sufficient lighting to better serve residents’ needs.
We selected 10,000 sample points from each of the three urban agglomerations and performed linear regression analysis on their light intensity and NDVI values (Fig. 7). In all three urban agglomerations, a negative correlation was found, with p-values less than 0.001, indicating a statistically significant relationship between light intensity and NDVI. However, the

Figure 7: The negative correlation between the nighttime light and green space. (a) YRD, (b) BTH, (c) GBA
From the distribution of sample points, it is evident that the majority of the negative correlation is driven by areas with low light intensity and high NDVI, as well as areas with high light intensity and low NDVI. This has led to the neglect of sample points with high light intensity and high NDVI, which are actually an important part of evaluating the effect of nighttime light over green spaces. To further clarify the significance of these points, this study selects samples from Panyu District in Guangzhou, Guangdong Province (Fig. 4c–e), to investigate the effects of different light intensities on green spaces. According to data released by the respective management authorities, the daily visitor numbers at Chimelong Safari Park, Dafu Mountain Forest Park, and Shiba Luohan Mountain Park are approximately 80,000, 10,000, and 1000 people, respectively, with their GLI values ranging from high to low.
During the development of China’s urban agglomerations, urban greening is a key factor related to residents’ well-being. SDG 11.7 also emphasizes that one of the indicators for building sustainable cities is to provide access to safe and inclusive green and public spaces. Urban designers and builders should consciously increase and protect green spaces to improve residents’ welfare. Zhou et al. [22] conducted a study on the green spaces of nine cities in the BTH and YRD, finding that these green spaces are highly dynamic. The green spaces in urban agglomerations should not be regarded as natural ecological environments but as an integral part of human-made urban infrastructure.
5.2 Comparison of GLI and Per Capita GDP in the Three Major Urban Agglomerations
From a spatial distribution perspective (see Figs. 4a–6a), the high GLI areas (indicated in yellow and red) in the three urban agglomerations exhibit different distribution patterns. In the BTH, high GLI areas are highly concentrated in Beijing, the central city of urban agglomerations, and in Tianjin, located to the southeast of Beijing. These two cities account for 50% of the high GLI regions in BTH. In contrast, the high GLI areas in the GBA and the YRD are distributed in multiple centers. In GBA, around one-quarter of the central and southern regions show high GLI values, with Guangzhou having the largest share, though still not exceeding 20%. In the YRD, high GLI clusters are found in the eastern Delta region, the southern coastal areas, and the northern part. Among all cities, Shanghai has the highest proportion of high GLI, yet it remains below 10%.
The results show that the average GLI is highest in the GBA, followed by YRD, and the lowest in BTH, with values of 0.0838, 0.0784, and 0.0735, respectively. The vast expanse of original forests within the urban agglomeration boundaries contributes to the overall low average GLI values. As mentioned in Section 2.1, the Yan and Taihang mountain ranges in the northwest of the BTH, along with the Tianmu Mountains in the southwest of the YRD, are regions characterized by dense vegetation and minimal human activity, resulting in GLI values close to 0 (represented by shades of blue in Figs. 5a and 6a).
As shown in the Fig. 8, there is a positive correlation between GLI and per capita GDP in each city. To explain this positive correlation, per capita GDP reflects the economic development strength of a given area. A strong local economy and sound fiscal conditions are conducive to the development of urban infrastructure, including the provision of ample green spaces that ensure residents’ well-being. Adequate lighting in these green spaces allows for residents’ use during leisure hours, most of which occur in the evening or at night, ensuring that these spaces are accessible 24 h a day. A higher GLI can be seen as an indicator of the local area’s well-developed and sustainable green space infrastructure. Among three major urban agglomerations in China, the southern urban agglomerations, YRD and GBA, exhibit a higher overall similarity, while the northern BTH shows an internal imbalance.

Figure 8: The positive correlation between GLI and per capita GDP. (a) in the YRD, (b) in the BTH, (c) in the GBA
In the YRD, the GLI values of cities range from 0 to 0.3, and per capita GDP ranges from 50,000 to 200,000 RMB, with a relatively even distribution. The linear regression analysis shows p < 0.0001 and R = 0.7350, indicating a highly statistically significant and strong positive correlation between GLI and per capita GDP.
In the BTH, while the statistical indicators are similar to those in YRD, the distribution is more uneven. Most cities have GLI values concentrated less than 0.1, and their per capita GDP values are mainly in the range of 40,000 to 60,000 RMB. The liner regression model shows a negative intercept, suggesting an imbalance between the sample cities. Beijing and Tianjin have high GLI and per capita GDP, while Tangshan, which is heavily reliant on heavy industries as an economic pillar, ranks third in per capita GDP but has relatively low GLI. This could be attributed to the limited green space and population size in the area. Langfang has high GLI but lower per capita GDP, which can be explained by the commuter flow between Beijing and Langfang [37]. A large number of people live in Langfang but contribute to Beijing’s GDP.
For the GBA, the linear regression between GLI and per capita GDP shows p = 0.4056 and R = 0.2158, and the positive correlation is less pronounced than in the other two urban agglomerations. This is partly due to the special economic and urban development paths of Hong Kong and Macau, leading to a large disparity between GLI and per capita GDP in these regions. And cities such as Zhongshan and Dongguan, known as China’s major lighting production bases, tend to display more nighttime lighting, with its intensity exceeding the level of human activity. These factors can explain the less significant positive correlation. However, other cities in the GBA show similarities with those in the YRD, with GLI values concentrated between 0 and 0.3 and per capita GDP values range from 50,000 to 200,000 RMB.
The GLI offers advantages as an indicator for assessing the nighttime human activity in green space and the accessibility of urban green areas. By incorporating nighttime light data, the GLI captures nighttime human activity in relation to green spaces, providing insights into the usage patterns of green space. This index has shown a positive correlation with per capita GDP, highlighting the potential link between economic development and green space availability. As a potential indicator for evaluating urban sustainability, the GLI can contribute to effective urban planning, resource management, and the enhancement of residents’ well-being.
In this study, equal weights were assigned to green space conditions and nighttime light conditions. Under varying climatic and economic conditions across different regions, the relative contributions of green space and nighttime lighting to the GLI may differ [38–40], warranting further evaluation of this relationship.
Exposure to green spaces has a positive impact on residents’ health, including reducing the risks of all-cause mortality and stroke-specific mortality, lowering the incidence of cardiovascular diseases, and improving cardiometabolic health factors, and promoting mental health, better sleep quality, and a reduction in urban crime rates [41,42]. While there is a well-established consensus on the positive impacts of green spaces on human health, future research should delve deeper with the negative effects of nighttime light on human health. Light exposure in night has been associated with increased risks of breast cancer and other cancers, disruptions to sleep and circadian rhythms, obesity, cardiovascular and mental health disorders, metabolic imbalances, and pregnancy-related complications [43,44], with these effects being more pronounced with prolonged or late-night exposure. Addressing these impacts is crucial for advancing an integrated evaluation framework that encompasses green spaces, nighttime light, and human health.
This study investigates the nighttime human activity in green spaces across three major urban agglomerations in China: BTH, YRD and GBA, using GLI, which integrates nighttime light data from SDGSAT-1 and the NDVI from Sentinel-2.
In addition to the primarily exclusionary relationship between nighttime lighting and green spaces, for certain vibrant green spaces with abundant nighttime lighting, a synergistic relationship is observed. This synergy is reflected in high GLI levels, which are strongly positively correlated with per capita GDP, a key indicator of residents’ well-being. In the three urban agglomerations, the distribution pattern of GLI differs. In BTH, high GLI is concentrated in Beijing and Tianjin, with other cities showing low values. And the YRD and GBA demonstrate a more even distribution of GLI across cities. These patterns highlight how economic factors, regional development models, and geographic contexts influence the utilization of green spaces.
By leveraging high-resolution nighttime light and vegetation data, the GLI not only captures the interplay between human activity and green spaces but also underscores regional distinctions in green space utilization. The strong positive correlation between GLI and per capita GDP reveals that well-lit green spaces are associated with higher levels of economic development. By aligning with SDG 11.7—‘provide universal access to safe, inclusive and accessible, green and public spaces, in particular for women and children, older persons and persons with disabilities’, the findings underscore the potential of GLI as an indicator for supporting inclusive, accessible, and well-managed green spaces in urban planning efforts.
Acknowledgement: The research findings are a component of the SDGSAT-1 Open Science Program, which is conducted by International Research Center of Big Data for Sustainable Development Goals (CBAS). We acknowledge Google Earth Group for GEE cloud platform and freely available Sentinel-2 (ESA).
Funding Statement: This work is supported by National Natural Science Foundation of China (grant nos. 42101124, W2412136), International Research Center of Big Data for Sustainable Development Goals (grant no. CBAS2022GSP02), and Nanjing University Integrated Research Platform of the Ministry of Education—Top Talents Program.
Author Contributions: The authors confirm contribution to the paper as follows. Research design: Mingyang Lv and Huadong Guo; Data collection: Pei Tan, Changyong Dou, Xue Jin, and Wuhe Li; Analysis and interpretation of results: Pei Tan, Xue Jin, and Wuhe Li; Draft manuscript preparation: Pei Tan and Mingyang Lv. All authors reviewed the results and approved the final version of the manuscript.
Availability of Data and Materials: The data that support the findings of this study are openly available in CBAS at http://www.sdgsat.ac.cn (accessed on 10 January 2025) and GEE at https://code.earthengine.google.com/ (accessed on 10 January 2025).
Ethics Approval: Not applicable.
Conflicts of Interest: The authors declare no conflicts of interest to report regarding the present study.
References
1. World Health Organization Regional Office for Europe. Urban green spaces: a brief for action [Internet]. UN City, Denmark: World Health Organization Regional Office for Europe; 2017 [cited 2025 Jan 20]. Available from: https://www.who.int/europe/publications/i/item/9789289052498. [Google Scholar]
2. Sandström UG. Green infrastructure planning in urban Sweden. Plan Pract Res. 2002;17(4):373–85. doi:10.1080/02697450216356. [Google Scholar] [CrossRef]
3. Doick KJ, Peace A, Hutchings TR. The role of one large greenspace in mitigating London’s nocturnal urban heat island. Sci Total Environ. 2014;493:662–71. doi:10.1016/j.scitotenv.2014.06.048. [Google Scholar] [PubMed] [CrossRef]
4. Lin J, Qiu S, Tan X, Zhuang Y. Measuring the relationship between morphological spatial pattern of green space and urban heat island using machine learning methods. Build Environ. 2023;228:109910. doi:10.1016/j.buildenv.2022.109910. [Google Scholar] [CrossRef]
5. Venter ZS, Hassani A, Stange E, Schneider P, Castell N. Reassessing the role of urban green space in air pollution control. Proc Natl Acad Sci U S A. 2024;121(6):e2306200121. doi:10.1073/pnas.2306200121. [Google Scholar] [PubMed] [CrossRef]
6. Kingsley M, Ontario E. Commentary—climate change, health and green space co-benefits. Health Promot Chronic Dis Prev Can. 2019;39(4):131–5. doi:10.24095/hpcdp.39.4.04. [Google Scholar] [PubMed] [CrossRef]
7. United Nations. Sustainable development goals [Internet]. [cited 2025 Jan 20]. Available from: https://sdgs.un.org/goals. [Google Scholar]
8. Kabisch N, Strohbach M, Haase D, Kronenberg J. Urban green space availability in European cities. Ecol Indic. 2016;70(1):586–96. doi:10.1016/j.ecolind.2016.02.029. [Google Scholar] [CrossRef]
9. Aronson MF, Lepczyk CA, Evans KL, Goddard MA, Lerman SB, MacIvor JS, et al. Biodiversity in the city: key challenges for urban green space management. Frontiers Ecol Environ. 2017;15(4):189–96. doi:10.1002/fee.1480. [Google Scholar] [CrossRef]
10. Aram F, Higueras García E, Solgi E, Mansournia S. Urban green space cooling effect in cities. Heliyon. 2019;5(4):e01339. doi:10.1016/j.heliyon.2019.e01339. [Google Scholar] [PubMed] [CrossRef]
11. Wu S, Chen B, Webster C, Xu B, Gong P. Improved human greenspace exposure equality during 21st century urbanization. Nat Commun. 2023;14(1):6460. doi:10.1038/s41467-023-41620-z. [Google Scholar] [PubMed] [CrossRef]
12. Chen B, Wu S, Song Y, Webster C, Xu B, Gong P. Contrasting inequality in human exposure to greenspace between cities of Global North and Global South. Nat Commun. 2022;13(1):4636. doi:10.1038/s41467-022-32258-4. [Google Scholar] [PubMed] [CrossRef]
13. Heo S, Bell ML. Investigation on urban greenspace in relation to sociodemographic factors and health inequity based on different greenspace metrics in 3 US urban communities. J Expo Sci Environ Epidemiol. 2023;33(2):218–28. doi:10.1038/s41370-022-00468-z. [Google Scholar] [PubMed] [CrossRef]
14. Elvidge CD, Baugh KE, Anderson SJ, Sutton PC, Ghosh T. The night light development index (NLDIa spatially explicit measure of human development from satellite data. Soc Geogr. 2012;7(1):23–35. doi:10.5194/sg-7-23-2012. [Google Scholar] [CrossRef]
15. Elvidge C, Baugh K, Kihn E, Kroehl H, Davis ER. Mapping city lights with nighttime data from the DMSP operational linescan system. Photogramm Eng Remote Sens. 2009;63:727–34. [Google Scholar]
16. Miller SD, Mills SP, Elvidge CD, Lindsey DT, Lee TF, Hawkins JD. Suomi satellite brings to light a unique frontier of nighttime environmental sensing capabilities. Proc Natl Acad Sci U S A. 2012;109(39):15706–11. doi:10.1073/pnas.1207034109. [Google Scholar] [PubMed] [CrossRef]
17. Román MO, Wang Z, Sun Q, Kalb V, Miller SD, Molthan A, et al. NASA’s Black Marble nighttime lights product suite. Remote Sens Environ. 2018;210:113–43. [Google Scholar]
18. Guo H, Dou C, Chen H, Liu J, Fu B, Li X, et al. SDGSAT-1: the world’s first scientific satellite for sustainable development goals. Sci Bull. 2023;68(1):34–8. [Google Scholar]
19. Yu B, Chen F, Ye C, Li Z, Dong Y, Wang N, et al. Temporal expansion of the nighttime light images of SDGSAT-1 satellite in illuminating ground object extraction by joint observation of NPP-VIIRS and sentinel-2A images. Remote Sens Environ. 2023;295:113691. [Google Scholar]
20. Li C, Chen F, Wang N, Yu B, Wang L. SDGSAT-1 nighttime light data improve village-scale built-up delineation. Remote Sens Environ. 2023;297:113764. [Google Scholar]
21. Wang L, Ye C, Chen F, Wang N, Li C, Zhang H, et al. CG-CFPANet: a multi-task network for built-up area extraction from SDGSAT-1 and Sentinel-2 remote sensing images. Int J Digit Earth. 2024;17(1):2310092. [Google Scholar]
22. Zhou W, Wang J, Qian Y, Pickett STA, Li W, Han L. The rapid but “invisible” changes in urban greenspace: a comparative study of nine Chinese cities. Sci Total Environ. 2018;627(4):1572–84. doi:10.1016/j.scitotenv.2018.01.335. [Google Scholar] [PubMed] [CrossRef]
23. Liu Y, Kwan MP, Wang J, Cai J. Confounding associations between green space and outdoor artificial light at night: systematic investigations and implications for urban health. Environ Sci Ecotechnol. 2024;21(3):100436. doi:10.1016/j.ese.2024.100436. [Google Scholar] [PubMed] [CrossRef]
24. Beele E, Aerts R, Reyniers M, Somers B. Spatial configuration of green space matters: associations between urban land cover and air temperature. Landsc Urban Plan. 2024;249(3):105121. doi:10.1016/j.landurbplan.2024.105121. [Google Scholar] [CrossRef]
25. Qian Y, Zhou W, Li W, Han L. Understanding the dynamic of greenspace in the urbanized area of Beijing based on high resolution satellite images. Urban For Urban Green. 2015;14(1):39–47. doi:10.1016/j.ufug.2014.11.006. [Google Scholar] [CrossRef]
26. Xu Z, Zhang Z, Li C. Exploring urban green spaces in China: spatial patterns, driving factors and policy implications. Land Use Policy. 2019;89(29):104249. doi:10.1016/j.landusepol.2019.104249. [Google Scholar] [CrossRef]
27. Dědeček R, Dudzich V. Exploring the limitations of GDP per capita as an indicator of economic development: a cross-country perspective. Rev Econ Perspect. 2022;22(3):193–217. doi:10.2478/revecp-2022-0009. [Google Scholar] [CrossRef]
28. National Bureau of Statistics of China. Achievements of 75 years of economic and social development in new china series report [Internet]. Beijing, China: National Bureau of Statistics of China; 2024 [cited 2025 Jan 20]. Available from: https://www.stats.gov.cn/zt_18555/ztfx/xzg75njjshfzcj/202409/t20240913_1956438.html. [Google Scholar]
29. Shanghai Municipal Bureau of Statistics. 2023 Shanghai national economic and social development statistical bulletin [Internet]. Shanghai, China: Shanghai Municipal Bureau of Statistics; 2024 [cited 2025 Jan 20]. Available from: https://tjj.sh.gov.cn/tjgb/20240321/f66c5b25ce604a1f9af755941d5f454a.html. [Google Scholar]
30. Guo H. Atlas of SDGSAT-1 satellite nighttime light image. Beijing, China: Science Press; 2024. [Google Scholar]
31. International Research Center of Big Data for Sustainable Development Goals C. Handbook of SDGSAT-1 satellite products (Version 1.0). Beijing, China: International Research Center of Big Data for Sustainable Development Goals; 2022 [cited 2025 Jan 20]. Available from: https://www.sdgsat.ac.cn/userGuide/document. [Google Scholar]
32. Hashim H, Abd Latif Z, Adnan NA. Urban vegetation classification with ndvi threshold value method with very high resolution (vhr) Pleiades imagery. Int Arch Photogramm Remote Sens Spatial Inf Sci. 2019;42:237–40. doi:10.5194/isprs-archives-XLII-4-W16-237-2019. [Google Scholar] [CrossRef]
33. Kogan FN. Global drought watch from space. Bull Amer Meteor Soc. 1997;78(4):621–36. [Google Scholar]
34. Kogan F, Salazar L, Roytman L. Forecasting crop production using satellite-based vegetation health indices in Kansas, USA. Int J Remote Sens. 2012;33(9):2798–814. doi:10.1080/01431161.2011.621464. [Google Scholar] [CrossRef]
35. Stanhope J, Liddicoat C, Weinstein P. Outdoor artificial light at night: a forgotten factor in green space and health research. Environ Res. 2021;197:111012. doi:10.1016/j.envres.2021.111012. [Google Scholar] [PubMed] [CrossRef]
36. Dwimirnani P, Karimi K, Palaiologou G. Space after dark: measuring the impact of public lighting at night on visibility, movement, and spatial configuration in urban parks. In: Proceedings-11th International Space Syntax Symposium, SSS 2017; 2017 Jul 3–7; Lisbon, Portugal. p. 129.1–8. [Google Scholar]
37. Chang Y, Zhang Q. Industrial transfer and spatial structure optimization of Beijing, Tianjin and Hebei province. Int J Des Nat Ecodyn. 2020;15(4):593–602. doi:10.18280/ijdne.150418. [Google Scholar] [CrossRef]
38. Bento VA, Gouveia CM, DaCamara CC, Libonati R, Trigo IF. The roles of NDVI and land surface temperature when using the vegetation health index over dry regions. Glob Planet Change. 2020;190:103198. doi:10.1016/j.gloplacha.2020.103198. [Google Scholar] [CrossRef]
39. Zeng J, Zhang R, Qu Y, Bento VA, Zhou T, Lin Y, et al. Improving the drought monitoring capability of VHI at the global scale via ensemble indices for various vegetation types from 2001 to 2018. Weather Clim Extrem. 2022;35:100412. doi:10.1016/j.wace.2022.100412. [Google Scholar] [CrossRef]
40. Levin N, Kyba CCM, Zhang Q, Sánchez de Miguel A, Román MO, Li X, et al. Remote sensing of night lights: a review and an outlook for the future. Remote Sens Environ. 2020;237(3–4):111443. doi:10.1016/j.rse.2019.111443. [Google Scholar] [CrossRef]
41. Yang BY, Zhao T, Hu LX, Browning MHEM, Heinrich J, Dharmage SC, et al. Greenspace and human health: an umbrella review. Innovation. 2021;2(4):100164. [Google Scholar] [PubMed]
42. Twohig-Bennett C, Jones A. The health benefits of the great outdoors: a systematic review and meta-analysis of greenspace exposure and health outcomes. Environ Res. 2018;166:628–37. doi:10.1016/j.envres.2018.06.030. [Google Scholar] [CrossRef]
43. Bożejko M, Tarski I, Małodobra-Mazur M. Outdoor artificial light at night and human health: a review of epidemiological studies. Environ Res. 2023;218:115049. doi:10.1016/j.envres.2022.115049. [Google Scholar] [PubMed] [CrossRef]
44. Cho Y, Ryu SH, Lee BR, Kim KH, Lee E, Choi J. Effects of artificial light at night on human health: a literature review of observational and experimental studies applied to exposure assessment. Chronobiol Int. 2015;32(9):1294–310. doi:10.3109/07420528.2015.1073158. [Google Scholar] [PubMed] [CrossRef]
Cite This Article
 Copyright © 2025 The Author(s). Published by Tech Science Press.
This work is licensed under a Creative Commons Attribution 4.0 International License , which permits unrestricted use, distribution, and reproduction in any medium, provided the original work is properly cited.
 Downloads
 Citation Tools