
 Submit a Paper
 Propose a Special lssue
 Open Access
ARTICLE

ENST00000535926 is an unfavorable prognosis-related and tumor-promoting transcript of the CHPF gene in luminal A and B breast cancer
1 Cancer Center, West China Hospital, Sichuan University, Chengdu, 610041, China
2 Department of Breast Surgery, Sichuan Academy of Medical Science & Sichuan Provincial People’s Hospital, Chengdu, 610072, China
* Corresponding Authors: YONG LUO. Email: ; CHENG YI. Email:
# Jing Luo and Jianping He contributed equally to this study
BIOCELL 2023, 47(2), 309-318. https://doi.org/10.32604/biocell.2023.025377
Received 08 July 2022; Accepted 30 August 2022; Issue published 18 November 2022
 View Full Text
 Download PDF
Abstract
Chondroitin sulfate synthase 2 (CHPF) is characterized as an oncogenic and poor prognosis-related gene in breast cancer. However, this gene has alternative splicing products encoding proteins of different lengths. Breast cancer is a group of heterogeneous tumors with distinct clinical and genomic characteristics. In this study, we explored the expression profile and prognostic value of the two transcripts of CHPF using data from The Cancer Genome Atlas (TCGA)-BRCA. The functional regulation of the two transcripts was also studied in MCF-7 and BT-474 cells. Among the two transcripts of CHPF, ENST00000535926 expression was significantly upregulated in the tumor samples and was the dominant isoform. ENST00000535926, but not ENST00000243776 upregulation, was associated with significantly worse progression-free survival (PFS) and disease-specific survival (DSS) in luminal A/B cases. However, no significant association was observed in PFS or DSS in other Prediction Analysis of Microarray 50 (PAM50) subgroups. CHPF isoform 2 protein (encoded by ENST00000535926) significantly elevated the expression of P3H1 and RCN3 at the mRNA and protein levels in MCF-7 and BT-474 cells. The effect of ENST00000535926 was significantly stronger than ENST00000243776 in promoting tumor cell colony formation. The expression of P3H1 and RCN3 was negatively correlated with CD8+ T cell infiltration but was positively correlated with cancer-associated fibroblast infiltration in luminal A/B tumors. In summary, this study revealed that ENST00000535926 is an unfavorable prognosis-related and tumor-promoting transcript of the CHPF gene in luminal A/B breast cancer.Keywords
Glycosaminoglycans (GAGs) are long and unbranched polysaccharides, acting as extracellular matrix components (Afratis et al., 2012). GAGs are frequently dysregulated in the tumor microenvironment (TME) of breast cancer (Hampton et al., 2022; Kowitsch et al., 2017; Wei et al., 2020). Chondroitin sulfate is a major component of the GAG family and can covalently link to the core protein, forming chondroitin sulfate proteoglycans (CSPGs). CSPGs participate in diverse physiological events, such as cytokinesis, morphogenesis, and neuronal plasticity (Wei et al., 2020). Excessive chondroitin sulfate generation can exacerbate the aggressive behaviors of breast cancer cells by promoting growth, invasion, and metastasis (Cooney et al., 2011; Iida et al., 2015; Monzavi-Karbassi et al., 2007).
In humans, biosynthesis of chondroitin sulfate chains is initiated via the linkage of N-acetylgalactosamine (GalNAc) to a tetrasaccharide structure, glucuronic acid (GlcA)-GalNAc-GalNAc-xylose, on a core protein (Mikami and Kitagawa, 2013). Then, the chondroitin sulfate chain is elongated by chondroitin sulfate synthases (CHSY1, CHPF/CHSY2, CHPF2, and CHSY3), that have both β-1,3-GlcA and β-1,4-GalNAc transferase activity (Mikami and Kitagawa, 2013). CHPF upregulation is common in multiple types of cancer (Hou et al., 2019; Liao et al., 2021; Lin et al., 2021). CHPF promotes triple-negative breast cancer cell growth, metastasis, and accumulation of myeloid-derived suppressor cells (MDSCs) (Liao et al., 2021). Its prognostic significance in breast cancer was also confirmed by a recent bioinformatic analysis (Li et al., 2022).
However, breast cancer is a group of heterogeneous tumors with distinct clinical and genomic characteristics (Liu et al., 2022; Nielsen et al., 2014; Wang et al., 2022). A 50-gene quantitative polymerase chain reaction (qPCR assay; Prediction Analysis of Microarray 50, PAM50) of gene profiles can generally classify breast cancer into luminal A, luminal B, human epidermal growth factor receptor 2 (HER2)-enriched, basal-like (largely triple-negative), and normal-like breast cancer subtypes (Nielsen et al., 2014). In addition, CHPF is a gene with alternative splicing, with two isoforms (isoform 1: ENST00000243776 and isoform 2: ENST00000535926) expressing two proteins with different lengths (775 amino acids (aa) and 613 aa, respectively, Suppl. Fig. S1). The short isoform 2 (also called Klokin1) can facilitate the transport of parkin to the mitochondria, enhance cell viability, and protect neuronal cells against oxidative stress (Kuroda et al., 2012).
Considering the important tumor-promoting effects of CHPF in breast cancer, it is necessary to explore whether it has transcript-specific regulations. In this study, we explored the expression and prognostic significance of the two transcripts using data from The Cancer Genome Atlas (TCGA)-breast cancer (BRCA). In addition, the functional regulation of the two transcripts was also studied in MCF-7 and BT-474 cells.
The bioinformatic part of this study is based on Genotype-Tissue Expression (GTEx), and TCGA, in which the data are anonymous and informed consent was appropriately handled. Ethical approval was not required, as no primary patient data were collected by any author in the current study.
Data retrieval and bioinformatic analysis
RNA-seq data of normal breast tissues in the GTEx project and tumor and tumor-adjacent normal in TCGA-BRCA were obtained as we previously described (Luo et al., 2020; Tian et al., 2020), using the UCSC Xena browser (https://xenabrowser.net/) (Goldman et al., 2020). RNA-seq data were obtained for 179 normal breast tissues in GTEx and 1210 cases in TCGA-BRCA (113 tumor-adjacent normal tissues and 1097 primary tumors). Among the 1097 primary tumor cases, 839 had PAM50 information, including 420 luminal A, 192 luminal B, 66 HER2+, 139 basal-like, and 22 normal-like. The transcript expression and isoform percentages were compared between GTEx and TCGA-BRCA. The survival data, including progression-free survival (PFS) and disease-specific survival (DSS), were extracted. Kaplan-Meier (K-M) survival curves were generated by median transcript or gene expression in PAM50 subgroups.
The top CHPF-correlated genes in TCGA-BRCA were identified using cBioPortal for Cancer Genomics (https://www.cbioportal.org/). Then, the correlation between these genes and the two CHPF transcripts was assessed separately by calculating Pearson’s correlation coefficients.
Since we observed that the dysregulation of certain CHPF transcripts might be associated with poor prognosis of luminal A and liminal B subtypes, we used luminal A representative tumor cell line MCF-7 and luminal B representative tumor cell line BT-474 for in vitro study. These two cell lines were cultured as described previously (Tian et al., 2020). Lentiviral ENST00000243776 or ENST00000535926 overexpression plasmids were generated based on the pLenti-CMV-puro backbone. Empty lentiviral plasmids (vector) served as a negative control. Lentivirus production and infection following the methods introduced previously (Luo et al., 2020; Tian et al., 2020).
Quantitative real-time polymerase chain reaction (qRT-PCR) assay
qRT-PCR assays were performed as we described previously (Tian et al., 2020). In brief, total RNA was extracted from MCF-7 and BT-474 cells with or without ENST00000535926 or ENST00000243776 overexpression using Trizol Reagent (Thermo Fisher Scientific, Waltham, MA, USA). Complementary DNA was reversely transcribed and used as the template for following PCR assays. Targeting mRNAs were amplified using SYBR Premix Ex Taq (TaKaRa, Dalian, China) with the ABI PRISM 7900HT Sequence Detection System (Applied Biosystems). We checked the data in Internal Control Genes (http://icg.big.ac.cn/index.php/Main_Page) (Sang et al., 2018). ACTB is among the appropriate reference genes for research and clinical analysis of breast tumor samples. The following primers were used: human CHPF, 5′-AACGCACGTACCAGGAGATCC-3′ (forward) and 5′-GGATGGTGCTGGAATACCCACG-3′ (reverse); human P3H1, 5′-GTCACTGGATGTGAGCAGACTG-3′ (forward) and 5′-ACTCGTGGTCAGAGATTACGCC-3′ (reverse); human RCN3, 5′-TCGAGAGGAGCTGACAGCCTTC-3′ (forward) and 5′-TCCTCCACCTGGACATAGCCAT-3′ (reverse); human EFEMP2, 5′-ACTCCTATGGGACCTTCCTGTG-3′ (forward) and 5′-CTCGTTGATGCAGCGGTACTGA-3′ (reverse); human ACTB, 5′-CACCATTGGCAATGAGCGGTTC-3′ (forward) and 5′-AGGTCTTTGCGGATGTCCACGT-3′ (reverse). The melting curve with a single peak was considered a pure and single amplicon and was used for the following data analysis. Representative melting curves were provided in Suppl. Fig. S2. Relative mRNA levels were normalized to ACTB and calculated using the 2−ΔΔCT method, based on three times of repeats in triplicate.
Western blotting was performed following the methods introduced previously (Tian et al., 2020). In brief, total proteins were extracted from MCF-7 and BT-474 cells, separated using 10% sodium dodecyl sulfate-polyacrylamide gel electrophoresis, and electro-transferred onto polyvinylidene difluoride membranes (Millipore, Billerica, MA, USA). Then, the membranes were blocked and incubated with primary antibodies against CHPF (1: 500, YT0924, Immunoway, Suzhou, China), P3H1 (1: 1000, 26691-1-AP, Proteintech, Wuhan, China), RCN3 (1: 1000, 27497-1-AP, Proteintech), EFEMP2 (1: 1000, 12004-1-AP, Proteintech), and β-actin (1: 2000, 20536-1-AP, Proteintech) overnight at 4°C. Then, the membranes were incubated with horse radish peroxidase-conjugated secondary antibodies for 1 h at room temperature. The protein band signals were developed using BeyoECL Star reagent (Beyotime, Shanghai, China) and an ImageQuant LAS-4000 imaging system (GE Healthcare, Piscataway, NJ, USA). The experiment was repeated three times.
Cells with or without ENST00000535926 and ENST00000243776 overexpression were seeded into 6-well plates (500 cells/well) and were cultured for about two weeks. Then, the cellular colonies were fixed with methanol and stained with 0.5% crystal violet. The plates were scanned, and the colonies were visually counted. The experiment was repeated three times in triplicate.
Estimation of tumor infiltration
The correlation between P3H1/LEPRE1 or RCN3 expressions and the infiltration of immune cells (CD8+ T cells, Tregs, MDSC, and cancer-associated fibroblasts) in luminal A and luminal B cases in TCGA were estimated using TIMER 2.0 (http://timer.cistrome.org/) (Li et al., 2020). This platform provides computational algorithms to infer immune infiltrates’ abundances from bulk tumor transcriptome profiles in TCGA. Estimation was performed in luminal A and luminal B cases separately.
Statistical analysis was performed using GraphPad Prism 8.1.2 (GraphPad Inc., La Jolla, CA, USA). One-way ANOVA and post-hoc Dunnett’s multiple comparisons test were performed for multiple group comparisons. Welch’s unequal variances t-test was conducted for a two-group comparison. The log-rank test was performed for survival analysis. A value with p < 0.05 was considered statistically significant.
ENST00000535926 is the dominant CHPF transcript in breast cancer tissues
I expression profile of CHPF transcripts (ENST00000243776 and ENST00000535926) in normal and cancerous breast tissues was examined by comparing RNA-seq data in GTEx-breast (all normal tissues, n = 179) and TCGA-BRCA (PAM50 subgroups), in terms of transcript expression and isoform percentage. The wave diagram and plot chart showed that ENST00000535926 and ENST00000243776 have similar TPM values and percentages in normal breast tissues (Figs. 1A and 1B).
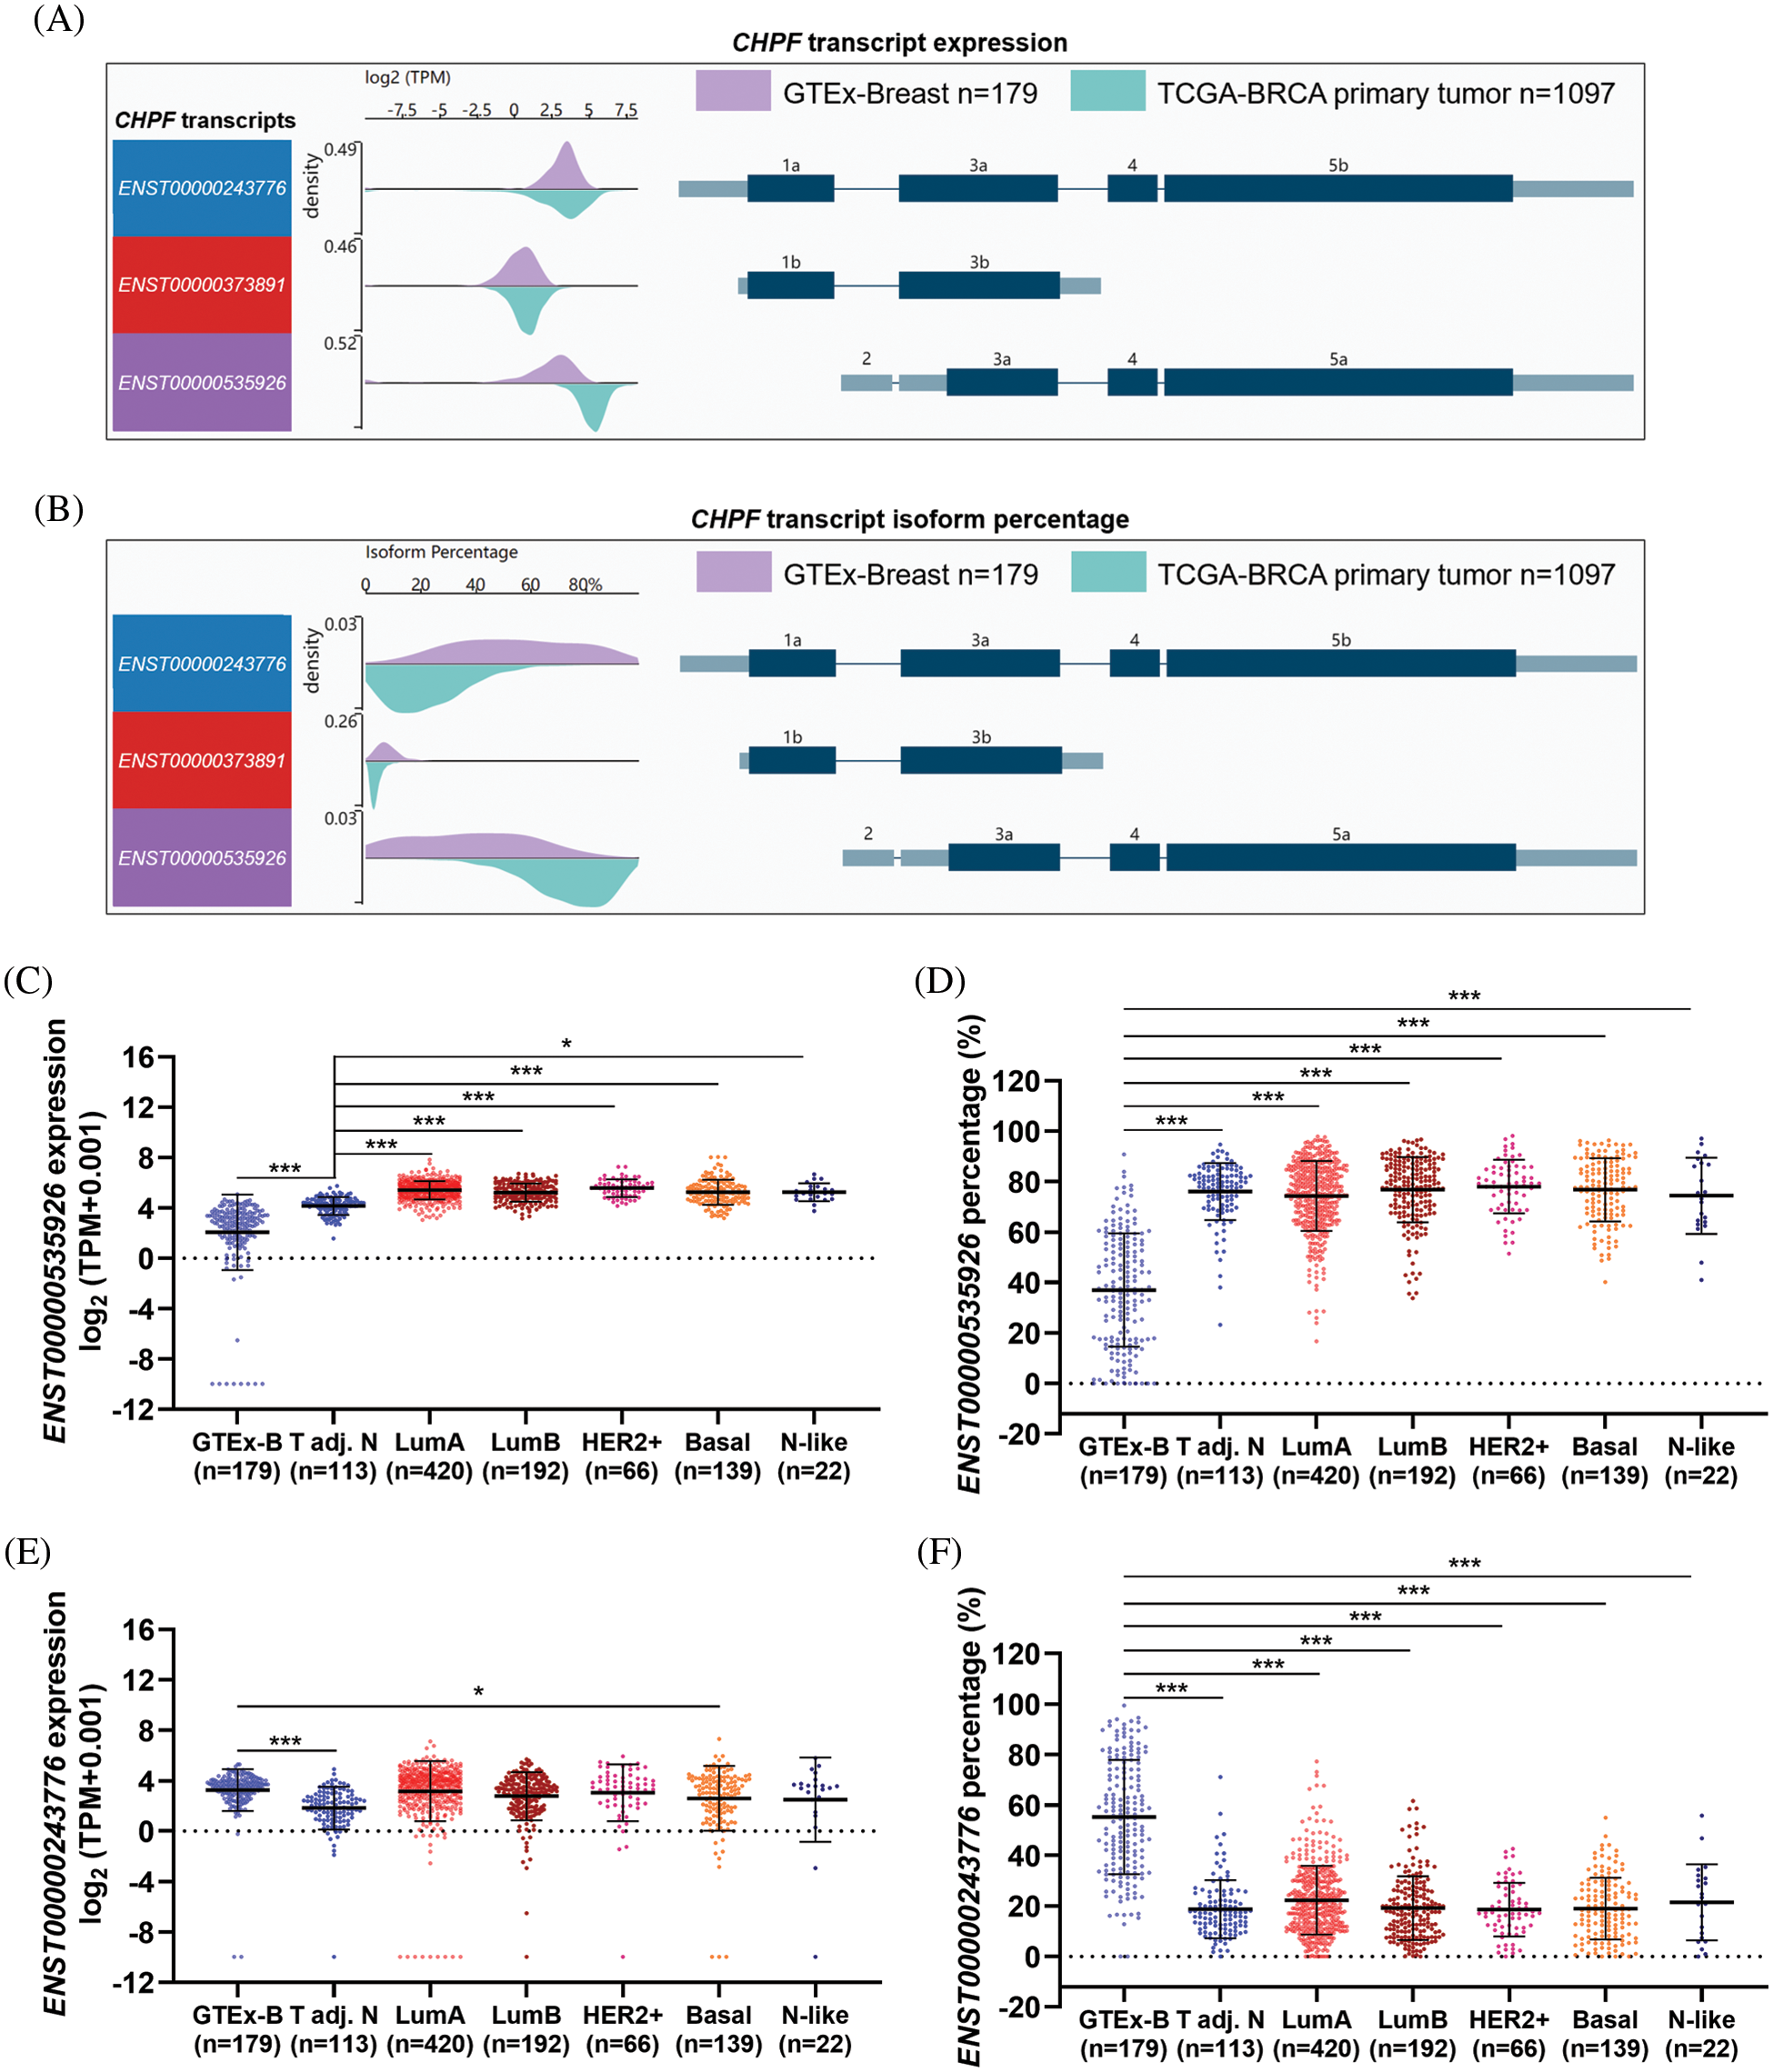
Figure 1: ENST00000535926 is the major CHPF transcript in breast cancer tissues. (A, B) Wave charts were generated to compare the expression (log2(TPM+0.001)) (A) and isoform percentage (B) of ENST00000535926 and ENST00000243776 in GTEx-normal breast tissues and primary breast tumors in TCGA. (C–F) Plot charts were generated to compare the expression (log2(TPM+0.001)) (C and E) and isoform percentage (D and F) of ENST00000535926 (C, D) and ENST00000243776 (E, F) in GTEx-normal breast tissues and the PAM50 subgroups in TCGA-BRCA. GTEx-B: GTEx-normal breast; adj. N: adjacent normal. One-way ANOVA and post-hoc Dunnett’s multiple comparisons test were performed. *p < 0.05; ***p < 0.001.
Compared to the GTEx-normal group, ENST00000535926 expression was significantly upregulated in tumor-adjacent normal tissues and all PAM50 tumor subgroups (Fig. 1C). In addition, its isoform percentage increased from approximately 40% in GTEx-normal breast tissues to over 70% in the cancer groups in TCGA (Fig. 1D). However, ENST00000243776 expression was significantly lower in tumor-adjacent normal tissues in TCGA-BRCA than in GTEx (Fig. 1E). Its expression was similar among GTEx-normal, luminal A, luminal B, HER2+, and basal tumor subgroups (Fig. 1E). In terms of isoform percentage, it dropped from around 50% in GTEx-normal breast to about 20% in the cancer groups in TCGA (Fig. 1F).
ENST00000535926 upregulation is associated with unfavorable survival in patients with luminal A and B tumors
Since the PAM50 subgroups have significant heterogeneity in the genomic background and clinical outcomes, we assessed the association between the expression of the two transcripts and survival in each PAM50 subgroup. Patients were categorized into two groups by median transcript expression. K-M survival analysis showed that high ENST00000535926 expression was associated with significantly shorter PFS and DSS in patients with luminal A and B tumors (Figs. 2A, 2B, 2E, 2F). However, no significant association was observed in HER2+ or basal subgroup (Figs. 2C, 2D, 2G, 2H). High ENST00000243776 expression was associated with significantly worse DSS in luminal B cases (Fig. 2N). However, no significant association was observed in PFS or DSS in other subgroups (Figs. 2I–2M, 2O, 2P).
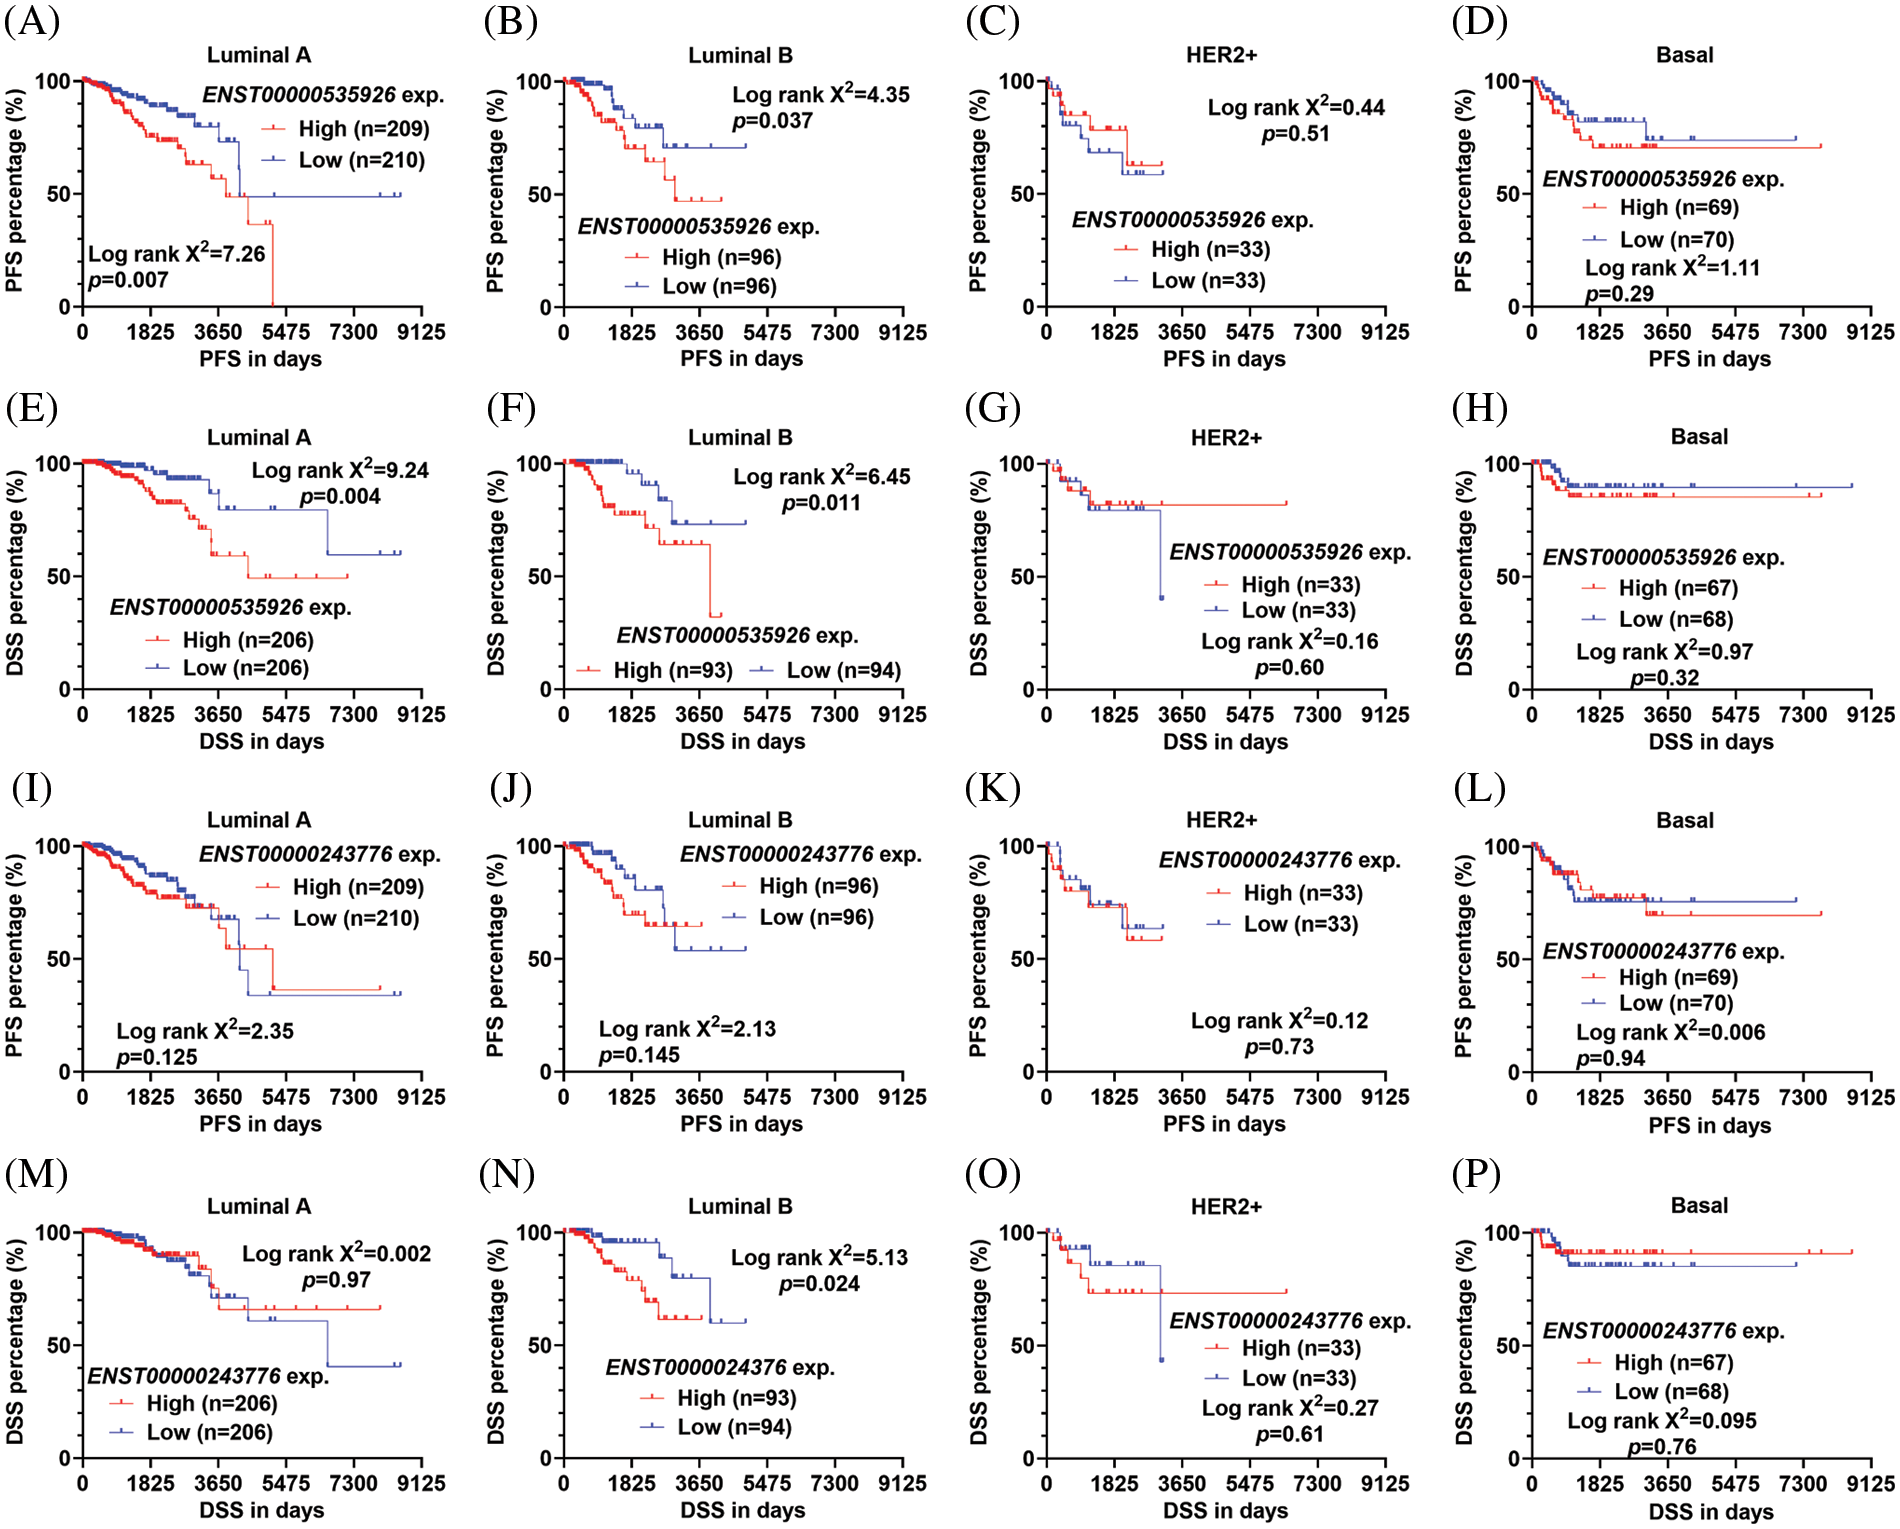
Figure 2: ENST00000535926 upregulation is associated with unfavorable survival in patients with luminal A and B tumors (A–P). (K–M) Survival curves were generated to compare the difference in PFS (A–D, I–L) and DSS (E–H, M–P) in the PAM50 subtypes of breast cancer in TCGA. Patients were separated by median ENST00000535926 expression (exp.) (A–H) or ENST00000243776 expression (I–P). Log-rank test was conducted to assess the statistical difference between survival curves.
Chondroitin sulfate synthase isoform 2 protein stimulates the expression of P3H1 and RCN3 and promotes tumor cell colony formation
Since the two transcripts of CHPF have distinct prognostic significance, we tried to assess their functional differences in breast cancer. Using cBioPortal for Cancer Genomics, we characterized the top 19 genes correlated with total CHPF gene expression in luminal A and B cases in TCGA-BRCA. Then, the correlations between the expression of these genes and the two CHPF transcripts were assessed separately (Fig. 3A). By setting 0.3 as the cutoff for the difference in correlation coefficients, we found three genes (P3H1, RCN3, and EFEMP2) highly or moderately correlated with ENST00000535926 expression, but were only weakly correlated with or irrelevant to ENST00000243776 expression (Figs. 3A, 3C–3H). However, no significant correlation (|Pearson’s r| ≥ 0.2) was observed between the two isoforms and ESR1 expression in luminal A/B cases (Fig. 3B).
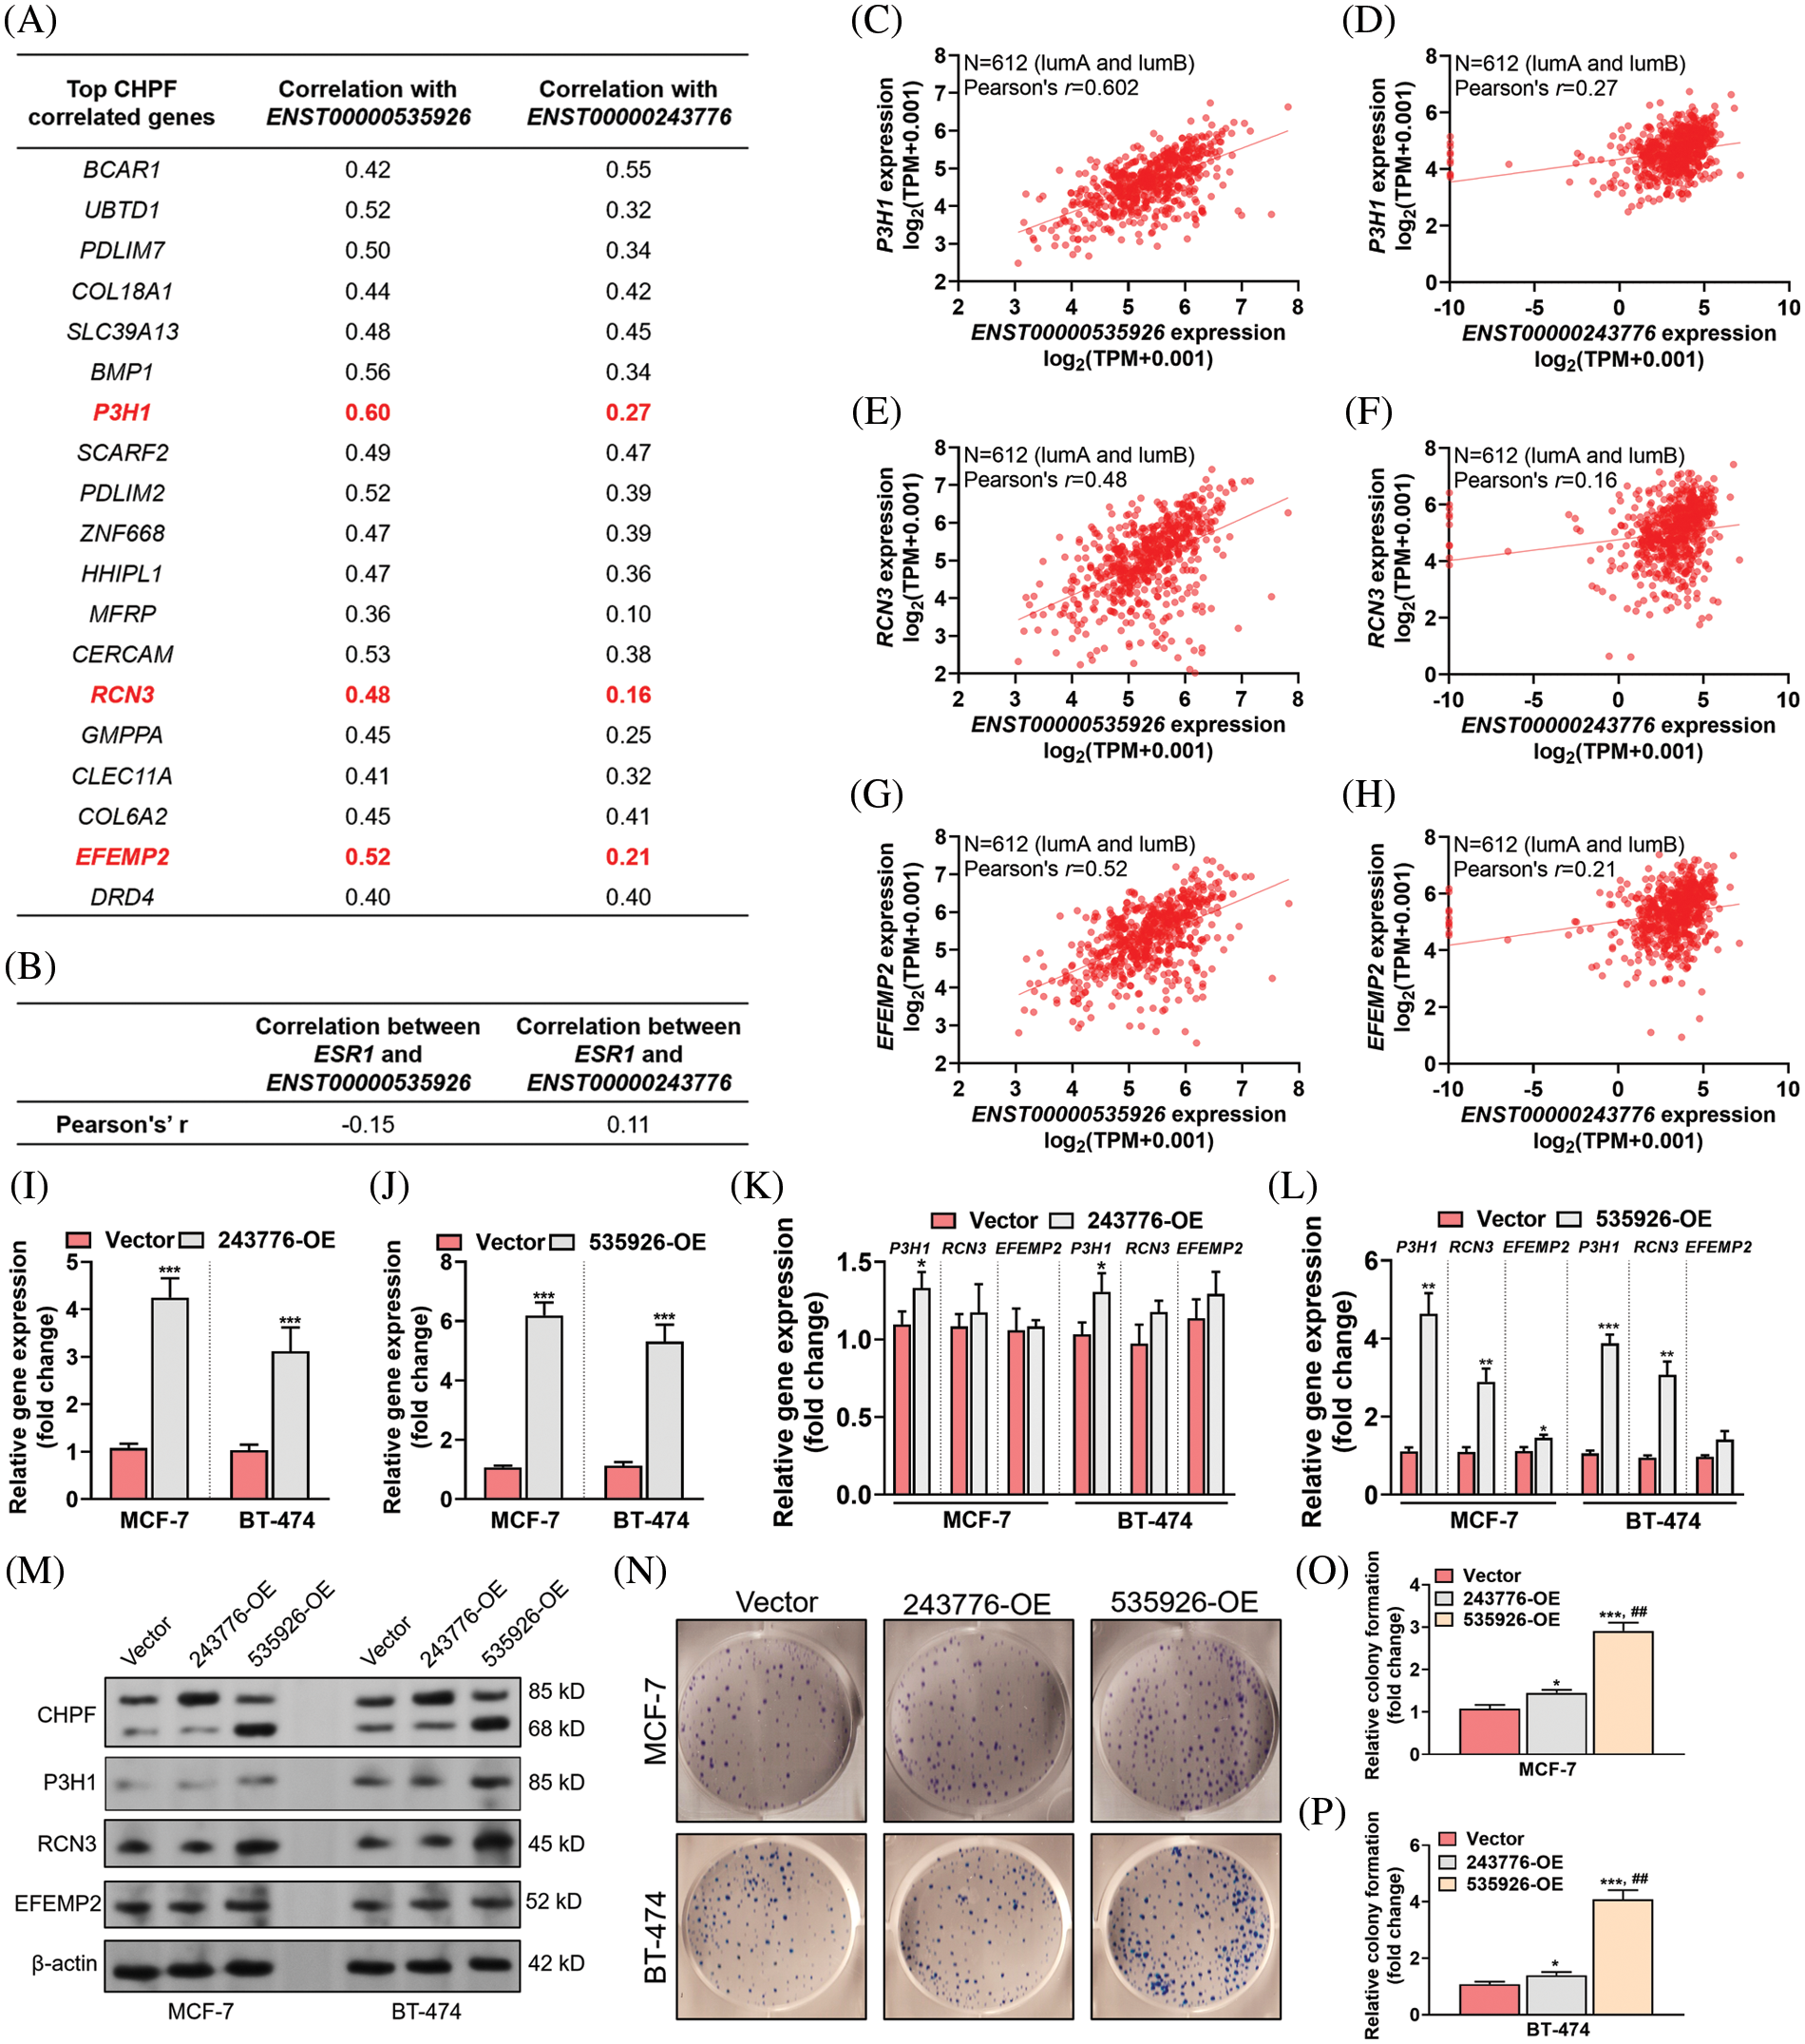
Figure 3: ENST00000535926 stimulates the expression of P3H1 and RCN3 and promotes tumor cell colony formation. (A, B) Summary tables showing the expressional correlation between the top CHPF correlated genes and the two CHPF transcripts (ENST00000535926 and ENST00000243776) (A) and between the expression of ESR1 and the two CHPF transcripts (B) in luminal A/B cases in TCGA-BRCA. (C–H) Plot charts were generated to show the expressional correlation between the gene and transcript pairs as indicated in luminal A and B cases in TCGA-BRCA. (I, J) Quantitative real-time polymerase chain reaction (qRT-PCR) assays were conducted to check the expression of CHPF mRNA 48 h after lentivirus-mediated ENST00000243776 (243776-OE) (I) or ENST00000535926 (535926-OE) (J) overexpression in MCF-7 and BT-474 cells. (K–M) qRT-PCR assays (K, L) and western blotting (M) were conducted to check the expression of P3H1, RCN3, and EFEMP2 at the mRNA (K, L) and protein (M) in MCF-7 and BT-474 cells 48 h after lentivirus-mediated ENST00000243776 (243776-OE) or ENST00000535926 (535926-OE) overexpression. (N–P) Representative images (N) and quantitation of (O, P) of colony formation of MCF-7 and BT-474 cells with lentivirus-mediated ENST00000243776 (243776-OE) or ENST00000535926 (535926-OE) overexpression. ##, comparison between 535926-OE and 243776-OE. *p < 0.05; ** and ## p < 0.01; ***p < 0.001.
Then, we overexpressed ENST00000535926 or ENST00000243776 in MCF-7 and BT-474 cells and detected the expression of these genes (Figs. 3I–3M). ENST00000243776 overexpression slightly increased the transcription of P3H1 (Fig. 3K). In comparison, ENST00000535926 overexpression increased the transcription of P3H1 and RCN3 (Fig. 3K). The results of western blotting revealed that ENST00000535926, but not ENST00000243776 overexpression, elevated the expression of P3H1 and RCN3 proteins levels (Fig. 3M). Colony formation assays confirmed that ENST00000535926 overexpression drastically enhanced colony formation of MCF-7 and BT-474 cells. These effects were much more potent than ENST00000243776 overexpression (Figs. 3N–3P).
P3H1 and RCN3 expression are negatively correlated with CD8+ T cell infiltration but positively correlated with cancer-associated fibroblast in luminal A/B tumors
Since the positive regulation of the CHPF isoform 2 on P3H1 and RCN3 expression was confirmed, we further analyzed the prognostic significance of these two genes. K-M survival analysis showed that although high P3H1 or RCN3 expression might be linked to poor PFS and DSS, the statistical analysis only confirmed a significant difference in DSS by median P3H1 separation (Figs. 4A–4H).
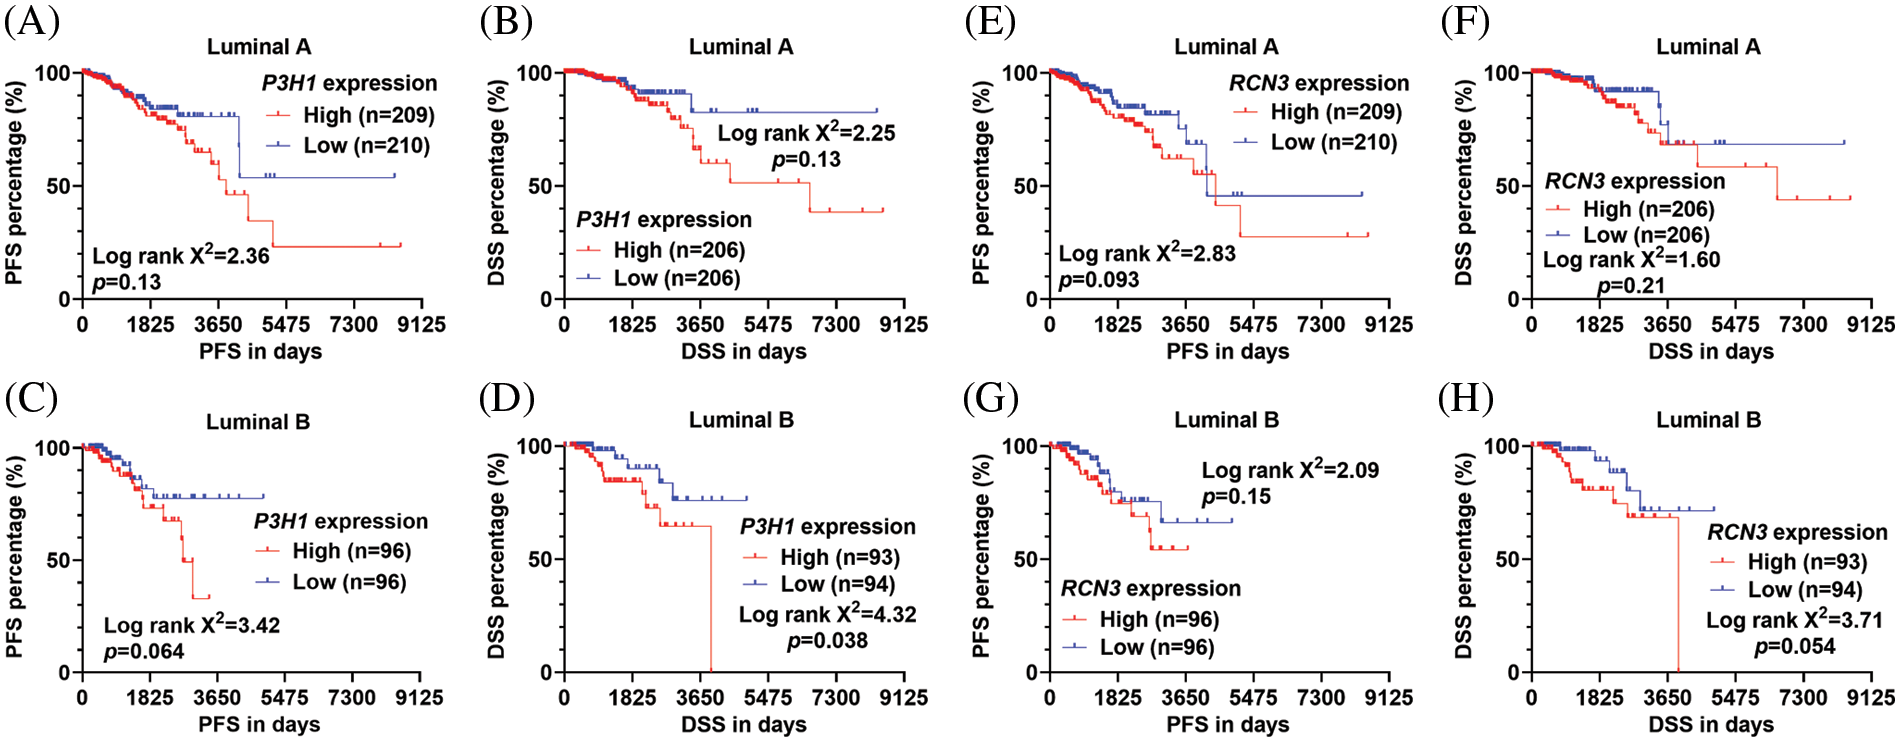
Figure 4: The survival significance of P3H1 and RCN3 expression in patients with luminal A and B tumors (A–H). (K–M) Survival curves were generated to compare the difference in PFS (A, C, E, and G) and DSS (B, D, F, and H) in the luminal A (A, B, E, and F) and luminal B (C, D, G, and H) subtypes of breast cancer in TCGA. Patients were separated by median P3H1 expression (A–D) or RCN3 expression (E–H). Log-rank test was conducted to assess the statistical difference between survival curves.
Considering that CHPF might regulate TME via its downstream effectors, we further assessed the correlation between P3H1 or RCN3 expression and tumor-infiltrating immune cells (CD8+ T cells, Tregs, myeloid-derived suppressor cells (MDSC), and cancer-associated fibroblasts) in luminal A and luminal B tumors, respectively. P3H1 showed a strong negative correlation with CD8+ T cell infiltration in luminal A tumors (Pearson’s r = −0.607) (Fig. 5A) and a moderate negative correlation (Pearson’s r = −0.549) in luminal B tumors (Fig. 5B). RCN3 showed a strong negative correlation with CD8+ T cell infiltration in both luminal A and B tumors (Pearson’s r = −0.653 and −0.67, respectively) (Figs. 5C and 5D).
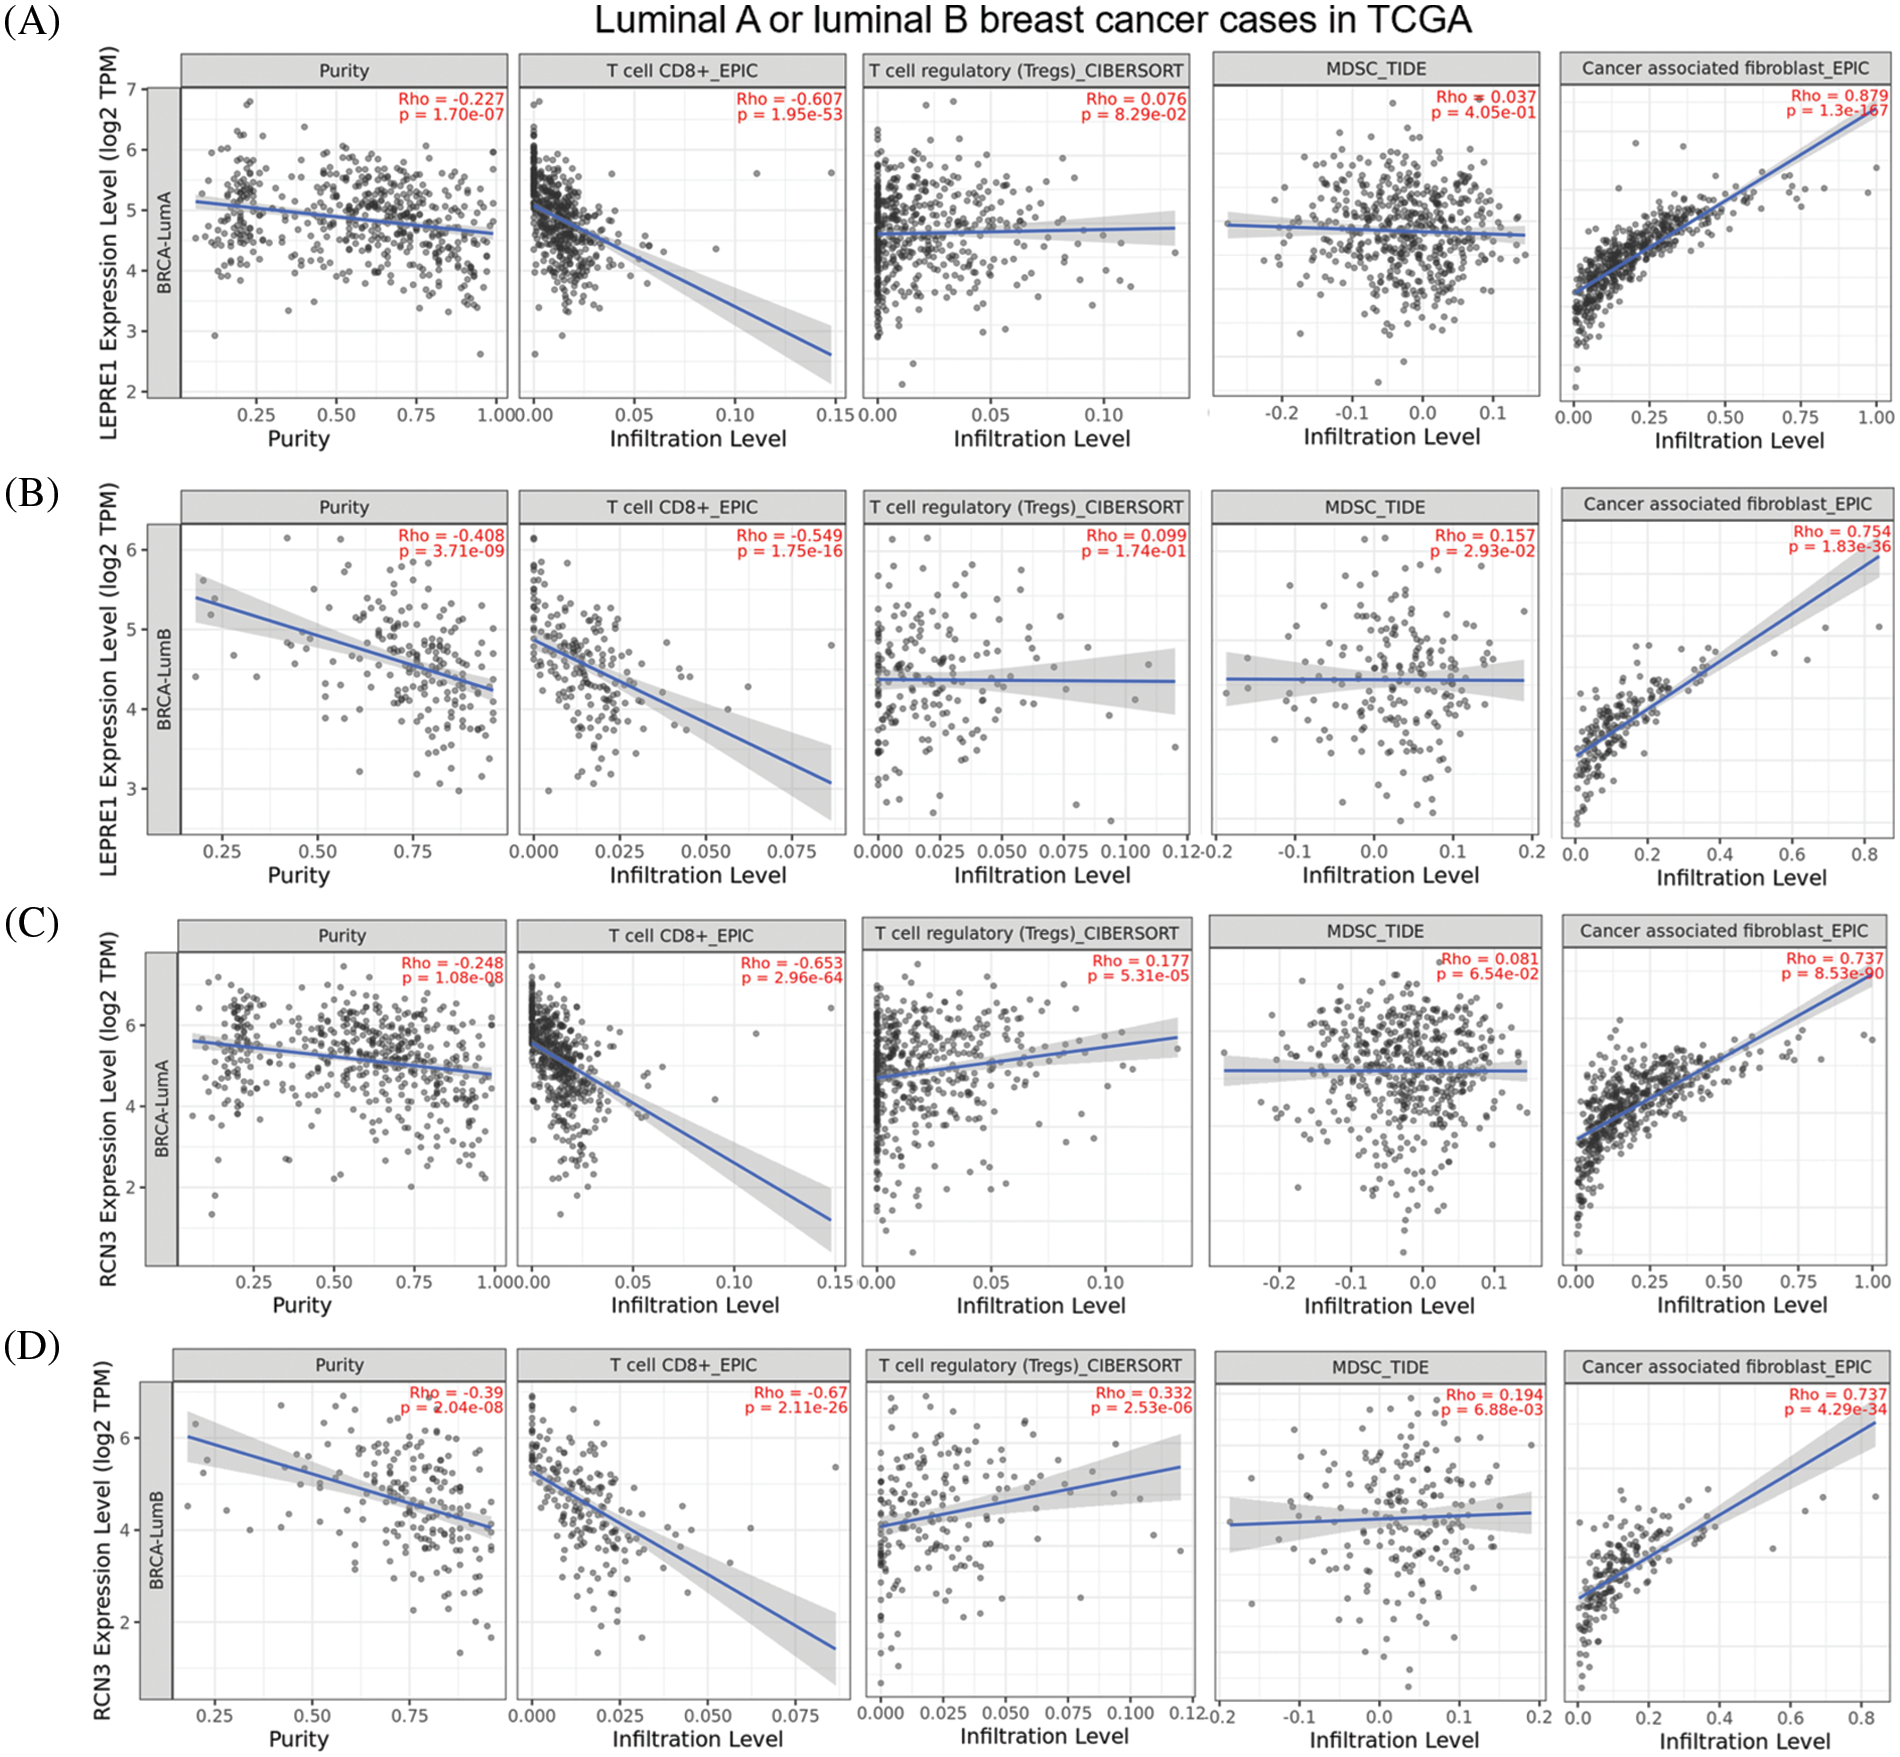
Figure 5: P3H1 and RCN3 are negatively correlated with CD8+ T cell infiltration but were positively correlated with cancer-associated fibroblast in luminal A/B tumors (A–D). Plots charts were generated to show the correlation between P3H1/LEPRE1 (A, B) or RCN3 (C, D) expression and the infiltration of immune cells (CD8+ T cells, Tregs, MDSC, and cancer-associated fibroblasts) in luminal A (A and C) and luminal B (B and D) cases in TCGA. Data was obtained from TIMER2.0 (http://timer.cistrome.org/).
RNA splicing is a process of RNA transformation in which the pre-mRNAs become mature mRNAs by excising introns and ligating exons (Yang et al., 2019). One direct consequence of RNA splicing is functional protein diversity (Birzele et al., 2008). Growing evidence demonstrates that alternative splicing is a molecular marker of human cancer and might provide new therapeutic targets (Zhang et al., 2021). Previous studies have characterized some important aberrant alternative splicing events in breast cancer (Hatami et al., 2013; Wang et al., 2016; Yang et al., 2019). Breast cancer type 1 (BRCA1) is a tumor suppressor gene in breast cancer. However, BRCA1-Δ11q (partial skipping of exon 11) can promote partial PARP inhibitor (PARPi) and cisplatin resistance (Wang et al., 2016). Compared to the full-length HER2, Δ16HER2 lacks exon 20 and encodes a small extracellular region. It can augment the critical oncogenic signals to promote HER2-driven tumorigenesis, cancer stemness, and drug resistance (Wang et al., 2016). Multiple protein isoforms of Kruppel-like factor 6 (KLF6) derived from alternative splicing have been observed in breast cancer, including KLF6-SV1, KLF6-SV2, and KLF6-SV3. The full-length KLF6 and KLF6-SV3 can be transferred to the nucleus using the nuclear localization signal (NLS). However, KLF6-SV1 and KLF6-SV2 localize to the cytoplasm due to the lack of NLS. KLF6-SV1 has been validated as a key driver of breast cancer metastasis by promoting epithelial-to-mesenchymal-like transition (Hatami et al., 2013).
Alternative splicing of CHPF and the functional differences of the isoforms have been reported in normal human neurons (Kuroda et al., 2012). The link between total CHPF expression and unfavorable survival of breast cancer patients was also observed (Li et al., 2022; Liao et al., 2021). However, it is not confirmed whether the link is transcript specific. In this study, using RNA-seq data from both TCGA-BRCA and GTEx, we compared the expression of the two CHPF transcripts and observed compositional alteration. ENST00000535926 expression was significantly upregulated in the tumor samples and became the dominant transcript. ENST00000535926, but not ENST00000243776 upregulation, was associated with significantly worse PFS and DSS in both luminal A and luminal B cases. However, no significant association was observed in PFS or DSS in other PAM50 subgroups. In addition, we validated that ENST00000535926 overexpression had a significantly stronger effect on promoting tumor cell colony formation of MCF-7 and BT-474 cells. These findings suggest that the prognostic significance of CHPF and its tumor-promoting effects might be transcript-specific in certain PAM50 subgroups.
Our correlation analysis revealed a significant difference in genes correlated with ENST00000535926 or ENST00000243776 expression. Molecular studies further confirmed that CHPF isoform 2 (encoded by ENST00000535926) can significantly elevate the expression of P3H1 and RCN3 at mRNA and protein levels in MCF-7 and BT-474 cells. P3H1 encodes Prolyl 3-Hydroxylase 1, a member of the collagen prolyl hydroxylase family. Its upregulation is associated with a poor prognosis of osteosarcoma (Huang et al., 2020). Its knockdown can reduce tumor cell proliferation, migration, and invasion (Huang et al., 2020). RCN3 encodes reticulocalbin 3, which acts as a molecular chaperone during protein biosynthesis and transport in the endoplasmic reticulum (Martinez-Martinez et al., 2017).
By performing immune-cell infiltration analysis, we confirmed that P3H1 and RCN3 expression are negatively correlated with CD8+ T cell infiltration but positively correlated with cancer-associated fibroblast infiltration in luminal A/B tumors. A recent single-cell RNA-seq data revealed that RCN3 is a fibroblast-specific biomarker of unfavorable prognosis in colorectal cancer (Zhou et al., 2020). Its upregulation can elevate the expression of immune-related factors, including TGF-β1, IL-10, and IL-6 in colorectal cancer cells (Ding et al., 2022). These cytokines and chemokines can help generate an immunosuppressive tumor microenvironment (Felcher et al., 2022; Huang et al., 2017). Typically, TGF-β1 can promote the transition of resident fibroblasts to cancer-associated fibroblasts and enhance cancer metastasis (Yoon et al., 2021). IL-10 expressed by tumor-infiltrating Tregs can drive the exhaustion of intratumoral CD8+ T cells (Damo and Joshi, 2019). Therefore, we infer that the CHPF-RCN3 axis might contribute to T cell exclusion or fibroblast recruitment to the breast cancer TME.
Patients with luminal A subtype have a very good prognosis, and systemic adjuvant therapy is most likely hormone therapy alone (Pellegrino et al., 2021). For luminal B cases, tumor-infiltrating lymphocytes are associated with prognosis, suggesting that immunotherapy might bring survival benefits (Hammerl et al., 2020). Therefore, targeting CHPF isoform 2 might be explored as a potential strategy to generate a TME favorable for immunotherapy for luminal B cases.
This study also has some limitations. First, although transcript-specific overexpression was used, we could not check how transcript-specific knockdown of CHPF influences the expression of the related genes. ENST00000535926 is a part of ENST00000243776, which means any shRNA targeting ENST00000535926 will lead to the knockdown of both transcripts. Second, only two ER+ cell lines were used for in vitro studies, which might influence the robustness of the findings. In the future, we will explore the specific regulatory mechanisms of ENST00000535926 on the tumor immune microenvironment and the malignant behaviors of other ER+ tumor cell lines.
This study revealed that ENST00000535926 is an unfavorable prognosis-related and tumor-promoting transcript of the CHPF gene in luminal A and B breast cancer. It stimulates the expression of P3H1 and RCN3. The expression of these genes is negatively correlated with CD8+ T cell infiltration but is positively correlated with cancer-associated fibroblast infiltration in both luminal A and B tumors.
Availability of Data and Materials: All data generated or analyzed during this study are included in this published article (and its supplementary information files).
Author Contributions: Study design: JL and CY; experiments carry out: JL and JPH; data collection: JL and JPH; analysis of results: JL, JPH, and YL; draft manuscript preparation: JL, JPH, and YL. All authors reviewed the final version of the manuscript.
Funding Statement: This work was supported by the Science and Technology Plan Project of Sichuan Province (Provincial Academy and Provincial University Cooperation Project) (2020YFSY0025).
Conflicts of Interest: The authors declare that they have no conflicts of interest to report regarding the present study.
References
Afratis N, Gialeli C, Nikitovic D, Tsegenidis T, Karousou E, Theocharis AD, Pavao MS, Tzanakakis GN, Karamanos NK (2012). Glycosaminoglycans: Key players in cancer cell biology and treatment. FEBS Journal 279: 1177–1197. DOI 10.1111/j.1742-4658.2012.08529.x. [Google Scholar] [CrossRef]
Birzele F, Csaba G, Zimmer R (2008). Alternative splicing and protein structure evolution. Nucleic Acids Research 36: 550–558. DOI 10.1093/nar/gkm1054. [Google Scholar] [CrossRef]
Cooney CA, Jousheghany F, Yao-Borengasser A, Phanavanh B, Gomes T et al. (2011). Chondroitin sulfates play a major role in breast cancer metastasis: A role for CSPG4 and CHST11 gene expression in forming surface P-selectin ligands in aggressive breast cancer cells. Breast Cancer Research 13: R58. DOI 10.1186/bcr2895. [Google Scholar] [CrossRef]
Damo M, Joshi NS (2019). Treg cell IL-10 and IL-35 exhaust CD8+ T cells in tumors. Nature Immunology 20: 674–675. DOI 10.1038/s41590-019-0389-y. [Google Scholar] [CrossRef]
Ding J, Meng Y, Han Z, Luo X, Guo X, Li Y, Liu S, Zhuang K (2022). Pan-cancer analysis of the oncogenic and immunological role of RCN3: A potential biomarker for prognosis and immunotherapy. Frontiers in Oncology 12: 811567. DOI 10.3389/fonc.2022.811567. [Google Scholar] [CrossRef]
Felcher CM, Bogni ES, Kordon EC (2022). IL-6 cytokine family: A putative target for breast cancer prevention and treatment. International Journal of Molecular Sciences 23: 1809. DOI 10.3390/ijms23031809. [Google Scholar] [CrossRef]
Goldman MJ, Craft B, Hastie M, Repecka K, McDade F et al. (2020). Visualizing and interpreting cancer genomics data via the Xena platform. Nature Biotechnology 38: 675–678. DOI 10.1038/s41587-020-0546-8. [Google Scholar] [CrossRef]
Hammerl D, Massink MPG, Smid M, van Deurzen CHM, Meijers-Heijboer HEJ, Waisfisz Q, Debets R, Martens JWM (2020). Clonality, antigen recognition, and suppression of CD8+ T cells differentially affect prognosis of breast cancer subtypes. Clinical Cancer Research 26: 505–517. DOI 10.1158/1078-0432.CCR-19-0285. [Google Scholar] [CrossRef]
Hampton JD, Peterson EJ, Katner SJ, Turner TH, Alzubi MA et al. (2022). Exploitation of sulfated glycosaminoglycan status for precision medicine of triplatin in triple-negative breast cancer. Molecular Cancer Therapeutics 21: 271–281. DOI 10.1158/1535-7163.MCT-20-0969. [Google Scholar] [CrossRef]
Hatami R, Sieuwerts AM, Izadmehr S, Yao Z, Qiao RF et al. (2013). KLF6-SV1 drives breast cancer metastasis and is associated with poor survival. Science Translational Medicine 5: 169ra112. DOI 10.1126/scitranslmed.3004688. [Google Scholar] [CrossRef]
Hou XM, Zhang T, Da Z, Wu XA (2019). CHPF promotes lung adenocarcinoma proliferation and anti-apoptosis via the MAPK pathway. Pathology-Research and Practice 215: 988–994. DOI 10.1016/j.prp.2019.02.005. [Google Scholar] [CrossRef]
Huang SC, Wei PC, Hwang-Verslues WW, Kuo WH, Jeng YM et al. (2017). TGF-β1 secreted by Tregs in lymph nodes promotes breast cancer malignancy via up-regulation of IL-17RB. EMBO Molecular Medicine 9: 1660–1680. DOI 10.15252/emmm.201606914. [Google Scholar] [CrossRef]
Huang Z, Wang Q, Wang Y, Zhao L, Cao Z, Cui C, Yu D, Liu B (2020). Upregulated LEPRE1 correlates with poor outcome and its knockdown attenuates cells proliferation, migration and invasion in osteosarcoma. Anti-Cancer Drugs 31: 326–332. DOI 10.1097/CAD.0000000000000851. [Google Scholar] [CrossRef]
Iida J, Dorchak J, Clancy R, Slavik J, Ellsworth R et al. (2015). Role for chondroitin sulfate glycosaminoglycan in NEDD9-mediated breast cancer cell growth. Experimental Cell Research 330: 358–370. DOI 10.1016/j.yexcr.2014.11.002. [Google Scholar] [CrossRef]
Kowitsch A, Chhalotre A, Groth T (2017). Effect of thiolated glycosaminoglycans on the behavior of breast cancer cells: Toward the development of in vitro models of cancer. International Journal of Artificial Organs 40: 31–39. DOI 10.5301/ijao.5000551. [Google Scholar] [CrossRef]
Kuroda Y, Sako W, Goto S, Sawada T, Uchida D et al. (2012). Parkin interacts with Klokin1 for mitochondrial import and maintenance of membrane potential. Human Molecular Genetics 21: 991–1003. DOI 10.1093/hmg/ddr530. [Google Scholar] [CrossRef]
Li T, Fu J, Zeng Z, Cohen D, Li J, Chen Q, Li B, Liu XS (2020). TIMER2.0 for analysis of tumor-infiltrating immune cells. Nucleic Acids Research 48: W509–W514. DOI 10.1093/nar/gkaa407. [Google Scholar] [CrossRef]
Li WW, Liu B, Dong SQ, He SQ, Liu YY, Wei SY, Mou JY, Zhang JX, Liu Z (2022). Bioinformatics and experimental analysis of the prognostic and predictive value of the CHPF gene on breast cancer. Frontiers in Oncology 12: 856712. DOI 10.3389/fonc.2022.856712. [Google Scholar] [CrossRef]
Liao WC, Yen HR, Chen CH, Chu YH, Song YC, Tseng TJ, Liu CH (2021). CHPF promotes malignancy of breast cancer cells by modifying syndecan-4 and the tumor microenvironment. American Journal of Cancer Research 11: 812–826. [Google Scholar]
Lin X, Han T, Xia Q, Cui J, Zhuo M et al. (2021). CHPF promotes gastric cancer tumorigenesis through the activation of E2F1. Cell Death and Disease 12: 876. DOI 10.1038/s41419-021-04148-y. [Google Scholar] [CrossRef]
Liu J, Pang K, He F (2022). Weighted gene co-expression network analysis identifies a novel immune-related gene signature and nomogram to predict the survival and immune infiltration status of breast cancer. BIOCELL 46: 1661–1673. DOI 10.32604/biocell.2022.018023. [Google Scholar] [CrossRef]
Luo J, Zeng S, Tian C (2020). MORC4 promotes chemoresistance of luminal A/B breast cancer via STAT3-mediated MID2 upregulation. OncoTargets and Therapy 13: 6795–6803. DOI 10.2147/OTT.S260509. [Google Scholar] [CrossRef]
Martinez-Martinez E, Ibarrola J, Fernandez-Celis A, Santamaria E, Fernandez-Irigoyen J, Rossignol P, Jaisser F, Lopez-Andres N (2017). Differential proteomics identifies reticulocalbin-3 as a novel negative mediator of collagen production in human cardiac fibroblasts. Scientific Reports 7: 12192. DOI 10.1038/s41598-017-12305-7. [Google Scholar] [CrossRef]
Mikami T, Kitagawa H (2013). Biosynthesis and function of chondroitin sulfate. Biochimica et Biophysica Acta 1830: 4719–4733. DOI 10.1016/j.bbagen.2013.06.006. [Google Scholar] [CrossRef]
Monzavi-Karbassi B, Stanley JS, Hennings L, Jousheghany F, Artaud C, Shaaf S, Kieber-Emmons T (2007). Chondroitin sulfate glycosaminoglycans as major P-selectin ligands on metastatic breast cancer cell lines. International Journal of Cancer 120: 1179–1191. DOI 10.1002/(ISSN)1097-0215. [Google Scholar] [CrossRef]
Nielsen T, Wallden B, Schaper C, Ferree S, Liu S, Gao D, Barry G, Dowidar N, Maysuria M, Storhoff J (2014). Analytical validation of the PAM50-based prosigna breast cancer prognostic gene signature assay and ncounter analysis system using formalin-fixed paraffin-embedded breast tumor specimens. BMC Cancer 14: 177. DOI 10.1186/1471-2407-14-177. [Google Scholar] [CrossRef]
Pellegrino B, Hlavata Z, Migali C, de Silva P, Aiello M, Willard-Gallo K, Musolino A, Solinas C (2021). Luminal breast cancer: Risk of recurrence and tumor-associated immune suppression. Molecular Diagnosis and Therapy 25: 409–424. DOI 10.1007/s40291-021-00525-7. [Google Scholar] [CrossRef]
Sang J, Wang Z, Li M, Cao J, Niu G et al. (2018). ICG: A wiki-driven knowledgebase of internal control genes for RT-qPCR normalization. Nucleic Acids Research 46: D121–D126. DOI 10.1093/nar/gkx875. [Google Scholar] [CrossRef]
Tian C, Zeng J, Luo J (2020). MCTS1 directly binds to TWF1 and synergistically modulate cyclin D1 and C-Myc translation in luminal A/B breast cancer cells. OncoTargets and Therapy 13: 5353–5361. DOI 10.2147/OTT.S255675. [Google Scholar] [CrossRef]
Wang L, Luo Z, Sun M, Yuan Q, Zou Y, Fu D (2022). Identification of a three-gene signature in the triple-negative breast cancer. BIOCELL 46: 595–606. DOI 10.32604/biocell.2022.017337. [Google Scholar] [CrossRef]
Wang Y, Bernhardy AJ, Cruz C, Krais JJ, Nacson J et al. (2016). The BRCA1-Δ11q alternative splice isoform bypasses germline mutations and promotes therapeutic resistance to PARP inhibition and cisplatin. Cancer Research 76: 2778–2790. DOI 10.1158/0008-5472.CAN-16-0186. [Google Scholar] [CrossRef]
Wei J, Hu M, Huang K, Lin S, Du H (2020). Roles of proteoglycans and glycosaminoglycans in cancer development and progression. International Journal of Molecular Sciences 21: 5983. DOI 10.3390/ijms21175983. [Google Scholar] [CrossRef]
Yang Q, Zhao J, Zhang W, Chen D, Wang Y (2019). Aberrant alternative splicing in breast cancer. Journal of Molecular Cell Biology 11: 920–929. DOI 10.1093/jmcb/mjz033. [Google Scholar] [CrossRef]
Yoon H, Tang CM, Banerjee S, Delgado AL, Yebra M, Davis J, Sicklick JK (2021). TGF-beta1-mediated transition of resident fibroblasts to cancer-associated fibroblasts promotes cancer metastasis in gastrointestinal stromal tumor. Oncogenesis 10: 13. DOI 10.1038/s41389-021-00302-5. [Google Scholar] [CrossRef]
Zhang Y, Qian J, Gu C, Yang Y (2021). Alternative splicing and cancer: A systematic review. Signal Transduction and Targeted Therapy 6: 78. DOI 10.1038/s41392-021-00486-7. [Google Scholar] [CrossRef]
Zhou Y, Bian S, Zhou X, Cui Y, Wang W, Wen L, Guo L, Fu W, Tang F (2020). Single-cell multiomics sequencing reveals prevalent genomic alterations in tumor stromal cells of human colorectal cancer. Cancer Cell 38: 818–828 e815. DOI 10.1016/j.ccell.2020.09.015. [Google Scholar] [CrossRef]
Supplementary File
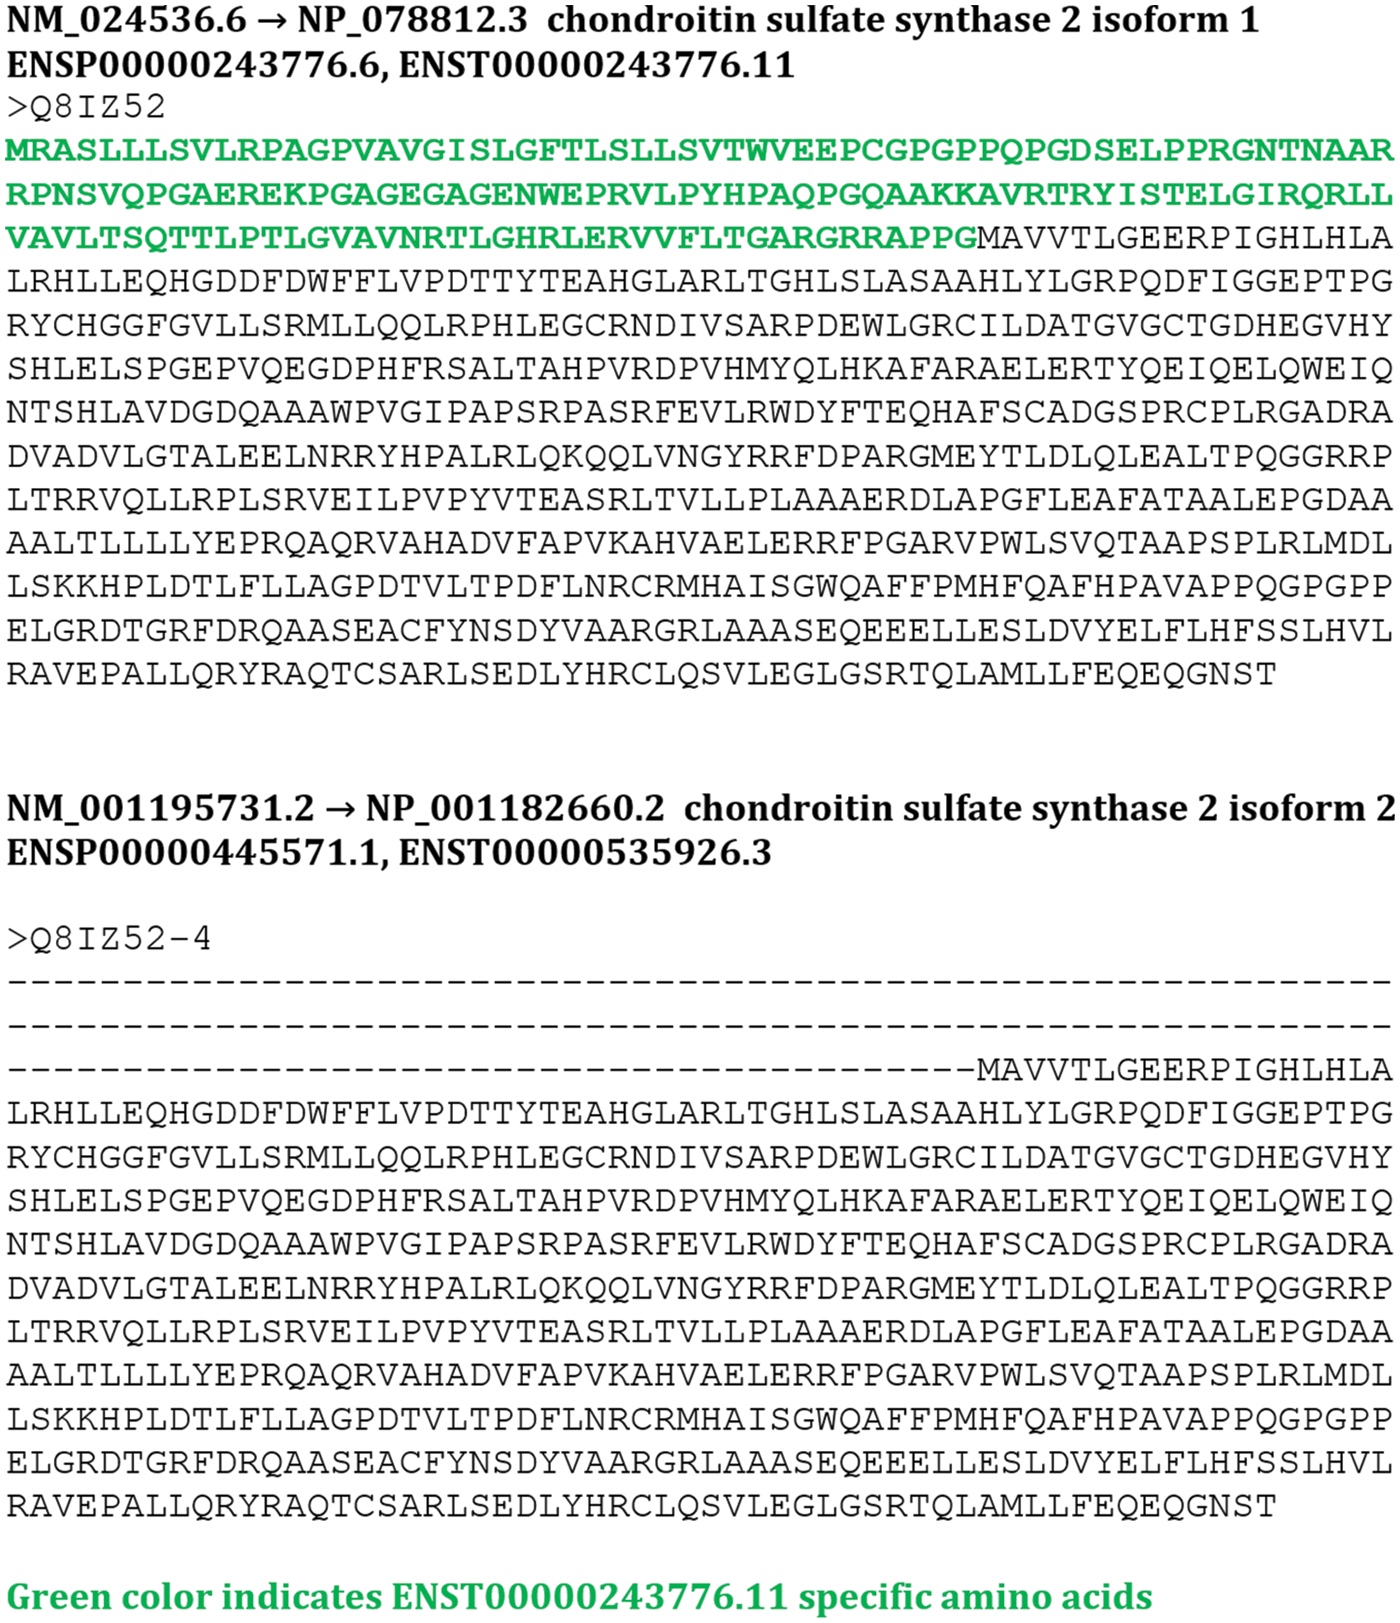
FIGURE S1: The protein sequences of Chondroitin sulfate synthase 2 (CHPF) isoforms.
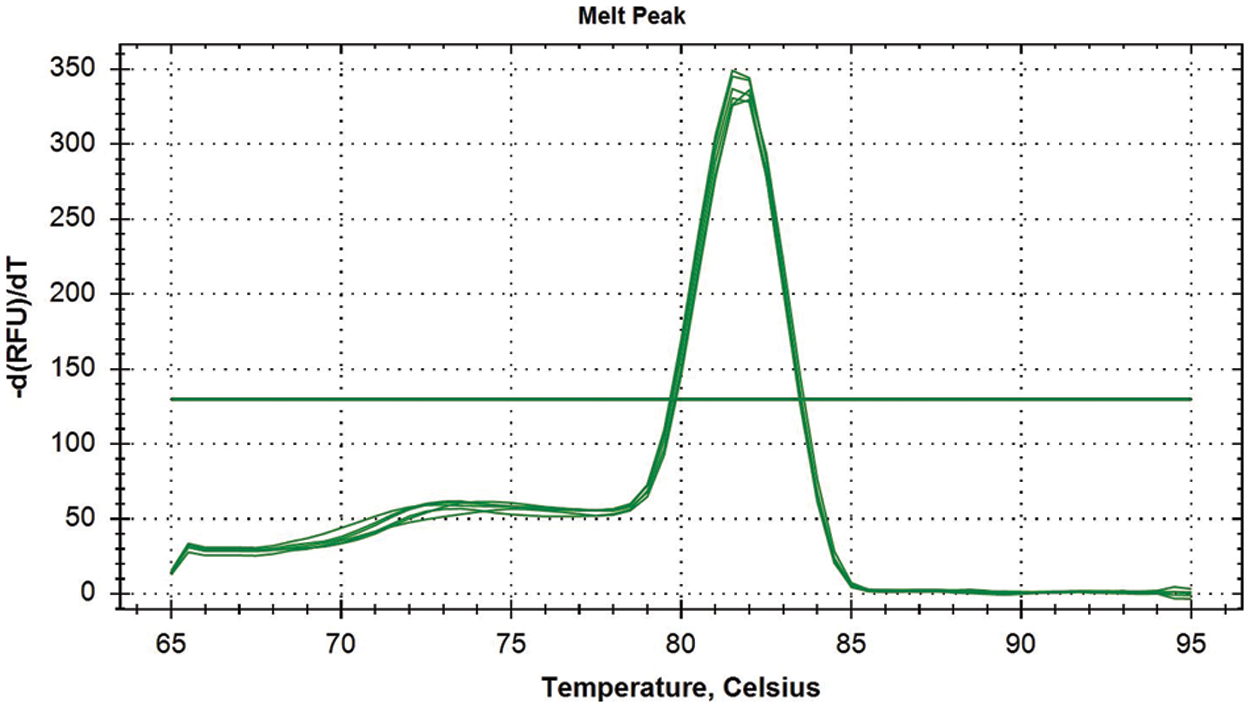
FIGURE S2: The representative melting curves for quantitative real-time polymerase chain reaction analysis of CHPF expression.
Cite This Article
 Copyright © 2023 The Author(s). Published by Tech Science Press.
This work is licensed under a Creative Commons Attribution 4.0 International License , which permits unrestricted use, distribution, and reproduction in any medium, provided the original work is properly cited.
 Downloads
 Citation Tools