
 Submit a Paper
 Propose a Special lssue
 Open Access
ARTICLE

The correlation of miRNA expression and tumor mutational burden in uterine corpus endometrial carcinoma
1 Department of Gynaecology, Affiliated Dongguan People’s Hospital, Southern Medical University, Dongguan, 523009, China
2 Department of Radiation Oncology, Affiliated Dongguan People’s Hospital, Southern Medical University, Dongguan, 523009, China
3 Department of Oncology, Affiliated Dongguan People’s Hospital, Southern Medical University, Dongguan, 523009, China
4 School of Sports Education, Jinan University, Guangzhou, 510632, China
5 Syndrome Laboratory of Integrated Chinese and Western Medicine, School of Traditional Chinese Medicine, Southern Medical University, Guangzhou, 510515, China
* Corresponding Authors: YANTING YOU. Email: ; YIFEN WU. Email:
# These authors contributed equally to this manuscript
BIOCELL 2023, 47(6), 1353-1364. https://doi.org/10.32604/biocell.2023.027346
Received 25 October 2022; Accepted 06 February 2023; Issue published 19 May 2023
 View Full Text
 Download PDF
Abstract
Background: The relationship between microRNA (miRNA) expression patterns and tumor mutation burden (TMB) in uterine corpus endometrial carcinoma (UCEC) was investigated in this study. Methods: The UCEC dataset from The Cancer Genome Atlas (TCGA) database was used to identify the miRNAs that differ in expression between high TMB and low TMB sample sets. The total sample sets were divided into a training set and a test set. TMB levels were predicted using miRNA-based signature classifiers developed by Lasso Cox regression. Test sets were used to validate the classifier. This study investigated the relationship between a miRNA-based signature classifier and three immune checkpoint molecules (programmed cell death protein 1 [PD-1], programmed cell death ligand 1 [PD-L1], cytotoxic T lymphocyte-associated antigen 4 [CTLA-4]). For the miRNA-based signature classifier, functional enrichment analysis was performed on the miRNAs. An analysis of the relationship between PD-1, PD-L1, and CTLA-4 immune checkpoint genes was carried out using the miRNA-based signature classifier. Results: We identified 27 differentially expressed miRNAs in miRNA-base signature. For predicting the TMB level, 27-miRNA-based signature classifiers had accuracies of 0.8689 in the training cohort, 0.8276 in the test cohort, and 0.8524 in the total cohort. The correlation between the miRNA-based signature classifier and PD-1 was negative, while the correlation between PD-L1 and CTLA4 was positive. Based on the miRNA profiling described above, we validated the expression levels of 9 miRNAs in clinical samples by quantitative reverse transcription PCR (qRT-PCR). Four of them were highly expressed and many cancer-related and immune-associated biological processes were linked to these 27 miRNAs. Thus, the developed miRNA-based signature classifier was correlated with TMB levels that could also predict TMB levels in UCEC samples. Conclusion: In this study, we investigated the relationship between a miRNA-based signature classifier and TMB levels in Uterine Corpus Endometrial Carcinoma. Further, this is the first study to confirm their relationship in clinical samples, which may provide more evidence support for immunotherapy of endometrial cancer.Keywords
Abbreviation
| miRNA | microRNA |
| TMB | Tumor mutation burden |
| UCEC | Uterine corpus endometrial carcinoma |
| TCGA | The Cancer Genome Atlas |
| PD-P1 | Programmed cell death protein 1 |
| PD-L1 | Programmed cell death ligand 1 |
| CTLA-4 | Cytotoxic T lymphocyte-associated antigen 4 |
| qRT-PCR | Quantitative reverse transcription PCR |
| OS | Overall survival |
| MMR | DNA mismatch repair |
| EC | Endometrial carcinoma |
| ICIs | Immune checkpoint inhibitors |
| SE | Sensitivity |
| SP | Specificity |
| PPV | Positive predictive value |
| NPV | Negative predictive value |
| ROC | Receiver operating characteristic |
| PCA | Principal Component Analysis |
| KEGG | Kyoto Encyclopedia of Genes and Genomes |
| GO | Gene Ontology |
| AUC | Area Under the Curve |
| NSCLC | Non-small cell lung cancer |
| ORR | Overall Response Rate |
Uterine Corpus Endometrial Carcinoma (UCEC) is the second most common tumor in women (65950 new cases in 2022) that threatens the health of women worldwide (Siegel et al., 2022). It is estimated that by 2030, there would be 42.13 cases of UCEC per 10,000 individuals in the United States (Sheikh et al., 2014). Treatment approaches for UCEC include surgery, radiotherapy, and chemotherapy-targeted therapies. However, the incidence and mortality are still increasing (Lortet-Tieulent et al., 2018; Crosbie et al., 2022). The most frequent age of occurrence is between 45 to 65 years (Rutgers, 2015). When the patient already has a metastatic lesion or the disease recurs, the efficacy of traditional treatments is limited. For these patients, the prognosis is usually poor (Crosbie et al., 2022), with overall survival (OS) time of fewer than 16 weeks (Chaudhry and Asselin, 2009). For UCEC patients with metastasis or recurrence, it is imperative to develop new treatments such as immunotherapy. In 2013, Science magazine listed tumor immunotherapy as an important scientific breakthrough, suggesting that immunotherapy would play a milestone role in cancer treatment (Couzin-Frankel, 2013). Immune checkpoint inhibitors (anti-PD-l, anti-PD-L1, and anti-CTLA4) have been used to treat a variety of solid tumors, and the effect is significant (Horn et al., 2017). For example, pembrolizumab treatment of DNA mismatch repair (MMR) gene-deficient recurrent endometrial carcinoma (EC) resulted in a total response rate of 55% and a disease control rate of 89% (Konstantinopoulos et al., 2019). Further, two patients with multiple relapses and refractory EC were treated with PD-1 inhibitor Nivolumab, and the treatment response was good (Santin et al., 2016). However, the Clinical trial KEY-Note 028, which included 24 patients with PD-L1 expression scores greater than 1 and MSI-H type EC, reported that the total effective rate was only 12.5% after Pembrolizumab treatment (Ott et al., 2017). These results suggest that while immunotherapy can benefit some UCEC patients, further research remains to be done on how to screen individuals who can benefit apart from detecting the PD-L1 expression by immunohistochemistry.
Bioinformatics is an advanced discipline and approach that takes advantage of developed computer science tools to collect, analyze and store life science resources and data. Integrated bioinformatics analyses allow us to utilize the data derived from patient tissues and high-throughput statistical analysis methods to screen for potential therapy targets (such as TMB-related genes) for cancer treatment.
TMB is a promising and effective predictor when using immune checkpoint inhibitors (ICIs), though its use is still controversial and needs to be confirmed in clinical trials (Carbone et al., 2017; Hellmann et al., 2018b). Tumor mutation burden represents the tumor cell-carrying mutation and is a predictive biomarker that is studied to evaluate tumor mutation and immunotherapy response (Alexandrov et al., 2013; Yuan et al., 2016). Whole exome sequencing has been used to assess tumor mutations (Chalmers et al., 2017) and some cancer gene sequencing panels could predict TMB efficiently (Campesato et al., 2015; Garofalo et al., 2016; Goodman et al., 2017). Traditional TMB assessment needs large amounts of tumor DNA which sometimes is difficult to get (Heeke and Hofman, 2018). Mutated genes encoding the protein can develop high TMB and the immune system can recognize these modified proteins to activate anti-tumor responses (Schumacher and Schreiber, 2015; Anagnostou et al., 2017).
MicroRNAs (miRNAs) are small endogenous noncoding RNA molecules, which participate in post-transcriptional regulation and play a vital role in the translation of mutated genes into altered proteins. Differently expressed miRNAs are often found in many cancers and can regulate various cancer features (Hanahan, 2022; Neagoe et al., 2014; Calin and Croce, 2006). Recently, there has been growing concern about the role of miRNAs in anti-tumor immune responses, and numerous studies have shown that miRNAs can predict the prognosis of different types of cancers (Hayes et al., 2014; Dragomir et al., 2018). Many researchers have assessed miRNAs and their involvement in the mediation and control of multiple immune and cancer cell interactions (Mehta and Baltimore, 2016). For example, it was found that the effectiveness of immunotherapy is related to the dynamic change of miRNAs in advanced non-small cell lung cancer (Peng et al., 2020).
In this study, we explored miRNA expression profiles and mutation annotation files data from TCGA and screened the miRNA expression pattern that can predict the TMB levels in UCEC. We investigated the relationship between a miRNA-based signature classifier and TMB levels in Uterine Corpus Endometrial Carcinoma. Further, this is the first study confirmed their relationship in clinical samples, which may provide more evidence support for immunotherapy of endometrial cancer.
The flowchart of this study was described in Fig. 1.
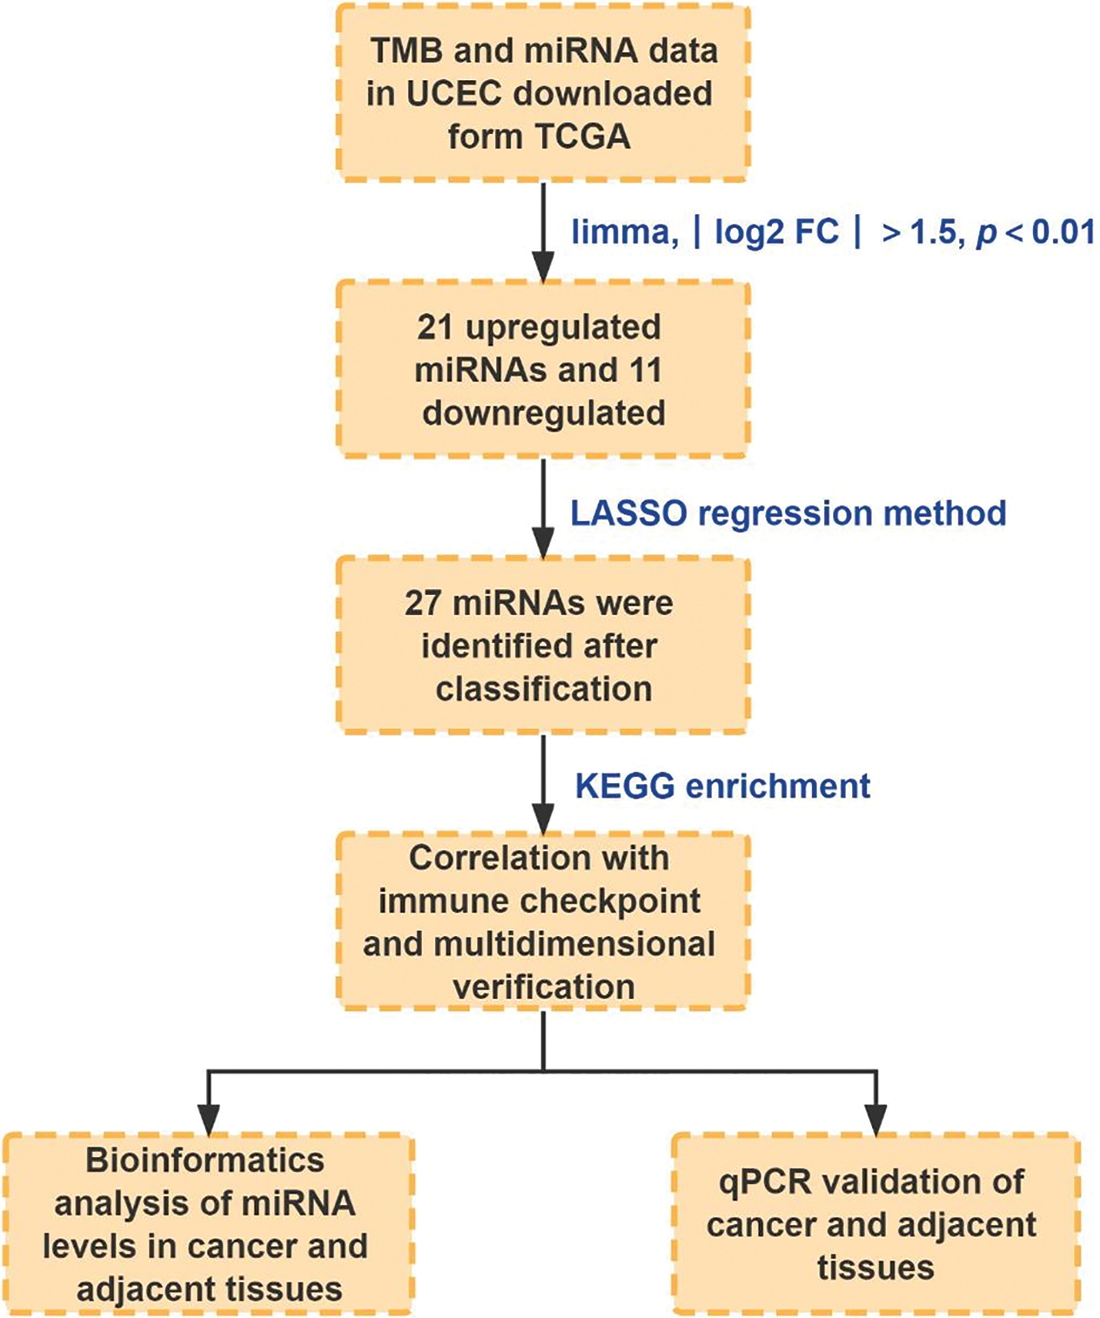
Figure 1: The flowchart of this study.
The mutation annotation files were downloaded from TCGA (https://portal.gdc.cancer.gov/) using the GDC-client.exe tool. TMB was defined as the total number of somatic gene coding errors, base substitution, gene insertion, or missing errors detected per million bases. ≥10 mutations per megabase were defined as a high TMB level, and <10 mutations per megabase were recognized as low TMB levels (Cibulskis et al., 2013; Ready et al., 2019). The mature miRNA expression profiles were also downloaded from TCGA. The Mature. fa data were downloaded from http://www.mirbase.org/. A total of 508 patients constituted the dataset in this study. All patients were randomly divided into the training set (60%) and the test set (40%).
Identifying differentially expressed miRNAs
The “limma package” in R software was used to screen the differentially expressed miRNAs between the high TMB group and the low TMB group (Ritchie et al., 2015). p-values (adjusted by false discovery rate) <0.01 and >log21.5 were considered significant. The differentially expressed miRNAs were shown by a heat map.
miRNA-based signature classifier construction and principal component analysis
The least absolute shrinkage and selection operator (LASSO) method was employed here (Wu et al., 2009). In R software, we used the “glmnet” package (Friedman et al., 2010) to analyze LASSO logistic regression models and select the optimal miRNA-based signature classifier based on regression coefficients. A classifier index was created with the following formula: index = ExpmiRNA1 * Coef1 + ExpmiRNA2 * Coef2 + …… + ExpmiRNAn * Coefn (Friedman et al., 2010). In this case, ‘Coef’ represents the correlation coefficient of miRNA determined by LASSO Cox regression, whereas ‘Exp’ indicates miRNA expression. The robustness of the miRNAs-based signature classifier was validated by the test set. The accuracy, sensitivity (SE), specificity (SP), positive predictive value (PPV), negative predictive value (NPV), and receiver operating characteristic (ROC) curves were used to access the efficiency. The “pROC” package (Robin et al., 2011) in R software was used to draw the ROC curves. Principal Component Analysis (PCA) was performed for all and optimal differently expressed miRNAs. Two-dimensional plots were plotted for all samples.
Three immune checkpoint molecule expression and the miRNA-based signature classifier
It has been reported that TMB is an independent predictor for immunotherapy response (Hellmann et al., 2018a). The correlation between miRNA-based signature classifier and the expression of three immune checkpoint molecules (SNCA (PD1), CD274 (PDL1), CD152 (CTLA4)) was explored. The tool DIANA-miRPath (Vlachos et al., 2015) (http://www.microrna.gr/miRPathv3) was used to analyze Kyoto Encyclopedia of Genes and Genomes (KEGG) pathways and gene ontology enrichment for classifier miRNAs. Significantly enriched KEGG pathways and Gene Ontology (GO) terms were defined as p-values < 0.01.
Validating the expression of 27 miRNAs between normal and tumor tissues by quantitative reverse transcription PCR
To validate the prognostic efficacy of the 27 miRNAs, we performed differential expression analysis between paired and unpaired samples in the TCGA database. We drew the Area Under the Curve (AUC) curves for each miRNA. The larger the AUC area for an miRNA, the higher was the miRNA prediction performance. Then we verified these miRNAs in our patient sample set by using real-time PCR. The adjacent and tumor tissues were collected from patients who proceeded to surgery without any previous treatment from June 2021 to April 2022. All patients signed informed consent. All qPCR primers were purchased from Guangzhou Ribobio Biotechnology Co., Ltd. (Guangzhou, China).
The Chi-square test was performed in R software for categorical data and Student’s t-test was performed by the limma package for differentially expressed miRNAs in the high TMB group and low TMB group. Differential expression of miRNA levels was analyzed using Student’s t-tests. Statistical significance was defined as p < 0.05.
Identification of differentially expressed miRNAs
No obvious difference in clinical characteristics was found between the training set and the test set (Table 1). In the training set, 109 patients with high TMB and 196 patients with low TMB were included. As shown in Fig. 2, 32 differentially expressed miRNAs were found between the high TMB and low TMB groups, including 21 upregulated miRNAs and 11 downregulated ones in the high TMB group.
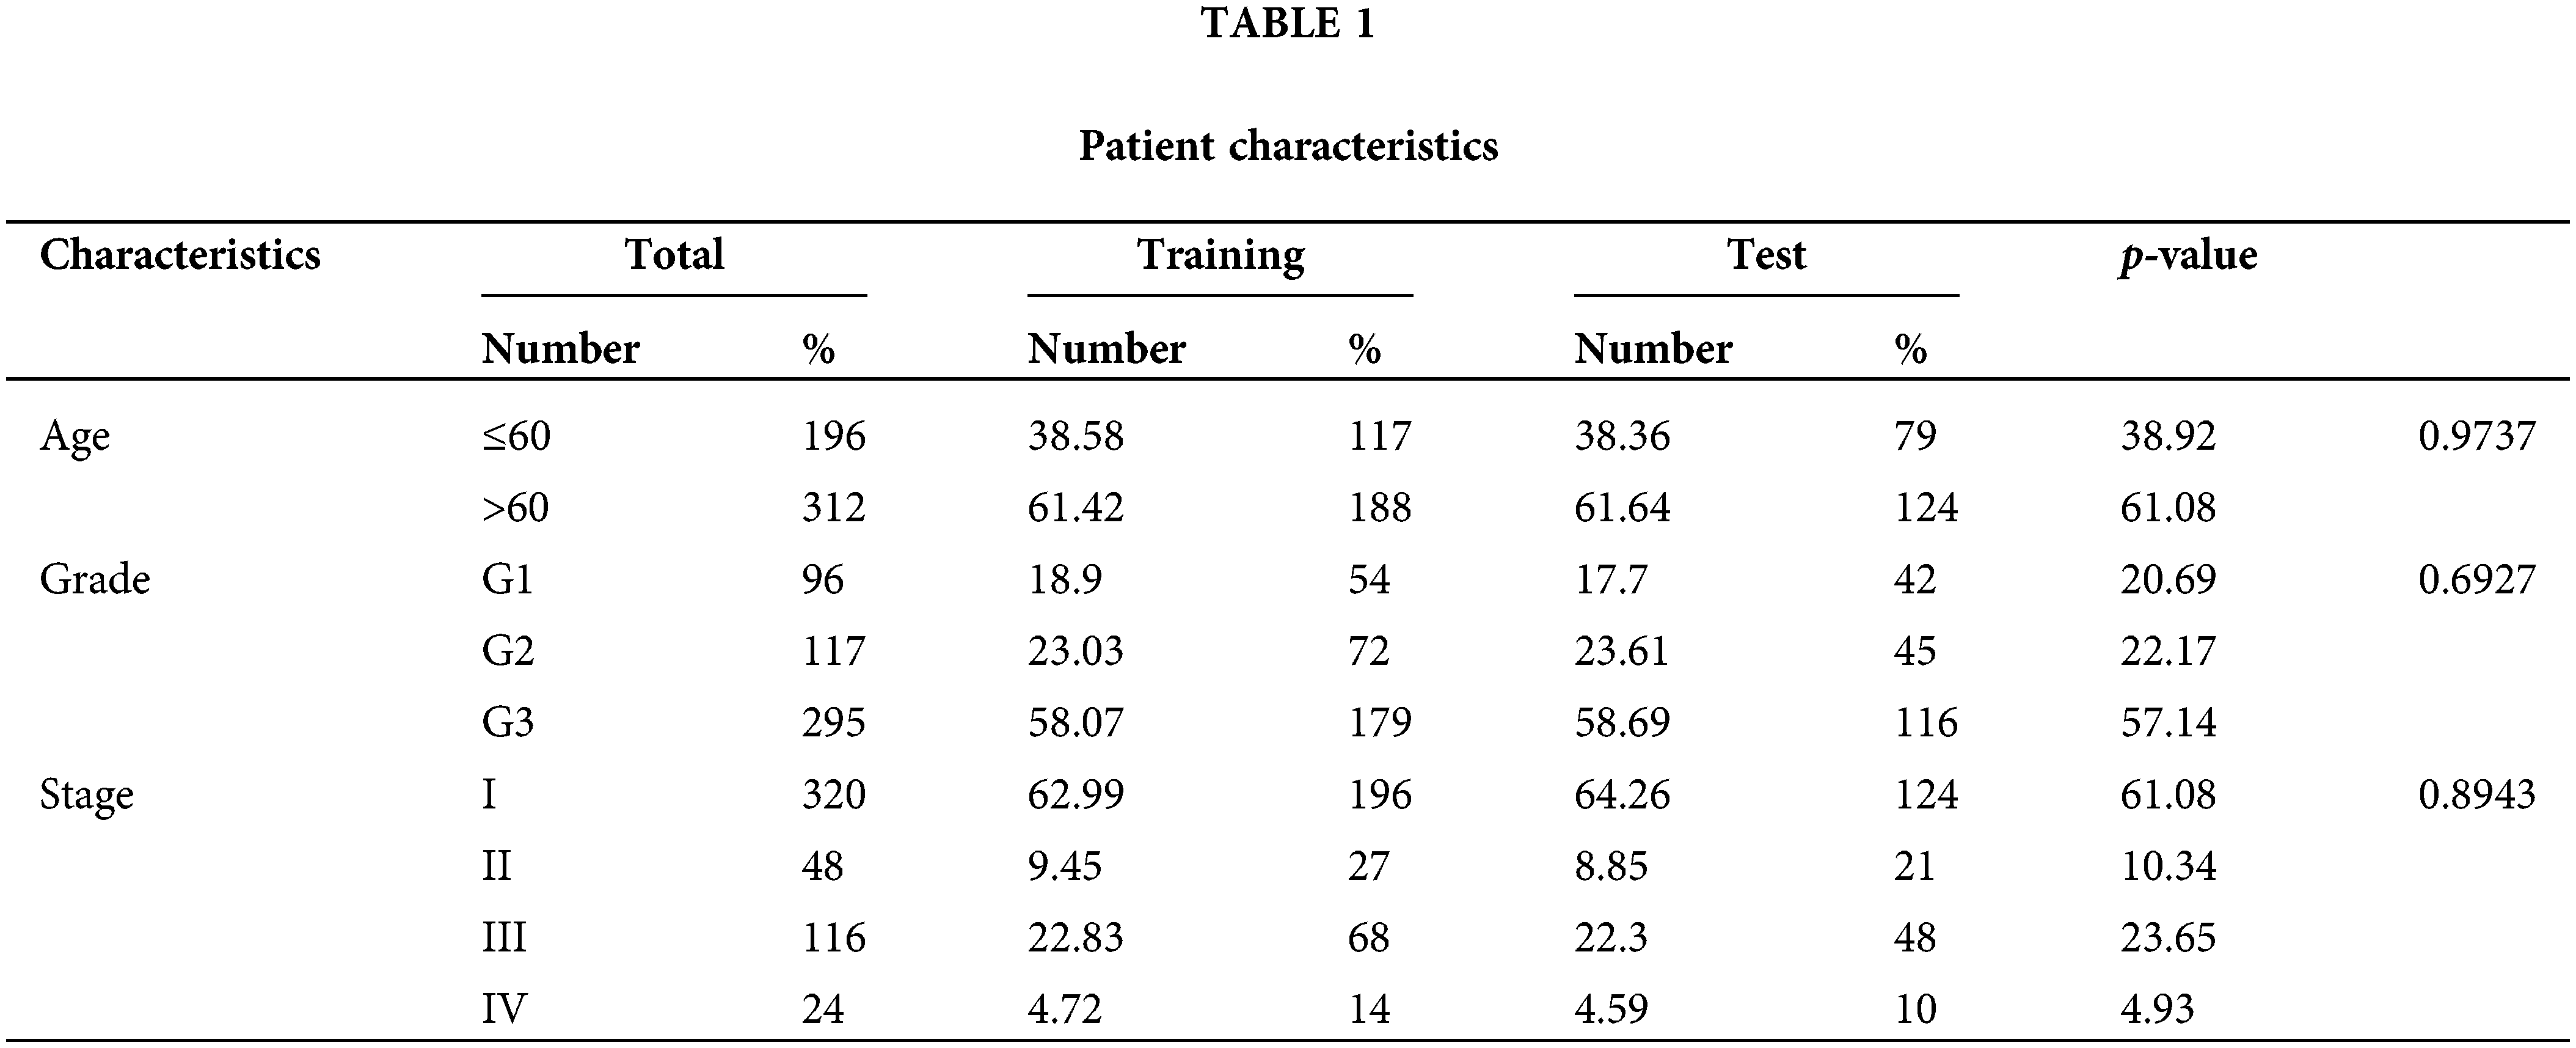
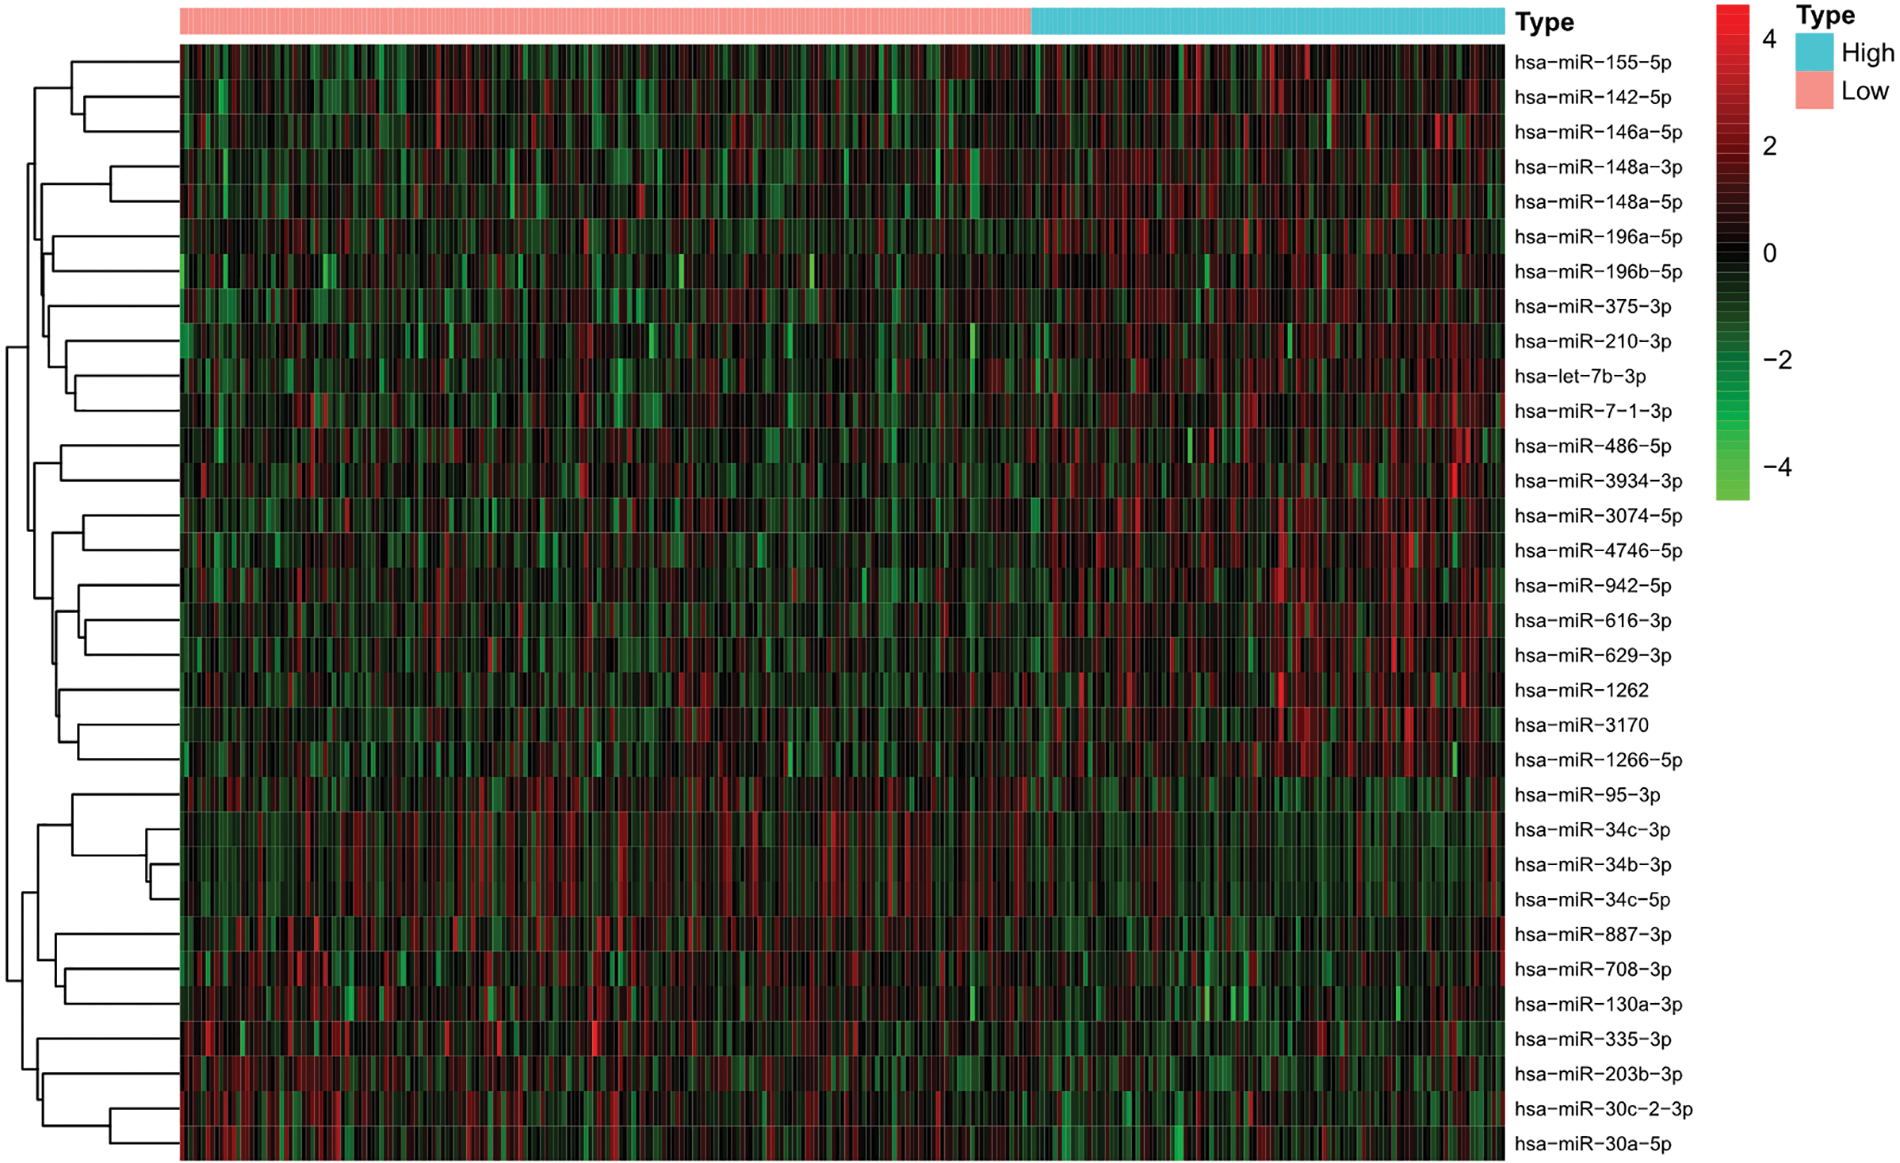
Figure 2: Differentially expressed miRNAs between the high tumor mutation burden (TMB) and low TMB in uterine corpus endometrial carcinoma (UCEC).
The least absolute shrinkage and selection operator and principal component analysis approaches to select the miRNA-based signature classifier
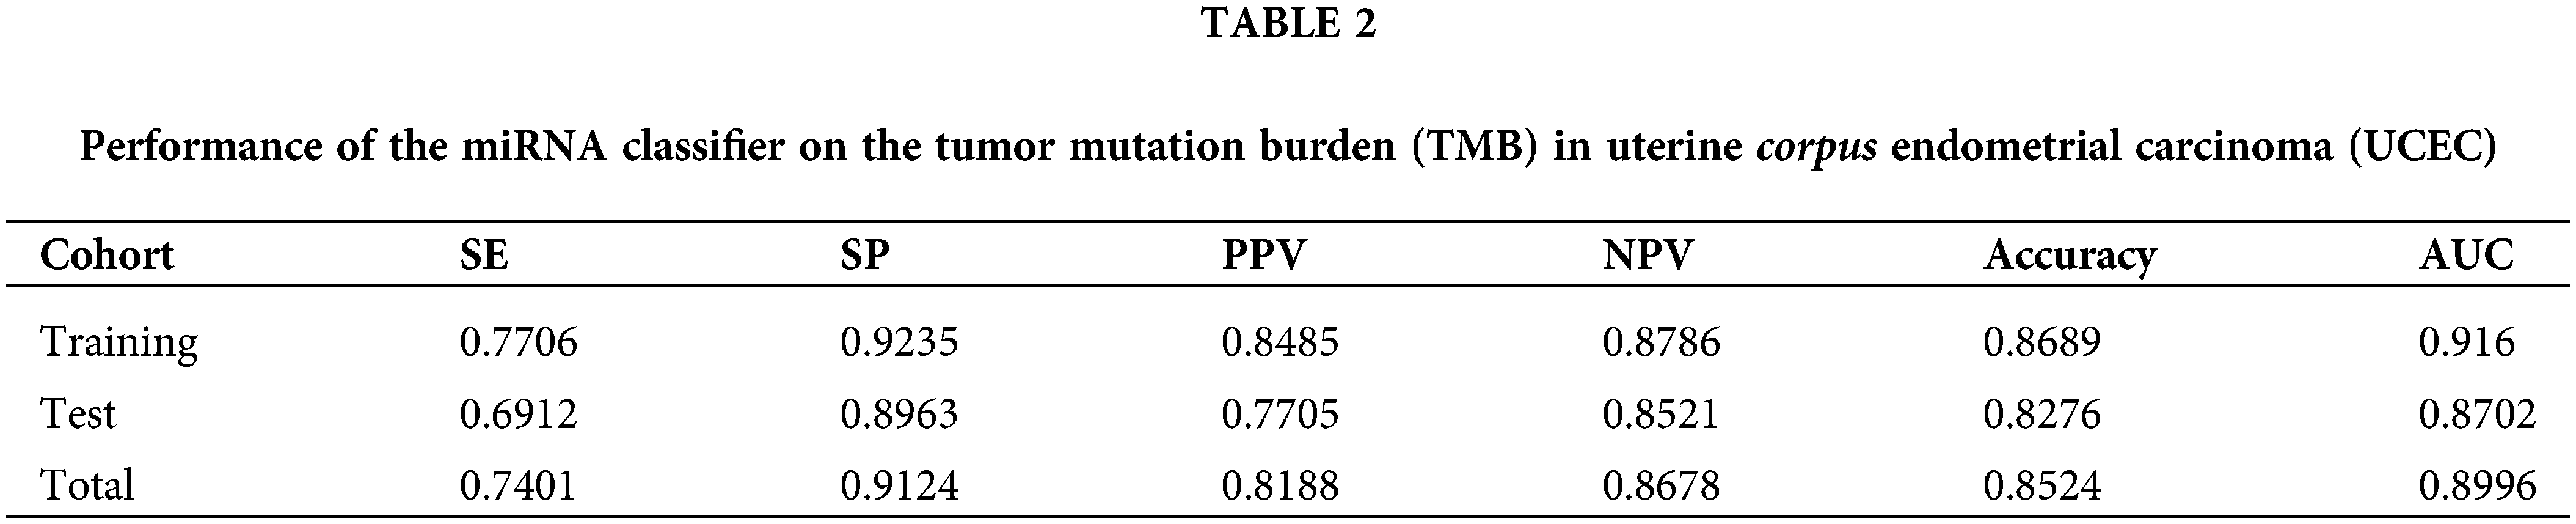
A miRNA-based signature classifier was selected using the LASSO method to divide the UCEC patient dataset into high TMB and low TMB sets, and 32 differentially expressed miRNAs were found. The grouping-wise classification in the 10-fold cross-validation was calculated and type.measure = “AUC” was used for two-class of logistic regression to obtain the AUC curve. The non-zero regression coefficients identified 27 miRNAs (Fig. 3A). These are listed herewith: hsa-let-7b-3p, hsa-miR-708-3p, hsa-miR-34b-3p, hsa-miR-335-3p, hsa-miR-7-1-3p, hsa-miR-148a-3p, hsa-miR-196a-5p, hsa-miR-30c-2-3p, hsa-miR-210-3p, hsa-miR-4746-5p, hsa-miR-3934-3p, hsa-miR-142-5p, hsa-miR-616-3p, hsa-miR-887-3p, hsa-miR-203b-3p, hsa-miR-1262, hsa-miR-130a-3p, hsa-miR-629-3p, hsa-miR-146a-5p, hsa-miR-95-3p, hsa-miR-375-3p, hsa-miR-155-5p, hsa-miR-196b-5p, hsa-miR-942-5p, hsa-miR-30a-5p, hsa-miR-1266-5p, and hsa-miR-34c-3p. The formula of our classifier was shown as: −3.807904892 + (hsa-let-7b-3p * 0.321180916) + (hsa-miR-708-3p * −0.127001) + (hsa-miR-34b-3p * −0.080233193) + (hsa-miR-335-3p * −0.711719483) + (hsa-miR-7-1-3p * 0.017778049) + (hsa-miR-148a-3p * 0.020531695) + (hsa-miR-196a-5p * 0.079969477) + (hsa-miR-30c-2-3p * 0.025969962) + (hsa-miR-210-3p * 0.229842392) + (hsa-miR-4746-5p * 0.592138173) + (hsa-miR-3934-3p * 0.433483099) + (hsa-miR-142-5p * 0.235476377) + (hsa-miR-616-3p * 0.199484605) + (hsa-miR-887-3p * −0.274788316) + (hsa-miR-203b-3p * −0.111090891) + (hsa-miR-1262 * 0.322475306) + (hsa-miR-130a-3p * −0.065486065) + (hsa-miR-629-3p * −0.338063009) + (hsa-miR-146a-5p * −0.074159462) + (hsa-miR-95-3p * −0.236032224) + (hsa-miR-375-3p * 0.080505295) + (hsa-miR-155-5p * 0.280331107) + (hsa-miR-196b-5p * 0.167623075) + (hsa-miR-942-5p * −0.04548189) + (hsa-miR-30a-5p * −0.150027121) + (hsa-miR-1266-5p * 0.146566505) + (hsa-miR-34c-3p * −0.124107574). The 27-miRNA signature classifier had an accuracy of 0.8689 on the training set, 0.8276 on the test set, and 0.8524 on the total set. The SE, SP, PPV, NPV, and AUC values were shown in Table 2. The results showed the high efficiency of our 27-miRNA-based signature classifier. The AUC in the ROC curve was 0.9160 in the training set while it was 0.8702 in the test set (Fig. 3B), which means our classifier has a high specificity (Fig. 3C).
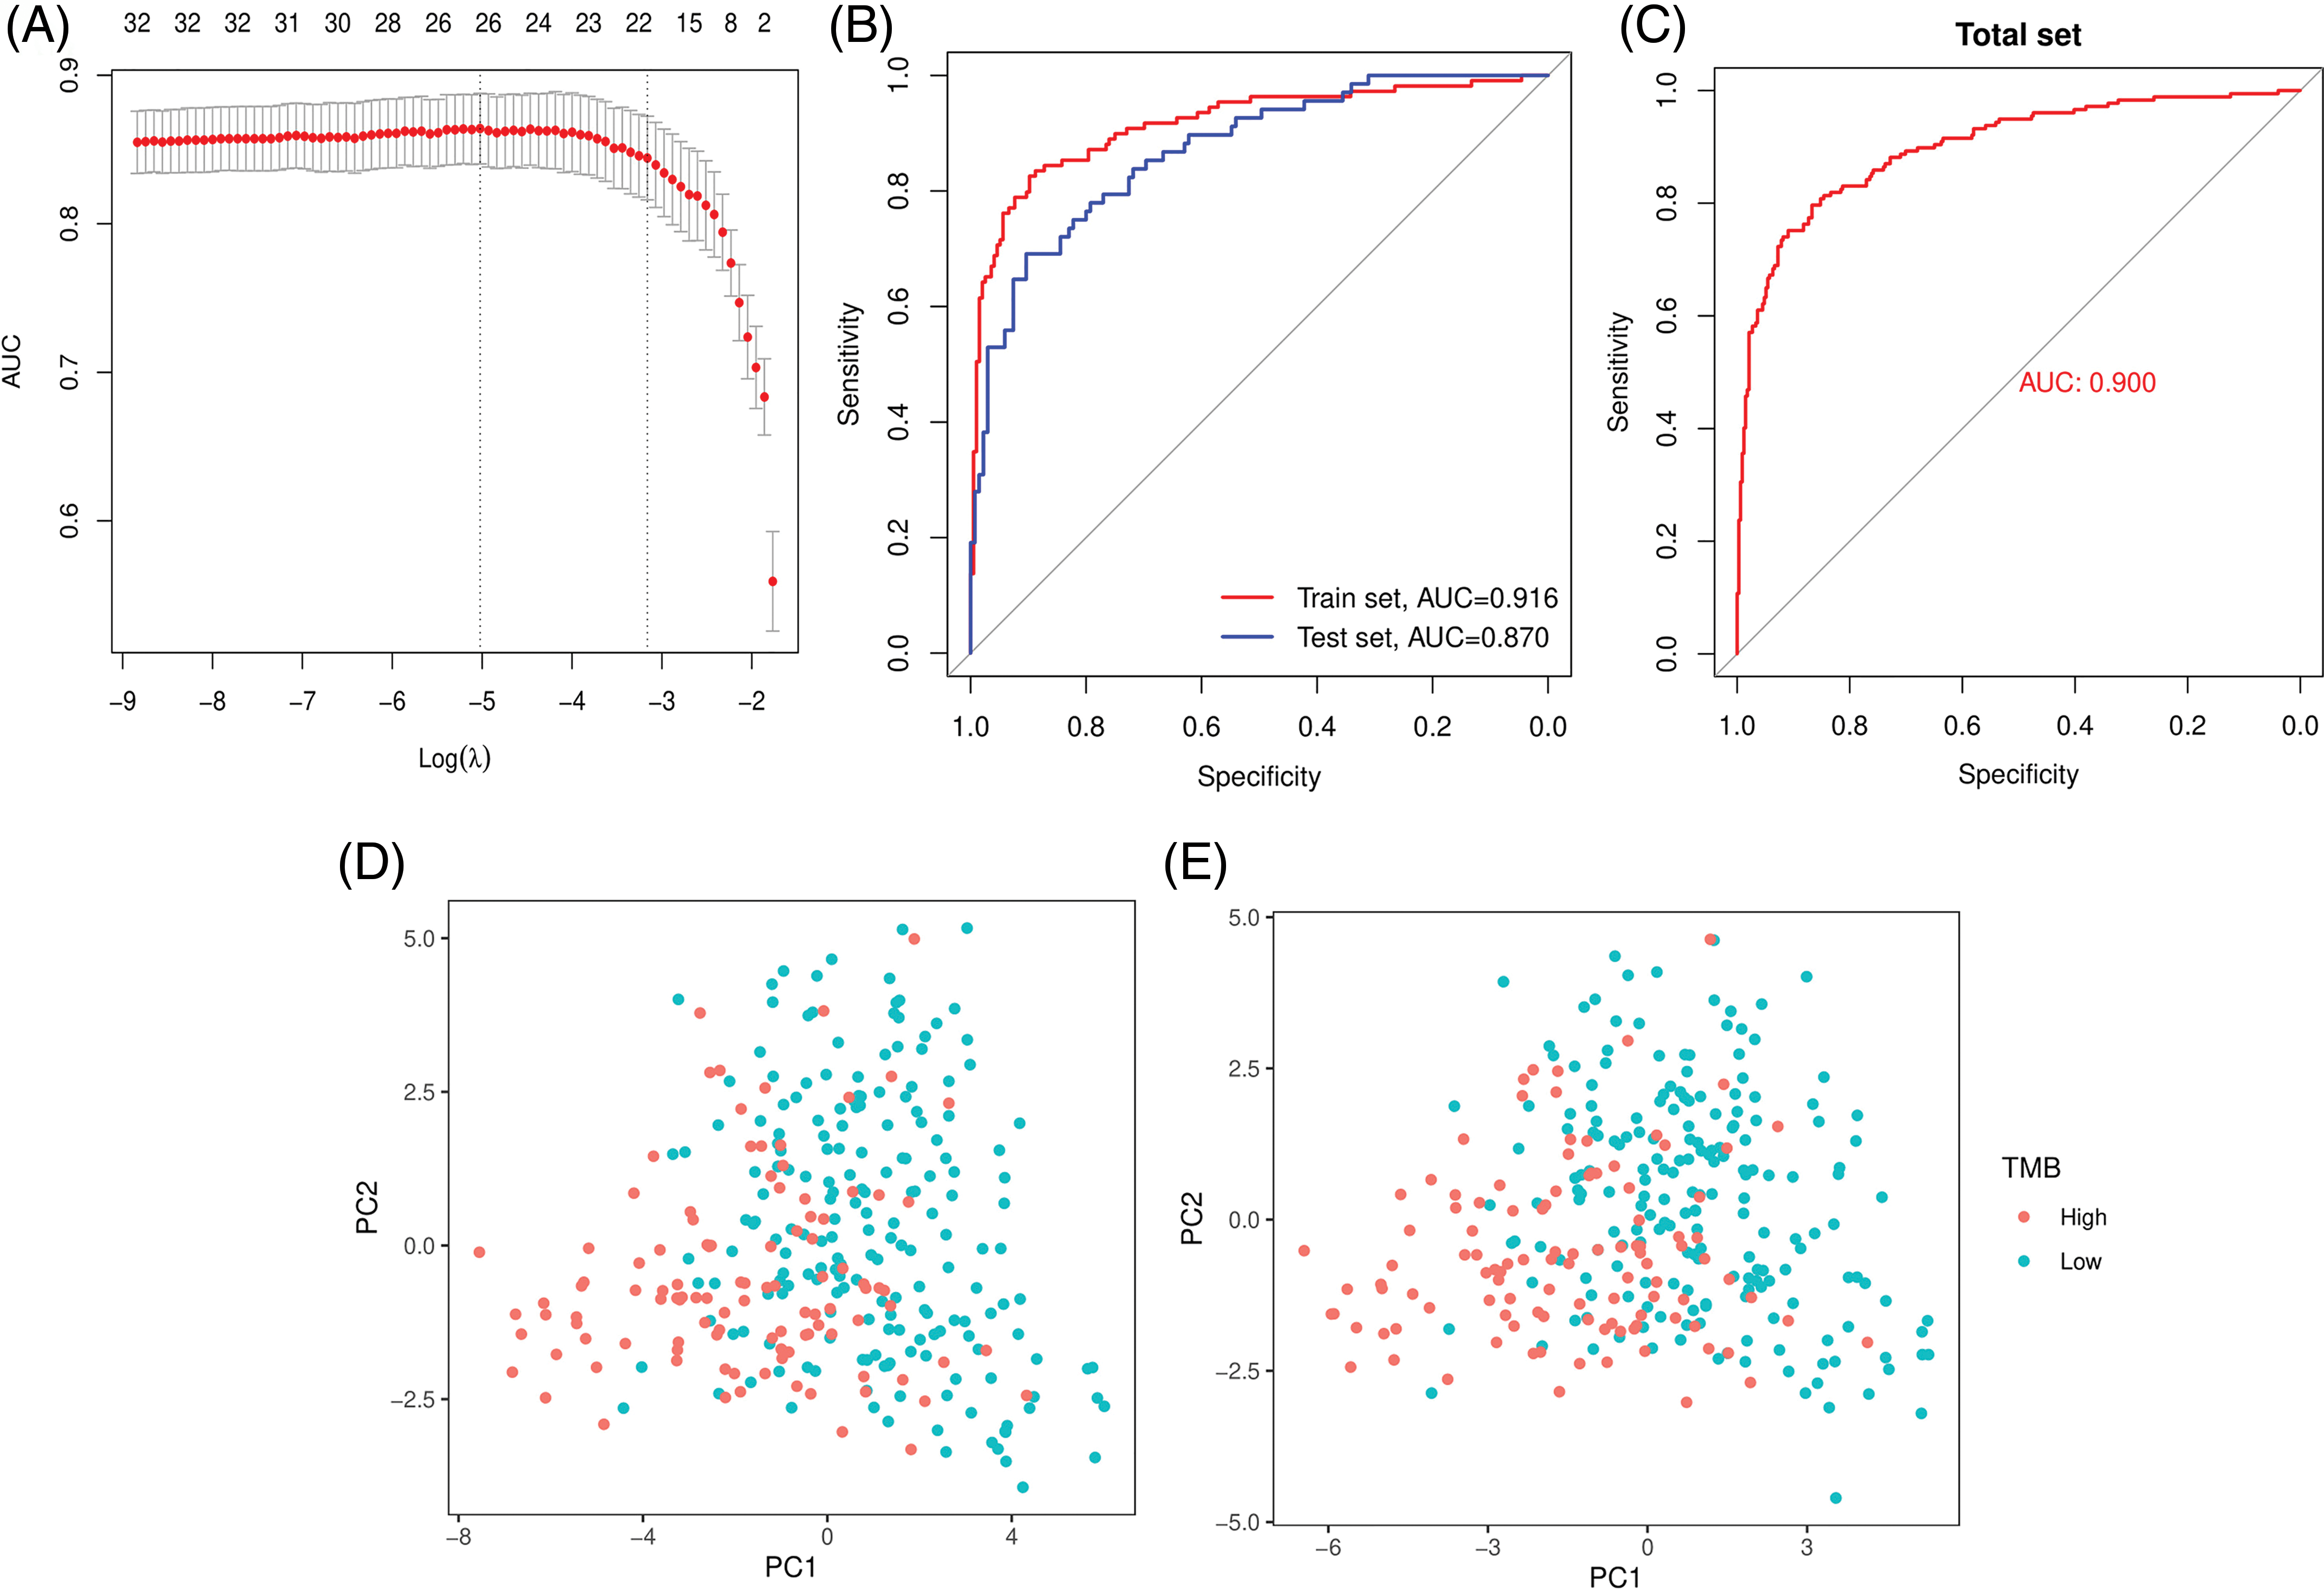
Figure 3: The least absolute shrinkage and selection operator (LASSO) method and Area Under the Curve (AUC) for 27-miRNA-based classifier index and PCA. (A) The LASSO method selected 27 miRNAs. (B) AUC curves in the training set and the test set. (C) AUC curve in the total set. Principal Component Analysis (PCA) before (D) and after (E) LASSO variable reduction.
The PCA results showed that patients could be easily distinguished using the differential expression of all miRNAs (n = 32) or using the 27 miRNAs derived by the LASSO method (Figs. 3D and 3E).
Three immune checkpoint inhibitors (ICIs) and 27-miRNA-based signature classifier
Three immune checkpoint inhibitors SNCA (PD-1), CD274 (PD-L1), and CTLA4 were the most studied genes. The correlation between our miRNA classifier and TMB and the correlation between the classifier and these immune checkpoint inhibitors were explored. Our results indicated that the 27-miRNA-based signature classifier has a high correlation with TMB (R = 0.6, p < 2.2e-16, Fig. 4A). However, the correlation with PD-1 (R = −0.29, p = 2.2e-11, Fig. 4B), PD-L1 (R = 0.18, p = 7.8e-05, Fig. 4C) and CTLA4 (R = 0.27, p = 1.3e-09, Fig. 4D) was much lower.
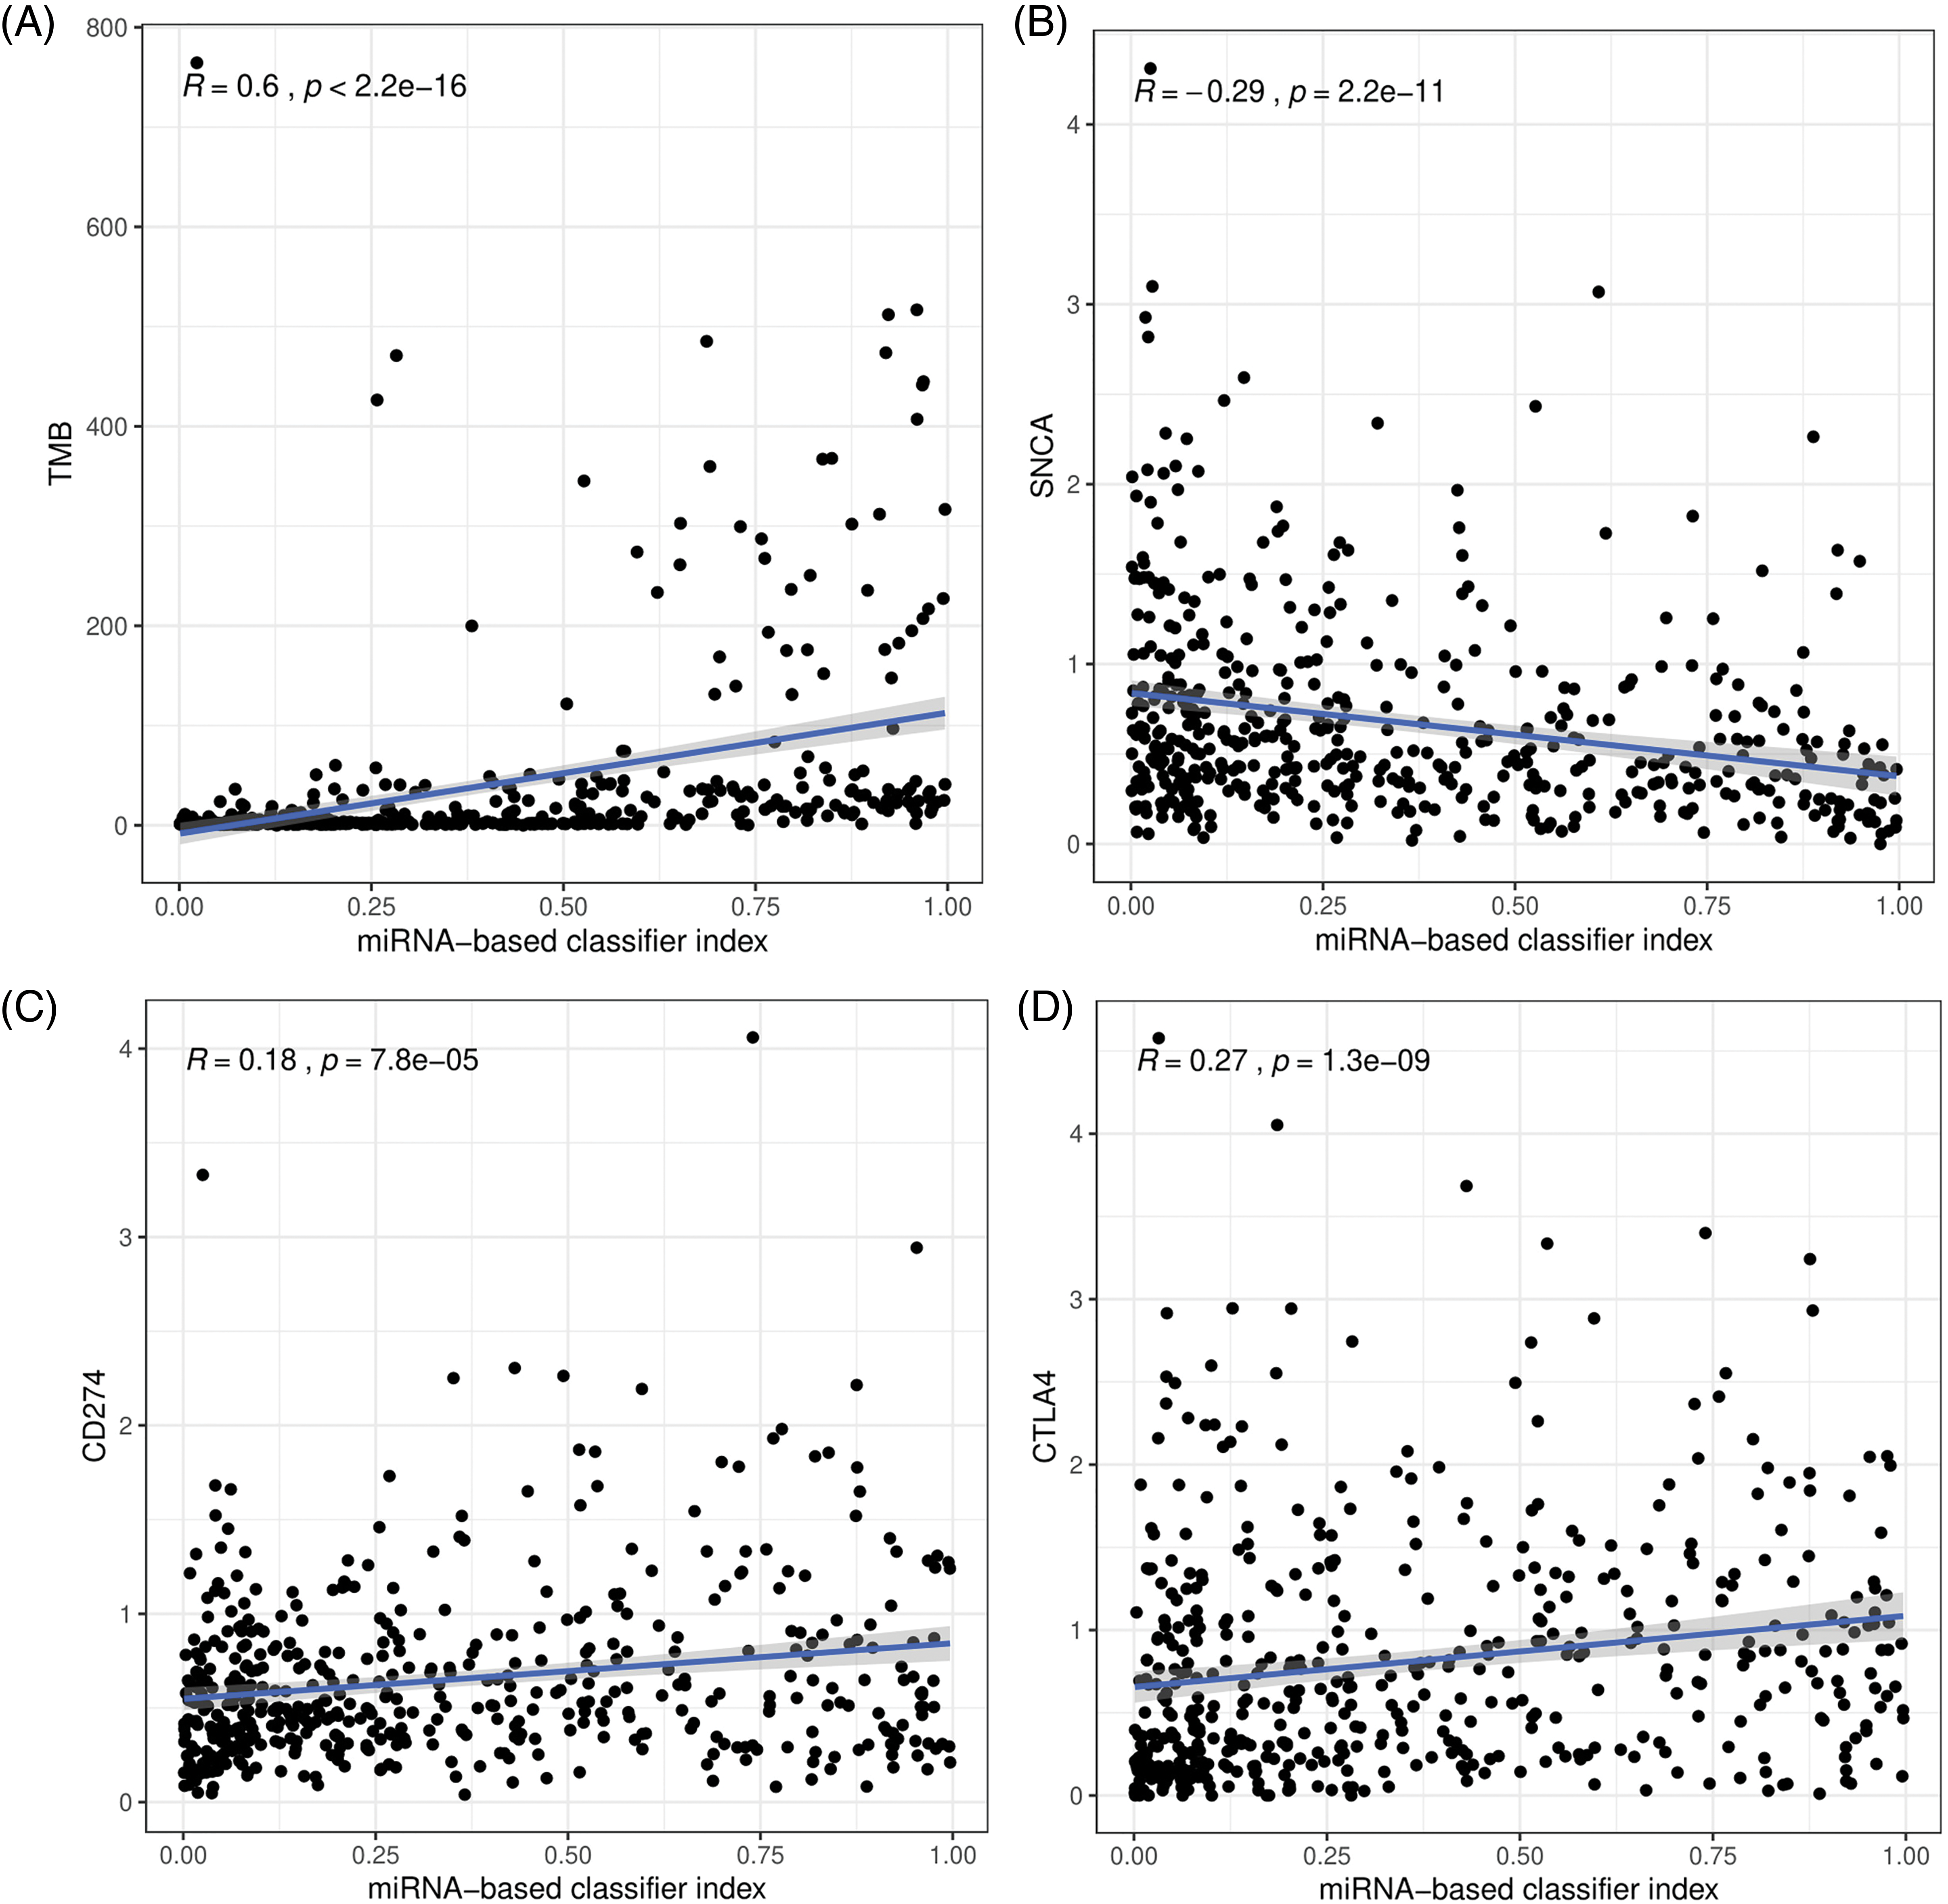
Figure 4: The correlation between the 27-miRNA-based classifier with the tumor mutation burden (TMB) (A), PD-1 (B), PD-L1 (C), and CTLA4 (D).
According to databases: miRDB (http://mirdb.org/), miRTarBase (https://mirtarbase.cuhk.edu.cn/), and TargetScan (http://www.targetscan.org/vert_72/), PD-1 was targeted by 9 miRNAs, PD-L1 was targeted by 12 miRNAs and CTLA4 was targeted by 6 miRNAs (Table 3). The enrichment analysis indicated that the 27 miRNAs in our study were involved in many cancer-related pathways (Fig. 5A) and immune-related biological processes (Fig. 5B). This suggests that the selected miRNAs participated in cancer-related immune processes.
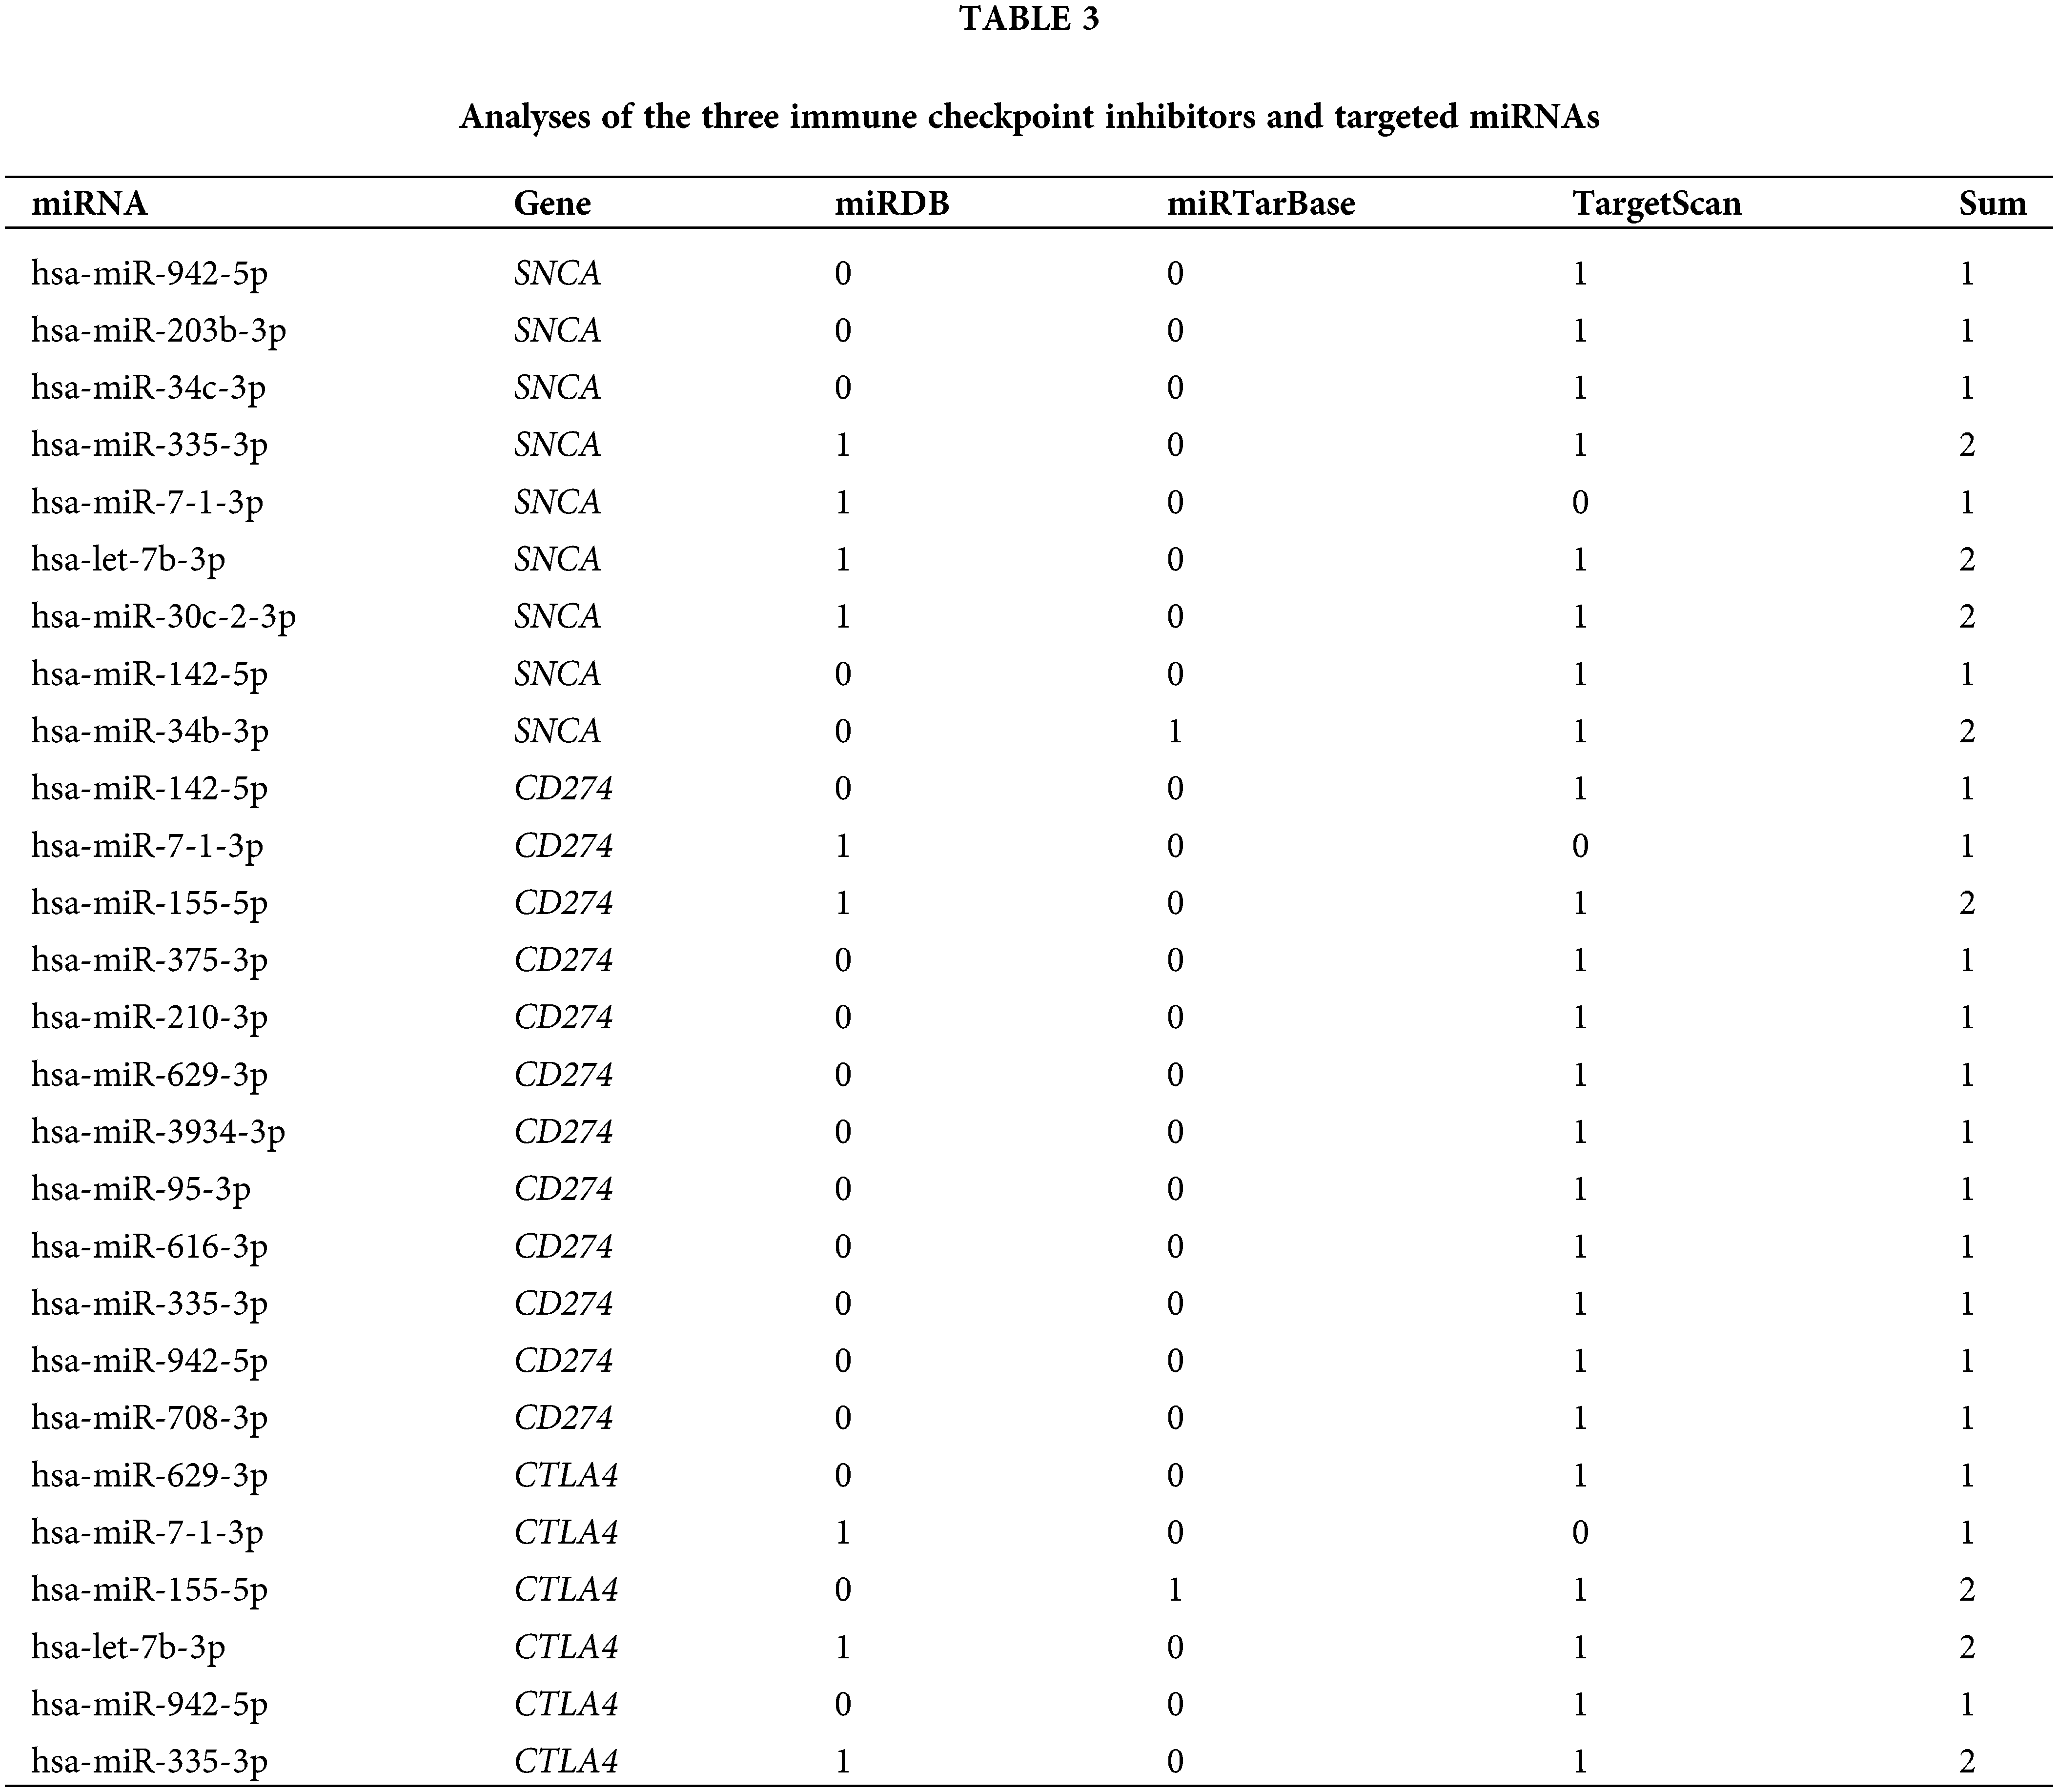
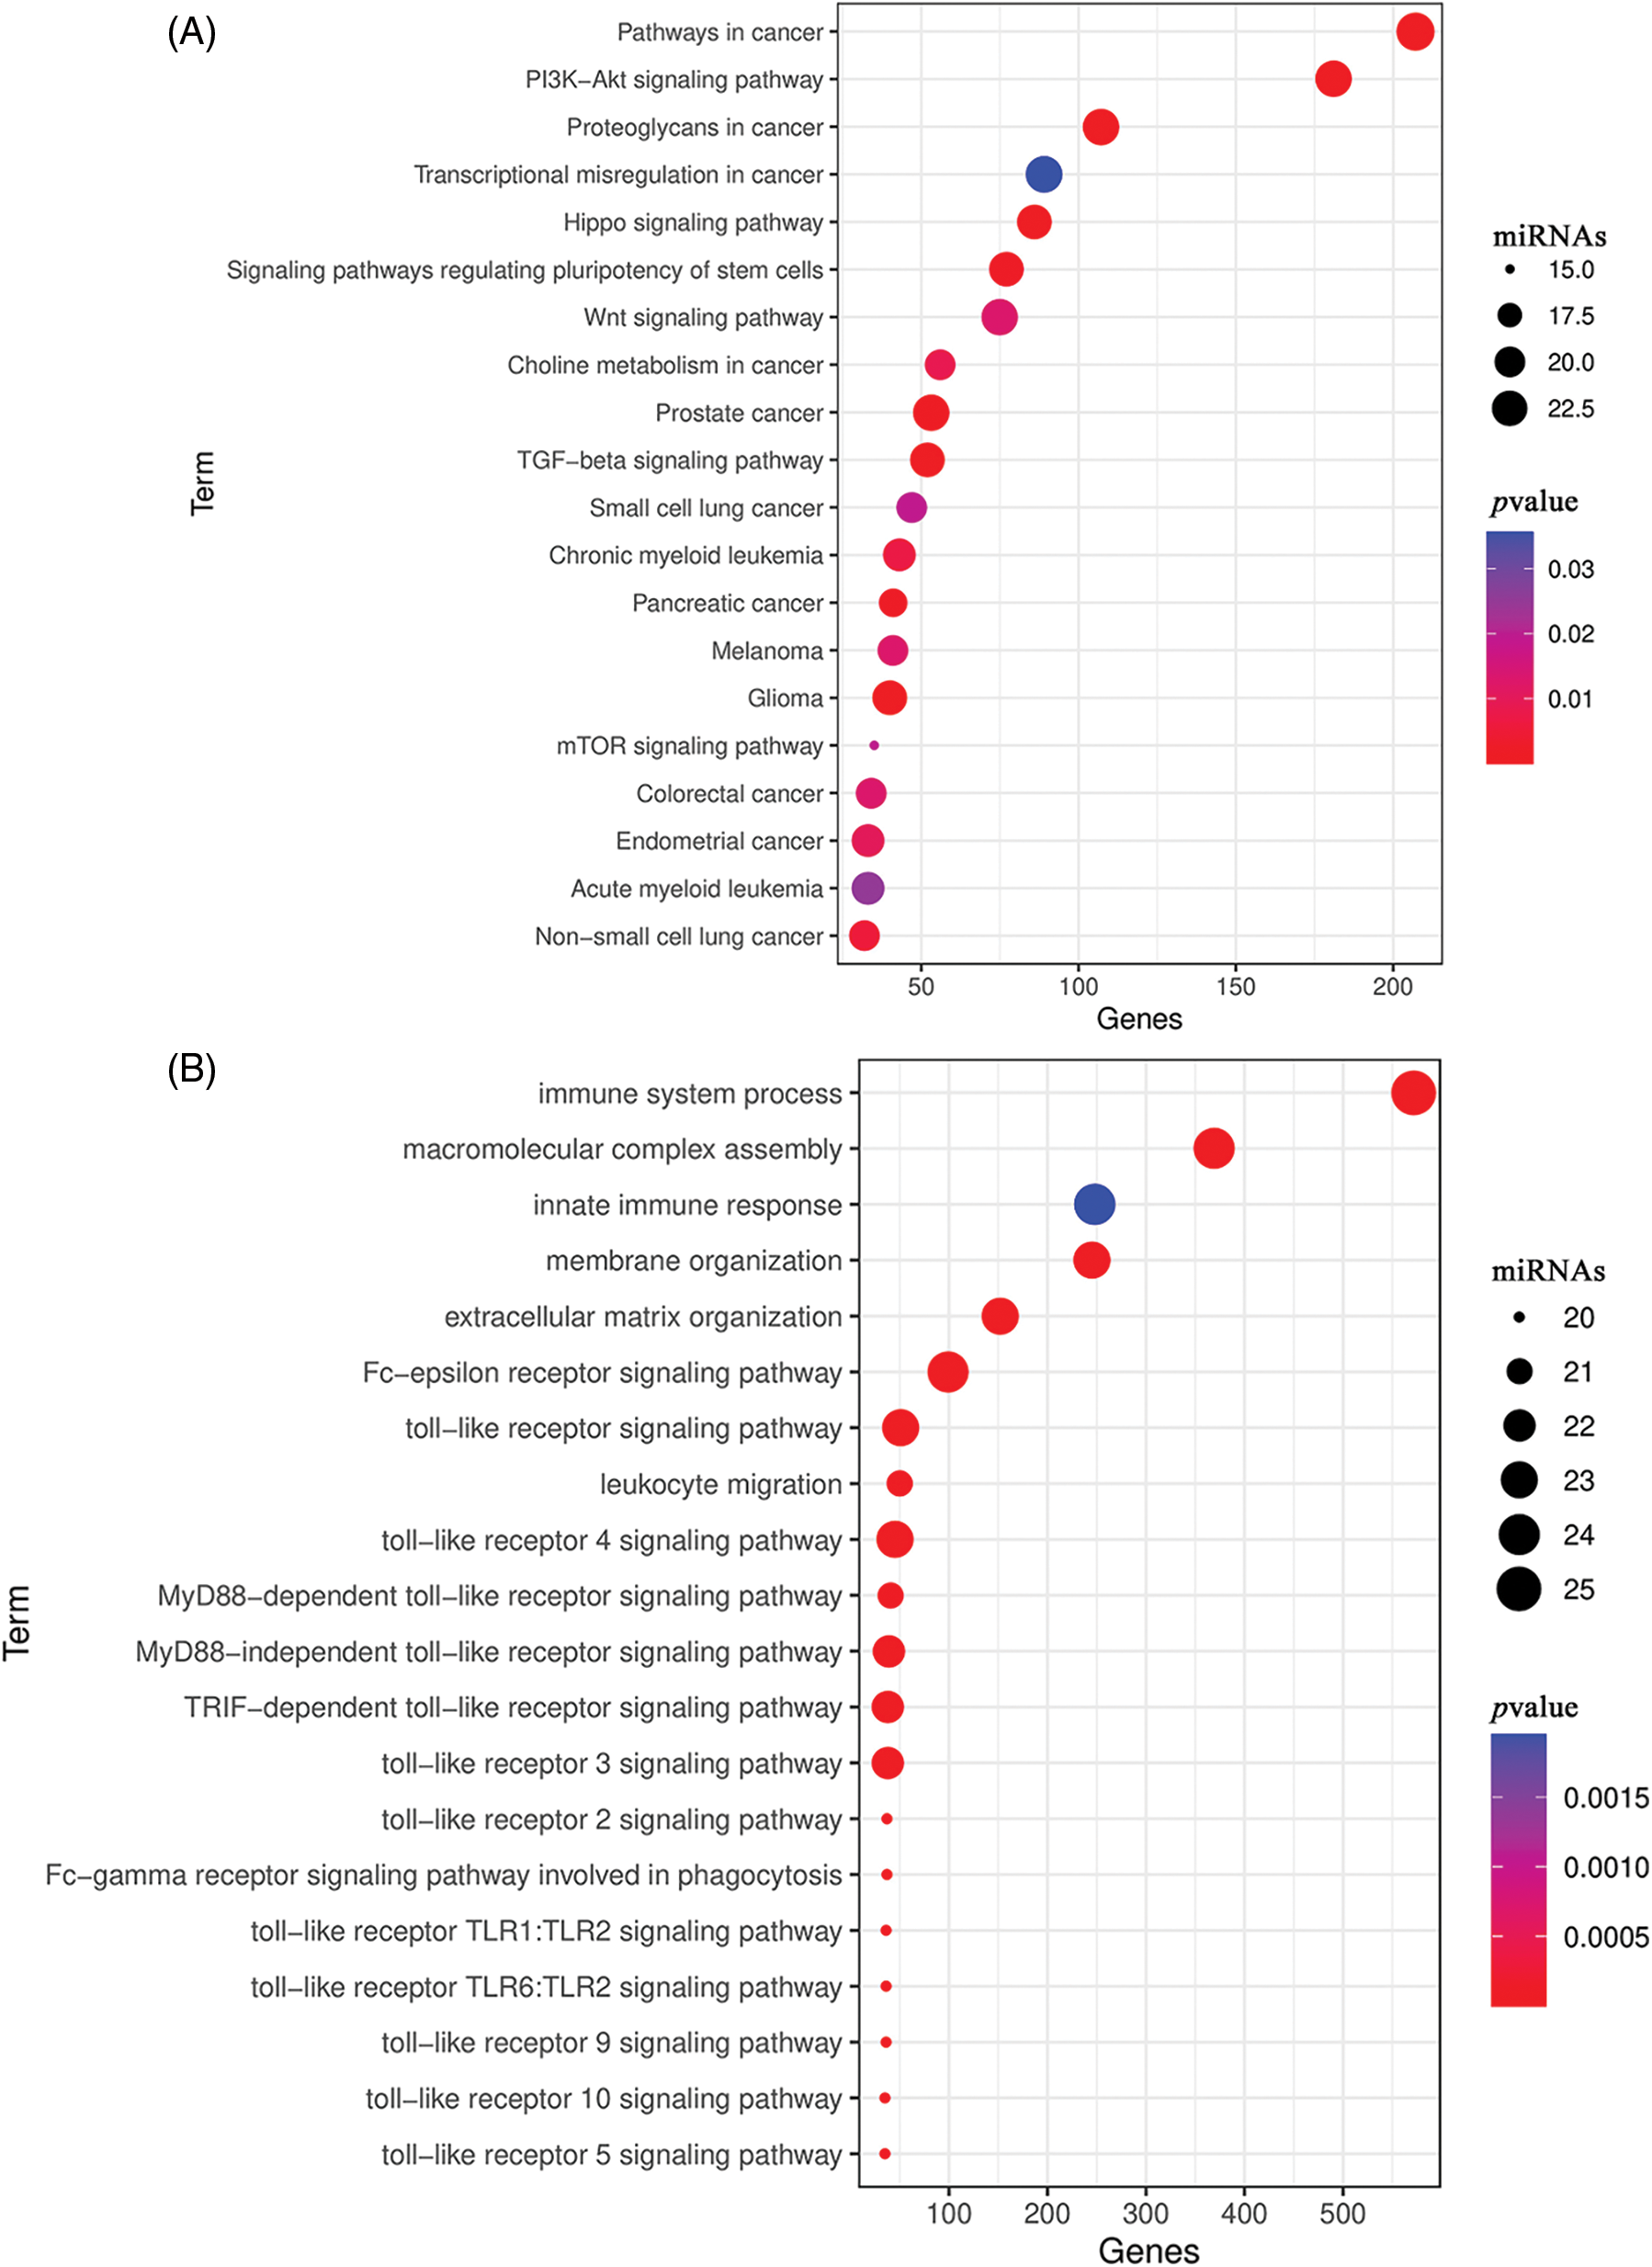
Figure 5: Enrichment analysis of the 27 miRNAs. (A) Enriched Kyoto Encyclopedia of Genes and Genomes (KEGG) pathways. (B) Enriched Gene Ontology (GO) biological processes.
To investigate the expression of the 27 miRNAs in our signature, we first analyzed the miRNA expression levels in UCEC tumor tissues compared to normal tissues or corresponding adjacent endometrium tissues in the TCGA dataset. Among them, 19 miRNA molecules had significant differences in expression between tumor tissues and normal tissues (Figs. 6A–6F). In addition, we performed ROC curve analysis to evaluate the prognostic values of each miRNA in the signature for UCEC in TCGA (Figs. 6G–6I). Combined with the above results, we screened 9 miRNAs for verification including hsa-miR-7-1-3p, hsa-miR-210-3p, hsa-miR-4746-5p, hsa-miR-3934-3p, hsa-miR-629-3p, hsa-miR-146a-5p, hsa-miR-155-5p, hsa-miR-942-5p, and hsa-miR-1266-5p. Further, we collected 20 pairs of fresh tumors and adjacent normal tissues for qPCR analysis (Fig. 7). We found hsa-miR-155-5p, hsa-miR-4746-5p, hsa-miR-146a-5p, and hsa-miR-210-3p were collectively highly expressed in both the TCGA dataset and in our samples. This further confirmed that our miRNA-based classifier is effective.
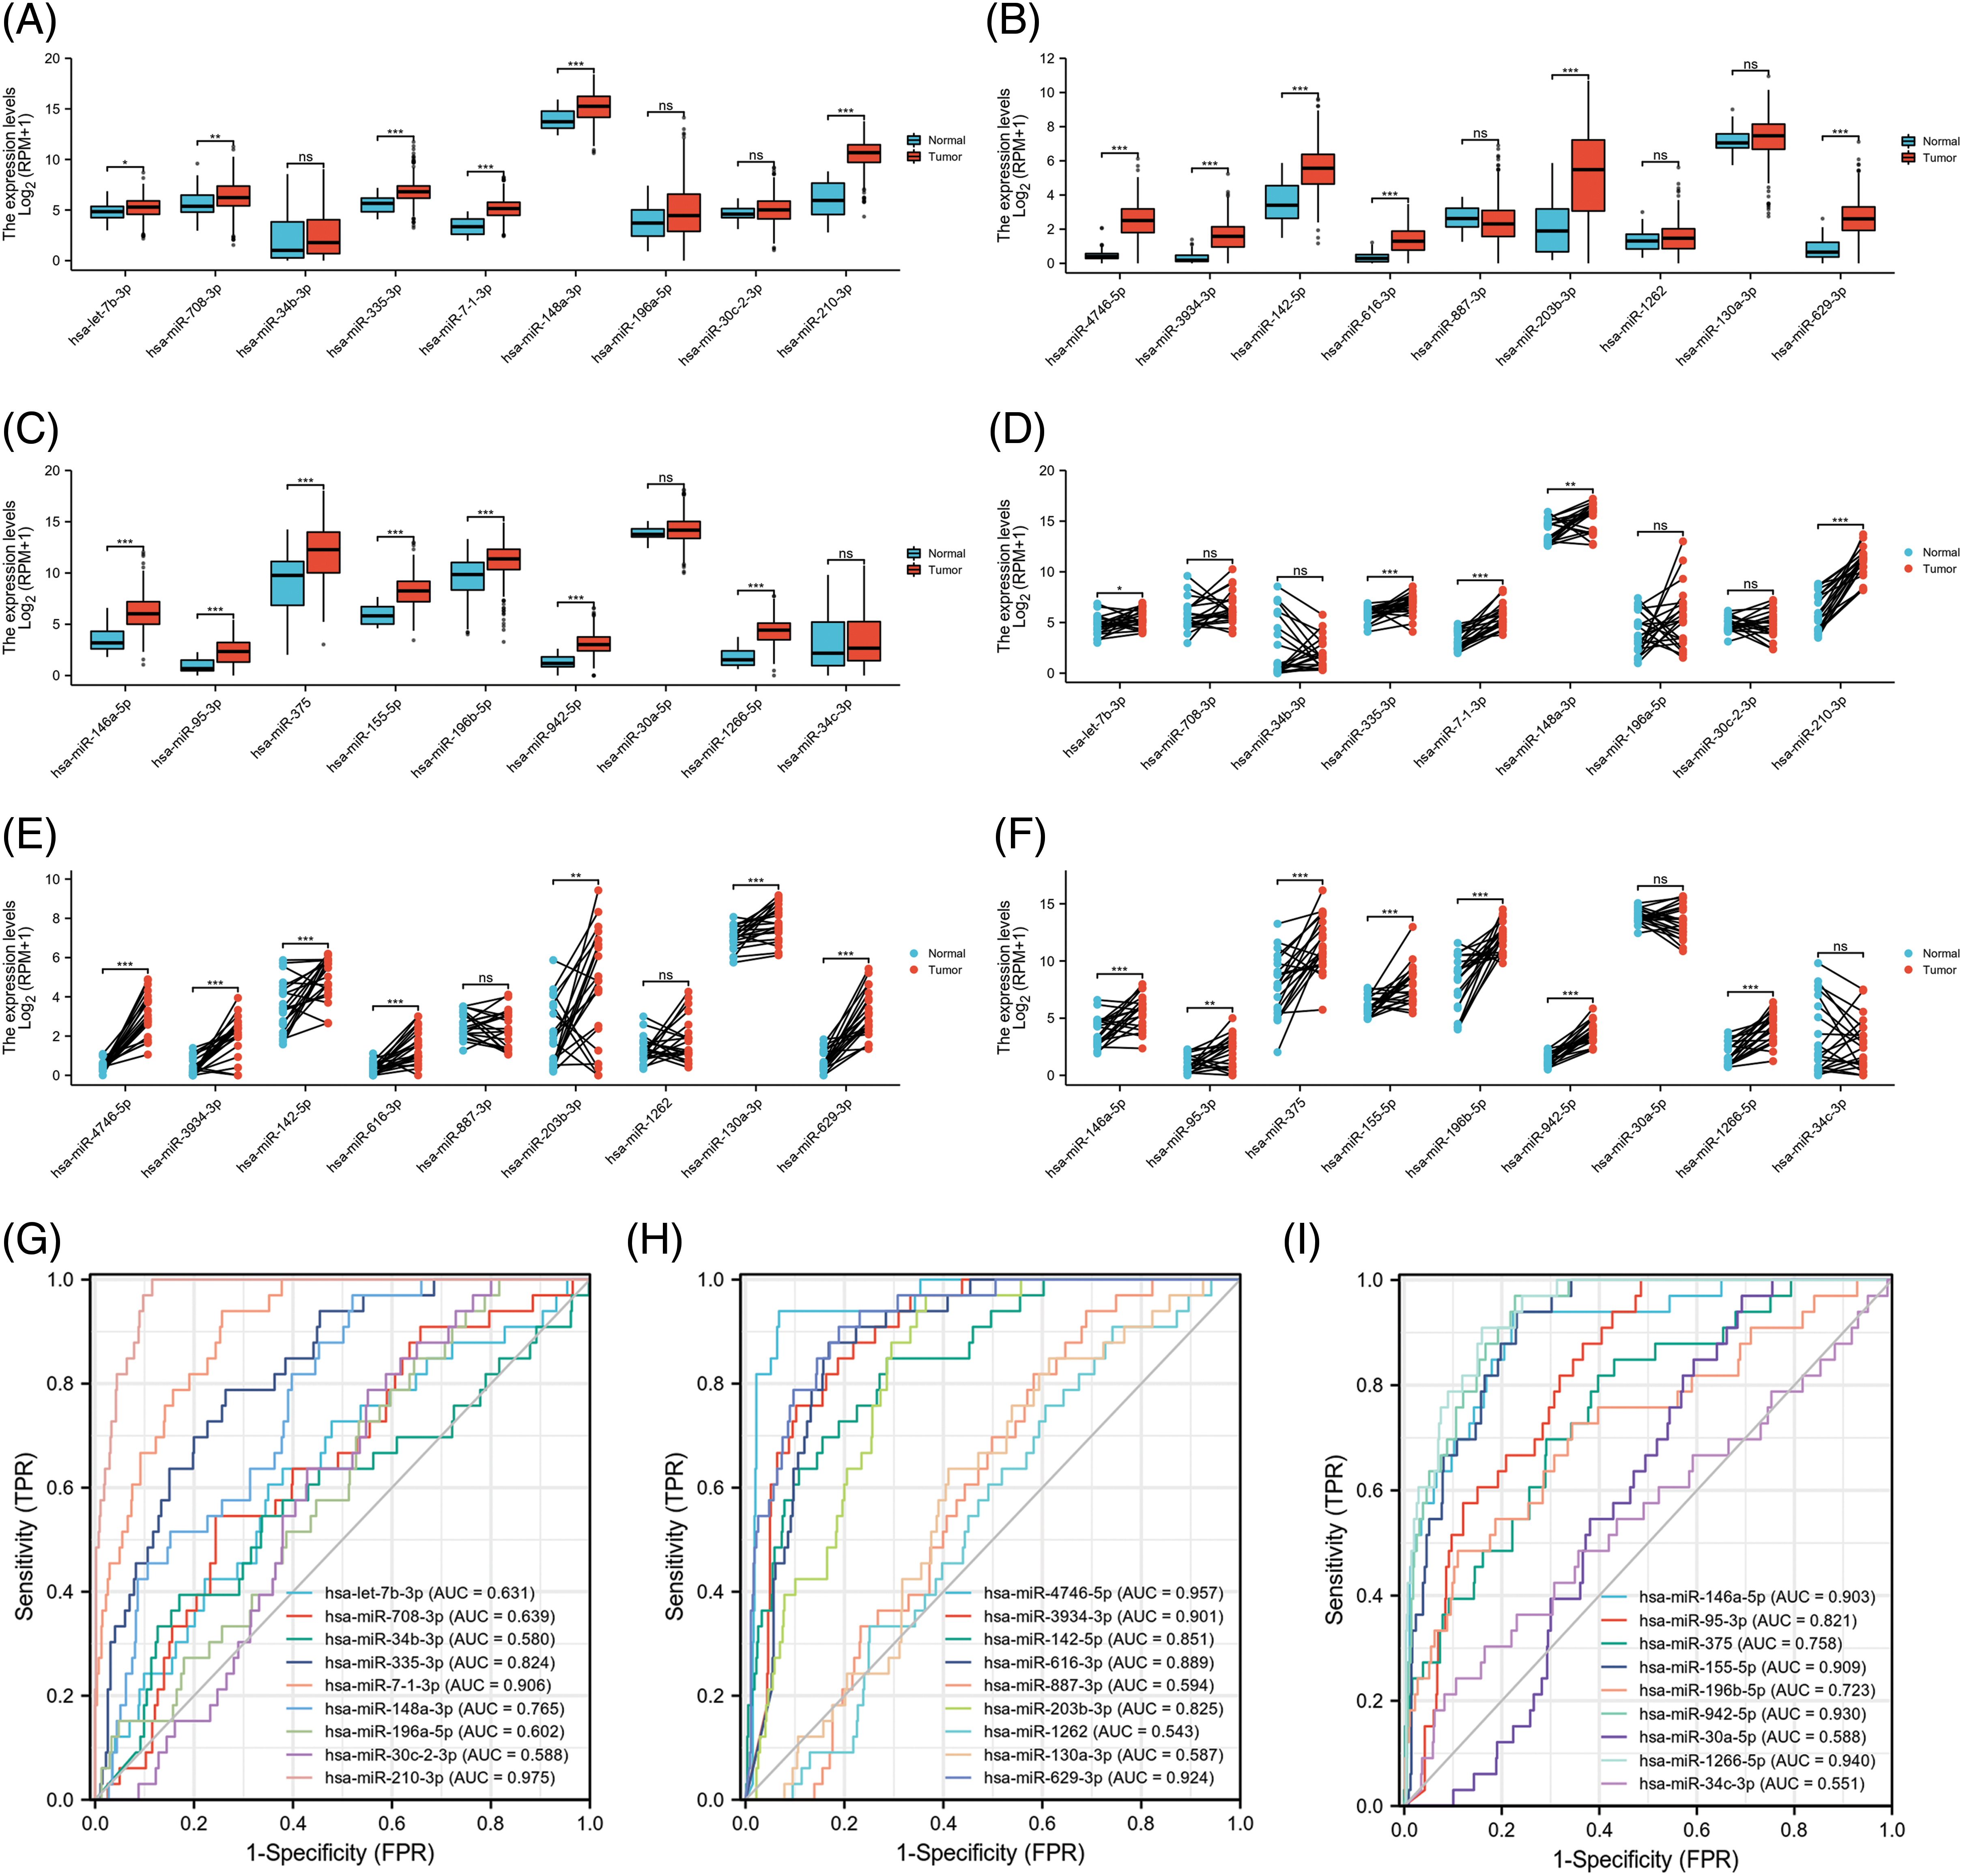
Figure 6: The expression and the receiver operating characteristic curve (ROC) curve of 27-miRNA signatures in uterine corpus endometrial carcinoma (UCEC). (A–C) The expression levels of each of the 27 miRNAs in UCEC tumor tissue compared to normal tissues in The Cancer Genome Atlas (TCGA). (D–F) The expression levels of each of the 27-miRNA in UCEC tumor tissue and corresponding adjacent endometrium tissues in TCGA. (G–I) ROC curve of each of the 27-miRNA signature.
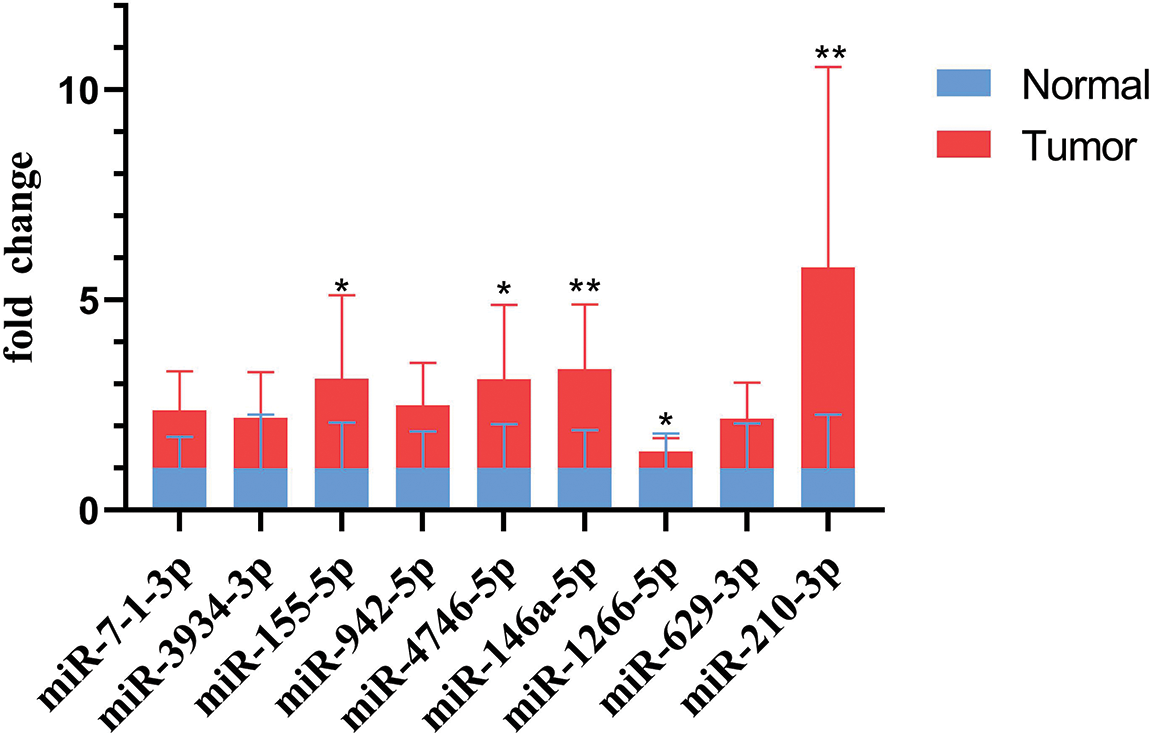
Figure 7: Validation of miRNA expression levels in fresh uterine corpus endometrial carcinoma (UCEC) tissue samples by quantitative polymerase chain reaction (qPCR) (p-values: *p < 0.05, **p < 0.01, ***p < 0.001).
Herein, we established a 27-miRNA-based signature classifier to distinguish high TMB and low TMB levels in UCEC. Moreover, we validated that this miRNA-based signature classifier had a 0.8276 in the test cohort, which indicated that it was highly reliable. Indeed, we were the first indicated the correlation between miRNAs and the TMB in UCEC and also determined that these miRNAs show differential expression between high TMB and low TMB level samples. Furthermore, we confirmed that hsa-miR-155-5p, hsa-miR-4746-5p, hsa-miR-146a-5p, and hsa-miR-210-3p were collectively highly expressed in our clinical samples.
TMB, as an independent biomarker, has been repeatedly reported to be able to predict patient responses to ICIs (Hellmann et al., 2018b; Ready et al., 2019; Koeppel et al., 2017). Further, combined immunotherapy could not overcome the negative predictive effect of low TMB. Liquid biopsies are an alternative method to measure TMB effectively and they are not as invasive as tissue biopsies (Gandara et al., 2018; Fenizia et al., 2018; Fabrizio et al., 2018).
A study showed that in advanced non-small cell lung cancer (NSCLC), a prognostic circulating miRNA signature classifier could be combined with PD-L1 to identify worse Overall Response Rate (ORR) and OS (Boeri et al., 2019). However, the relationship between miRNA expression and the TMB level is not yet clear in UCEC. In this study, we identified the differential expression of miRNAs between the high and low TMB groups and established a miRNA-based signature classifier to distinguish high and low TMB. This classifier was further validated by the test set. Our results show that the change in transcriptomics can be led by the change in genomics. For predicting the TMB level, the 27-miRNA-based signature classifier had an accuracy of 0.8689 in training, an accuracy of 0.8276 in the test, and an accuracy of 0.8524 in total. ROC curve analysis showed that the AUC of the training group was 0.9160 and the AUC of the test group was 0.8702, suggesting that the classifier was highly reliable. The PPV and NPV were both high, which means our classifier had a strong recognition ability for both high TMB and low TMB.
The strongest treatment response with immune checkpoint inhibitors can be seen in high TMB levels and high PD-L1 expression. It is not clear whether TMB can be effectively combined with the existing PD-L1 expression analysis, or whether TMB levels can completely replace the PD-L1 test. It is reported that tumors with higher mutational burden can be easily lesioned by the immune system (Schumacher and Schreiber, 2015). Our study indicated that the miRNAs show a differential expression between high TMB and low TMB levels. The GO analysis showed that the 27 miRNAs were involved in immune-related biological processes, such as the immune system process, innate immune response, and the Fc-epsilon receptor signaling pathway. The KEGG analysis also indicated that the 27 miRNAs participate in many cancer-related pathways, which suggested that the classifier can be a good predictor of TMB levels. Research done on advanced NSCLC reported that immunotherapy effectiveness correlated with plasma miRNA levels (Peng et al., 2020). However, as there was no study yet to discuss the correlation between miRNAs and TMB in UCEC and our study confirmed this for the first time. According to the results of qPCR, we further confirmed that our classifier is effective. Additionally, miR-155-5p, miR-4746-5p, miR-146a-5p, and miR-210-3p have been reported as potential biomarkers in many carcinomas including colon cancer, hepatocellular cancer, prostate cancer, etc. (Lan et al., 2019; Cho et al., 2020; Min et al., 2017; Ren et al., 2017). What’s more, the classifier showed a low correlation with PD-1, PD-L1, and CTLA4.
In summary, we found that there is a differential miRNA expression in different TMB levels. We provide a miRNA-based signature classifier to serve as a predictor of different TMB levels. We also provide initial experimental evidence that miR-155-5p, miR-4746-5p, miR-146a-5p, miR-210-3p may play a vital role in UCEC.
Funding Statement: The work was supported by the National Natural Science Foundation (81803877, 82104705), the Natural Science Foundation of Guangdong Province of China (2017A030310178), the Guangdong Sci-Tech Commissioner (20211800500322), the China Postdoctoral Science Foundation (2020M682817), Guangdong Basic and Applied Basic Research Foundation (2020A1515110651, 2020B1515120063), Guangdong Medical Science and Technology Research Foundation (A2021476), Traditional Chinese Medicine Research Project of Guangdong Province Traditional Chinese Medicine Bureau (20221256), and the Dongguan Social Technology Development Fund (202050715001207).
Author Contributions: The authors confirm their contribution to the paper as follows: YW, YY, and HD conceived the study, analyzed and interpreted the data, and reviewed the article. YC and HW downloaded and analyzed all the files, and wrote the original article. RZ collected and analyzed clinical samples. XW, XZ, and WC performed the statistical analysis. All authors ensured that the International Committee of Medical Journal Editor recommendations were met and critically reviewed the manuscript.
Availability of Data and Materials: The datasets used and/or analyzed during the current study are available from the corresponding author upon reasonable request.
Ethics Approval: The studies involving human participants were reviewed and approved by the Ethics Review Board of Affiliated Dongguan People’s Hospital (Document No. KYKT2022-075). All patients signed informed consent.
Conflicts of Interest: The authors declare that they have no conflicts of interest to report regarding the present study.
References
Alexandrov LB, Nik-Zainal S, Wedge DC, Aparicio SAJR, Behjati S et al. (2013). Signatures of mutational processes in human cancer. Nature 500: 415–421. https://doi.org/10.1038/nature12477 [Google Scholar] [PubMed] [CrossRef]
Anagnostou V, Smith KN, Forde PM, Niknafs N, Bhattacharyaet R et al. (2017). Evolution of neoantigen landscape during immune checkpoint blockade in non-small cell lung cancer. Cancer Discovery 7: 264–276. https://doi.org/10.1158/2159-8290.CD-16-0828 [Google Scholar] [PubMed] [CrossRef]
Boeri M, Milione M, Proto C, Signorelli D, Russo GL et al. (2019). Circulating miRNAs and PD-L1 tumor expression are associated with survival in advanced NSCLC patients treated with immunotherapy: A prospective study. Clinical Cancer Research 25: 2166–2173. https://doi.org/10.1158/1078-0432.CCR-18-1981 [Google Scholar] [PubMed] [CrossRef]
Calin GA, Croce CM (2006). MicroRNA signatures in human cancers. Nature Reviews Cancer 6: 857–866. https://doi.org/10.1038/nrc1997 [Google Scholar] [PubMed] [CrossRef]
Campesato LF, Barroso-Sousa R, Jimenez L, Correa BR, Sabbaga J et al. (2015). Comprehensive cancer-gene panels can be used to estimate mutational load and predict clinical benefit to PD-1 blockade in clinical practice. Oncotarget 6: 34221–34227. https://doi.org/10.18632/oncotarget.5950 [Google Scholar] [PubMed] [CrossRef]
Carbone DP, Reck M, Paz-Ares L, Creelan B, Horn L et al. (2017). First-line nivolumab in stage IV or recurrent non-small-cell lung cancer. The New England Journal of Medicine 376: 2415–2426. https://doi.org/10.1056/NEJMoa1613493 [Google Scholar] [PubMed] [CrossRef]
Chalmers ZR, Connelly CF, Fabrizio D, Gay L, Ali SM et al. (2017). Analysis of 100,000 human cancer genomes reveals the landscape of tumor mutational burden. Genome Medicine 9: 34. https://doi.org/10.1186/s13073-017-0424-2 [Google Scholar] [PubMed] [CrossRef]
Chaudhry P, Asselin E (2009). Resistance to chemotherapy and hormone therapy in endometrial cancer. Endocrine-Related Cancer 16: 363–380. https://doi.org/10.1677/ERC-08-0266 [Google Scholar] [PubMed] [CrossRef]
Cho HJ, Baek GO, Seo CW, Ahn HR, Sung S et al. (2020). Exosomal microRNA-4661-5p-based serum panel as a potential diagnostic biomarker for early-stage hepatocellular carcinoma. Cancer Medicine 9: 5459–5472. https://doi.org/10.1002/cam4.3230 [Google Scholar] [PubMed] [CrossRef]
Cibulskis K, Lawrence MS, Carter SL, Sivachenko A, Jaffe D et al. (2013). Sensitive detection of somatic point mutations in impure and heterogeneous cancer samples. Nature Biotechnology 31: 213–219. https://doi.org/10.1038/nbt.2514 [Google Scholar] [PubMed] [CrossRef]
Couzin-Frankel J (2013). Cancer immunotherapy. Science 342: 1432–1433. https://doi.org/10.1126/science.342.6165.1432 [Google Scholar] [PubMed] [CrossRef]
Crosbie EJ, Kitson SJ, McAlpine JN, Mukhopadhyay A, Powell ME, Singh N (2022). Endometrial cancer. Lancet 399: 1412–1428. https://doi.org/10.1016/S0140-6736(22)00323-3 [Google Scholar] [PubMed] [CrossRef]
Dragomir M, Chen B, Fu X, Calin GA (2018). Key questions about the checkpoint blockade-are microRNAs an answer? Cancer Biology & Medicine 15: 103–115. https://doi.org/10.20892/j.issn.2095-3941.2018.0006 [Google Scholar] [PubMed] [CrossRef]
Fabrizio D, Lieber D, Malboeuf C (2018). A blood-based next-generation sequencing assay to determine tumor mutational burden (bTMB) is associated with benefit to an anti-PD-L1 inhibitor, atezolizumab. Cancer Research 78: 5706. https://doi.org/10.1158/1538-7445.AM2018-5706 [Google Scholar] [CrossRef]
Fenizia F, Pasquale R, Roma C, Bergantino F, Iannaccone A, Normanno N (2018). Measuring tumor mutation burden in non-small cell lung cancer: Tissue versus liquid biopsy. Translational Lung Cancer Research 7: 668–677. https://doi.org/10.21037/tlcr.2018.09.23 [Google Scholar] [PubMed] [CrossRef]
Friedman J, Hastie T, Tibshirani R (2010). Regularization paths for generalized linear models via coordinate descent. Journal of Statistical Software 33: 1–22. https://doi.org/10.18637/jss.v033.i01 [Google Scholar] [CrossRef]
Gandara DR, Paul SM, Kowanetz M, Schleifman E, Zou W et al. (2018). Blood-based tumor mutational burden as a predictor of clinical benefit in non-small-cell lung cancer patients treated with atezolizumab. Nature Medicine 24: 1441–1448. https://doi.org/10.1038/s41591-018-0134-3 [Google Scholar] [PubMed] [CrossRef]
Garofalo A, Sholl L, Reardon B, Weiner AT, Mansour A et al. (2016). The impact of tumor profiling approaches and genomic data strategies for cancer precision medicine. Genome Medicine 8: 79. https://doi.org/10.1186/s13073-016-0333-9 [Google Scholar] [PubMed] [CrossRef]
Goodman AM, Kato S, Bazhenova L, Patel SP, Frampton GM et al. (2017). Tumor mutational burden as an independent predictor of response to immunotherapy in diverse cancers. Molecular Cancer Therapeutics 16: 2598–2608. https://doi.org/10.1158/1535-7163.MCT-17-0386 [Google Scholar] [PubMed] [CrossRef]
Hanahan D (2022). Hallmarks of cancer: New dimensions. Cancer Discovery 12: 31–46. https://doi.org/10.1158/2159-8290.CD-21-1059 [Google Scholar] [PubMed] [CrossRef]
Hayes J, Peruzzi PP, Lawler S (2014). MicroRNAs in cancer: Biomarkers, functions and therapy. Trends in Molecular Medicine 20: 460–469. https://doi.org/10.1016/j.molmed.2014.06.005 [Google Scholar] [PubMed] [CrossRef]
Heeke S, Hofman P (2018). Tumor mutational burden assessment as a predictive biomarker for immunotherapy in lung cancer patients: Getting ready for prime-time or not? Translational Lung Cancer Research 7: 631–638. https://doi.org/10.21037/tlcr.2018.08.04 [Google Scholar] [PubMed] [CrossRef]
Hellmann MD, Callahan MK, Awad MM, Calvo E, Ascierto PA et al. (2018a). Tumor mutational burden and efficacy of nivolumab monotherapy and in combination with ipilimumab in small-cell lung cancer. Cancer Cell 33: 853–861.e4. https://doi.org/10.1016/j.ccell.2018.04.001 [Google Scholar] [PubMed] [CrossRef]
Hellmann MD, Ciuleanu TE, Pluzanski A, Lee JS, Otterson GA et al. (2018b). Nivolumab plus ipilimumab in lung cancer with a high tumor mutational burden. The New England Journal of Medicine 378: 2093–2104. https://doi.org/10.1056/NEJMoa1801946 [Google Scholar] [PubMed] [CrossRef]
Horn L, Spigel DR, Vokes EE, Holgado E, Ready N et al. (2017). Nivolumab versus docetaxel in previously treated patients with advanced non-small-cell lung cancer: Two-year outcomes from two randomized, open-label, phase III trials (CheckMate 017 and CheckMate 057). Journal of Clinical Oncology 35: 3924–3933. https://doi.org/10.1200/JCO.2017.74.3062 [Google Scholar] [PubMed] [CrossRef]
Koeppel F, Blanchard S, Jovelet C, Genin B, Marcaillou C et al. (2017). Whole exome sequencing for determination of tumor mutation load in liquid biopsy from advanced cancer patients. PLoS One 12: e0188174. https://doi.org/10.1371/journal.pone.0188174 [Google Scholar] [PubMed] [CrossRef]
Konstantinopoulos PA, Luo W, Liu JF, Gulhan DC, Krasner C et al. (2019). Phase II study of avelumab in patients with mismatch repair deficient and mismatch repair proficient recurrent/persistent endometrial cancer. Journal of Clinical Oncology 37: 2786–2794. https://doi.org/10.1200/JCO.19.01021 [Google Scholar] [PubMed] [CrossRef]
Lan J, Sun L, Xu F, Liu L, Hu FQ et al. (2019). M2 macrophage-derived exosomes promote cell migration and invasion in colon cancer. Cancer Research 79: 146–158. https://doi.org/10.1158/0008-5472.CAN-18-0014 [Google Scholar] [PubMed] [CrossRef]
Lortet-Tieulent J, Ferlay J, Bray F, Jemal A (2018). International patterns and trends in endometrial cancer incidence, 1978–2013. Journal of the National Cancer Institute 110: 354–361. https://doi.org/10.1093/jnci/djx214 [Google Scholar] [PubMed] [CrossRef]
Mehta A, Baltimore D (2016). MicroRNAs as regulatory elements in immune system logic. Nature Reviews Immunology 16: 279–294. https://doi.org/10.1038/nri.2016.40 [Google Scholar] [PubMed] [CrossRef]
Min SK, Jung SY, Kang HK, Park SA, Lee JH et al. (2017). Functional diversity of miR-146a-5p and TRAF6 in normal and oral cancer cells. International Journal Oncology 51: 1541–1552. https://doi.org/10.3892/ijo.2017.4124 [Google Scholar] [PubMed] [CrossRef]
Neagoe BL, Monroig PC, Pasculli B, Calin GA (2014). MicroRNAome genome: A treasure for cancer diagnosis and therapy. CA: A Cancer Journal for Clinicians 64: 311–336. https://doi.org/10.3322/caac.21244 [Google Scholar] [PubMed] [CrossRef]
Ott PA, Bang YJ, Berton-Rigaud D, Elez E, Pishvaianet MJ et al. (2017). Safety and antitumor activity of pembrolizumab in advanced programmed death ligand 1-positive endometrial cancer: Results from the KEYNOTE-028 study. Journal of Clinical Oncology 35: 2535–2541. https://doi.org/10.1200/JCO.2017.72.5952 [Google Scholar] [PubMed] [CrossRef]
Peng XX, Yu R, Wu X, Wu SY, Pi C et al. (2020). Correlation of plasma exosomal microRNAs with the efficacy of immunotherapy in EGFR/ALK wild-type advanced non-small cell lung cancer. Journal for Immunotherapy of Cancer 8: e000376. https://doi.org/10.1136/jitc-2019-000376 [Google Scholar] [PubMed] [CrossRef]
Ready N, Hellmann MD, Awad MM, Otterson GA, Gutierrez M et al. (2019). First-line nivolumab plus ipilimumab in advanced non-small-cell lung cancer (CheckMate 568Outcomes by programmed death ligand 1 and tumor mutational burden as biomarkers. Journal of Clinical Oncology 37: 992–1000. https://doi.org/10.1200/JCO.18.01042 [Google Scholar] [PubMed] [CrossRef]
Ren D, Yang Q, Dai Y, Guo W, Du H et al. (2017). Oncogenic miR-210-3p promotes prostate cancer cell EMT and bone metastasis via NF-κB signaling pathway. Molecular Cancer 16: 117. https://doi.org/10.1186/s12943-017-0688-6 [Google Scholar] [PubMed] [CrossRef]
Ritchie ME, Phipson B, Wu D, Hu YF, Law CW et al. (2015). Limma powers differential expression analyses for RNA-sequencing and microarray studies. Nucleic Acids Research 43: e47. https://doi.org/10.1093/nar/gkv007 [Google Scholar] [PubMed] [CrossRef]
Robin X, Turck N, Hainard A, Tiberti N, Lisacek F et al. (2011). pROC: An open-source package for R and S+ to analyze and compare ROC curves. BMC Bioinformatics 12: 77. https://doi.org/10.1186/1471-2105-12-77 [Google Scholar] [PubMed] [CrossRef]
Rutgers JK (2015). Update on pathology, staging and molecular pathology of endometrial (uterine corpus) adenocarcinoma. Future Oncology 11: 3207–3218. https://doi.org/10.2217/fon.15.262 [Google Scholar] [PubMed] [CrossRef]
Santin AD, Bellone S, Buza N, Choi J, Schwartz PE et al. (2016). Regression of chemotherapy-resistant polymerase epsilon (POLE) ultra-mutated and MSH6 hyper-mutated endometrial tumors with nivolumab. Clinical Cancer Research 22: 5682–5687. https://doi.org/10.1158/1078-0432.CCR-16-1031 [Google Scholar] [PubMed] [CrossRef]
Schumacher TN, Schreiber RD (2015). Neoantigens in cancer immunotherapy. Science 348: 69–74. https://doi.org/10.1126/science.aaa4971 [Google Scholar] [PubMed] [CrossRef]
Sheikh MA, Althouse AD, Freese KE, Soisson S, Edwards RP et al. (2014). USA endometrial cancer projections to 2030: Should we be concerned? Future Oncology 10: 2561–2568. https://doi.org/10.2217/fon.14.192 [Google Scholar] [PubMed] [CrossRef]
Siegel RL, Miller KD, Fuchs HE, Jemal A (2022). Cancer statistics, 2022. CA: A Cancer Journal for Clinicians 72: 7–33. https://doi.org/10.3322/caac.21708 [Google Scholar] [PubMed] [CrossRef]
Vlachos IS, Zagganas K, Paraskevopoulou MD, Georgakilas G, Karagkouniet D et al. (2015). DIANA-miRPath v3.0: Deciphering microRNA function with experimental support. Nucleic Acids Research 43: W460–W466. https://doi.org/10.1093/nar/gkv403 [Google Scholar] [PubMed] [CrossRef]
Wu TT, Chen YF, Hastie T, Sobel E, Lange K (2009). Genome-wide association analysis by lasso penalized logistic regression. Bioinformatics 25: 714–721. https://doi.org/10.1093/bioinformatics/btp041 [Google Scholar] [PubMed] [CrossRef]
Yuan J, Hegde PS, Clynes R, Foukas PG, Harari A et al. (2016). Novel technologies and emerging biomarkers for personalized cancer immunotherapy. Journal for Immunotherapy of Cancer 4: 3. https://doi.org/10.1186/s40425-016-0107-3 [Google Scholar] [PubMed] [CrossRef]
Cite This Article
 Copyright © 2023 The Author(s). Published by Tech Science Press.
This work is licensed under a Creative Commons Attribution 4.0 International License , which permits unrestricted use, distribution, and reproduction in any medium, provided the original work is properly cited.
 Downloads
 Citation Tools