
 Submit a Paper
 Propose a Special lssue
 Open Access
ARTICLE

Silencing ribosomal protein L4 enhances the inhibitory effects of triptolide on non-small cell lung cancer cells by disrupting the mouse double minute 2 protein–P53 tumor suppressor pathway
1 School of Medical Technology and Information Engineering, Zhejiang Chinese Medical University, Hangzhou, 310053, China
2 Zhejiang Chinese Medical University, Hangzhou, 310053, China
3 Department of Clinical Laboratory, Key Laboratory of Cancer Prevention and Therapy Combining Traditional Chinese and Western Medicine of Zhejiang Province, Zhejiang Academy of Traditional Chinese Medicine, Tongde Hospital of Zhejiang Province, Hangzhou, 310012, China
* Corresponding Authors: WEI WANG. Email: ; JUAN WANG. Email:
# Contributed equally
(This article belongs to the Special Issue: Herbal Active Ingredients: Potential for the Prevention and Treatment of Cancer)
BIOCELL 2023, 47(9), 2009-2026. https://doi.org/10.32604/biocell.2023.029269
Received 10 February 2023; Accepted 08 May 2023; Issue published 28 September 2023
 View Full Text
 Download PDF
Abstract
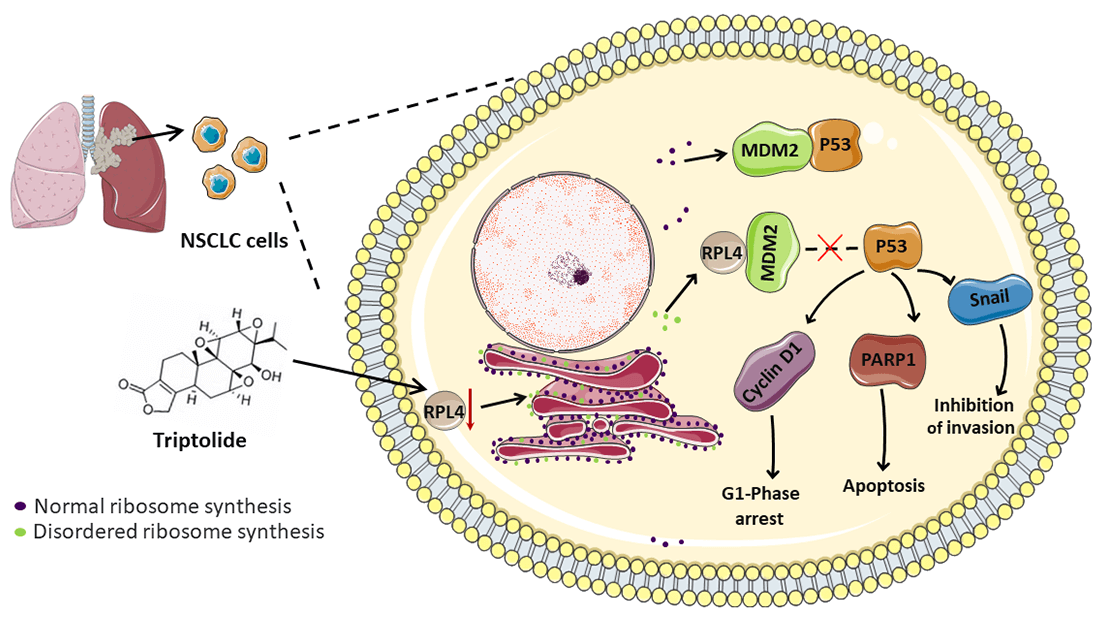
Non-small cell lung cancer (NSCLC) is a malignant tumor with high incidence worldwide. Triptolide (TP), extracted from Tripterygium wilfordii Hook F, exhibits potent broad-spectrum antitumor activity. Although some mechanisms through which TP inhibits NSCLC are well understood, those that involve ribosomal proteins remain yet to be understood. In this study, the transcriptome and proteome were integrated and analyzed. Our data indicated ribosomal protein L4 (RPL4) to be a core hub protein in the protein-protein interaction network. RPL4 is overexpressed in NSCLC tissues and cells. Transfection with siRPL4 or TP treatment alone arrested the cell cycle in the G1 phase, induced cell apoptosis, and repressed cell invasion. Compared to treating cells with TP alone or siRPL4, treating them with siRPL4–TP enhanced the inhibition of NSCLC cells. Reduced RPL4 expression reinforced the inhibitory effects of TP on NSCLC cells by disrupting the MDM2-P53 pathway and by altering the expression of PARP1/Snail/cyclin D1. In vivo assays verified that TP induced cell apoptosis and reduced RPL4 expression in xenografts. These findings provide clues to facilitate the development of effective TP-based therapeutic strategies to kill NSCLC cells.Graphic Abstract
Keywords
Supplementary Material
Supplementary Material FileLung carcinoma is a highly prevalent and fatal cancer; the proportion of non-small cell lung cancer (NSCLC) is about 85%. The application of radiotherapy and chemotherapy for treating NSCLC is not entirely effective, and the effects of immunotherapy remain to be comprehensively defined (Thai et al., 2021); therefore, it is urgent to explore new strategies and alternative treatment protocols. Pharmacological compounds derived from Chinese herbal medicines have received substantial attention in recent years; some of them have exhibited potent application prospects in suppressing NSCLC, like triptolide (TP) (Wang et al., 2020), forskolin (Salzillo et al., 2023), thevebioside (Yao et al., 2020), thymol (Elbe et al., 2020), sesamin (Yang et al., 2020), and so on (Huang et al., 2022).
TP, a lactone compound isolated from the traditional medicinal plant Tripterygium wilfordii Hook F (Kupchan et al., 1972), has been clinically used to treat various conditions, including systemic lupus erythematosus, rheumatoid arthritis, psoriasis, and nephritis (Liu, 2011). Over the past few years, TP has been found to effectively impede NSCLC cell growth by increasing apoptosis and arresting the cell cycle (Yan and Sun, 2018; Wei et al., 2019; Wang et al., 2020). It mainly regulates nuclear factor-κB, P53, mitogen-activated protein kinases, miRNAs, and other conventional signaling pathways (Noel et al., 2019). TP was reported to repress β-catenin expression for the inhibition of the epithelial-mesenchymal transition (EMT) in NSCLC cells (Deng et al., 2021), reinforcing the sensitivity of NSCLC cells to chemotherapeutic agents by suppressing nuclear erythroid 2-related factor 2–antioxidant response element activity (Zhu et al., 2018). Collectively, these results indicate the effectiveness of TP in treating NSCLC. The mechanisms via which TP inhibits NSCLC cells are well-understood; however, those through which TP inhibits NSCLC via ribosomal proteins (RPs) remain to be reported.
Uncontrolled cell growth is a vital feature of tumors (Zhang et al., 2020); ribosomal biosynthesis is hyperactivated to support protein production, which is pivotal for incessant cancer cell growth (Nait et al., 2020). Ribosomal synthesis, a highly coordinated and energy-consuming process, is sensitive to cellular stressors. Its disruption by cellular stressors leads to the production of ribosome-free RPs, which no longer participate in ribosomal synthesis; rather, they are translocated to the nucleoplasm and cytoplasm (Penzo et al., 2019). Some ribosome-free RPs control the P53-mouse double minute-2 homolog (MDM2) pathway, whereas some function via other distinct P53-independent pathways (Russo and Russo, 2017). They eventually participate in extra-ribosomal functions, such as regulating apoptosis, cell cycle, invasion, and autophagy (Molavi et al., 2019). We previously reported that TP acts as a cellular stressor to disrupt ribosomal synthesis (Wang et al., 2020); however, whether it affects the expression of RPs remains unknown. Moreover, the role of RPs in the inhibitory effects of TP on NSCLC is unclear.
Advancements in transcriptomics and proteomics have revolutionized the investigation of mechanisms underlying disease pathogenesis and led to improvements in drug therapy. Vispé et al. (2009) reported that TP is an RNA polymerase I and II-dependent inhibitor, rapidly depleting short-lived mRNA, including oncogenes, cell cycle regulators, and transcription factors. Furthermore, Li et al. (2018) performed an iTRAQ-based proteomic analysis to report that TP exerts antitumor activity on A549 cells by dysregulating tumor-related protein expression. However, an integrated analysis of transcriptome and proteome is needed to investigate the mechanisms underlying the inhibitory effects of TP on NSCLC cells.
Herein we performed integrated transcriptomic and proteomic analyses to identify critical candidate genes implicated in the inhibitory effects of TP on NSCLC cells. We found that RPL4 was present at the core of the integrated protein-protein interaction (PPI) network. Next, we demonstrated that the knockdown of RPL4 arrested the cell cycle in the G1 phase, suppressed cell invasion, and induced cell apoptosis for the first time. And reduced RPL4 expression reinforced the inhibitory effects of TP on NSCLC cells by disrupting the MDM2-P53 pathway and by altering the expression of PARP1/Snail/cyclin D1. In vivo, assays verified that TP reduced RPL4 expression. Our results provide pertinent molecular mechanisms of TP and should facilitate the development of new, effective therapeutic strategies in NSCLC cells.
We used a previously published dataset (GSE16760) for validation (Vispé et al., 2009), a part of the Gene Expression Omnibus (GEO) database. Cells were treated with 0.05, 0.15, and 0.45 μM TP for 4 h. Differentially expressed proteins were then identified (Li et al., 2018); briefly, iTRAQ-based proteomics assays were performed to analyze control cells and cells treated with 12.5, 50, and 200 ng/mL TP.
Original expression profile data were downloaded as a txt file. The Affy package (v1.50.0, http://www.bioconductor.org/packages/release/bioc/html/affy.html) in Rstudio (v1.1.414) was used to read and convert original data. Data were standardized using the robust multi-array average method, including normalization, background correction, and expression calculation (Bolstad et al., 2003). The mRNA symbol was obtained based on gene annotation according to the mRNA ID and probe provided by the GPL21047-33650 platform. If different probes mapped to the same mRNA, we calculated the mean value for different probes, which represented the final mRNA expression value.
Screening differentially expressed mRNAs
P and log2FC values were calculated using the limma package (v3.26.9) in R3.4.1 (http://bioconductor.org/packages/release/bioc/html/limma.html). Significant differences were represented by p < 0.05 and |log2FC| > 0.585. From the normalized mRNA expression profile, differentially expressed mRNAs were subsequently screened; expression values were then clustered based on Euclidean distance using the pheatmap package (v1.0.8) (https://cran.r-project.org/web/packages/pheatmap), and a heatmap and volcano plot were plotted to visualize the expression data.
Functional enrichment analysis of differentially expressed mRNAs
The R package clusterProfiler (v3.2.11, http://www.bioconductor.org/packages/release/bioc/html/clusterProfiler.html) was used for the Kyoto Encyclopedia of Genes and Genomes (KEGG) pathway and gene ontology (GO) enrichment analyses of differentially expressed mRNAs. GO and KEGG pathway enrichment data were depicted in the form of a bubble chart and histograms, respectively. p < 0.05 indicated statistically significant differences.
Protein-protein interaction network construction
PPI analysis of differentially expressed proteins was performed using STRING (v10.0, http://www.string-db.org/). Briefly, required confidence (combined score) >0.4 was taken as the threshold for PPI analysis, and pertinent tsv files were downloaded. PPI network pairs were used to construct a PPI network in Cytoscape. The topological properties of the network node were analyzed by the CytoNCA plug-in (v2.1.6, http://apps.cytoscape.org/apps/cytonca). The parameter was set to without weight, and the results included, for example, betweenness centrality, closeness centrality, and degree centrality. Hub proteins in the PPI network were identified via score ranking (He and Zhang, 2006).
Ribosomal protein L4 expression in lung adenocarcinoma (LUAD) tissues
The TIMER database (http://timer.comp-genomics.org/) was used to analyze the expression of RPL4 in varied cancers. The expression of RPL4 between the LUAD primary tumor and adjacent normal tissues was analyzed using the GSCA database (http://bioinfo.life.hust.edu.cn/GSCA/#/) based on the TCGA-LUAD cohort. Kaplan-Meier Plotter database (http://kmplot.com/analysis/) was utilized to obtain the K-M curve of RPL4 in LUAD; the selected gene chip probe was at 211710 x.
Cell culture and siRNA transfection
A549 (cat no. CCL-185, ATCC, Manassas, VA, USA), PC9 (cat no. SCSP-5085, Cell Bank of the Chinese Academy of Sciences, Shanghai, China), MRC-5(cat no. CCL-171, ATCC) and H1299 (cat no. CRL-5803, ATCC) cells were prepared at 37°C in DMEM supplemented with 10% fetal bovine serum (Life Technologies, Carlsbad, CA, USA) and 1% penicillin-streptomycin (Life Technologies). RPL4 siRNA was obtained from Shanghai GenePharma Biotechnology Co., Ltd. (China). SiRNA sequences are listed in Suppl. Table S1. siRNA and Lipofectamine 3000 were mixed and incubated at room temperature for 15 min and then added dropwise to A549 and PC9 cells. The medium was replaced at 5 h post‑transfection.
The prepared cells were treated with 1 mL of Trizol. Tubes were shaken vigorously and left to stand for 5 min at room temperature, centrifugated at 12,000 × g, and 4°C for 15 min. The upper (aqueous) layer was pipetted into the same volume of isopropanol. The tubes were shaken and left to stand at −20°C for 30 min, centrifugated at 12,000 × g. The supernatant was removed, and 75% pre-cooled ethanol was used to wash the RNA pellet. Diethyl pyrocarbonate water was used to dissolve the RNA pellet.
Quantitative polymerase chain reaction
Reverse transcription was conducted using 200 ng RNA (Takara Bio, Inc., Otsu, Japan). RPL4 was quantitatively detected in a 50-μL reaction system, which comprised primers, a template, and SYBR green. The cycling conditions were first 95°C for 1 min, 42 cycles of 95°C for 15 s, 56°C for 25 s, and 72°C for 30 s. Primers were as follows: RPL4, forward 5′-GCCTGCTGTATTCAAGGCTC-3′ and reverse 5′-GGTTGGTGCAAACATTCGGC-3′; GAPDH, forward 5′-GGAGTCCACTGGCG TCTTCA-3′ and reverse 5′-GTCATGAGTCCTTCCACGATACC-3′.
TP (≥98%) was provided by Sigma-Aldrich (Merck KGaA, Darmstadt, Germany), dissolved in DMSO, aliquoted, and stored at −80°C. When needed, 100 ng/mL of stored TP was diluted to indicated concentrations and added to culture media.
Half maximal inhibitory concentration (IC50)
A549 and PC9 cells were treated with increasing concentrations of TP (0, 5, 10, 20, 40, and 80 ng/mL) or TP (0, 1.25, 2.5, 5, 10, 20, 40, and 80 ng/mL) for 36 h, respectively. TP-treated cells were treated with CCK-8 reagent (Dojindo Molecular Technologies, Inc., Kumamoto, Japan) for 3 h. Subsequently, absorbance was measured at 490 nm, and cell viability was evaluated by subtracting the background absorbance of the control from the actual absorbance value. Each experimental condition was determined from three duplicates.
Apoptosis, cell cycle, and proliferation
Cells were transfected with the target or siNC and treated with indicated concentrations of TP. To evaluate cell apoptosis, EDTA-free trypsin was used to collect the adherent cells; the cell mass was washed with precooled PBS and incubated at room temperature with 10 µL propidium iodide (20 µg/mL) and 5 µL Annexin V-FITC (Dojindo Molecular Technologies, Inc.) for 15 min in the dark. Finally, they were analyzed on a FACS Canto II instrument (BD Biosciences, NJ, USA).
To evaluate the cell cycle, the prepared cells were fixed with absolute ethanol, washed with precooled PBS, and incubated with 5 mg/mL Rnase (Dojindo Molecular Technologies, Inc.) at 37°C for 30 min. For staining, cells were incubated at room temperature with propidium iodide for 30 min in the dark. Finally, cells were last analyzed on a FACS Canto II instrument. FlowJo software (v7.6.1, FlowJo LLC) was used to analyze flow cytometry data.
To evaluate cell proliferation, cells were cultured in 100 µL DMEM in 96-well plates and incubated with CCK-8 solution (Dojindo Molecular Technologies, Inc.) at 37°C for 3 h. Absorbance was then measured at 450 nm. Cell viability was calculated as per manufacturer instructions.
Cell invasion was evaluated by the Transwell system (Corning Inc., NY, USA) with 8.0‑µm diameter pores. Briefly, Matrigel was precoated on Transwell membranes; the upper chamber was seeded with 5 × 10⁴ cells, and to induce cell invasion, 20% fetal bovine serum‑containing medium was added into the lower chamber. Cells on the upper surface of the filter were removed with a cotton swab after 48 h of incubation, and the residual cells were fixed in 4% paraformaldehyde, stained with 0.1% crystal violet (w/v), and photographed from five randomly chosen fields under a microscope (Olympus Corp., Tokyo, Japan).
Protein was extracted from the prepared cells using enhanced RIPA lysis buffer (Beyotime Institute of Biotechnology, Shanghai, China) containing protease inhibitors. Protein concentration was determined with a BCA protein assay kit (Beyotime). Proteins (30 µg) were separated by 8% SDS‑PAGE, transferred to a nitrocellulose membrane (Millipore, Inc., MA, USA), and detected with antibodies against P53 (10442-1-AP, Proteintech Group, Inc., IL, USA), RPL4 (cat no. ab174269, Abcam, CA, USA), Snail (cat no. 13099-1-AP, Proteintech), cyclin D1 (cat no. 60186-1-Ig, Proteintech), PARP1 (cat no. 9542T, CST), and GAPDH (cat no. 2118S, CST). Secondary antibodies were then added, followed by incubation at room temperature for 2 h. Proteins were detected using enhanced chemiluminescence reagents (Amersham, NJ, USA) and analyzed using ImageJ software (v1.8.0, National Institutes of Health).
Immunoprecipitation (IP) assay
Adherent cells were collected with precooled PBS, and centrifuged at 16,000 × g for 15 min at 4°C. Cell mass was lysed by IP lysis buffer (CST). Protein concentration was determined using a BCA protein assay kit. MDM2 (cat no. 86934S, CST) antibody, 500 µL TBS–0.5% Tween 20, and 10 µL Dynabeads® protein G were mixed with 100 µg protein, followed by incubation on a rotating platform overnight at 4°C. The protein complex was then washed thrice with ice-cold TBS–0.5% Tween 20 buffer. Any residual buffer was removed using a micropipette. SDS sample buffer was used to elute antibody-protein complexes. Finally, western blotting was performed for target protein detection.
Nude mouse xenograft experiment
All the experimental animal protocols were approved by the Ethics Committee of the Tongde Hospital of Zhejiang Province.
Four-week-old male BALB/cAnNCr-nu/nu mice were provided by Sippe-Bk Lab Animal Co., Ltd. (Shanghai, China). After a week of adaptive feeding, A549 cells (5 × 10⁶) were subcutaneously injected into the underarms of the right forelimbs of BALB/cAnNCr-nu/nu nude mice (body weight, 18–22 g). All mice were kept in a clean environment at 25°C, 50% humidity, and 12 h light-dark cycle, and given free access to tap water and irradiated mouse food. The animals were randomly categorized into TP-treated and mock groups at 3 weeks after the subcutaneous injection. Mice in the TP-treated group subcutaneously received 0.5 mg/kg TP, and those in the mock group received saline injections every day for additional 3 weeks. During this period, tumor volume and body weight were observed every other day. The formula (length × width × width)/2 was used to calculate tumor volume. For euthanasia, the Guidelines for Euthanasia of Rodents Using Carbon Dioxide issued by the NIH guided protocols were followed. Briefly, animals were placed in a special transparent chamber connected to a flow controller and compressed carbon dioxide in a gas cylinder, death was further confirmed by cadaveric rigidity and cardiac arrest.
Terminal deoxynucleotidyl transferase‑mediated dUTP nick-end labeling (TUNEL) assay
Apoptotic cells were detected in xenograft tumors by TUNEL assays (Roche, Basel, Switzerland). Tumor tissues were fixed by formaldehyde, 70% alcohol, and glacial acetic acid (1:16:1) and tumor sections embedded in paraffin were dewaxed and rehydrated. The sections were subsequently incubated with dUTP and TdT (1:9) at 37°C for 2 h. Nuclei were stained with DAPI. Tumor sections were observed and under a fluorescence microscope their images were acquired. Apoptotic cells emitted green fluorescence. TUNEL-positive cells were calculated using ImageJ v1.8.0.
Paraffin‑embedded tumor sections (5 µm) were dewaxed and rehydrated, and antigen was restored at 98°C for 20 min. The sections were washed with TBS containing 0.025% Triton X‑100, blocked with 10% BSA, and incubated with primary antibodies against P53 (cat no. 10442-1-AP, Proteintech) and RPL4 (dilution 1:100, cat no. ab174269, Abcam) overnight at 4°C. Subsequently, a horseradish peroxidase-conjugated secondary antibody (cat no. 8114S, CST) was added. 3,3′-diaminobenzidine and then hematoxylin were used to stain tumor tissues. Finally, photographs (20 vision fields) were captured using a light microscope (400×).
Values represent mean ± SD. Prism 8 (GraphPad Software, LLC., CA, USA) was used to analyze statistical differences between the groups with one- or two-way ANOVA. A statistically significant value had p < 0.05.
Screening differentially expressed mRNAs
After quality control, there were 30,589 mRNAs (Suppl. Table S2). Differentially expressed mRNAs were identified by applying the following criteria: p < 0.05 and |log2FC| > 0.585. On treatment with 0.05, 0.15, and 0.45 µM TP, respectively, 295 (144 up- and 151 down-regulated, Suppl. Table S3-1), 2,217 (1,063 up- and 1,154 down-regulated, Suppl. Table S3-2), and 5,880 (2,478 up- and 3,402 down-regulated, Suppl. Table S3-3) differentially expressed mRNAs were identified. The differentially expressed mRNAs are shown with heatmaps (Fig. 1A) and volcano plots (Fig. 1B); obvious color differences indicated that the screened differentially expressed mRNAs were sample-specific.
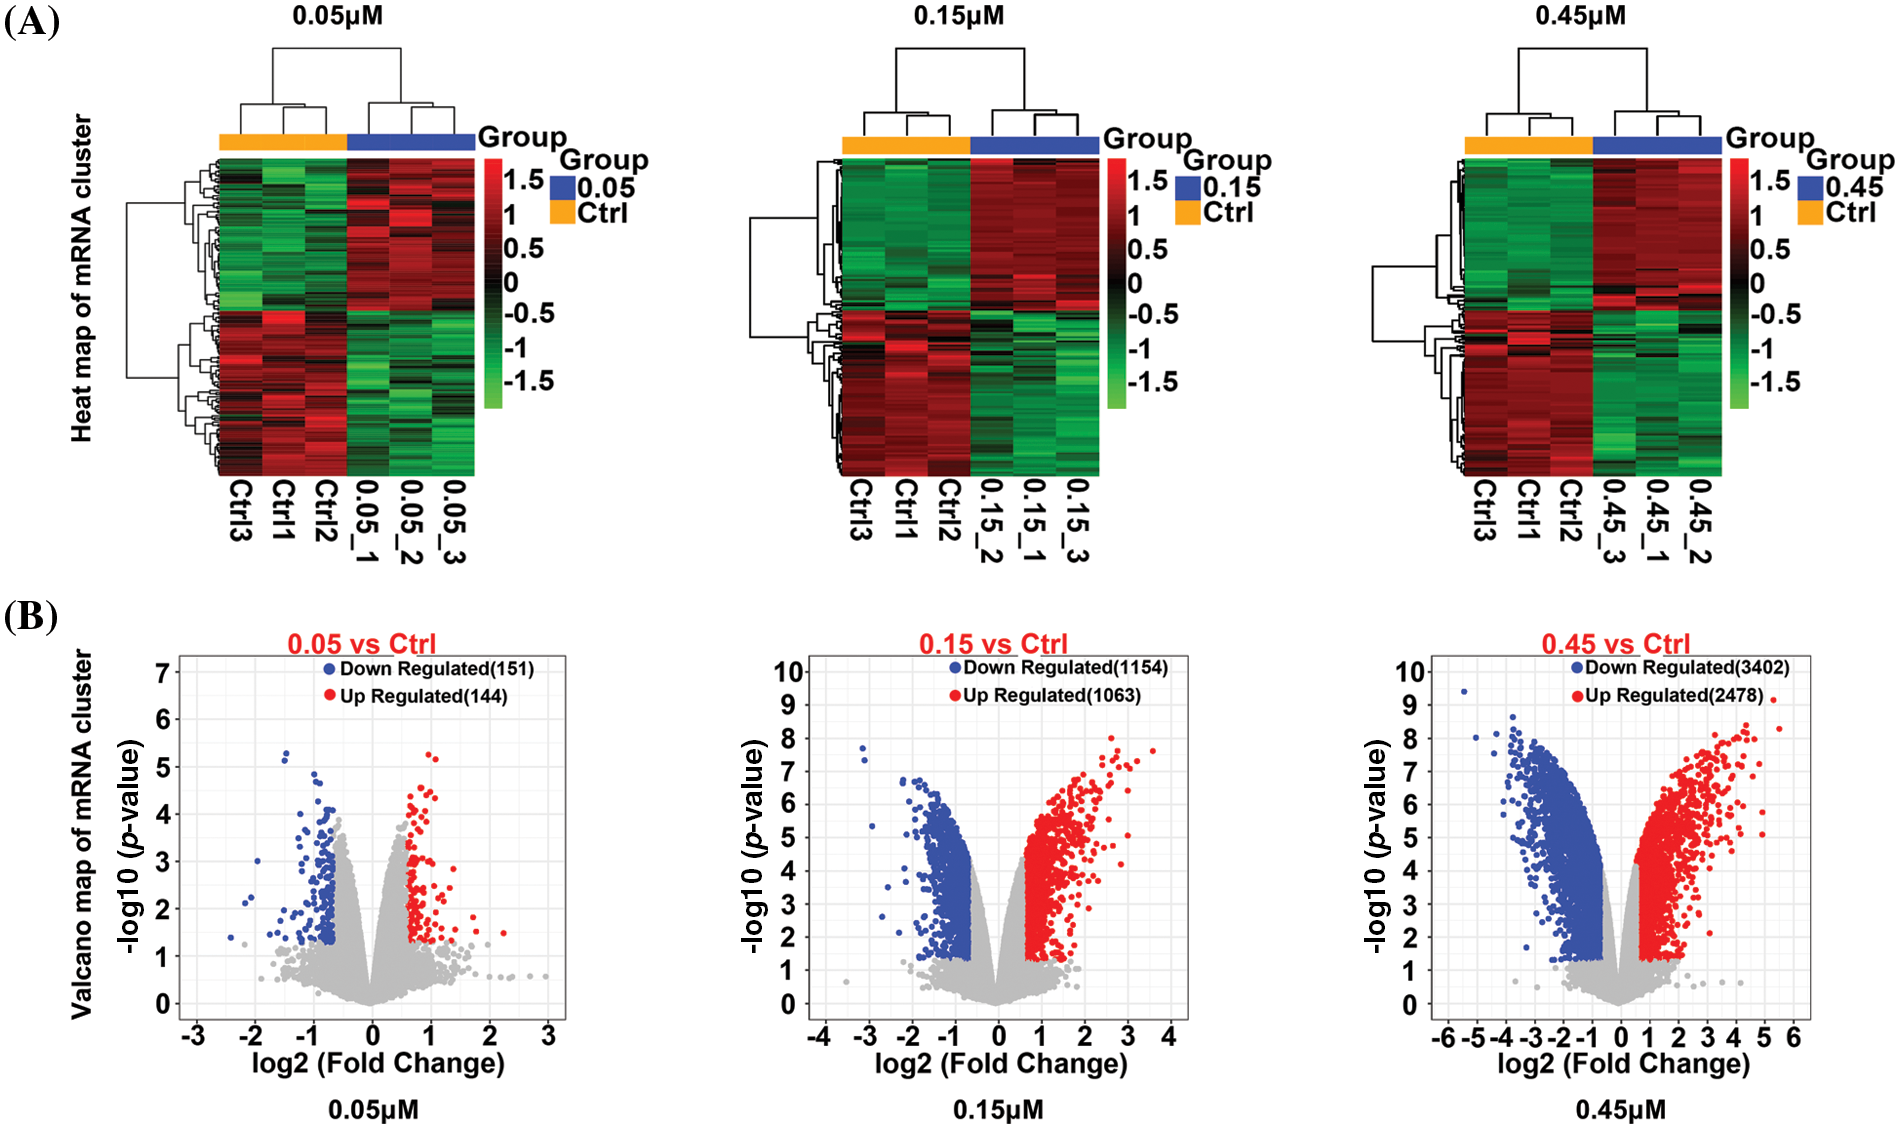
Figure 1: Heatmap (A) and a volcano plot (B) of differentially expressed mRNAs in cells treated with 0.05, 0.15, and 0.45 µM triptolide (TP).
Kyoto Encyclopedia of Genes and Genomes and Gene Ontology functional enrichment of differentially expressed mRNAs
The total differentially expressed mRNAs from 0.05, 0.15, and 0.45 µM TP-treated cells were subjected to KEGG pathway and GO enrichment analyses. KEGG pathway enrichment analysis (Fig. 2A) revealed the top 10 pathways with statistically significant differences; the analysis showed that differentially expressed mRNAs were mainly enriched in pathways related to osteoclast differentiation, TNF signaling, and interleukin-17 signaling (Suppl. Table S4). Further, GO enrichment analysis (Fig. 2B) revealed the top 10 enriched biological processes with statistically significant differences (Suppl. Table S5). Differentially expressed mRNAs were found to be predominantly associated with positive regulation of hemopoiesis and leukocyte and myeloid leukocyte differentiation.
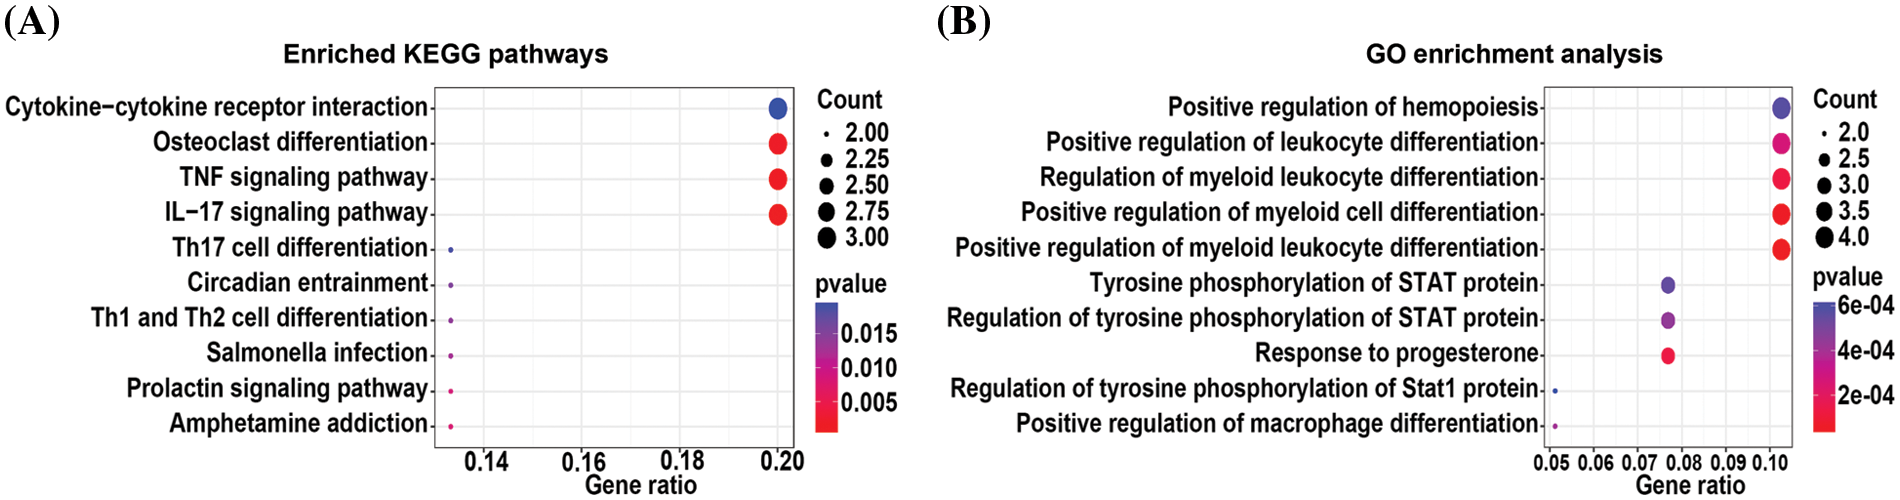
Figure 2: KEGG pathway (A) and GO (B) enrichment analysis of differentially expressed mRNAs from 0.05, 0.15, and 0.45 µM triptolide (TP)-treated cells.
Integrated protein-protein interaction analysis of differentially expressed mRNAs and proteins
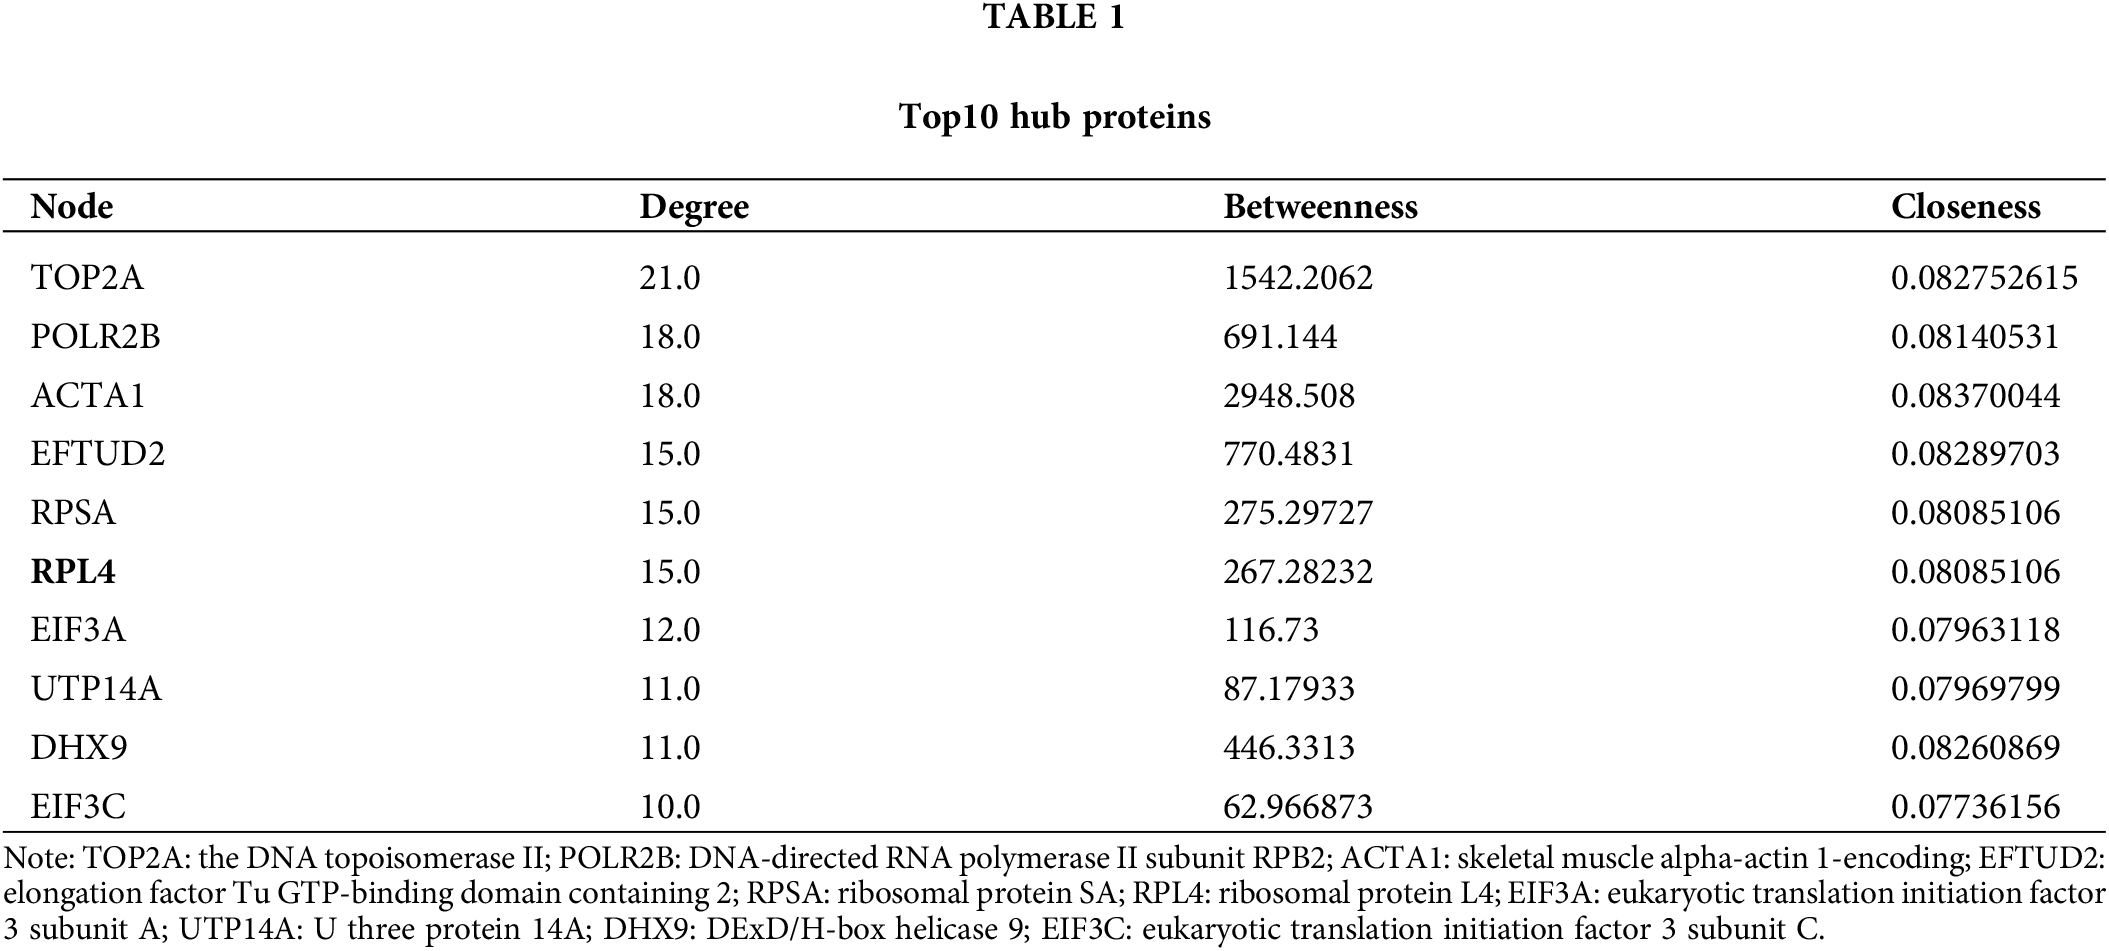
The interaction among differentially expressed proteins identified on integrated transcriptomic and proteomic analyses of TP-treated A549 cells was evaluated using PPI networks. First, we screened PPI relationship pairs in STRING to construct mRNA or protein PPI networks (Figs. 3A and 3B); subsequently, an integrated PPI network was constructed (Fig. 3C). As shown in Fig. 3A, the mRNA PPI network contained 17 nodes and 16 relationship pairs (Suppl. Table S6). PPI relationship pairs with a significant difference and high correlation were included, for example, ACTA1 and FOS, and also CX3CR1 and CXCL2. Similarly, as shown in Fig. 3B, the protein PPI network contained 70 nodes and 188 relationship pairs (Suppl. Table S7). PPI relationship pairs with a significant difference and high correlation were included, for example, NOP14 and RSL1D1 and also UTP14A and RBM19. Finally, the integrated PPI network contained 96 nodes and 232 relationship pairs (Suppl. Table S8). Differentially expressed proteins and mRNAs were found to be closely related. The top 10 hub proteins in the integrated PPI network are shown in Table 1 and Suppl. Table S9.
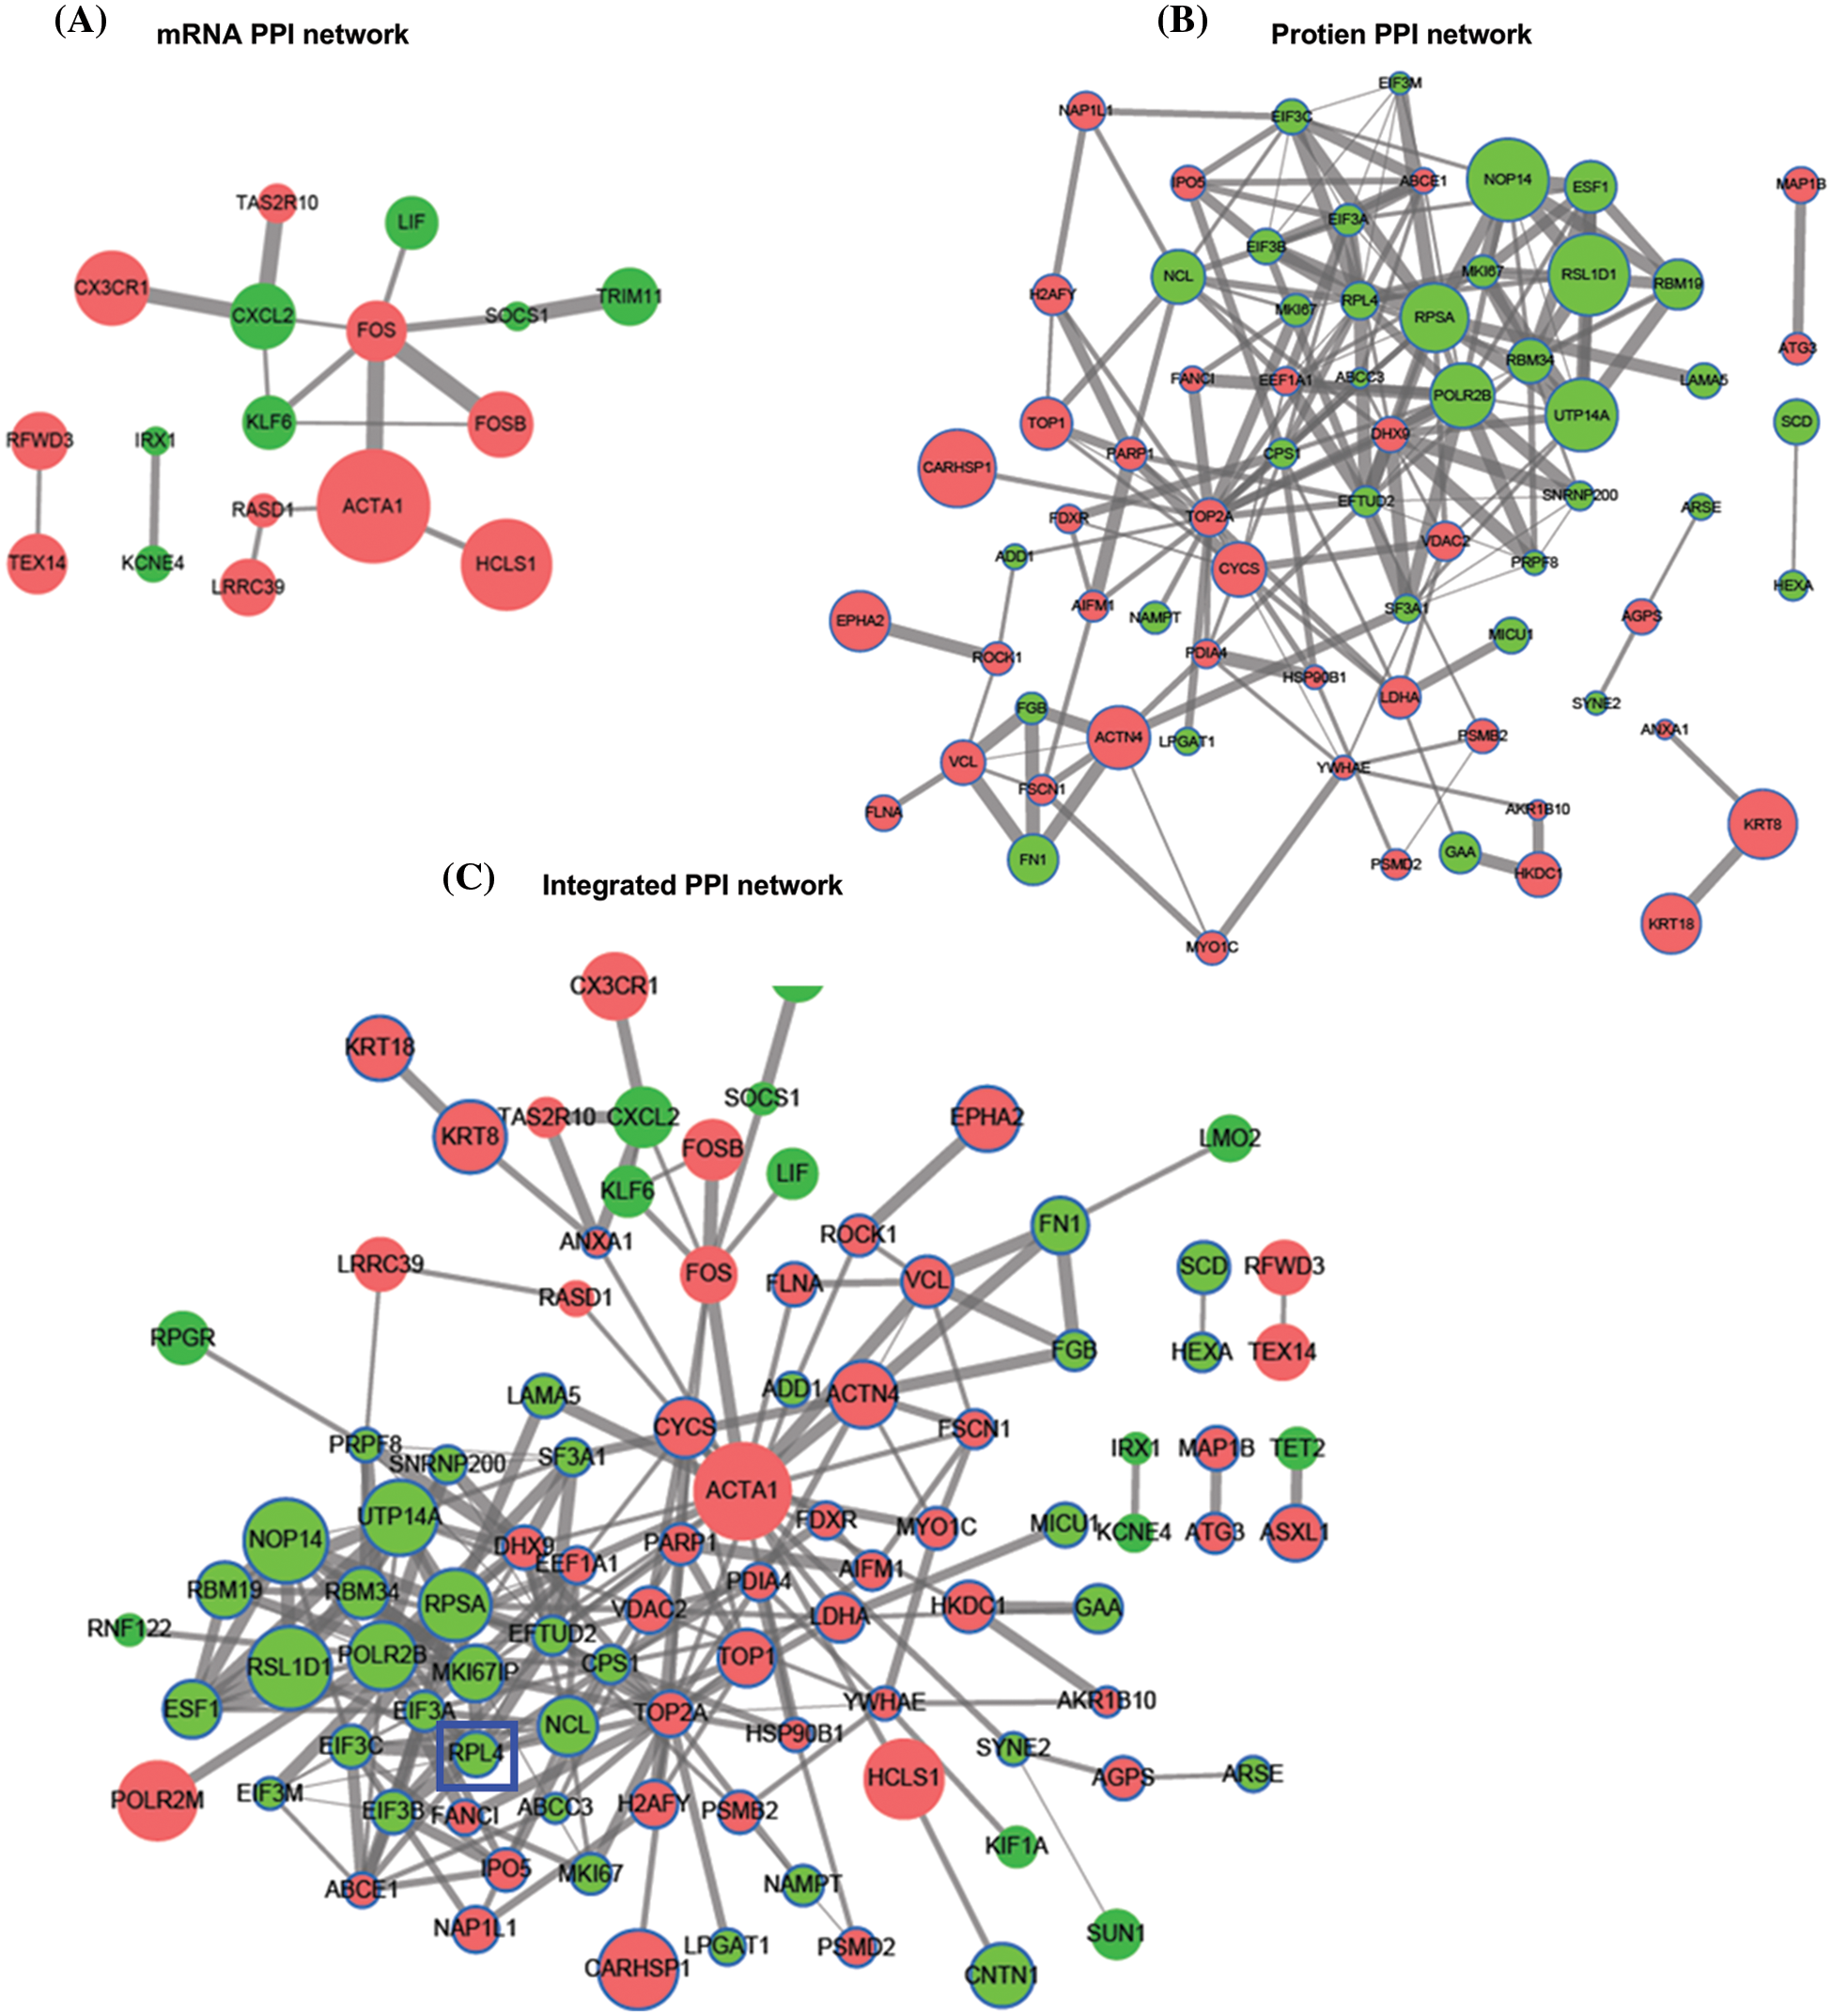
Figure 3: Protein-protein interaction (PPI) network of differentially expressed mRNAs (A) and proteins (B). Integrated PPI network of differentially expressed mRNAs and proteins (C).
Ribosomal protein L4 expression in non-small cell lung cancer tissues and cells
The RPL4 expression profiles in various human tumors were derived by using the TIMER database. We observed increased expression of RPL4 in multiple human cancer types when compared with adjacent normal tissues (Fig. 4A), including LUAD and squamous cell carcinoma. We verified this difference in LUAD primary tumor tissues by using the GSCA database (Fig. 4B). LUAD patients with higher RPL4 expression were associated with shorter overall survival based on the KMplot cohort (Fig. 4C). Further, RPL4 protein expression was confirmed to be significantly higher in NSCLC cell lines, with the highest in A549 and PC9 cells (Fig. 4D). Thus, A549 and PC9 cells were selected for further experiments. These results suggest that RPL4 is highly expressed in NSCLC and is associated with poor prognosis.
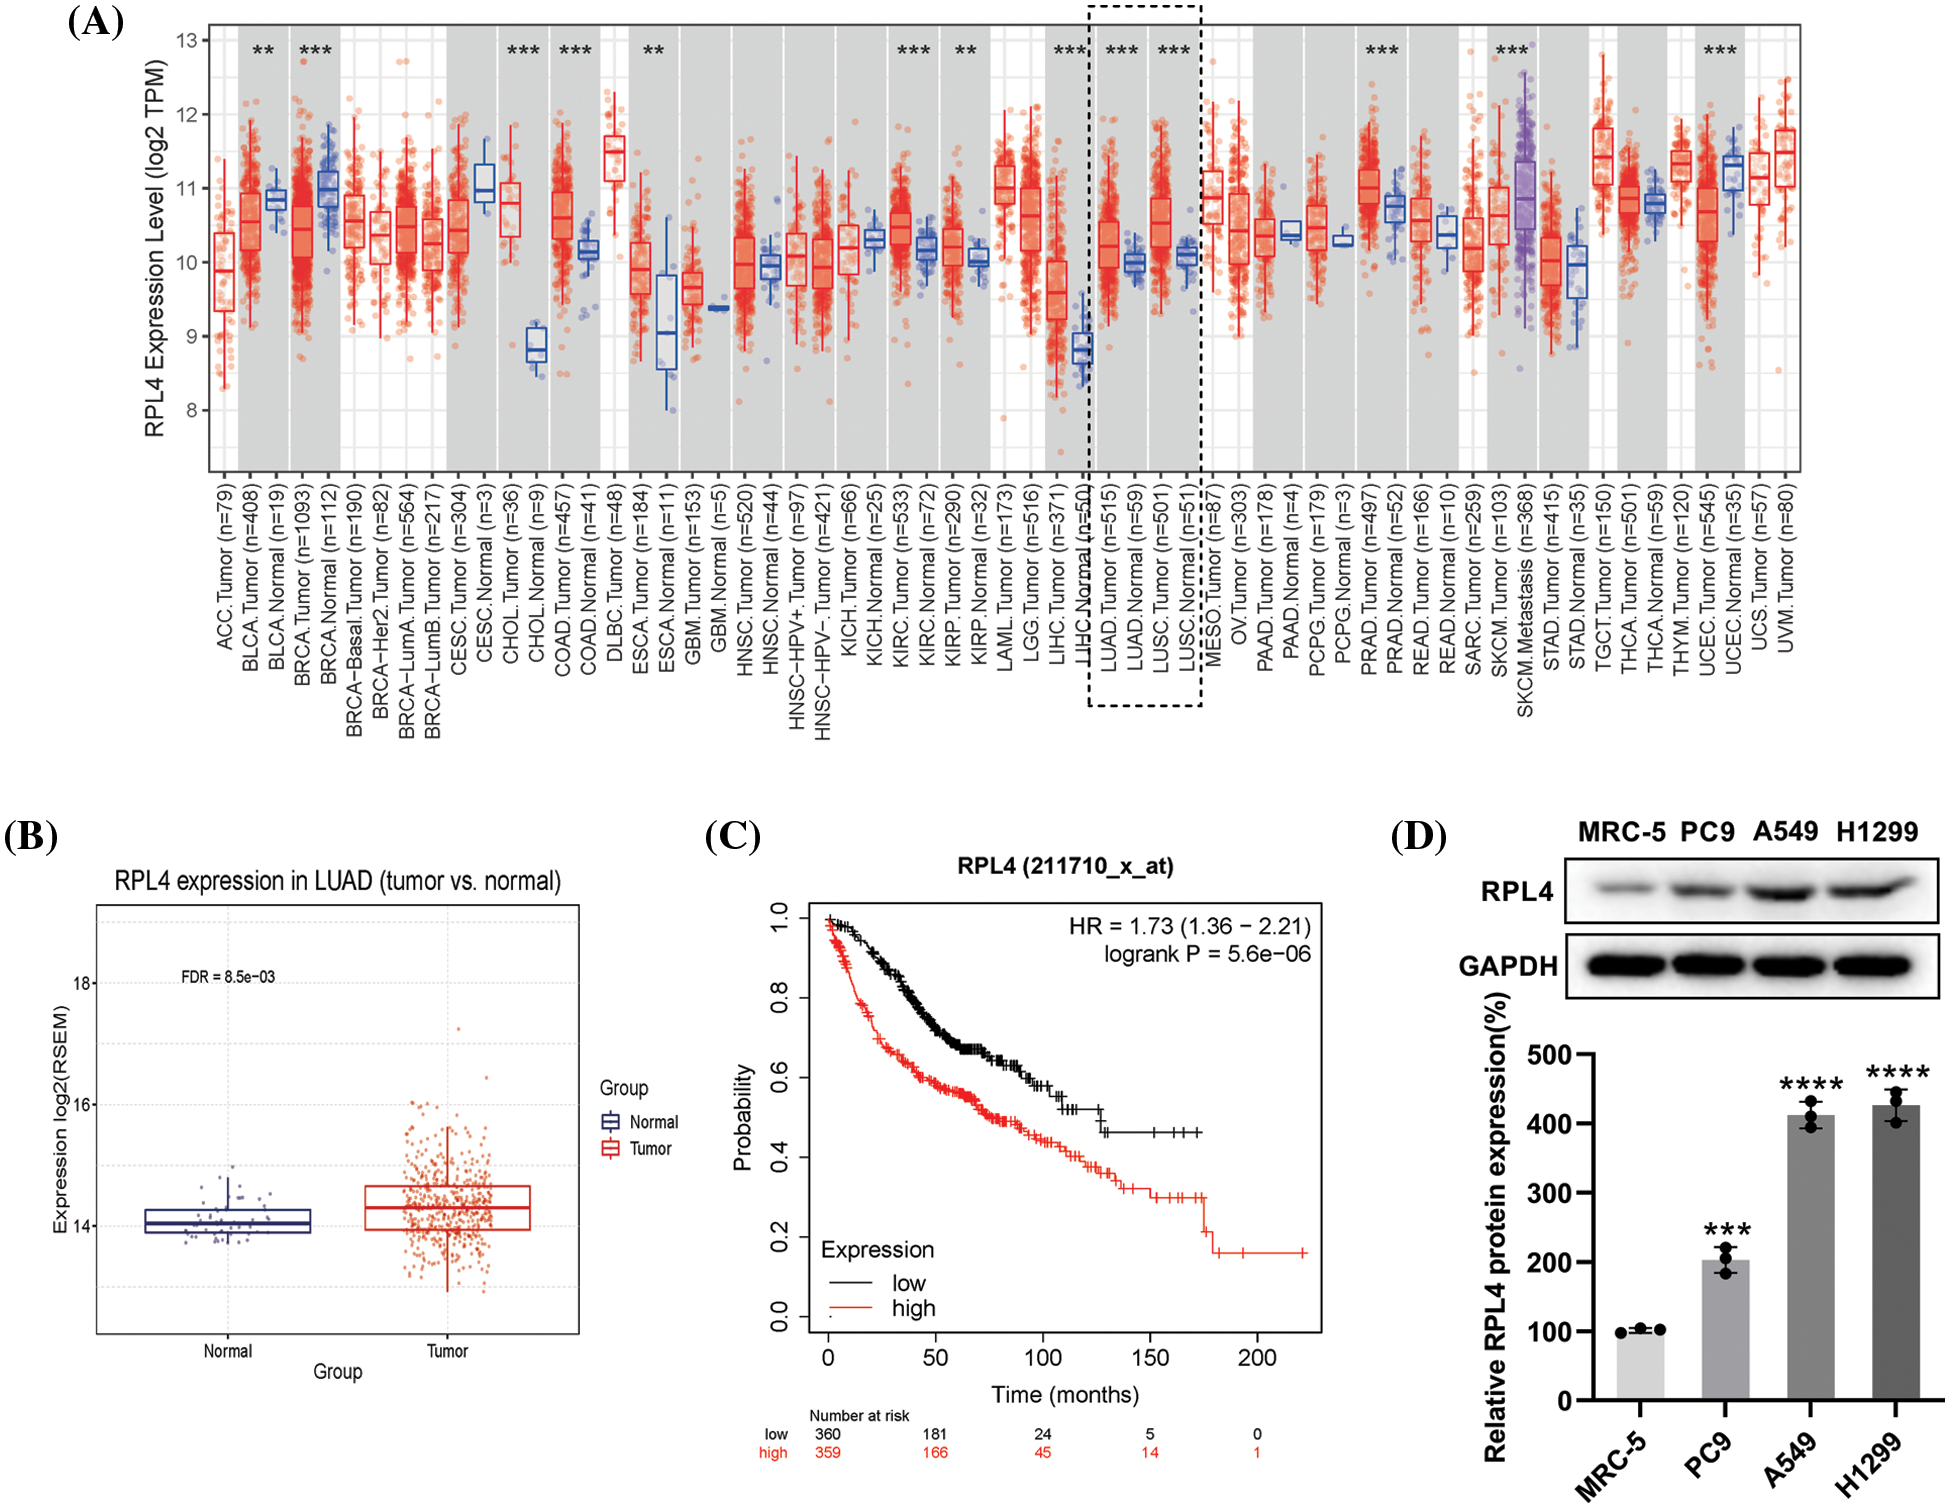
Figure 4: (A) The expression of ribosomal protein L4 (RPL4) in various human cancer types available via the TIMER database (Wilcoxon test, p < 0.001). (B) RPL4 expression is increased in primary tumor lung adenocarcinoma (LUAD) samples compared to normal samples (t-test, FDR < 0.01). (C) Kaplan–Meier curve analysis between high-RPL4 and low-RPL4 groups based on The Cancer Genome Atlas-Gene Expression Omnibus LUAD cohort (p < 0.001). (D) Comparison of the RPL4 protein levels between normal lung fibroblasts and NSCLC cell lines. Values represent mean ± SD (n = 3). ***p < 0.001, ****p < 0.0001.
Triptolide inhibits ribosomal protein L4 mRNA and protein expression
To determine the optimal concentration of TP, IC50 was calculated by the CCK-8 assay. IC50 was 38.78 ng/mL for A549 cells and 15.49 ng/mL for PC9 cells (Figs. 5A and 5B), suggesting that PC9 cells were more sensitive to TP. Integrated PPI network analysis highlighted RPL4 to be one of the hub proteins downregulated by TP. Any effect of TP on RPL4 expression was verified by measuring RPL4 mRNA and protein expression levels in PC9 and A549 cells treated with TP (5, 10, 20, 40, and 80 ng/mL) and TP (1.25, 2.5, 5, 10, 20, 40, and 80 ng/mL), respectively. TP treatment for 4 h and 8 h significantly reduced RPL4 mRNA expression levels in both A549 and PC9 cells; this reduction was enhanced on treating PC9 cells, but not A549 cells, with TP for 12 h (Figs. 5C and 5D). Further, 25 ng/mL TP could reduce RPL4 expression modestly, and this reduction was further enhanced at 50 and 100 ng/mL (Fig. 5E). In addition, 12.5 ng/mL TP modestly repressed RPL4 protein expression in PC9 cells; this reduction did not significantly intensify by increasing TP concentration gradually (Fig. 5F). These findings suggest that TP suppresses RPL4 mRNA and protein expression.
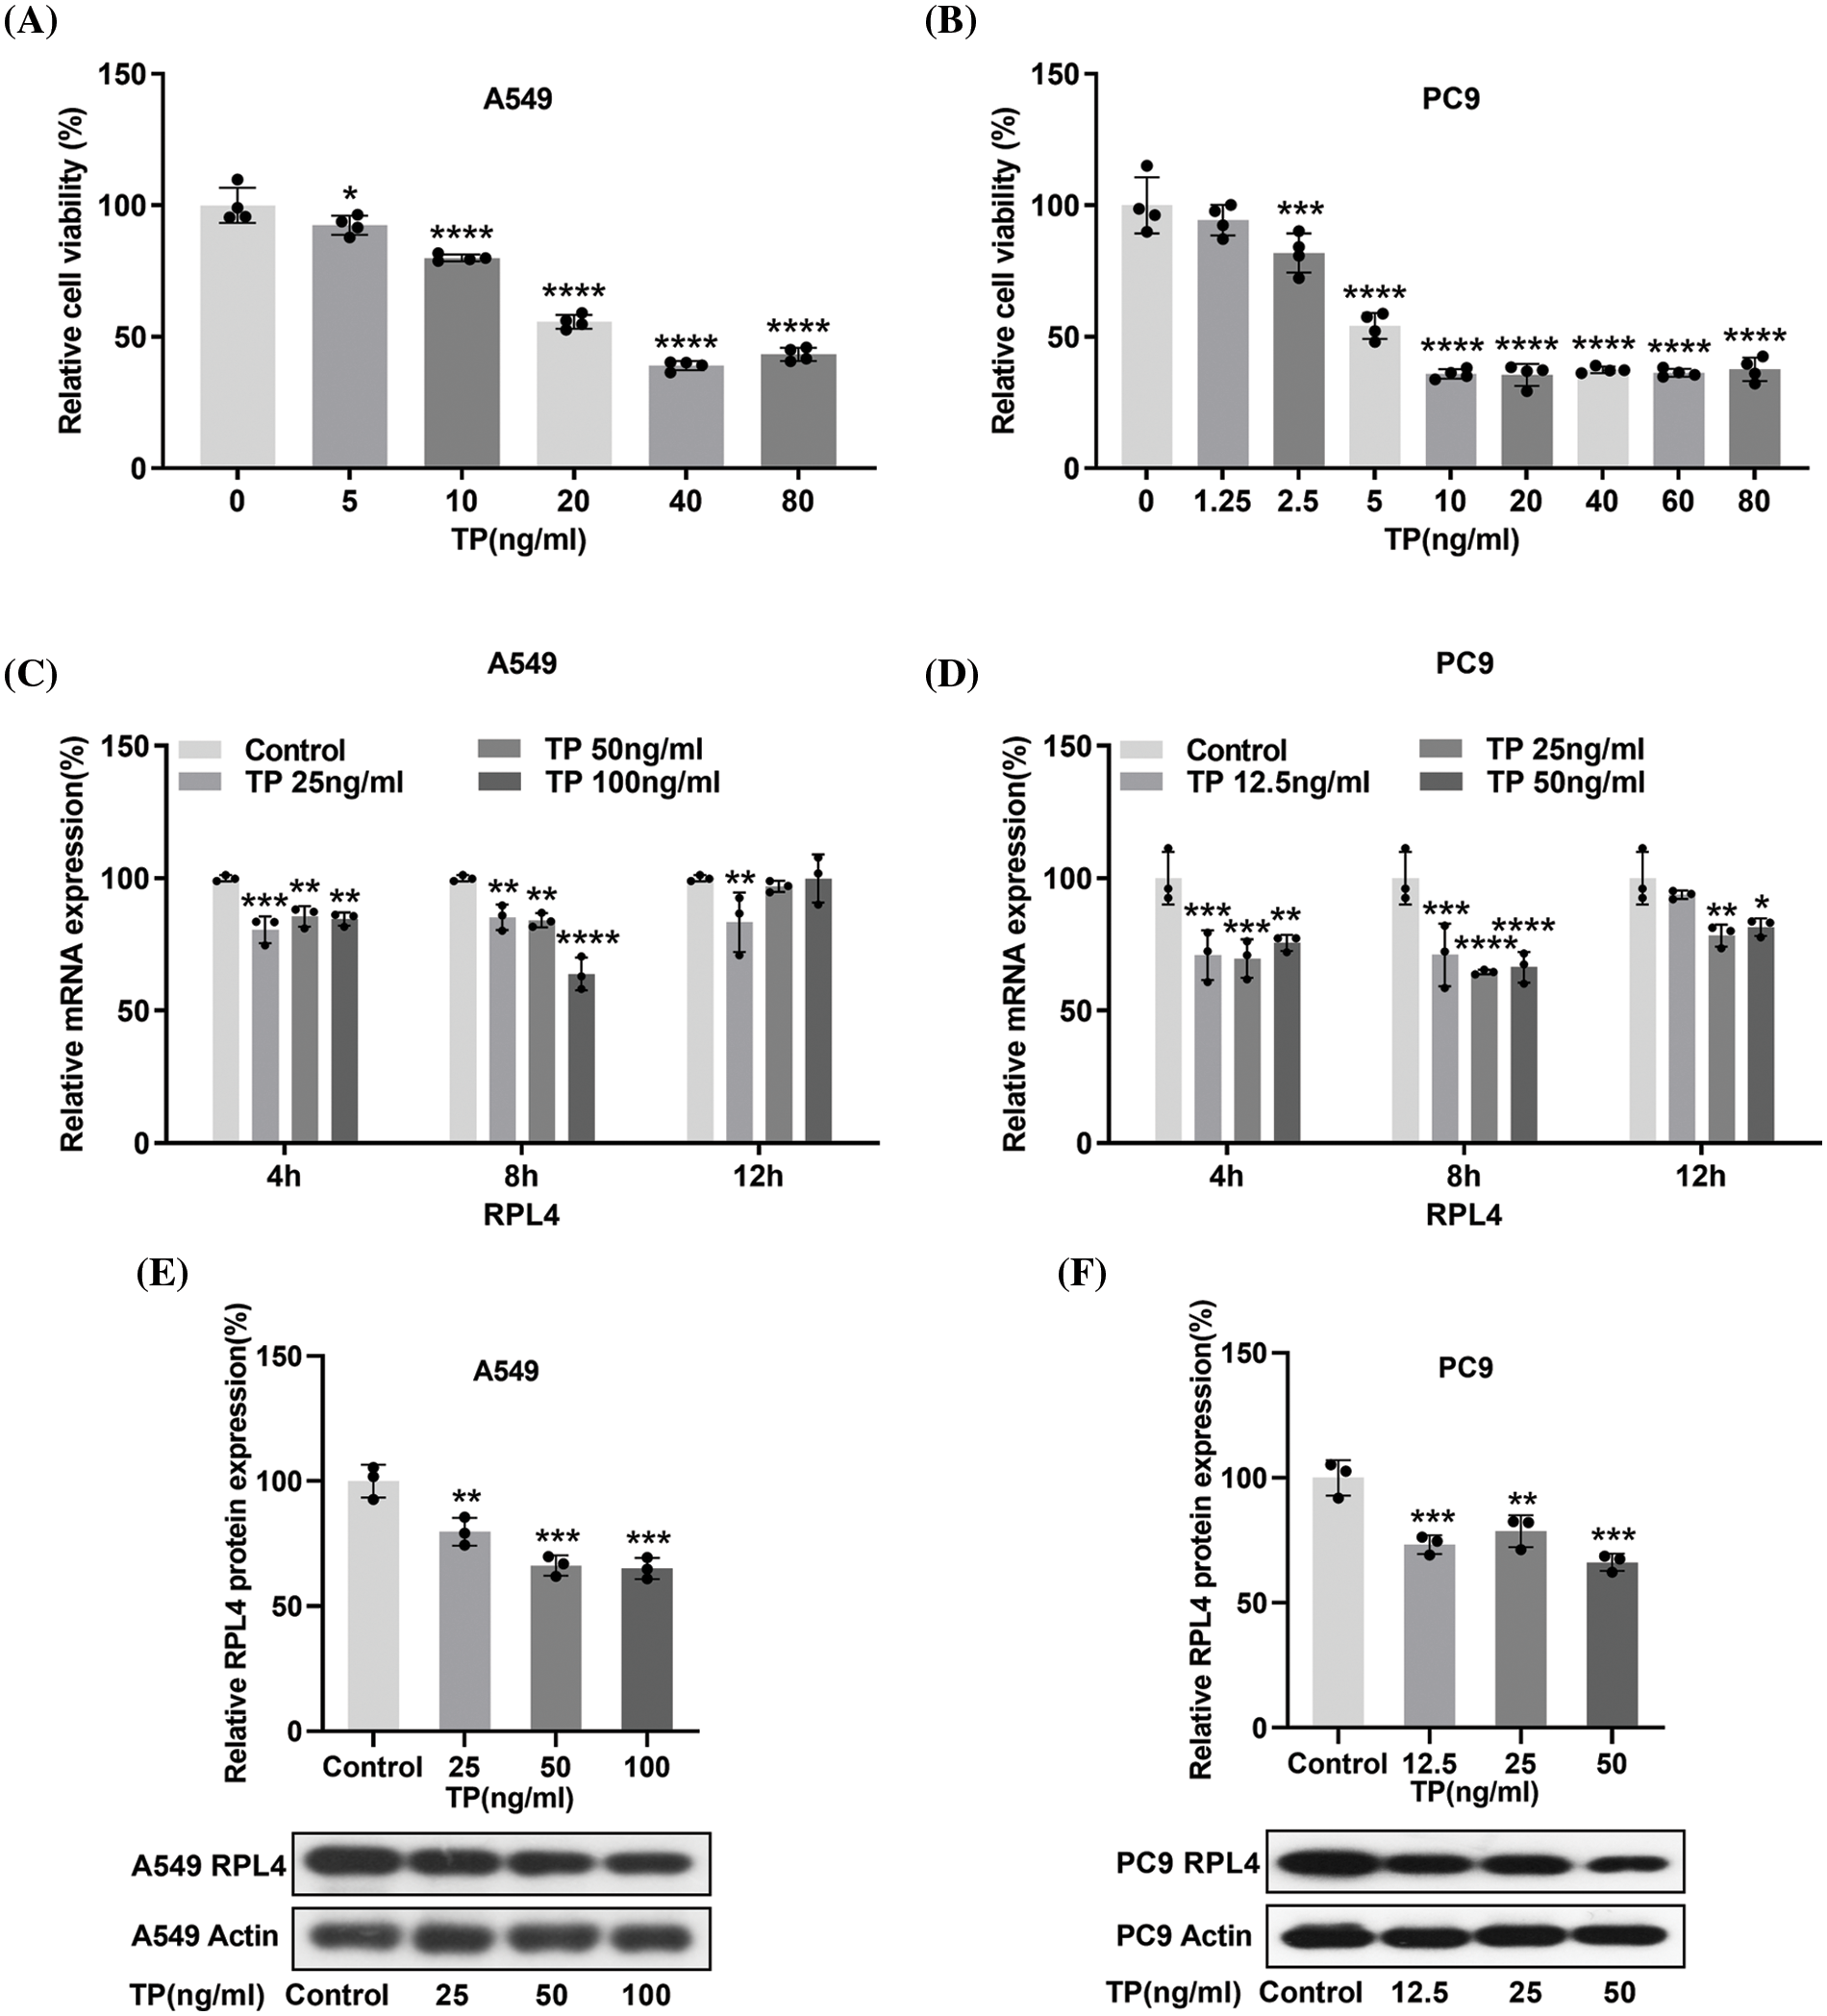
Figure 5: Triptolide (TP) decreases ribosomal protein L4 (RPL4) mRNA and protein expression levels. (A) and (B) CCK-8 assays were carried out to evaluate IC50 of TP in A549 and PC9 cells. Values represent mean ± SD (n = 3). (C) and (D) Reverse transcription-quantitative polymerase chain reaction to analyze RPL4 mRNA expression in TP-treated A549 (25, 50, and 100 ng/mL) and PC9 (12.5, 25, and 50 ng/mL) cells; cells were treated with TP for 4, 8, and 12 h. Values represent mean ± SD (n = 3). Differences between the control and TP-treated groups in (C) and (D) were analyzed by two-way ANOVA. *p < 0.05, **p < 0.01, ***p < 0.001, and ****p < 0.0001 vs. control. (E) and (F) RPL4 protein expression was measured by western blotting at 36 h after TP treatment. Values represent mean ± SD (n = 3). **p < 0.01 and ***p < 0.001.
Small interfering RNA targeting ribosomal protein L4 (siRPL4) exaggerates the inhibitory effects of triptolide on RPL4 protein
In subsequent experiments, the toxicity of the transfection reagent slightly damaged the cells during transfection; moreover, TP was also toxic to a certain extent (Cao et al., 2022). Therefore, we empirically reduced the dose of TP to 25 ng/mL for A549 cells and 6.5 ng/mL for PC9 cells to ensure good cell viability. Considering that TP could repress RPL4 expression in both PC9 and A549 cells, we investigated the influence of siRPL4 on TP-induced RPL4 repression. SiRPL4 at three different locations and negative control (siNC) were transfected into PC9 and A549 cells to validate the interference effect. In comparison with siNC, siRPL4 significantly decreased RPL4 expression in PC9 and A549 cells (Figs. 6A–6B). On treating siRPL4-transfected cells with TP, we found that the inhibition of RPL4 expression was more significant on siRPL4–TP treatment compared with siRPL4 or TP alone, suggesting that RPL4 interference enhanced the inhibitory effects of TP on RPL4 protein. This enhancement was particularly pronounced in case of siRPL4-1 and siRPL4-4 (Figs. 6C and 6D). These results reveal that siRPL4 enhances the inhibitory effects of TP on RPL4 protein.
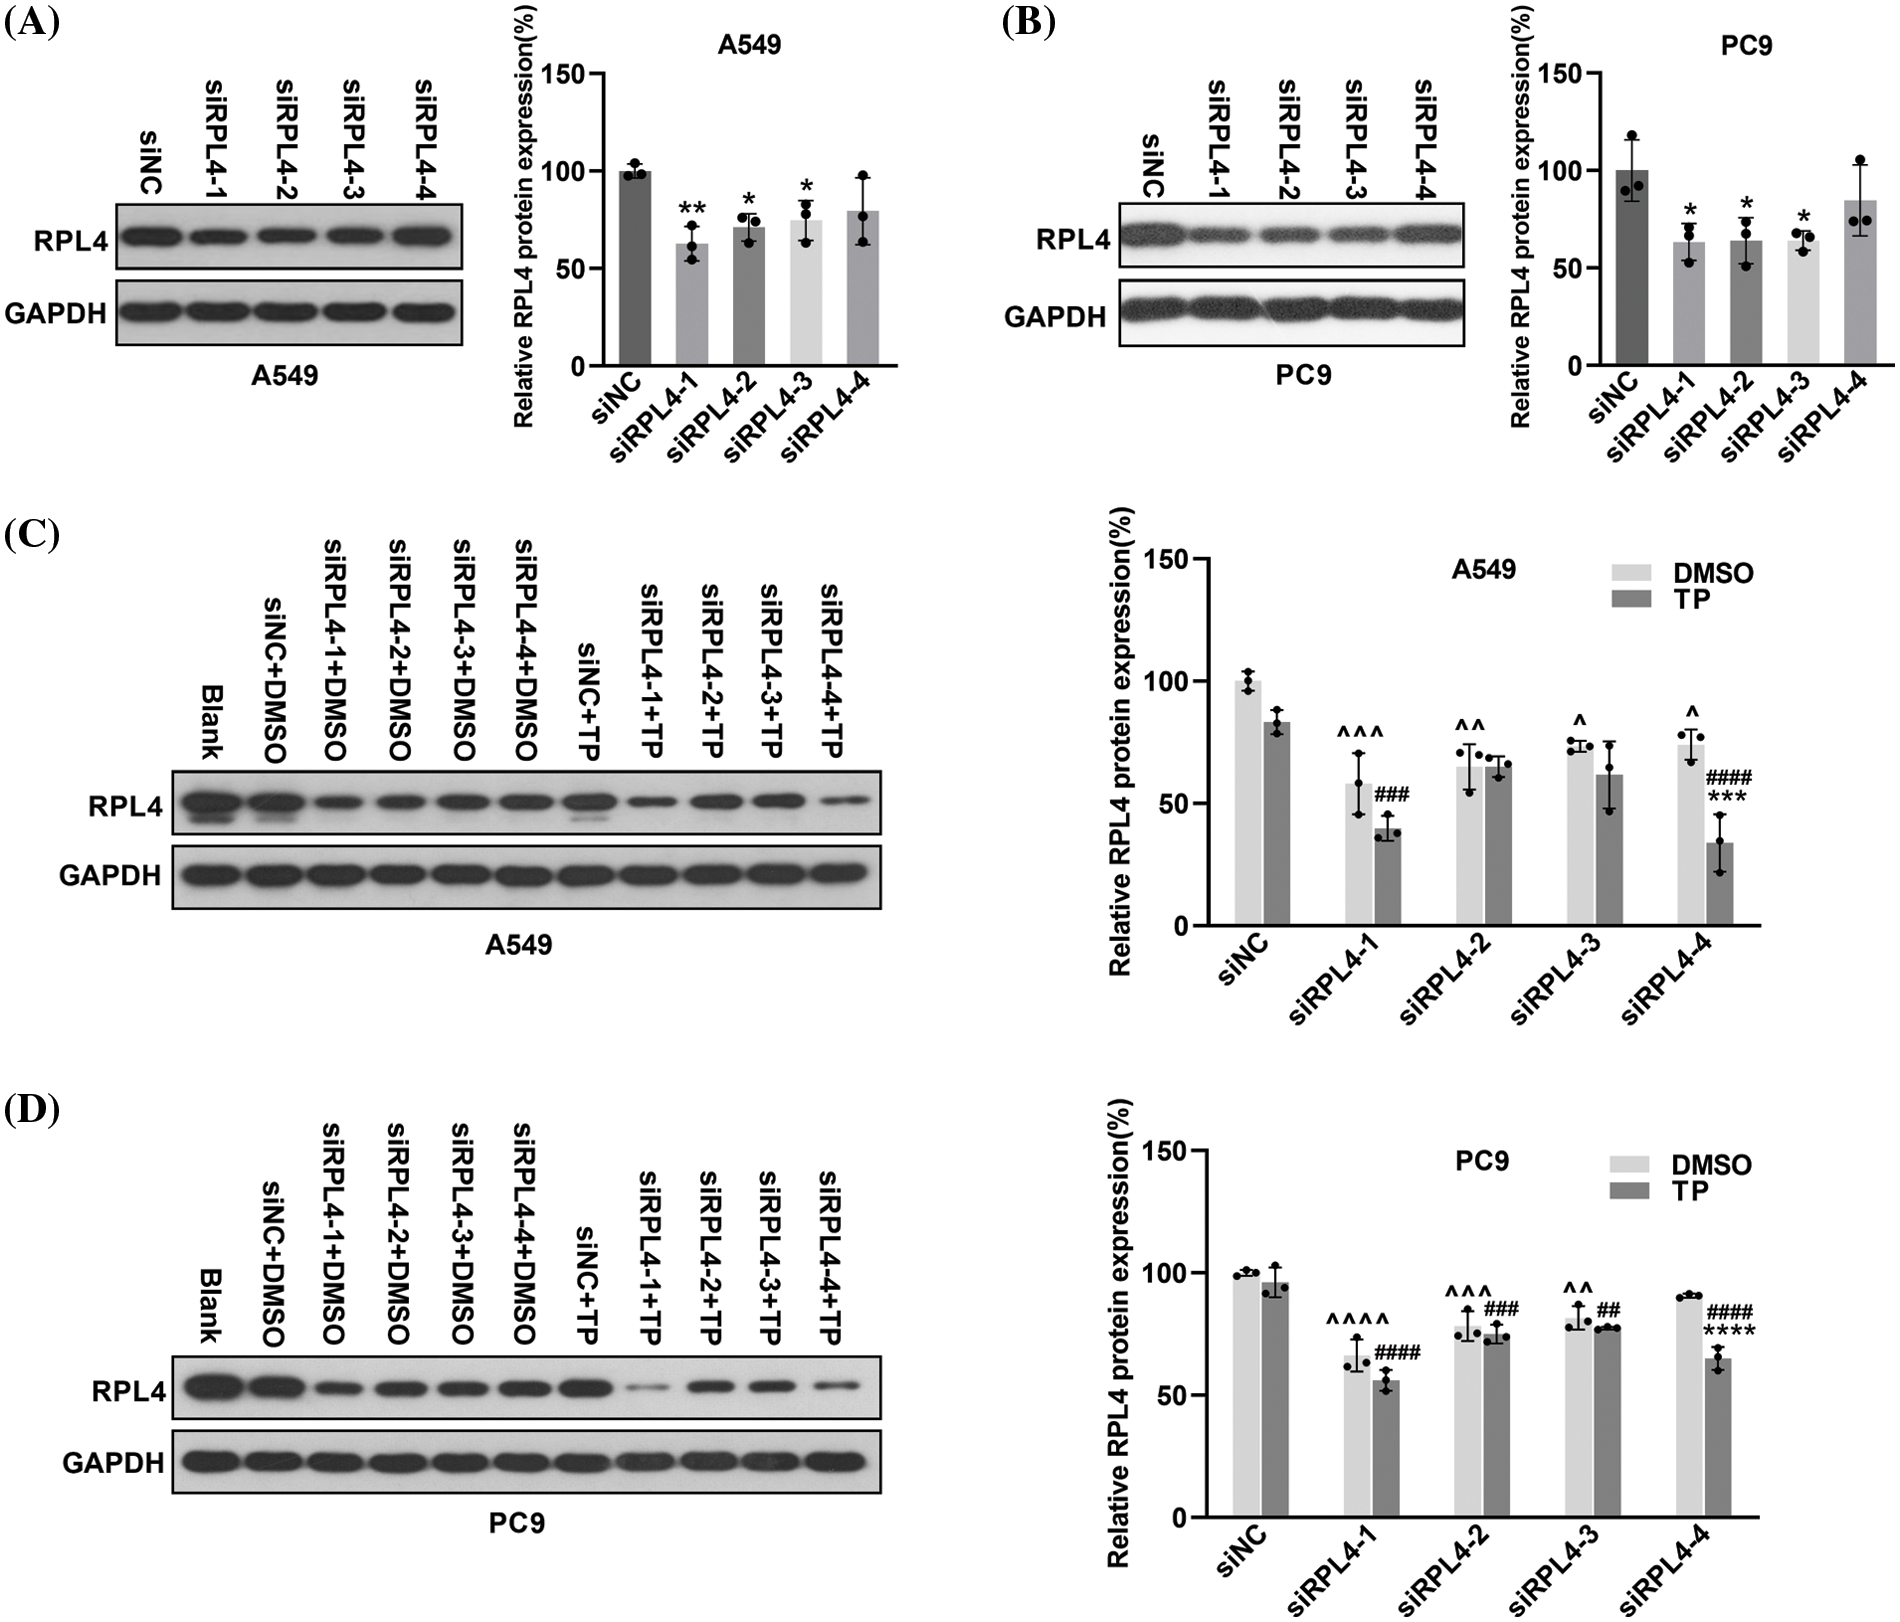
Figure 6: Reduction of ribosomal protein L4 (RPL4) exaggerates the inhibitory effects of triptolide (TP) on RPL4. A549 (A) and PC9 (B) cells were transfected with siNC or siRPL4 (siRPL4-1–4). Proteins were collected at 36 h post-transfection and determined by western blotting. Values represent mean ± SD (n = 3). Differences between the groups in (A) and (B) were analyzed by one-way ANOVA. *p < 0.05 and **p < 0.01 vs. siNC. A549 (C) and PC9 (D) cells were transfected with siNC or siRPL4 (siRPL4-1–4). Cells were treated with dimethyl sulfoxide as negative control and TP at 18 h post-transfection. TP concentration was 25 ng/mL for A549 cells and 6.5 ng/mL for PC9 cells. Proteins were extracted at 36 h post-transfection and analyzed by western blotting. Values represent mean ± SD (n = 3). Differences between the groups in (C) and (D) were analyzed by two-way ANOVA. **p < 0.01 and ***p < 0.001 vs. si& +DMSO;^p < 0.05, ^^p < 0.01, and ^^^p < 0.001 vs. siNC+DMSO; #p < 0.05, ##p < 0.01, ###p < 0.001, and ####p < 0.0001 vs. siNC+TP. & Represents siNC, siRPL4-1, siRPL4-2, siRPL4-3, and siRPL4-4.
Reduced expression of ribosomal protein L4 enhances the inhibitory effects of triptolide on cell proliferation
Results from CCK-8 assays revealed that in comparison with siNC, reduced expression of RPL4 caused by siRPL4 led to a significant inhibition of NSCLC cell growth (Fig. 7), and the combination of TP treatment and siRPL4 transfection further enhanced this inhibitory effect. These results implied that RPL4 is crucial for NSCLC proliferation; the decrease in RPL4 expression promoted the repressed effects of TP on NSCLC cell proliferation. These findings confirm that siRPL4 enhances the effects of TP on the inhibition of cell proliferation.
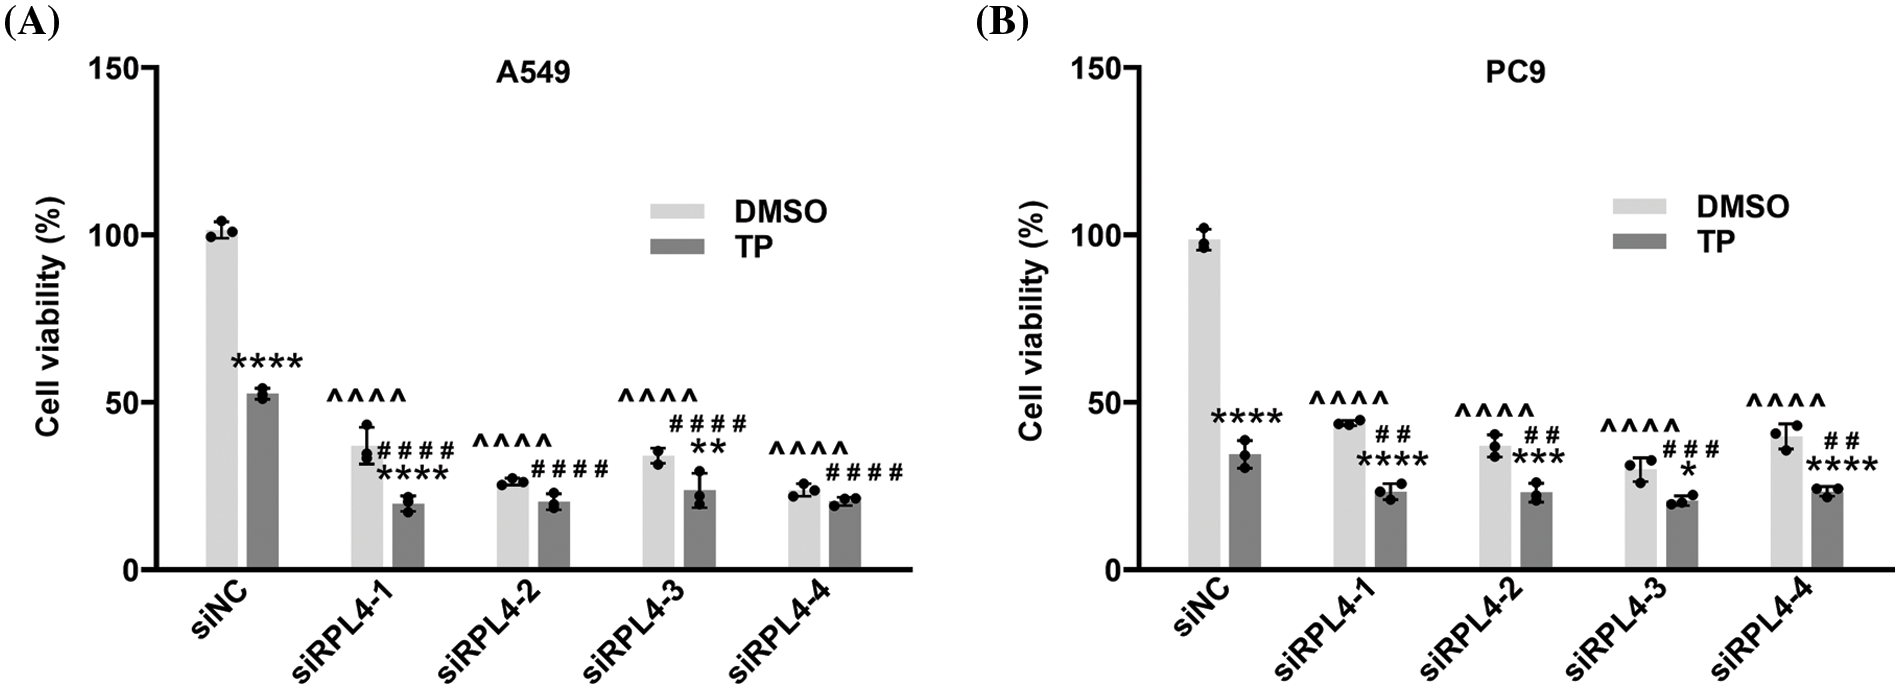
Figure 7: Reduced expression of ribosomal protein L4 (RPL4) promotes the suppressed effects of TP on proliferation. (A) A549 and (B) PC9 cells were transfected with siNC or siRPL4 (siRPL4-1–4). Cells were treated with dimethyl sulfoxide (negative control) and TP at 18 h post-transfection. Triptolide (TP) concentration was 25 ng/mL for A549 cells and 6.5 ng/mL for PC9 cells. Absorbance was measured at 36 h after transfection. Data are presented as mean ± SD (n = 3). Differences between the groups were analyzed by two-way ANOVA. *p < 0.05, **p < 0.01, ***p < 0.001, and ****p < 0.0001 vs. si&+DMSO; ^^^^p < 0.0001 vs. siNC+DMSO; ##p < 0.01, ###p < 0.001, and ####p < 0.0001 vs. siNC+TP. & Represents siNC, siRPL4-1, siRPL4-2, siRPL4-3, and siRPL4-4.
Reduced expression of ribosomal protein L4 reinforces the effects of triptolide on cell apoptosis
We previously reported that TP induces A549 cell apoptosis (Wang et al., 2020). In this study, we evaluated the effects of RPL4 expression on apoptosis and the role of reduced RPL4 expression on TP-induced cell apoptosis (Fig. 8). Flow cytometry data showed that compared to siNC+DMSO, TP treatment (siNC+TP) induced obvious cell apoptosis; besides, in comparison with siNC+DMSO, transfecting A549 and PC9 cells with siRPL4-1 and -4 (siRPL4+DMSO) led to significant cell apoptosis. The combination of TP and siRPL4-1–4 increased TP-induced cell apoptosis when compared with TP+siNC only, indicating that reduced RPL4 expression enhanced TP-induced apoptosis in the case of both A549 and PC9 cells.
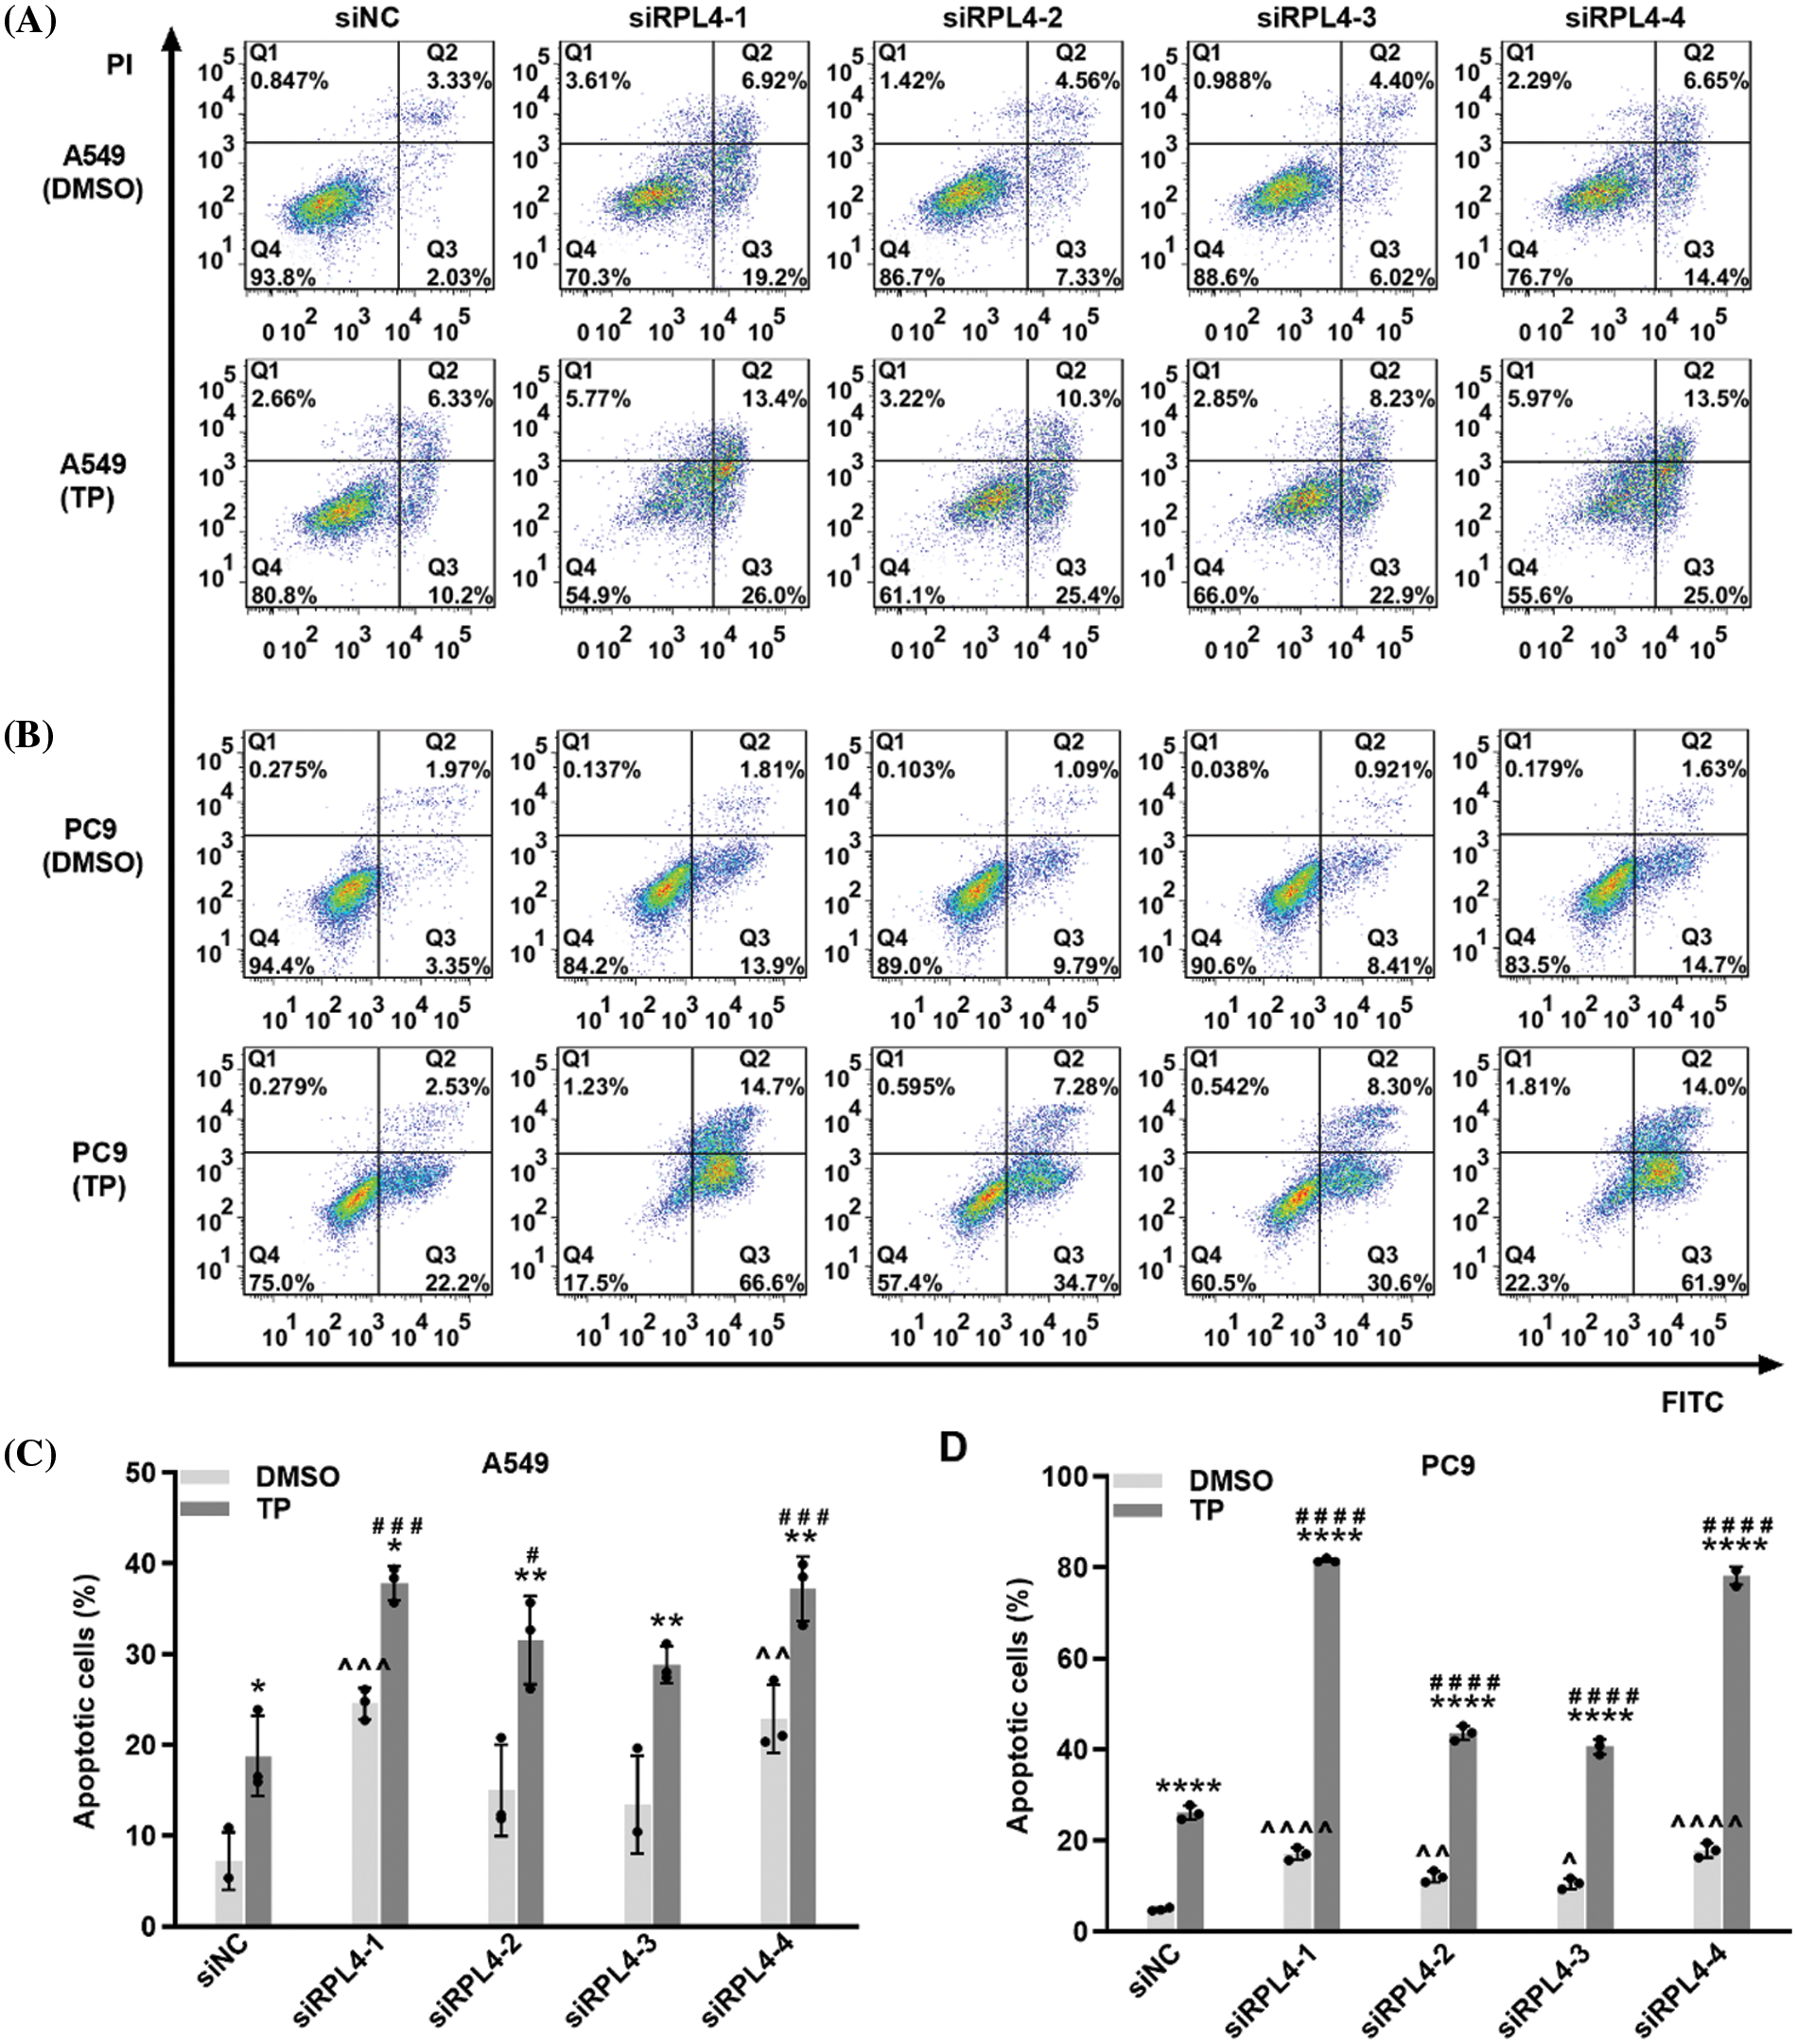
Figure 8: Reduced expression of ribosomal protein L4 (RPL4) promotes the effects of triptolide (TP) on cell apoptosis. (A) A549 and (B) PC9 cells were transfected with siNC or siRPL4 (siRPL4-1–4). Cells were treated with dimethyl sulfoxide (negative control) and TP at 18 h post-transfection. TP concentration was 25 ng/mL for A549 cells and 6.5 ng/mL for PC9 cells. The proportion of apoptotic cells was evaluated at 36 h post-transfection. (C) and (D) Percentage of apoptotic cells is as mean ± SD (n = 3). Data in (C) and (D) were analyzed by two-way ANOVA. *p < 0.05, **p < 0.01, and ****p < 0.0001 vs. si&+DMSO; ^p < 0.05, ^^p < 0.01, ^^^p < 0.001 and ^^^^p < 0.0001 vs. siNC+DMSO; #p < 0.05, ###p < 0.001, and ####p < 0.0001 vs. siNC+TP. & Represents siNC, siRPL4-1, siRPL4-2, siRPL4-3, and siRPL4-4.
Reduced expression of ribosomal protein L4 reinforces the effects of triptolide on cell cycle arrest
Cell cycle arrest is a critical route via which TP inhibits NSCLC. The influence of RPL4 on the NSCLC cell cycle and the role of reduced RPL4 expression on TP-induced cell cycle arrest were investigated by flow cytometry. TP mainly blocked the cell cycle in the G0/G1 phase (Fig. 9); likewise, interference of RPL4 expression also impeded the cell cycle in the G0/G1 phase. In comparison with siNC+TP, transfection with siRPL4 in combination with TP led to a more prominent retardation in the G0/G1 phase. These effects were more pronounced in PC9 cells (Fig. 9). Overall, these data hint that suppression of RPL4 expression reinforces the effects of TP on the NSCLC cell cycle arrest.
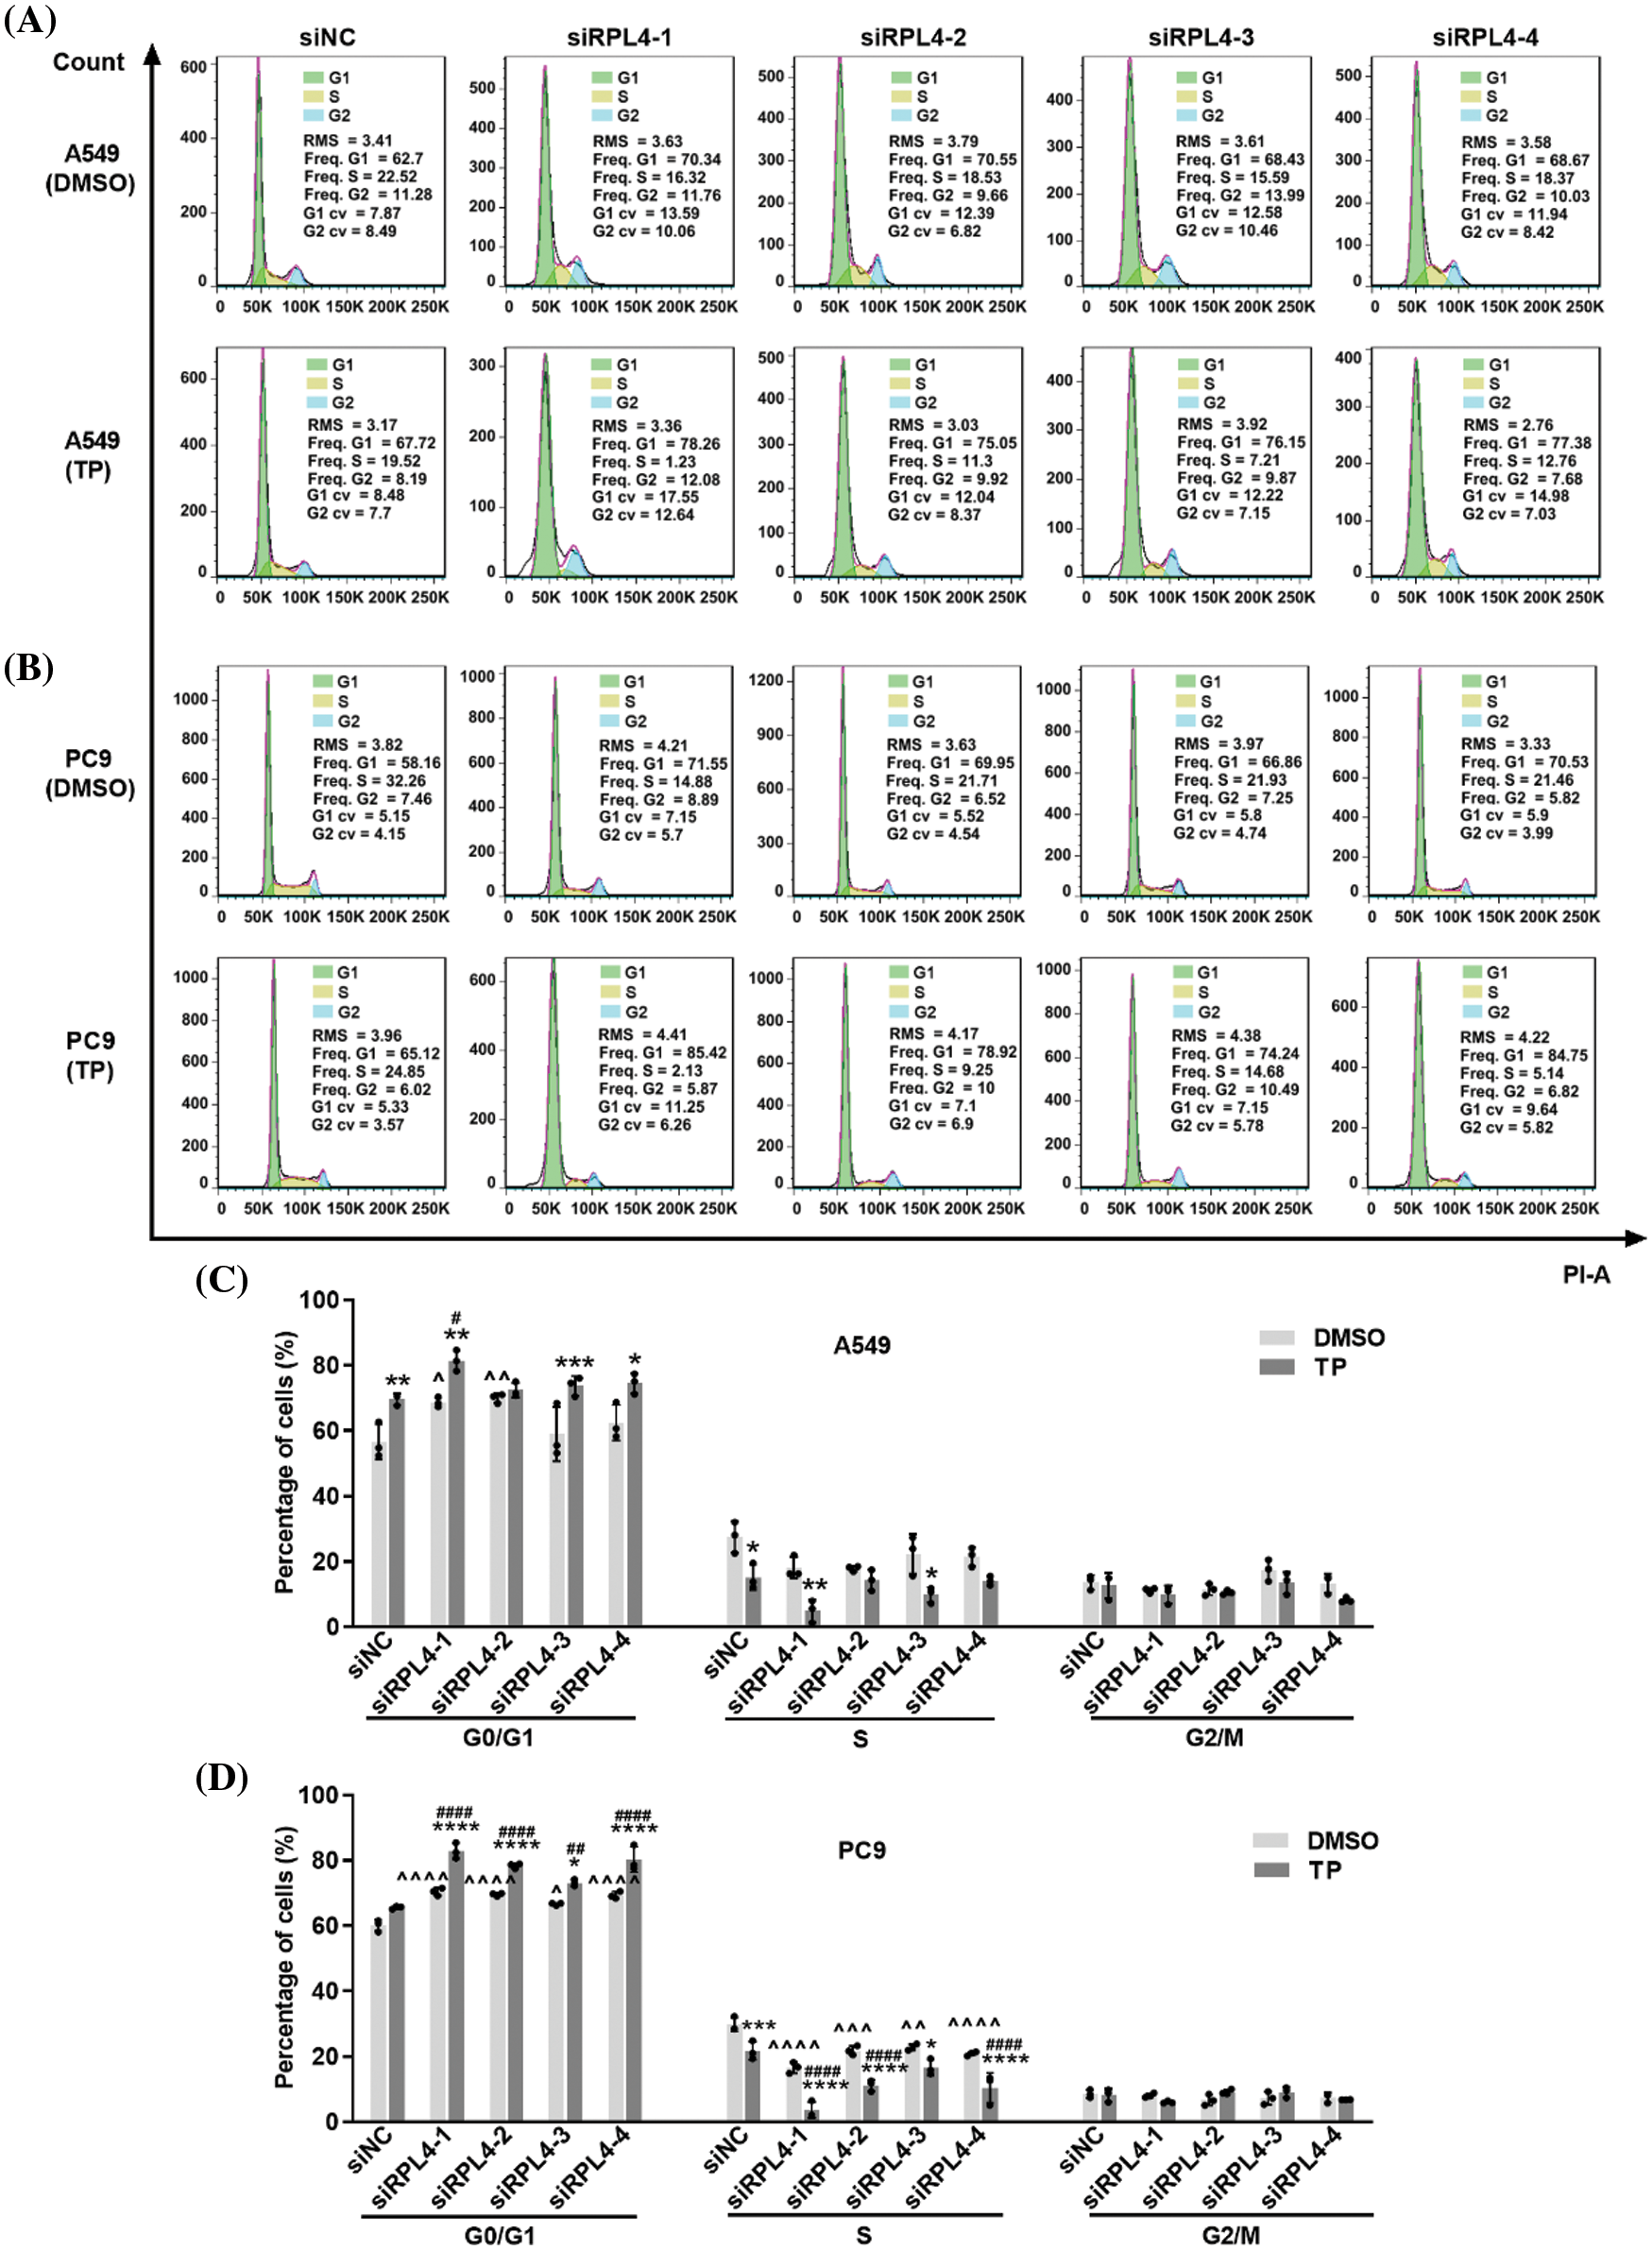
Figure 9: Reduced expression of ribosomal protein L4 (RPL4) promotes the effects of triptolide (TP) on cell cycle arrest. (A) A549 and (B) PC9 cells were transfected with siNC or siRPL4 (siRPL4-1–4). Cells were treated with dimethyl sulfoxide (negative control) and TP at 18 h post-transfection. TP concentration was 25 ng/mL for A549 cells and 6.5 ng/mL for PC9 cells. The cell cycle phase was evaluated at 36 h post-transfection. (C) and (D) Proportion of cells in the G1/S/M phase is presented as mean ± SD (n = 3). Data in (C) and (D) were analyzed by two-way ANOVA. *p < 0.05, **p < 0.01, ***p < 0.001, and ****p < 0.0001 vs. si&+DMSO; ^p < 0.05, ^^p < 0.01, and ^^^^p < 0.0001 vs. siNC+DMSO; #p < 0.05 and ####p < 0.0001 vs. siNC+TP. & Represents siNC, siRPL4-1, siRPL4-2, siRPL4-3, and siRPL4-4.
Reduced expression of ribosomal protein L4 reinforces the suppressed effects of triptolide on the invasion of non-small cell lung cancer cells
As reported in our previous study, TP possesses the ability to inhibit the invasion of A549 cells (Li et al., 2020). Transwell assays detected the effects of RPL4 on the invasion of NSCLC cells and the role of reduced RPL4 expression on TP-induced inhibition of invasion of NSCLC cells. Transfection with siRPL4 markedly inhibited the invasion of A549 and PC9 cells compared with siNC. Compared to siNC+DMSO, TP was confirmed to significantly inhibit the invasion of both A549 and PC9 cells. Furthermore, compared with TP alone, the combination of TP and siRPL4 exaggerated the inhibitory effects of TP on the invasion of A549 and PC9 cells (Fig. 10), suggesting that suppression of RPL4 expression reinforces the suppressed effects of TP on the invasion of NSCLC cells.
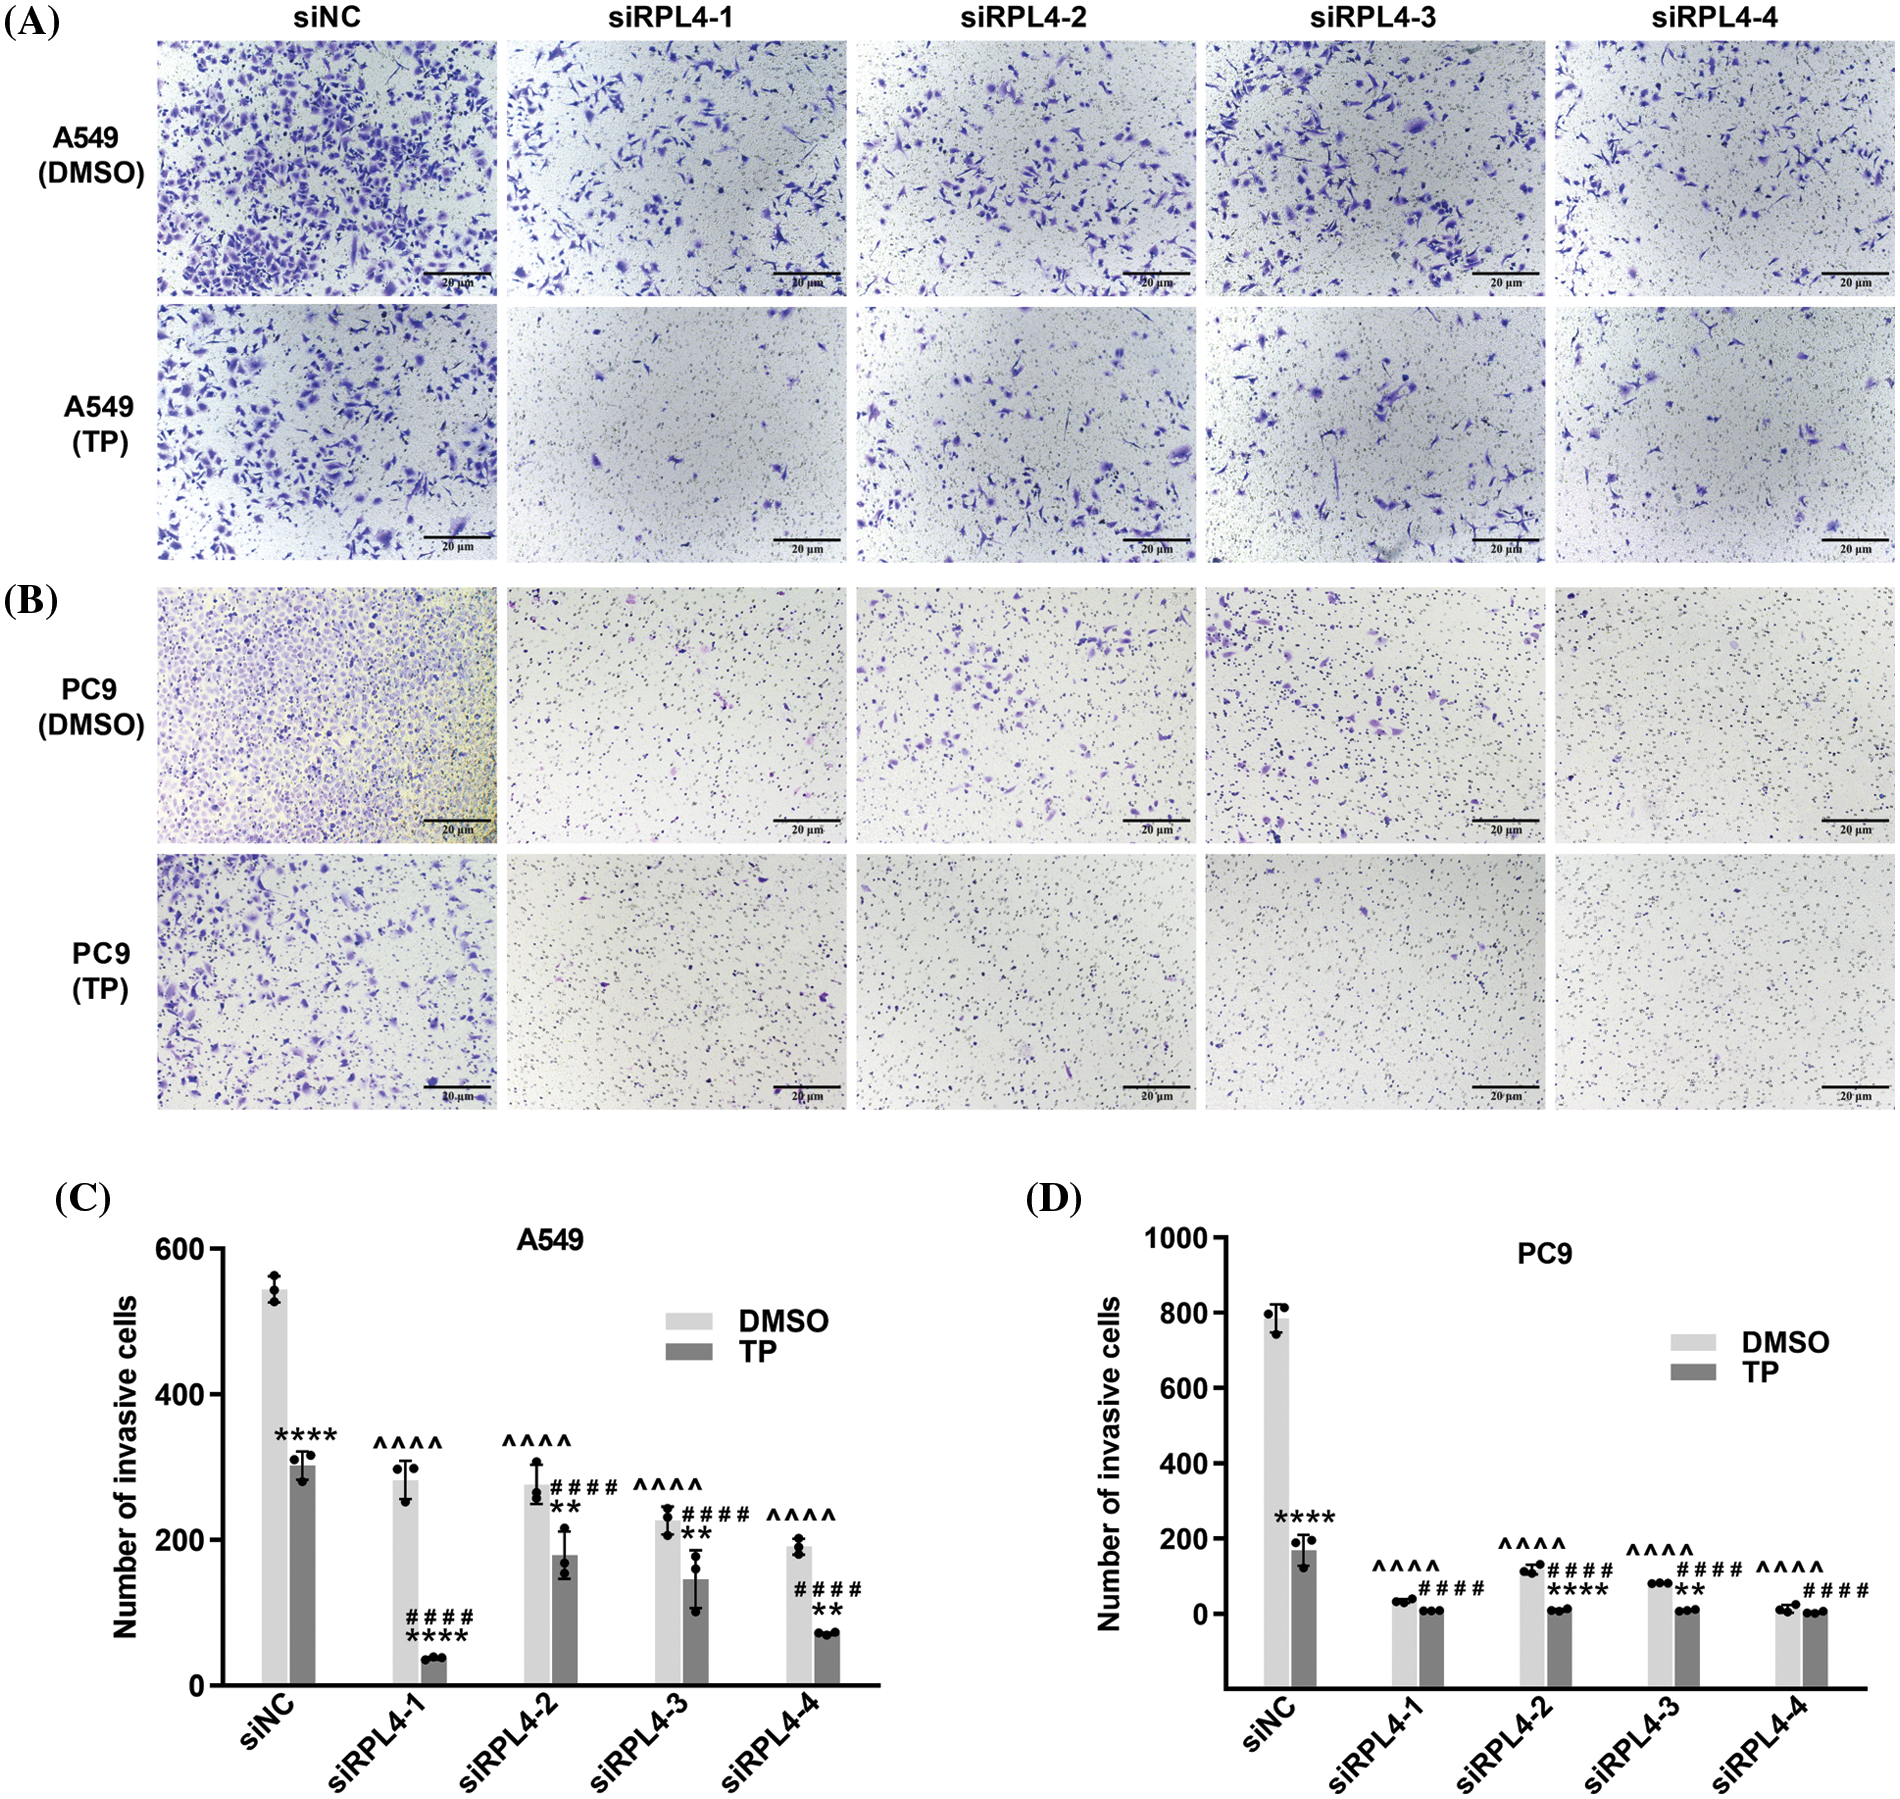
Figure 10: Reduced expression of ribosomal protein L4 (RPL4) promotes the suppressed effects of triptolide (TP) on the invasion of NSCLC cells. (A) A549 and (B) PC9 cells were transfected with siNC or siRPL4 (siRPL4-1–4). Cells were treated with dimethyl sulfoxide (negative control) and TP at 18 h post-transfection. TP concentration was 25 ng/mL for A549 cells and 6.5 ng/mL for PC9 cells. Cell invasion was evaluated by Transwell assays. (C) and (D) Values represent mean ± SD (n = 3). Data in (C) and (D) were analyzed using two-way ANOVA. **p < 0.01, and ****p < 0.0001 vs. si&+DMSO; ^^^^p < 0.0001 vs. siNC+DMSO; ####p < 0.0001 vs. siNC+TP. & Represents siNC, siRPL4-1, siRPL4-2, siRPL4-3, and siRPL4-4.
Reduction of ribosomal protein L4 expression enhances the triptolide-activated MDM2-P53 pathway to regulate the expression of P53, cyclin D1, Snail, and c-PARP1
RP dysfunctions lead to alterations in the MDM2-P53 pathway (Russo and Russo, 2017). Herein CO-IP experiment results indicated that transfection with siRPL4 or TP alone significantly elevated MDM2 expression in both A549 and PC9 cells. Furthermore, in comparison with TP alone, the combination of siRPL4 and TP treatment further enhanced this increase, particularly in PC9 cells (Figs. 11A and 11B).
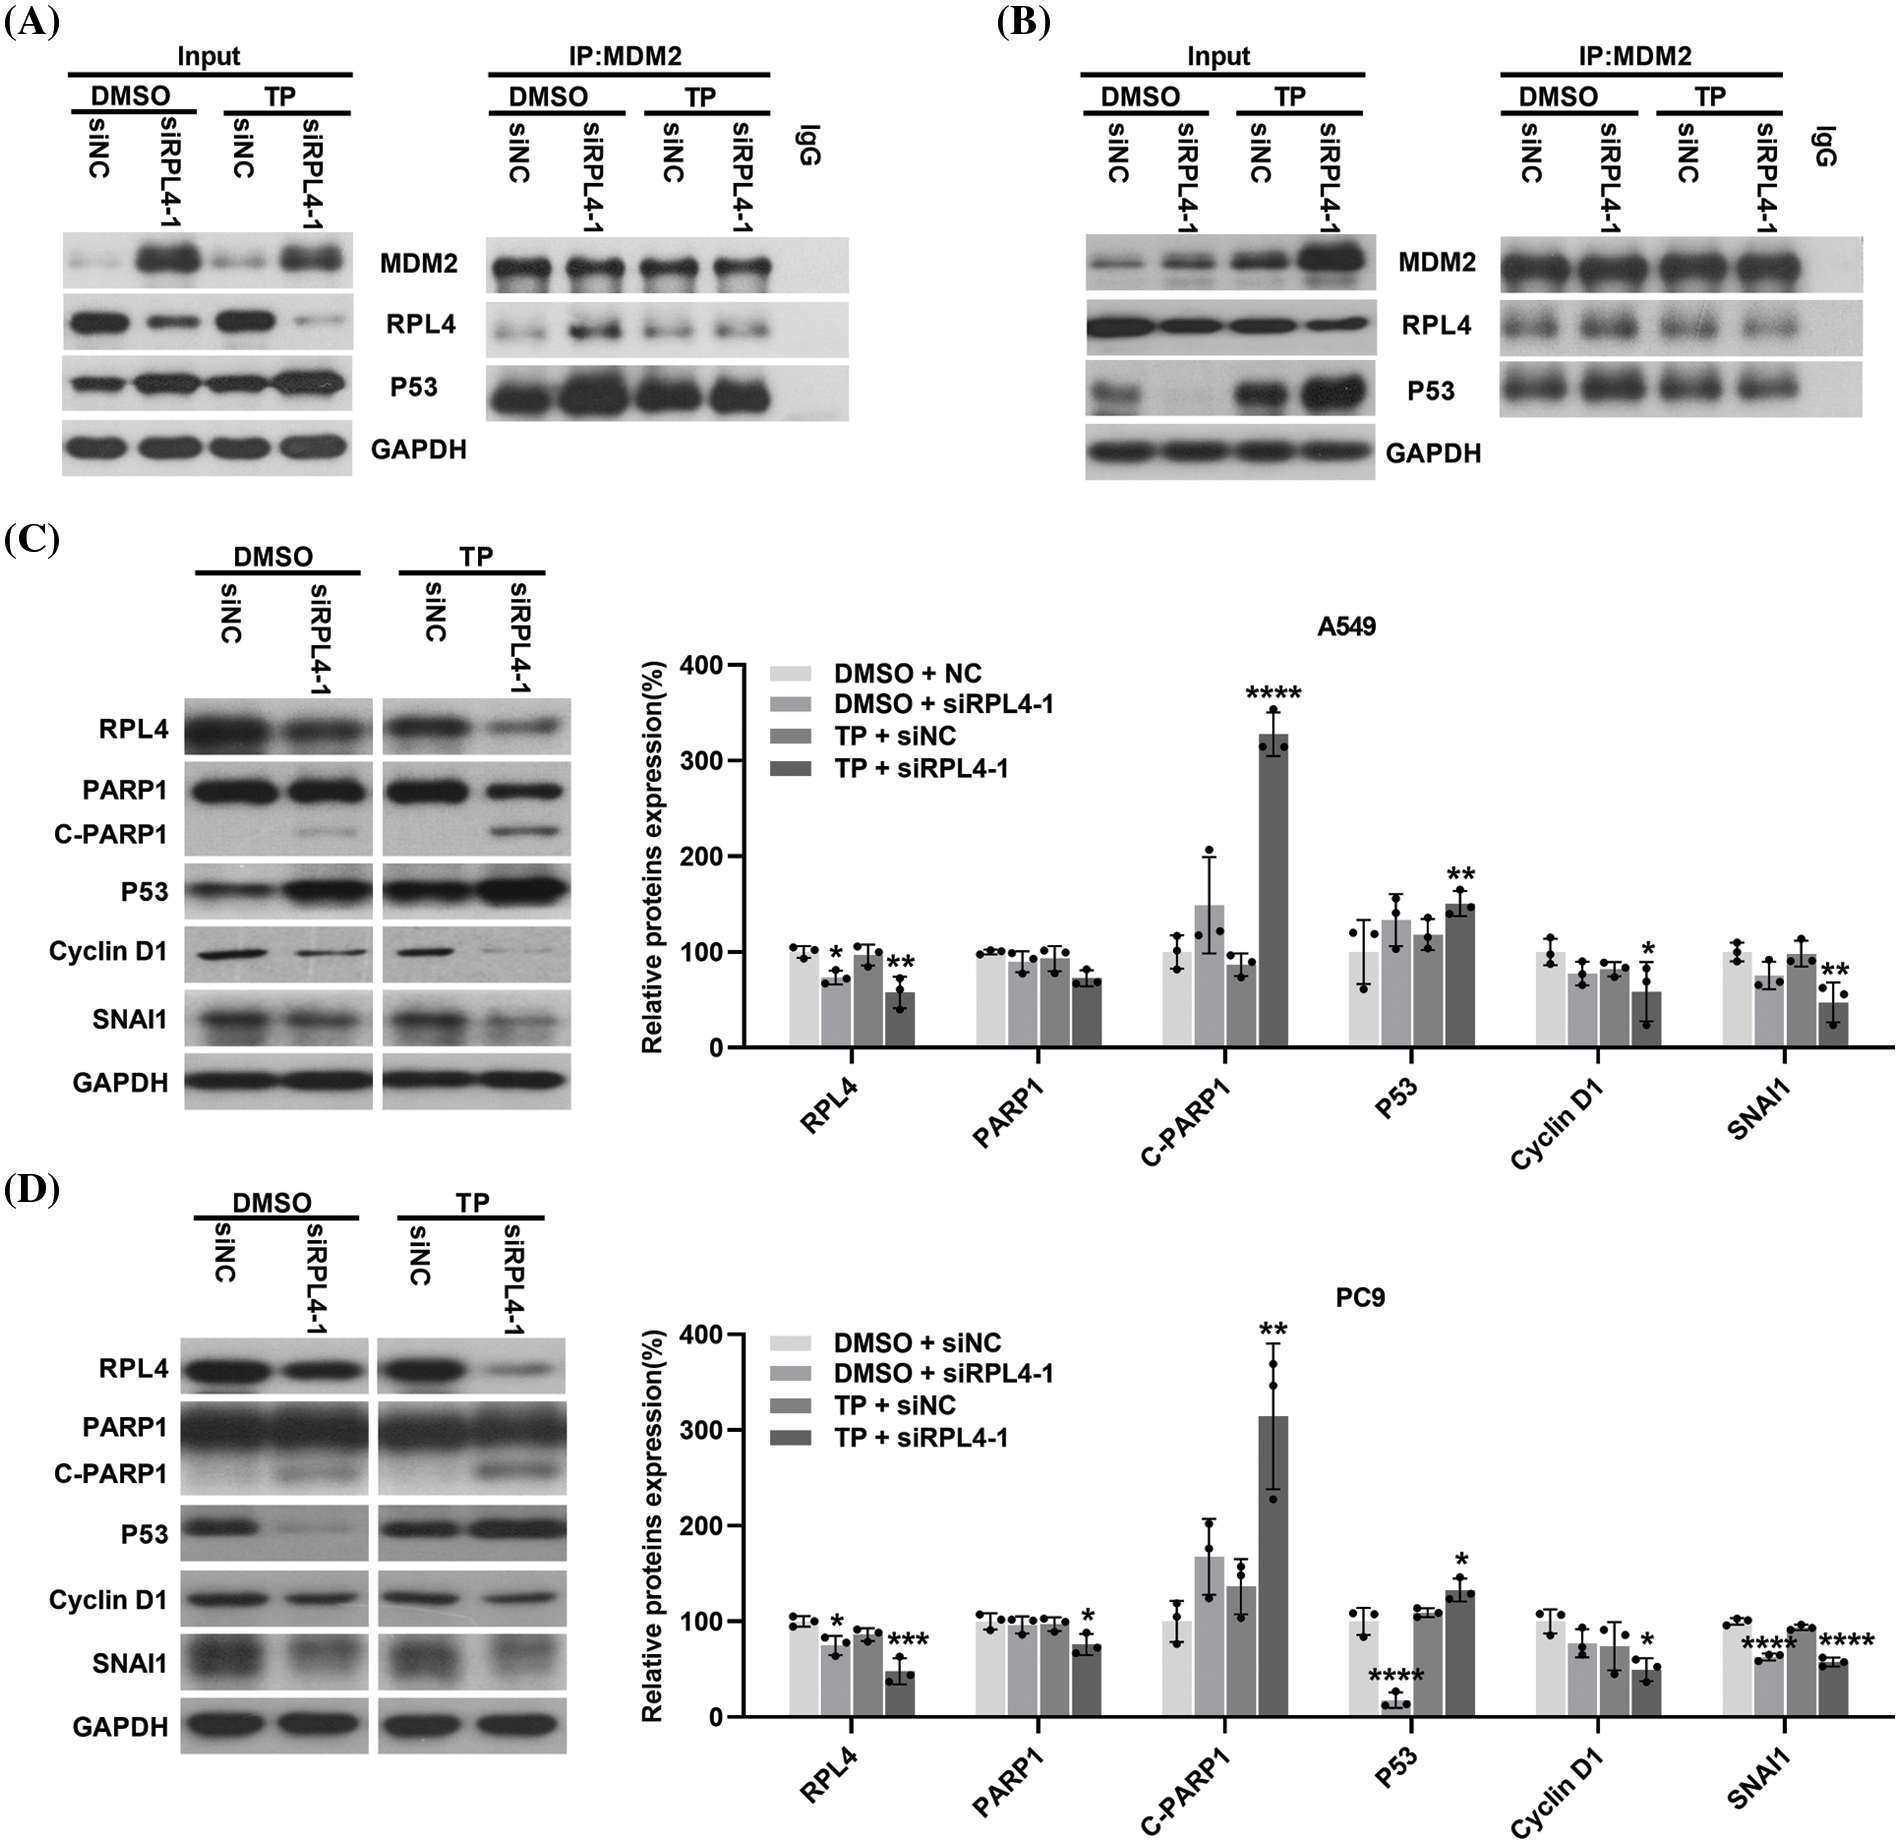
Figure 11: Reduction of ribosomal protein L4 (RPL4) expression activates the MDM2-P53 pathway and regulates the expression of P53, cyclin D1, Snail, and c-PARP1. (A) A549 and (B) PC9 cell lysate were immunoprecipitated with an antibody targeting MDM2, followed by elution and incubation with anti-MDM2, P53, and RPL4. Input control was performed using 20% lysate. The prepared A549 (C) and PC9 (D) cells were subjected to western blotting to determine the expression of RPL4, PARP1, P53, cyclin D1, and Snail. Glyceraldehyde 3-phosphate dehydrogenase (GAPDH) was the internal control. Data from densitometric analysis of protein expression in (C) and (D) are presented as mean ± SD (n = 3) and were analyzed by two-way ANOVA. *p < 0.001, **p < 0.001, ***p < 0.001, and ****p < 0.0001 vs. siNC+DMSO.
Transfection with siRPL4 partially reduced RPL4 expression; TP, in general, enhanced this reduction in both A549 and PC9 cells. Repression of RPL4 expression increased the binding of RPL4 to MDM2 compared with siNC+DMSO; similarly, TP enhanced the binding of RPL4 to MDM2. In contrast, the combination of siRPL4 and TP did not significantly alter the binding between RPL4 and MDM2 compared with TP alone. These results correspond to the fact that when ribosomal protein is disturbed, ribosome biogenesis is disrupted and ribosomal protein no longer participates in ribosome synthesis, but instead binds to MDM2 (Penzo et al., 2019).
Transfection with siRPL4 increased and abnormally reduced P53 expression in A549 (Fig. 11A) and PC9 (Fig. 11B) cells, respectively. Regardless of the elevation or reduction of P53 expression, its binding to MDM2 increased after siRPL4 transfection in the case of both A549 and PC9 cells (Figs. 11A and 11B). TP, in general, increased P53 expression. The binding of P53 to MDM2 was enhanced by the combination of siRPL4 and TP in comparison with siNC+DMSO. Collectively, these data indicate that the decrease in RPL4 expression activates the MDM2-P53 pathway.
The MDM2-P53 pathway is a key hub for various downstream signaling pathways; therefore, we determined the effects of disrupting this pathway on crucial proteins associated with diverse cellular processes. We found enhanced expression of c-PARP1 in RPL4-repressed cells, and this increase was reinforced by the combination of siRPL4 and TP (Figs. 11C and 11D). On the contrary, Snail and cyclin D1 expression levels were reduced by siRPL4, and this reduction was reinforced by the combination of siRPL4 and TP in both A549 and PC9 cells as compared with siRPL4 or TP alone (Figs. 11C and 11D). P53 expression was in accordance with the results of CO-IP assays. These findings suggest that the MDM2-P53 pathway activated by the downregulation of RPL4 protein expression may affect apoptosis, cell cycle, and metastasis of NSCLC cells through the regulation of P53, cyclin D1, Snail, and c-PARP1 expressions.
Triptolide induces apoptosis and reduces ribosomal protein L4 expression in xenografts
To further verify the inhibitory effects of TP, A549 cells were subcutaneously injected into the underarms of the forelimbs of BALB/cAnNCr-nu/nu nude mice. At the end of the experiment, the largest tumor diameter measured was 1.12 cm in the control and 0.78 cm in the TP-treated group (Fig. 12A). TP obviously inhibited tumor volume (Figs. 12A and 12B), and there was no statistical difference in body weight (Fig. 12C). TUNEL assay results showed that TP markedly enhanced the incorporation of FITC-labeled dUTP into the 3-OH terminal of fragmented DNA (Fig. 12D), which was significantly increased in apoptotic cells, indicating a significant amplification of cell apoptosis in TP-treated A549 xenografts. Consistent with the results of TUNEL assays, immunohistochemistry revealed a prominent expression of P53 in TP-treated A549 xenografts (Figs. 12F and 12G). Notably, RPL4 expression was markedly reduced in TP-treated tissues (Figs. 12F–12H), which conformed to the results of in vitro assays; these data indicate that TP induces apoptosis of NSCLC cells and downregulates the expression of RPL4 in vivo.
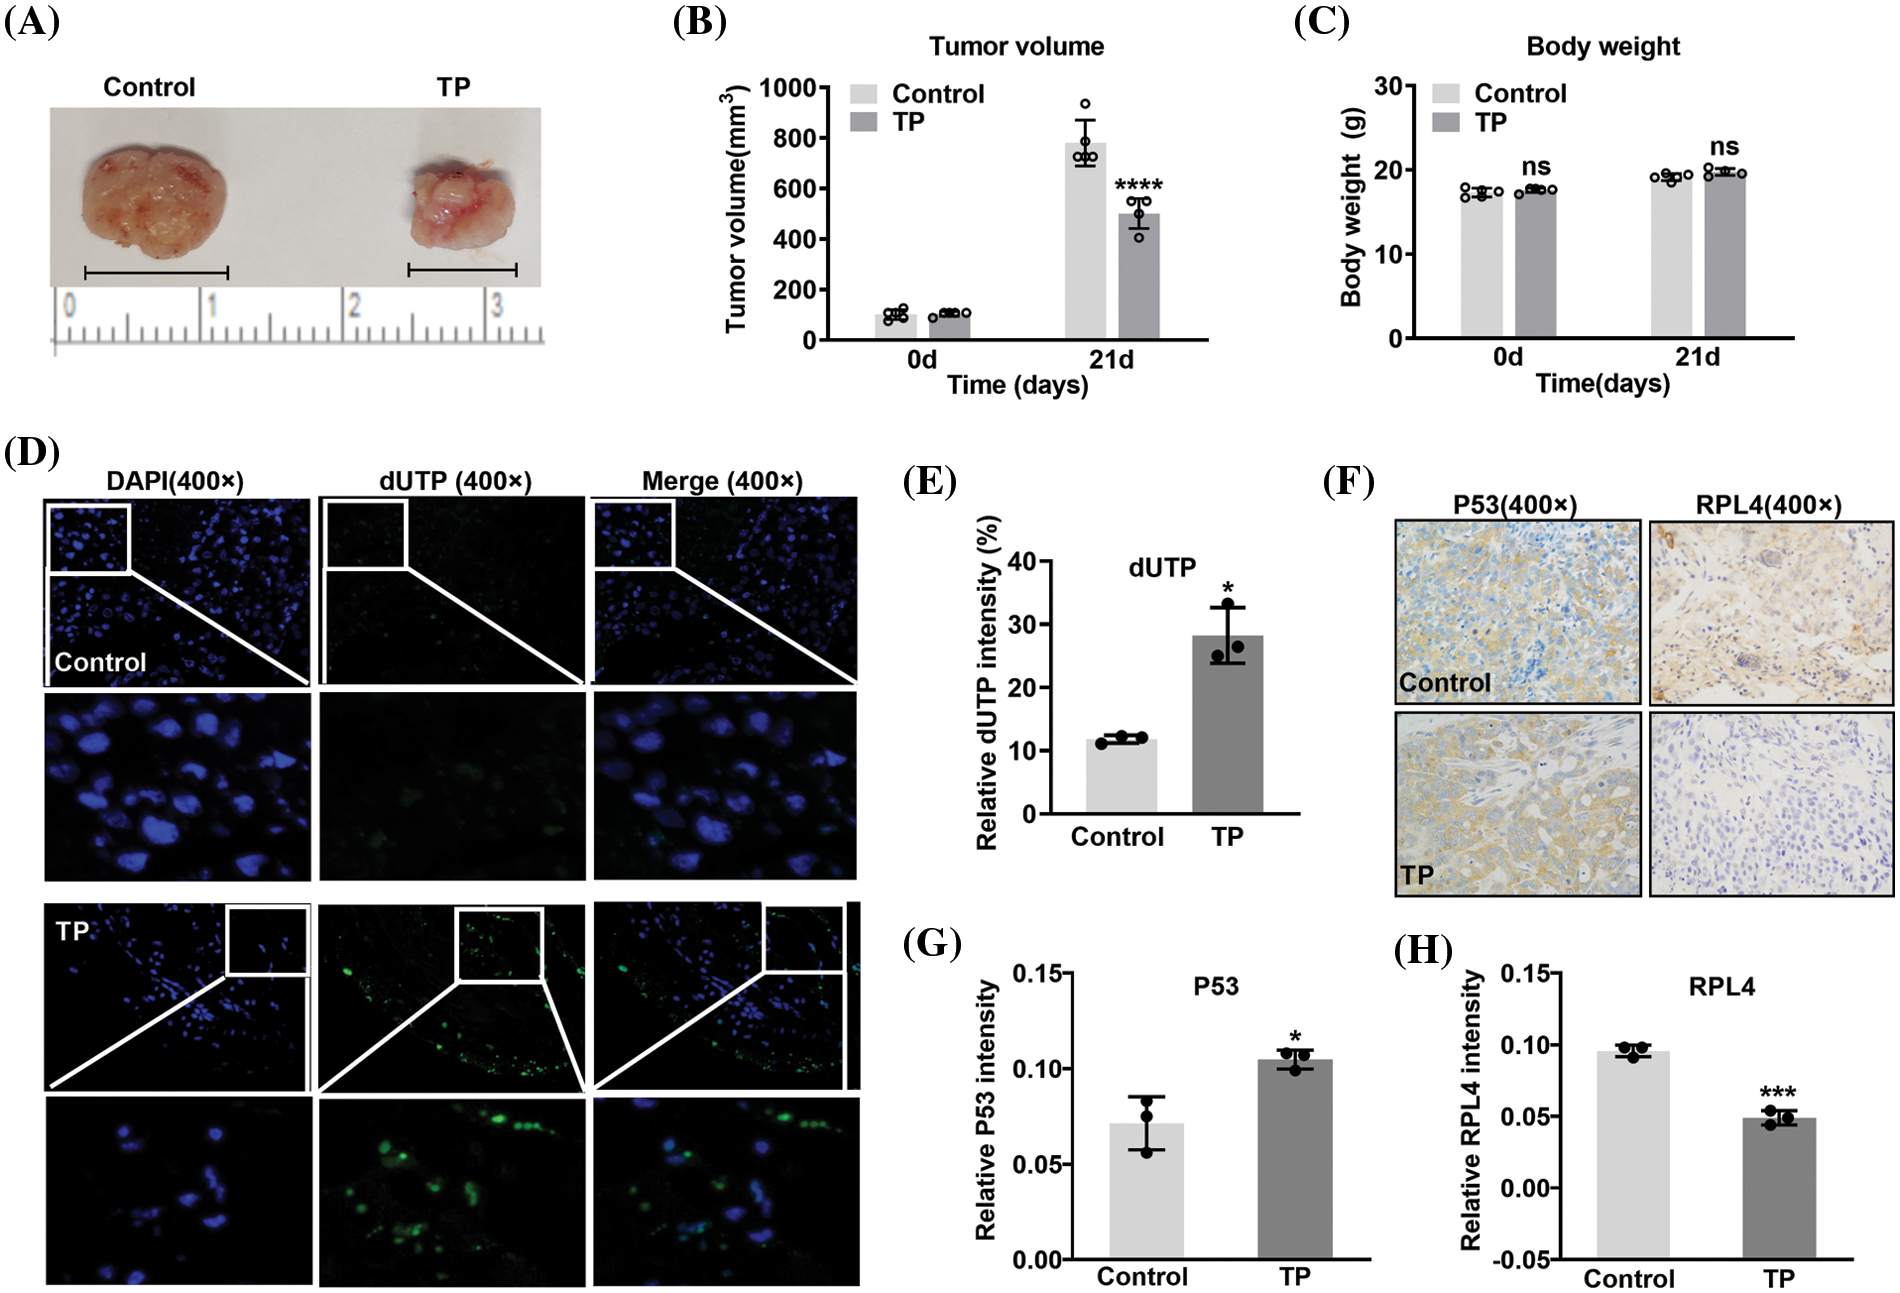
Figure 12: Triptolide (TP) inhibits tumor growth by inducing apoptosis and reducing ribosomal protein L4 (RPL4) expression. (A) Representative xenograft tumors belonging to the (saline) control and TP-treated groups. (B) volume and (C) body weight values are shown as mean ± SD (n = 5). (D) Terminal deoxynucleotidyl transferase‑mediated dUTP nick-end labeling (TUNEL) assay was conducted to analyze apoptotic cells. (E) Fluorescence intensity in TUNEL assays is presented as mean ± SD (n = 3). (F) Protein expression in xenografts was determined by immunohistochemistry with antibodies targeting P53 and RPL4. (G) and (H) Values for protein expression represent mean ± SD (n = 3). Multiple comparisons (A) and (B) were performed by two-way ANOVA. Differences between the groups in (E), (G), and (H) were analyzed using an unpaired t-test. *p < 0.05, ***p < 0.001, and ****p < 0.0001 vs. control.
RPL4 is closely associated with the 60S ribosomal subunit and protein translation (Huber and Hoelz, 2017). It is a CD40 transcriptional regulator associated with fibroblast-like synoviocytes (Zou et al., 2020). In this study, the decrease in RPL4 expression markedly repressed cell invasion and proliferation and induced apoptosis and cell cycle arrest in both PC9 and A549 cells, hinting that RPL4 expression promotes tumor development. Lan et al. (2019) reported that lncRNA SNHG10 interacts with RPL4 to mediate hepatocarcinogenesis and metastasis. LncRNA SNHG7 knockdown reportedly induces tumor-suppressive effects on hepatocellular carcinoma cells by decreasing RPL4 mRNA and protein levels (Yang et al., 2019). Along with our results, these data collectively suggest that RPL4 is an oncogene. RPL4 is a stable gene in ovarian and colon carcinomas (Fu et al., 2010; He et al., 2020). Compared to non-tumor liver tissues, it is highly expressed in hepatocellular carcinoma tissues (Yoon et al., 2006). This indicates that RPL4 expression is different in different tumor types.
In the present study, the effects of RPL4 protein knockdown in cells transfected with siRPL4-4 alone were not as obvious as those in the other three groups; however, similar to siRPL4-1, siRPL4-4 transfection still significantly inhibited proliferation, induced apoptosis, and inhibited invasion, suggesting that even a modest reduction in RPL4 markedly affected cell proliferation, apoptosis, and invasion. These findings imply that RPL4 plays a vital role in NSCLC cells. As a ribosomal component, RPL4 not only regulates the biosynthesis of ribosomes (Pillet et al., 2015) but is also relevant to the progression of tumor cells (Egoh et al., 2010; Yang et al., 2019; You et al., 2022). In other words, RPL4 plays a multifunctional role in regulating tumor cells and even slight alterations in RPL4 are bound to affect tumor cell survival.
Suppression of RPL4 expression enhanced TP-induced proliferation inhibition, cell cycle arrest, apoptosis, and invasion; in particular, when siRPL4-1 and siRPL4-4 were combined with TP, the effects of the knockdown of RPL4 protein were more obvious, and apoptotic induction and inhibition of invasion of NSCLC cells were more significant and stable. This could be because both siRPL4-4+TP and siRPL4-1+TP include siRPL4-1. Previous studies state that TP participates in the regulation of RNA splicing and mRNA surveillance pathways (Li et al., 2018). Moreover, TP regulates short-lived mRNA (Vispé et al., 2009) and affects small nuclear RNA (Liang et al., 2019). We thus hypothesize that TP enhances the interference effect of siRPL4-1 via RNA splicing and mRNA surveillance pathways. Besides, we believe that TP does not markedly enhance the interference effect of siRPL4-2 or siRPL4-3 because of differences in RNA sequences, steric hindrance, or other unknown mechanisms. The precise mechanism appears to be complex and further investigations are thus warranted.
Repression of RPL4 protein expression increased the capacity of TP to kill NSCLC cells and also enhanced the sensitivity of NSCLC cells to TP. Further, on exploring alterations in the MDM2-P53 pathway, downregulation of RPL4 protein expression increased the expression of MDM2, and TP treatment further enhanced this upregulation of MDM2 expression. He et al. (2016) reported that RPL4 interacts with MDM2 to suppress P53 ubiquitination and degradation, thus activating P53. Moreover, RPL4 overexpression promotes the binding of MDM2 to RPL5 and RPL11. He et al. (2016) also reported RPL4 as an innovative moderator of the MDM2-P53 pathway and that its balanced levels are pivotal for normal cell proliferation and growth. Herein, we also found that regardless of the increased or decreased expression of P53, its binding to MDM2 increased when RPL4 protein expression was downregulated; this binding was disrupted by treating with siRPL4–TP. Overall, a reduction in the binding of P53 to MDM2 was accompanied by an increase in P53 expression, supporting that MDM2 mediates P53 degradation (Wang and Chen, 2022). Similarly, RPL4 protein knockdown enhanced the binding of RPL4 to MDM2, although this binding was disrupted by siRPL4–TP. In this manner, TP seems to somewhat neutralize the effects of RPL4 on the MDM2-P53 pathway. We believe that siRPL4–TP alters RPL4 expression, which impairs ribosomal biosynthesis and ultimately triggers ribosomal stress. This leads to the accumulation of ribosome-free RPL4, which executes functions (such as binding to MDM2 to disrupt the MDM2-P53 pathway) other than ribosomal synthesis and protein translation (Pecoraro et al., 2021).
Herein RPL4 protein knockdown upregulated P53 expression in A549 cells and nearly eliminated P53 expression in PC9 cells. This agrees with the results of an earlier study, which reported that RPL4 knockdown induces P53 levels (He et al., 2016). Similarly, we found that compared with TP or siRPL4 alone, siRPL4–TP enhanced alterations in the expression of PARP1, c-PARP1, Snail, and cyclin D1. PARP1 is a substrate of caspase3, and c-PARP1 reportedly is associated with an increase in apoptosis levels (Chung et al., 2015); besides, PARP1 facilitates the P53 signaling response after ionizing radiation (Gajewski and Hartwig, 2020). Kumar et al. (2021) recently reported that PARP1 knockdown in H1299 cells caused an increase in epithelial markers and a decrease in mesenchymal markers, indicating that PARP1 is one of the nodes regulating apoptosis and siRPL4–TP-induced inhibition of cell invasion. Snail can orchestrate EMT and invasion of NSCLC cells (Park et al., 2021). PARP1 assists Snail1 in activating fibronectin transcription, a mesenchymal gene in epithelial cells undergoing EMT (Stanisavljevic et al., 2011). This indicates that Snail can simultaneously regulate apoptosis and EMT. Thus, we believe that Snail and PARP1 mediate siRPL4–TP-induced inhibition of cell invasion. Cyclin D1, an important cell cycle regulator, plays a vital role in cancer pathogenesis, and it serves as a molecular bridge between cell cycle, invasion, and proliferation (Montalto and De Amicis, 2020). Its overexpression has been related to the poor prognosis of breast cancer (Shi et al., 2020). The reduction of cyclin D1 expression in RPL4-repressed cells indicated its involvement in cell cycle arrest induced by siRPL4–TP. The reduction of RPL4 expression substantially enhanced the TP-activated MDM2-P53 pathway to regulate the expression of P53, cyclin D1, Snail, and c-PARP1, thereby enhancing the cycle arrest, apoptosis induction and metastasis inhibition of NSCLC by TP.
In conclusion, the downregulation of RPL4 protein inhibits the development of NSCLC cells and significantly strengthens the inhibitory effects of TP on these cells by disrupting the MDM2-P53 pathway and altering PARP1/Snail/cyclin D1 expression. Our findings improve the understanding of the mechanism of TP action and RPL4 on NSCLC cells and offer new views for TP-based therapeutic strategies for NSCLC.
Acknowledgement: None.
Funding Statement: This work was supported by the National Natural Science Foundation of China (Grant Nos. 82004007 and 81774026).
Author Contributions: The authors confirm their contribution to the paper as follows: JW and WW designed the experiments. NT, YZ, JM, and AY performed the experiments. NT analyzed the data. JW and WW wrote the manuscript. All authors have read and approved the final manuscript.
Availability of Data and Materials: All data generated or analyzed during this study are included in this published article (and its supplementary information files).
Ethics Approval: The Animal experiments were reviewed and approved by the Animal Experimentation Ethics Committee of the Zhejiang Academy of Traditional Chinese Medicine on February 18, 2022 (Approval no. 2022-006).
Conflicts of Interest: The authors declare that they have no conflicts of interest to report regarding the present study.
Supplementary Materials: The supplementary material is available online at https://doi.org/10.32604/biocell.2023.029269.
References
Bolstad BM, Irizarry RA, Astrand M, Speed TP (2003). A comparison of normalization methods for high density oligonucleotide array data based on variance and bias. Bioinformatics 19: 185–193. https://doi.org/10.1093/bioinformatics/19.2.185 [Google Scholar] [PubMed] [CrossRef]
Cao Z, Liu B, Li L, Lu P, Yan L, Lu C (2022). Detoxification strategies of triptolide based on drug combinations and targeted delivery methods. Toxicology 469: 153134. https://doi.org/10.1016/j.tox.2022.153134 [Google Scholar] [PubMed] [CrossRef]
Chung KS, Cheon SY, An HJ (2015). Effects of resveratrol on benign prostatic hyperplasia by the regulation of inflammatory and apoptotic proteins. Journal of Natural Products 78: 689–694. https://doi.org/10.1021/np500810c [Google Scholar] [PubMed] [CrossRef]
Deng QD, Lei XP, Zhong YH, Chen MS, Ke YY et al. (2021). Triptolide suppresses the growth and metastasis of non-small cell lung cancer by inhibiting β-catenin-mediated epithelial-mesenchymal transition. Acta Pharmacologica Sinica 42: 1486–1497. https://doi.org/10.1038/s41401-021-00657-w [Google Scholar] [PubMed] [CrossRef]
Egoh A, Nosuke Kanesashi S, Kanei-Ishii C, Nomura T, Ishii S (2010). Ribosomal protein L4 positively regulates activity of a c-myb proto-oncogene product. Genes to Cells 15: 829–841. https://doi.org/10.1111/j.1365-2443.2010.01421.x [Google Scholar] [PubMed] [CrossRef]
Elbe H, Yigitturk G, Cavusoglu T, Uyanikgil Y, Ozturk F (2020). Apoptotic effects of thymol, a novel monoterpene phenol, on different types of cancer. Bratislavske Lekarske Listy 121: 122–128. https://doi.org/10.4149/BLL_2020_016 [Google Scholar] [PubMed] [CrossRef]
Fu J, Bian L, Zhao L, Dong Z, Gao X, Luan H, Sun Y, Song H (2010). Identification of genes for normalization of quantitative real-time PCR data in ovarian tissues. Acta Biochimica et Biophysica Sinica 42: 568–574. https://doi.org/10.1093/abbs/gmq062 [Google Scholar] [PubMed] [CrossRef]
Gajewski S, Hartwig A (2020). PARP1 is required for ATM-mediated p53 activation and p53-mediated gene expression after ionizing radiation. Chemical Research in Toxicology 33: 1933–1940. https://doi.org/10.1021/acs.chemrestox.0c00130 [Google Scholar] [PubMed] [CrossRef]
He X, Li Y, Dai MS, Sun XX (2016). Ribosomal protein L4 is a novel regulator of the MDM2-p53 loop. Oncotarget 7: 16217–16226. https://doi.org/10.18632/oncotarget.7479 [Google Scholar] [PubMed] [CrossRef]
He JY, Liu X, Qi ZH, Wang Q, Lu WQ, Zhang QT, He SY, Wang ZD (2020). Small nucleolar RNA, C/D box 16 (SNORD16) acts as a potential prognostic biomarker in colon cancer. Dose-Response 18: 1559325820917829. https://doi.org/10.1177/1559325820917829 [Google Scholar] [PubMed] [CrossRef]
He X, Zhang J (2006). Why do hubs tend to be essential in protein networks? PLoS Genetics 2: e88. https://doi.org/10.1371/journal.pgen.0020088 [Google Scholar] [PubMed] [CrossRef]
Huang J, Li JX, Ma LR, Xu DH, Wang P et al. (2022). Traditional herbal medicine: A potential therapeutic approach for adjuvant treatment of non-small cell lung cancer in the future. Integrative Cancer Therapies 21: 15347354221144312. https://doi.org/10.1177/15347354221144312 [Google Scholar] [PubMed] [CrossRef]
Huber FM, Hoelz A (2017). Molecular basis for protection of ribosomal protein L4 from cellular degradation. Nature Communications 8: 14354. https://doi.org/10.1038/ncomms14354 [Google Scholar] [PubMed] [CrossRef]
Kumar M, Jaiswal RK, Prasad R, Yadav SS, Kumar A, Yadava PK, Singh RP (2021). PARP-1 induces EMT in non-small cell lung carcinoma cells via modulating the transcription factors Smad4, p65 and ZEB1. Life Sciences 269: 118994. https://doi.org/10.1016/j.lfs.2020.118994 [Google Scholar] [PubMed] [CrossRef]
Kupchan SM, Court WA, DaileyJr RG, Gilmore CJ, Bryan RF (1972). Triptolide and tripdiolide, novel antileukemic diterpenoid triepoxides from Tripterygium wilfordii. Journal of the American Chemical Society 94: 7194–7195. https://doi.org/10.1021/ja00775a078 [Google Scholar] [PubMed] [CrossRef]
Lan T, Yuan K, Yan X, Xu L, Liao H et al. (2019). LncRNA SNHG10 facilitates hepatocarcinogenesis and metastasis by modulating its homolog SCARNA13 via a positive feedback loop. Cancer Research 79: 3220–3234. https://doi.org/10.1158/0008-5472.CAN-18-4044 [Google Scholar] [PubMed] [CrossRef]
Li F, Cui H, Jin X, Gong X, Wang W, Wang J (2020). Triptolide inhibits epithelial‐mesenchymal transition and induces apoptosis in gefitinib‐resistant lung cancer cells. Oncology Reports 43: 1569–1579. https://doi.org/10.3892/or.2020.7542 [Google Scholar] [PubMed] [CrossRef]
Li F, Zhao D, Yang S, Wang J, Liu Q, Jin X, Wang W (2018). ITRAQ-based proteomics analysis of triptolide on human A549 lung adenocarcinoma cells. Cellular Physiology and Biochemistry 45: 917–934. https://doi.org/10.1159/000487286 [Google Scholar] [PubMed] [CrossRef]
Liang X, Xie R, Su J, Ye B, Wei S, Liang Z, Bai R, Chen Z, Li Z, Gao X (2019). Inhibition of RNA polymerase III transcription by triptolide attenuates colorectal tumorigenesis. Journal of Experimental & Clinical Cancer Research 38: 217. https://doi.org/10.1186/s13046-019-1232-x [Google Scholar] [PubMed] [CrossRef]
Liu Q (2011). Triptolide and its expanding multiple pharmacological functions. International Immunopharmacology 11: 377–383. https://doi.org/10.1016/j.intimp.2011.01.012 [Google Scholar] [PubMed] [CrossRef]
Molavi G, Samadi N, Hosseingholi EZ (2019). The roles of moonlight ribosomal proteins in the development of human cancers. Journal of Cellular Physiology 234: 8327–8341. https://doi.org/10.1002/jcp.27722 [Google Scholar] [PubMed] [CrossRef]
Montalto FI, De Amicis F (2020). Cyclin D1 in cancer: A molecular connection for cell cycle control, adhesion and invasion in tumor and stroma. Cells 9: 2648. https://doi.org/10.3390/cells9122648 [Google Scholar] [PubMed] [CrossRef]
Nait SS, Marcel V, Fenouil T, Catez F, Saurin JC, Bouvet P, Diaz JJ, Mertani HC (2020). Ribosome biogenesis alterations in colorectal cancer. Cells 9: 2361. https://doi.org/10.3390/cells9112361 [Google Scholar] [PubMed] [CrossRef]
Noel P, von Hoff DD, Saluja AK, Velagapudi M, Borazanci E, Han H (2019). Triptolide and its derivatives as cancer therapies. Trends in Pharmacological Sciences 40: 327–341. https://doi.org/10.1016/j.tips.2019.03.002 [Google Scholar] [PubMed] [CrossRef]
Park JH, Moon M, Kim JS, Oh SM (2021). TOPK mediates hypoxia-induced epithelial-mesenchymal transition and the invasion of nonsmall-cell lung cancer cells via the HIF-1α/snail axis. Biochemical and Biophysical Research Communications 534: 941–949. https://doi.org/10.1016/j.bbrc.2020.10.068 [Google Scholar] [PubMed] [CrossRef]
Pecoraro A, Pagano M, Russo G, Russo A (2021). Ribosome biogenesis and cancer: Overview on ribosomal proteins. International Journal of Molecular Sciences 22: 5496. https://doi.org/10.3390/ijms22115496 [Google Scholar] [PubMed] [CrossRef]
Penzo M, Montanaro L, Treré D, Derenzini M (2019). The ribosome biogenesis-cancer connection. Cells 8: 55. https://doi.org/10.3390/cells8010055 [Google Scholar] [PubMed] [CrossRef]
Pillet B, Garcia-Gomez JJ, Pausch P, Falquet L, Bange G, de la Cruz J, Kressler D (2015). The dedicated chaperone Acl4 escorts ribosomal protein Rpl4 to its nuclear pre-60S assembly site. PLoS Genetics 11: e1005565. https://doi.org/10.1371/journal.pgen.1005565 [Google Scholar] [PubMed] [CrossRef]
Russo A, Russo G (2017). Ribosomal proteins control or bypass p53 during nucleolar stress. International Journal of Molecular Sciences 18: 140. https://doi.org/10.3390/ijms18010140 [Google Scholar] [PubMed] [CrossRef]
Salzillo A, Ragone A, Spina A, Naviglio S, Sapio L (2023). Forskolin affects proliferation, migration and paclitaxel-mediated cytotoxicity in non-small-cell lung cancer cell lines via adenylyl cyclase/cAMP axis. European Journal of Cell Biology 102: 151292. https://doi.org/10.1016/j.ejcb.2023.151292 [Google Scholar] [PubMed] [CrossRef]
Shi Q, Li Y, Li S, Jin L, Lai H et al. (2020). LncRNA DILA1 inhibits Cyclin D1 degradation and contributes to tamoxifen resistance in breast cancer. Nature Communications 11: 5513. https://doi.org/10.1038/s41467-020-19349-w [Google Scholar] [PubMed] [CrossRef]
Stanisavljevic J, Porta-de-la-Riva M, Batlle R, de Herreros AG, Baulida J (2011). The p65 subunit of NF-κB and PARP1 assist Snail1 in activating fibronectin transcription. Journal of Cell Science 124: 4161–4171. https://doi.org/10.1242/jcs.078824 [Google Scholar] [PubMed] [CrossRef]
Thai AA, Solomon BJ, Sequist LV, Gainor JF, Heist RS (2021). Lung cancer. Lancet 398: 535–554. https://doi.org/10.1016/S0140-6736(21)00312-3 [Google Scholar] [PubMed] [CrossRef]
Vispé S, DeVries L, Créancier L, Besse J, Bréand S et al. (2009). Triptolide is an inhibitor of RNA polymerase I and II-dependent transcription leading predominantly to down-regulation of short-lived mRNA. Molecular Cancer Therapeutics 8: 2780–2790. https://doi.org/10.1158/1535-7163.MCT-09-0549 [Google Scholar] [PubMed] [CrossRef]
Wang S, Chen FE (2022). Small-molecule MDM2 inhibitors in clinical trials for cancer therapy. European Journal of Medicinal Chemistry 236: 114334. https://doi.org/10.1016/j.ejmech.2022.114334 [Google Scholar] [PubMed] [CrossRef]
Wang J, Zhang ZQ, Li FQ, Chen JN, Gong X, Cao BB, Wang W (2020). Triptolide interrupts rRNA synthesis and induces the RPL23‐MDM2‐p53 pathway to repress lung cancer cells. Oncology Reports 43: 1863–1874. https://doi.org/10.3892/or.2020.7569 [Google Scholar] [PubMed] [CrossRef]
Wei J, Yan Y, Chen X, Qian L, Zeng S, Li Z, Dai S, Gong Z, Xu Z (2019). The roles of plant-derived triptolide on non-small cell lung cancer. Oncology Research 27: 849–858. https://doi.org/10.3727/096504018X15447833065047 [Google Scholar] [PubMed] [CrossRef]
Yan P, Sun X (2018). Triptolide: A new star for treating human malignancies. Journal of Cancer Research and Therapeutics 14: S271–S275. https://doi.org/10.4103/0973-1482.235340 [Google Scholar] [PubMed] [CrossRef]
Yang S, Li X, Dou H, Hu Y, Che C, Xu D (2020). Sesamin induces A549 cell mitophagy and mitochondrial apoptosis via a reactive oxygen species-mediated reduction in mitochondrial membrane potential. The Korean Journal of Physiology & Pharmacology 24: 223–232. https://doi.org/10.4196/kjpp.2020.24.3.223 [Google Scholar] [CrossRef]
Yang X, Sun L, Wang L, Yao B, Mo H, Yang W (2019). LncRNA SNHG7 accelerates the proliferation, migration and invasion of hepatocellular carcinoma cells via regulating miR-122-5p and RPL4. Biomedicine & Pharmacotherapy = Biomédecine & Pharmacothérapie 118: 109386. https://doi.org/10.1016/j.biopha.2019.109386 [Google Scholar] [PubMed] [CrossRef]
Yao C, Su L, Zhang F, Zhu X, Zhu Y et al. (2020). Thevebioside, the active ingredient of traditional Chinese medicine, promotes ubiquitin-mediated SRC-3 degradation to induce NSCLC cells apoptosis. Cancer Letters 493: 167–177. https://doi.org/10.1016/j.canlet.2020.08.011 [Google Scholar] [PubMed] [CrossRef]
Yoon SY, Kim JM, Oh JH, Jeon YJ, Lee DS et al. (2006). Gene expression profiling of human HBV- and/or HCV-associated hepatocellular carcinoma cells using expressed sequence tags. International Journal of Oncology 29: 315–327. https://doi.org/10.3892/ijo.29.2.315 [Google Scholar] [CrossRef]
You A, Tian W, Yuan H, Gu L, Zhou J, Deng D (2022). TTC22 promotes m6A-mediated WTAP expression and colon cancer metastasis in an RPL4 binding-dependent pattern. Oncogene 41: 3925–3938. https://doi.org/10.1038/s41388-022-02402-x [Google Scholar] [PubMed] [CrossRef]
Zhang D, Jin Q, Jiang C, Gao M, Ni Y, Zhang J (2020). Imaging cell death: Focus on early evaluation of tumor response to therapy. Bioconjugate Chemistry 31: 1025–1051. https://doi.org/10.1021/acs.bioconjchem.0c00119 [Google Scholar] [PubMed] [CrossRef]
Zhu J, Wang H, Chen F, Lv H, Xu Z, Fu J, Hou Y, Xu Y, Pi J (2018). Triptolide enhances chemotherapeutic efficacy of antitumor drugs in non-small-cell lung cancer cells by inhibiting Nrf2-ARE activity. Toxicology and Applied Pharmacology 358: 1–9. https://doi.org/10.1016/j.taap.2018.09.004 [Google Scholar] [PubMed] [CrossRef]
Zou M, Zhang X, Jiang D, Zhao Y, Wu T, Gong Q, Su H, Wu D, Moreland L, Li G (2020). Transcriptional regulation of CD40 expression by 4 ribosomal proteins via a functional SNP on a disease-associated CD40 locus. Genes 11: 1526. https://doi.org/10.3390/genes11121526 [Google Scholar] [PubMed] [CrossRef]
Cite This Article
 Copyright © 2023 The Author(s). Published by Tech Science Press.
This work is licensed under a Creative Commons Attribution 4.0 International License , which permits unrestricted use, distribution, and reproduction in any medium, provided the original work is properly cited.
 Downloads
 Citation Tools