
 Submit a Paper
 Propose a Special lssue
 Open Access
ARTICLE

Designing a risk prognosis model based on natural killer cell-linked genes to accurately evaluate the prognosis of gastric cancer
Department of Gastroenterology, Zibo Central Hospital, Zibo, 255036, China
* Corresponding Author: QING JIA. Email:
BIOCELL 2023, 47(9), 2081-2099. https://doi.org/10.32604/biocell.2023.029986
Received 20 March 2023; Accepted 24 May 2023; Issue published 28 September 2023
 View Full Text
 Download PDF
Abstract
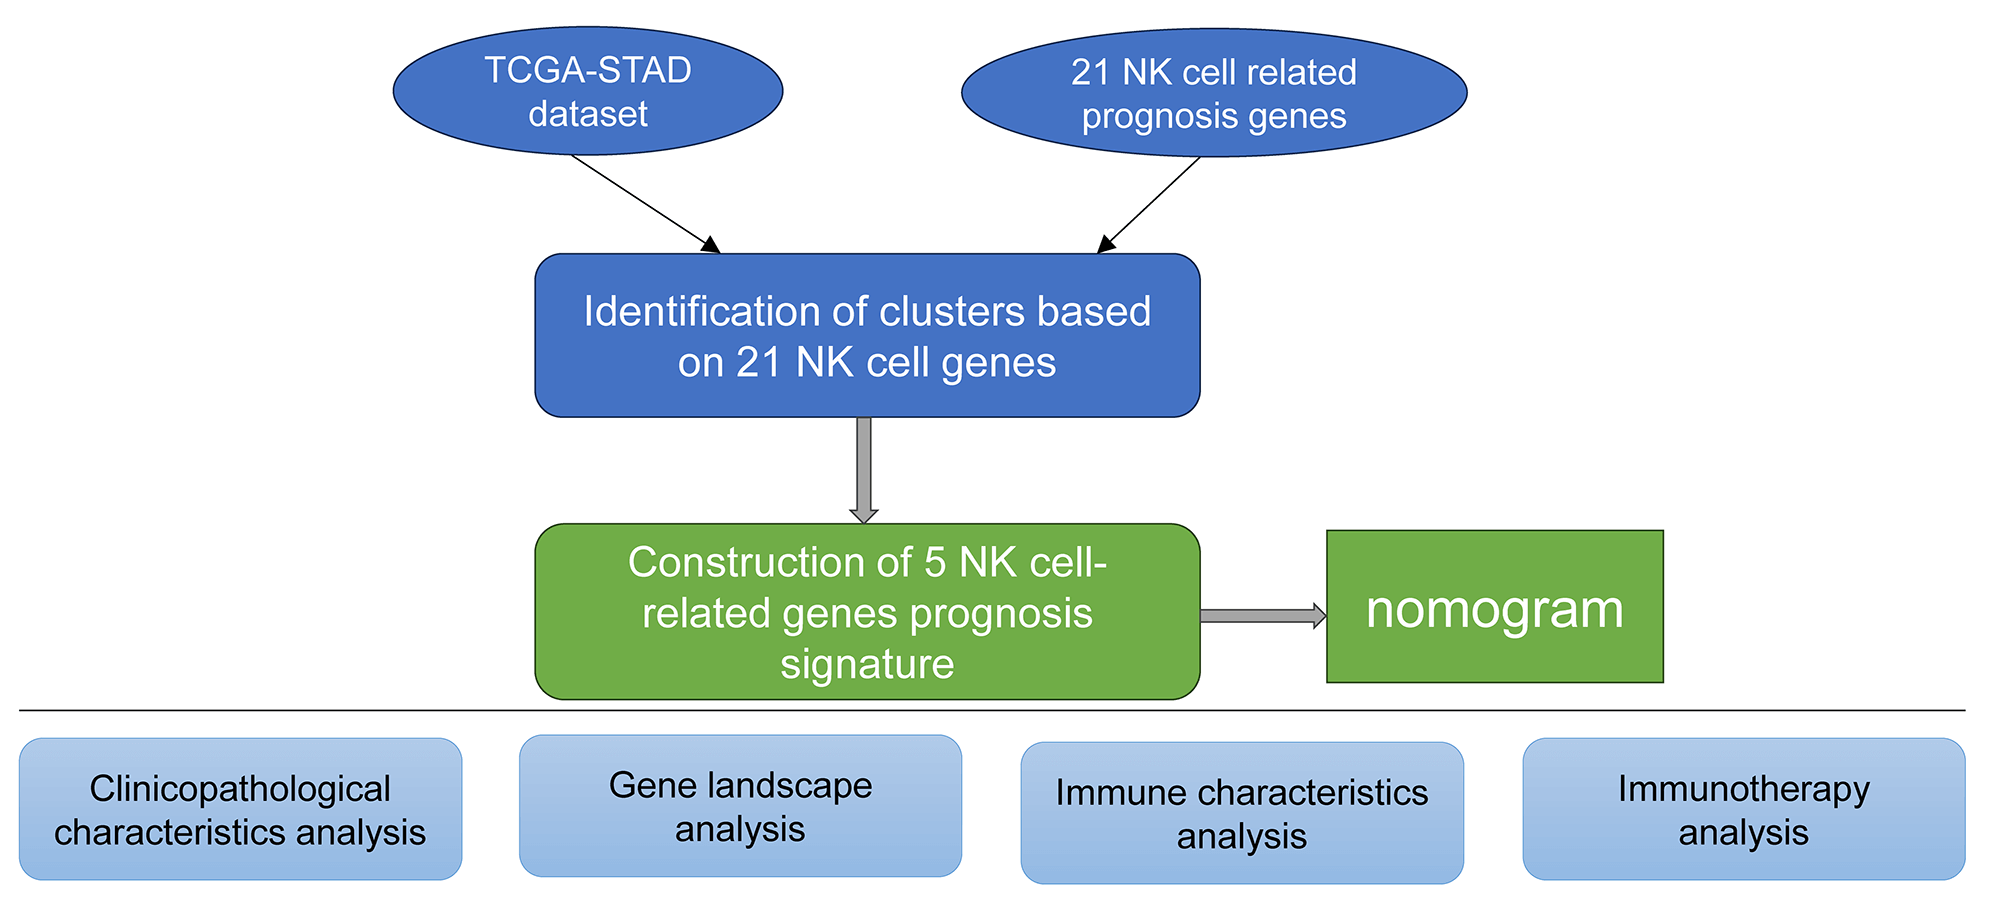
Background: This study was aimed at identifying natural killer (NK) cell-related genes to design a risk prognosis model for the accurate evaluation of gastric cancer (GC) prognosis. Methods: We obtained NK cell-related genes from various databases, followed by Cox regression analysis and molecular typing to identify prognostic genes. Various immune algorithms and enrichment analyses were used to investigate the mutations, immune status, and pathway variations among different genotypes. The key prognostic genes were assessed using the least absolute shrinkage and selection operator (Lasso) regression analysis and univariate Cox regression analysis. Thereafter, the risk score (RS) prognosis model was constructed based on the selected important prognostic genes. A Receiver Operating Characteristics (ROC) curve was plotted for analyzing the robustness of the model. Subsequently, the decision and calibration curves were used for assessing the reliability and prediction accuracy of the proposed model. The ‘pRRophetic’ R software package was utilized for predicting the half-maximal inhibitory concentration (IC50) of immunotherapy and chemotherapy drugs. Results: We screened 21 prognostic genes and three molecular subtypes and found that the C1 subtype had the worst prognosis. Further, the pathways promoting tumor proliferation, such as epithelial-mesenchymal transition were significantly up-regulated. The results also showed that the macrophages in the M2 stage were significantly infiltrated in the C1 subtype, and there was significant overexpression in the C1 subtype, accompanied by a severe inflammatory reaction. The C1 was highly sensitive to drugs like 5-fluorouracil and paclitaxel. The ROC, calibration curve, and decision curve showed that the risk model was robust and strongly reliable. Conclusion: Overall, our proposed NK cell-related RS model can be used as a more accurate prediction index for GC patients, providing a valuable contribution to personalized medicine.Graphic Abstract
Keywords
Gastric cancer (GC) is emerging as a major risk factor in human disease around the world. About 19 million new and confirmed cases of cancer occur each year around the globe, resulting in about 10 million death annually. Out of these cases, 1.08 million cases are GC, which is attributed to the mortality of approximately 800,000 cases annually (Sung et al., 2021). The risk factors of GC includincludede Helicobacter pylori, EB virus, unhealthy eating habits, and lifestyle (Eusebi et al., 2020, Petryszyn et al., 2020). Despite recent advancements in GC diagnosis and treatment, its incidence and mortality rates are still increasing, and the five-year OS rate remains significantly poor (Allemani et al., 2018). Such an increased risk of recurrence is caused by higher proliferation rates and widespread metastasis of GC cells, which makes treatment more challenging. At present, the main treatment for GC in the initial stages is to remove the primary tumor, while chemotherapy is still the main choice for advanced GC. However, using medications more frequently or in higher doses has substantial negative side effects and is also accompanied by significant drug resistance (Auberger et al., 2020). This has led to the readjustment of the human immune system, and restoring its system of killing tumor cells emerging as an option in research. For example, NK cells can directly bind tumor cells and kill them.
In the human body, the first-line defense consists of physical, chemical, and cellular defense systems to prevent pathogens and transformed cells from invading or spreading the whole body. NK cells of the Innate Lymphocyte (ILC) family play a significant role in this defense of eliminating tumor cells and controlling viral infections. Common NK/T cell precursors and lymphoid progenitor cells are from where NK cells originate from the pluripotent hematopoietic stem cells in the bone marrow (Raskov et al., 2021). Natural lymphocytes, which are a component of the innate immune system, are crucial for immunological monitoring and offer a subsequent host defense barrier against infectious viral or malignant cells. NK cells make up 8%–20% of the circulating lymphocytes in the human body, while they account for 2%–5% of the spleen and myelolymphocytes in laboratory inbred mice (Cooper et al., 2001). Compared to other lymphocytic cells such as T cells, B cells, and natural killer T cells (NKT), the NK cells do not express clonal B cell receptors, T cell receptors/CD3ε complex, or other antigen-specific receptors. Further, the NK cell functions are not dependent on the antigens, i.e., they often do not produce immunological memory or long-lasting protective immunity. Recent research has demonstrated that NK cells are promising therapeutic targets that can be used for cancer treatment (Guillerey et al., 2016). However, the prognostic and immune status evaluation of GC based on natural killer cell-related genes is still rare.
It is believed that chronic inflammation contributes to the formation of tumors and is regarded as a major characteristic of cancer. Cancer-initiating mutations can trigger such cancer-associated inflammation and accelerate the growth of tumors by accumulating and activating the inflammatory cells and inflammation-linked pathways. It is also well-recognized that both exogenous and endogenous inflammation can result in an immunosuppressive tumor microenvironment (TME) that offers an ideal setting for the growth of tumors. When an inflammatory TME is developed, inflammatory mediators produced by tumor cells or stromal cells promote cell growth and extend cell survival by activating the oncogenes, subsequently inactivating tumor suppressor genes (Zhao et al., 2021).
Given this background, it is warranted to study the pro-cancer inflammation and pathways mediated by NK cells in GC. This work developed a stable molecular subtyping approach and a stable risk prognosis model through NK cell-related genes, providing an accurate prediction model for GC patients and personalized treatment.
Collection and pre-processing of the data
The analysis of this study was supported by the Sangerbox tool (http://vip.sangerbox.com/) (Shen et al., 2022). The GDC-API was used for downloading all the Copy Number Variation (CNV), RNA-Seq, and mutation data from The Cancer Genome Atlas-Stomach Adenocarcinoma (TCGA-STAD) dataset. The expression data of GSE62254 and GSE15459 data were obtained from the Gene Expression Omnibus (GEO) cohort. In this study, TCGA-STAD was employed as a training dataset, whereas the GSE62254 and GSE15459 datasets were independent verification sets. All data without additional clinical and follow-up information, overall survival (OS) time, or status from the TCGA-STAD dataset were eliminated, while the data samples with an OS value ≥30 days were retained. The gene symbol was created from Ensembl. The annotation data for the associated chip platform was retrieved from the GEO dataset. The probe was mapped to the gene in accordance with the annotation data, and the probe that matched several genes was eliminated. If more than one probe had been found to match a particular gene, the average value was taken into account as a measure of gene expression. Subsequently, a total of 337 primary tumor samples from the TCGA-STAD dataset were included in the study. The expression data of GSE62254 and GSE15459 were obtained from the GEO database. We finally included 300 and 182 GC samples from GSE62254 and GSE15459, respectively.
Source of natural killer cell-linked genes
We retrieved the NK cell-linked gene information from immport (https://www.immport.org/shared/home), including the data on 18 NK_ Cell-associated pathways from the Molecular Signature Database (MSigDB) (Liberzon et al., 2015). Furthermore, the NK cell module from the LM22 database (Newman et al., 2015) was also selected. We finally retained 79 NK cell-related genes for analysis.
Prognostic gene correlation analysis
The expression of NK cell-associated genes was acquired from the TCGA-STAD expression matrix. The Coxph function of R with threshold value p < 0.05 was used in univariate Cox regression analysis. All the NK cell genes significantly linked to the GC prognosis were obtained.
Molecular subtyping of natural killer cell-linked genes
The consistent matrix was constructed by the ConsensusClusterPlus R package (Wilkerson and Hayes, 2010) based on the expression data of NK cell-linked genes. Using the “km” algorithm and “1-Pearson correlation” as the distance metric, 500 bootstraps were performed, with each bootstrap step employing 80% of all the GC patients in the training set. The optimal classification was determined after estimating the Cumulative Distribution Function (CDF) value and consistent matrix that determined the molecular subtype for each sample. The cluster number ranged between 2 and 10.
Analysis of pathways amongst different subtypes
Next, various molecular subtypes were examined for the presence of differentially activated pathways. The candidate gene sets in a Hallmark database were subjected to the Gene Set Enrichment Analysis (GSEA) (Liberzon et al., 2015). A significant enrichment value was defined when the False Discovery Rate (FDR) was <0.05.
Differences in immune infiltration and chemotherapy amongst various molecular subtypes
The relative abundance of 22 immune cell types was determined using CIBERSORT (https://cibersort.stanford.edu/) (Chen et al., 2018). The immune infiltration was analyzed by ESTIMATE (Yoshihara et al., 2013). In a previous report, Jiang et al. (2018) employed the Tumor Immune Dysfunction and Exclusion (TIDE) program (http://tide.dfci.harvard.edu/) to estimate the expected clinical impact of immunotherapy in the identified high and low groups. Further, it was noted when the TIDE score increased, the probability of immune escape increased, which indicated less immunotherapy benefit to patients (Pan et al., 2018). In addition, seven metagenes clusters related to inflammation were collected to evaluate the level of inflammatory activity in different subtypes. In immune regulation, interferon-gamma (IFN-γ) is an important cytokine molecule that functions in anti-cancer immunity. We acquired the GOBP_RESPONSE_ TO_INTERFERON_GAMMA gene set from the Gene Ontology (GO) database, and used it for single sample GSEA (ssGSEA) (Hänzelmann et al., 2013). The immune cytolytic activity (CYT) score was utilized to reflect the cytotoxicity of different subtypes. Additionally, the T-cell–inflamed gene expression profile (GEP) score was used for assessing various molecular subtypes in relation to cancer immunotherapy in terms of predictive significance. The ‘pRRophetic’ R software package was employed for calculating the IC50 value of various drug molecules, including cisplatin, paclitaxel, docetaxel, and 5-fluorouracil (Geeleher et al., 2014).
Differential analysis among the molecular typing, enrichment analysis, and construction of the risk model
The differentially expressed NK cell genes among the subtypes were selected by the identified molecular subtypes (FDR < 0.05 and |log2FC|>1.5)). Limma software was employed for assessing the DEGs in the subtypes, i.e., C1 vs. other subtypes, C2 vs. other subtypes, and C3 vs. other subtypes, and the DEGs showing significant relation to GC prognosis were selected (p < 0.05). In addition, the ‘clusterProfiler’ R software package was employed for analyzing the functional enrichment of the DEGs in C1 vs. others, C2 vs. others, and C3 vs. others (Yu et al., 2012). Subsequently, the Lasso analysis was used for lowering the number of genes. Stepwise multivariate regression analysis was then carried out based on the results of the Lasso analysis. The stepwise regression uses the Akachi Information Criterion (AIC) for analysis and considers the statistical fitting of a model as well as the parameter number utilized for the fitting. The stepAIC technique in the MASS package uses the most complicated model in Step 1, successively deletes a variable for decreasing the AIC value, and finally acquires the prognostic significant genes linked to the NK cell phenotype (Zhang, 2016). The risk score (RS) of each patient was assessed using the formula: RS = Σβi × Expi). Here, Expi refers to a gene expression level associated with the genetic characteristics of the prognosis of the NK cell phenotypes, and βi indicates the Cox regression coefficient for the corresponding gene. Based on the threshold “0”, the patients were categorized into low-risk and high-risk categories. The Kaplan Meier (KM) curve was used for plotting the survival curve for analyzing the patient prognosis, while the log-rank test was employed for assessing significant differences. Further, the ‘timeROC’ R software package was utilized to analyze the ROC of the prognostic classification of the model (Blanche et al., 2013). The classification efficiency for the prognostic prediction within 1 year, 2 years, and 3 years were analyzed.
Molecular subtyping using the natural killer cell-linked genes
The expression matrices of TCGA-STAD were used to extract the NK-cell-linked expression levels. Univariate Cox regression analysis of the 27 NK-related genes revealed 21 NK cell genes significantly associated with the GC prognosis (Fig. 1A, p < 0.05). The relationship among these 21 NK cell-linked genes was then investigated and interactions among the 21 NK cells were detected (Fig. 1B). The gene expression patterns of the 21 NK cells with a significant link to GC prognosis were then utilized to categorize the patients using consistent clustering, with the CDF calculating the ideal number of clusters. When the Cluster number was set to 3, the CDF Delta area curve revealed that the clustering findings were mainly robust. We set k = 3 to create three unique molecular subtypes with significant prognostic characteristics (Figs. 1C–1E). In general, C3 had the best prognosis, followed by C2 and C1 (Fig. 1F). Additionally, the GSE62254 data were subjected to molecular subtyping using the same procedure, and it was shown that these three molecular types had significantly different prognoses, which was similar to the TCGA-STAD analysis (Fig. 1G).
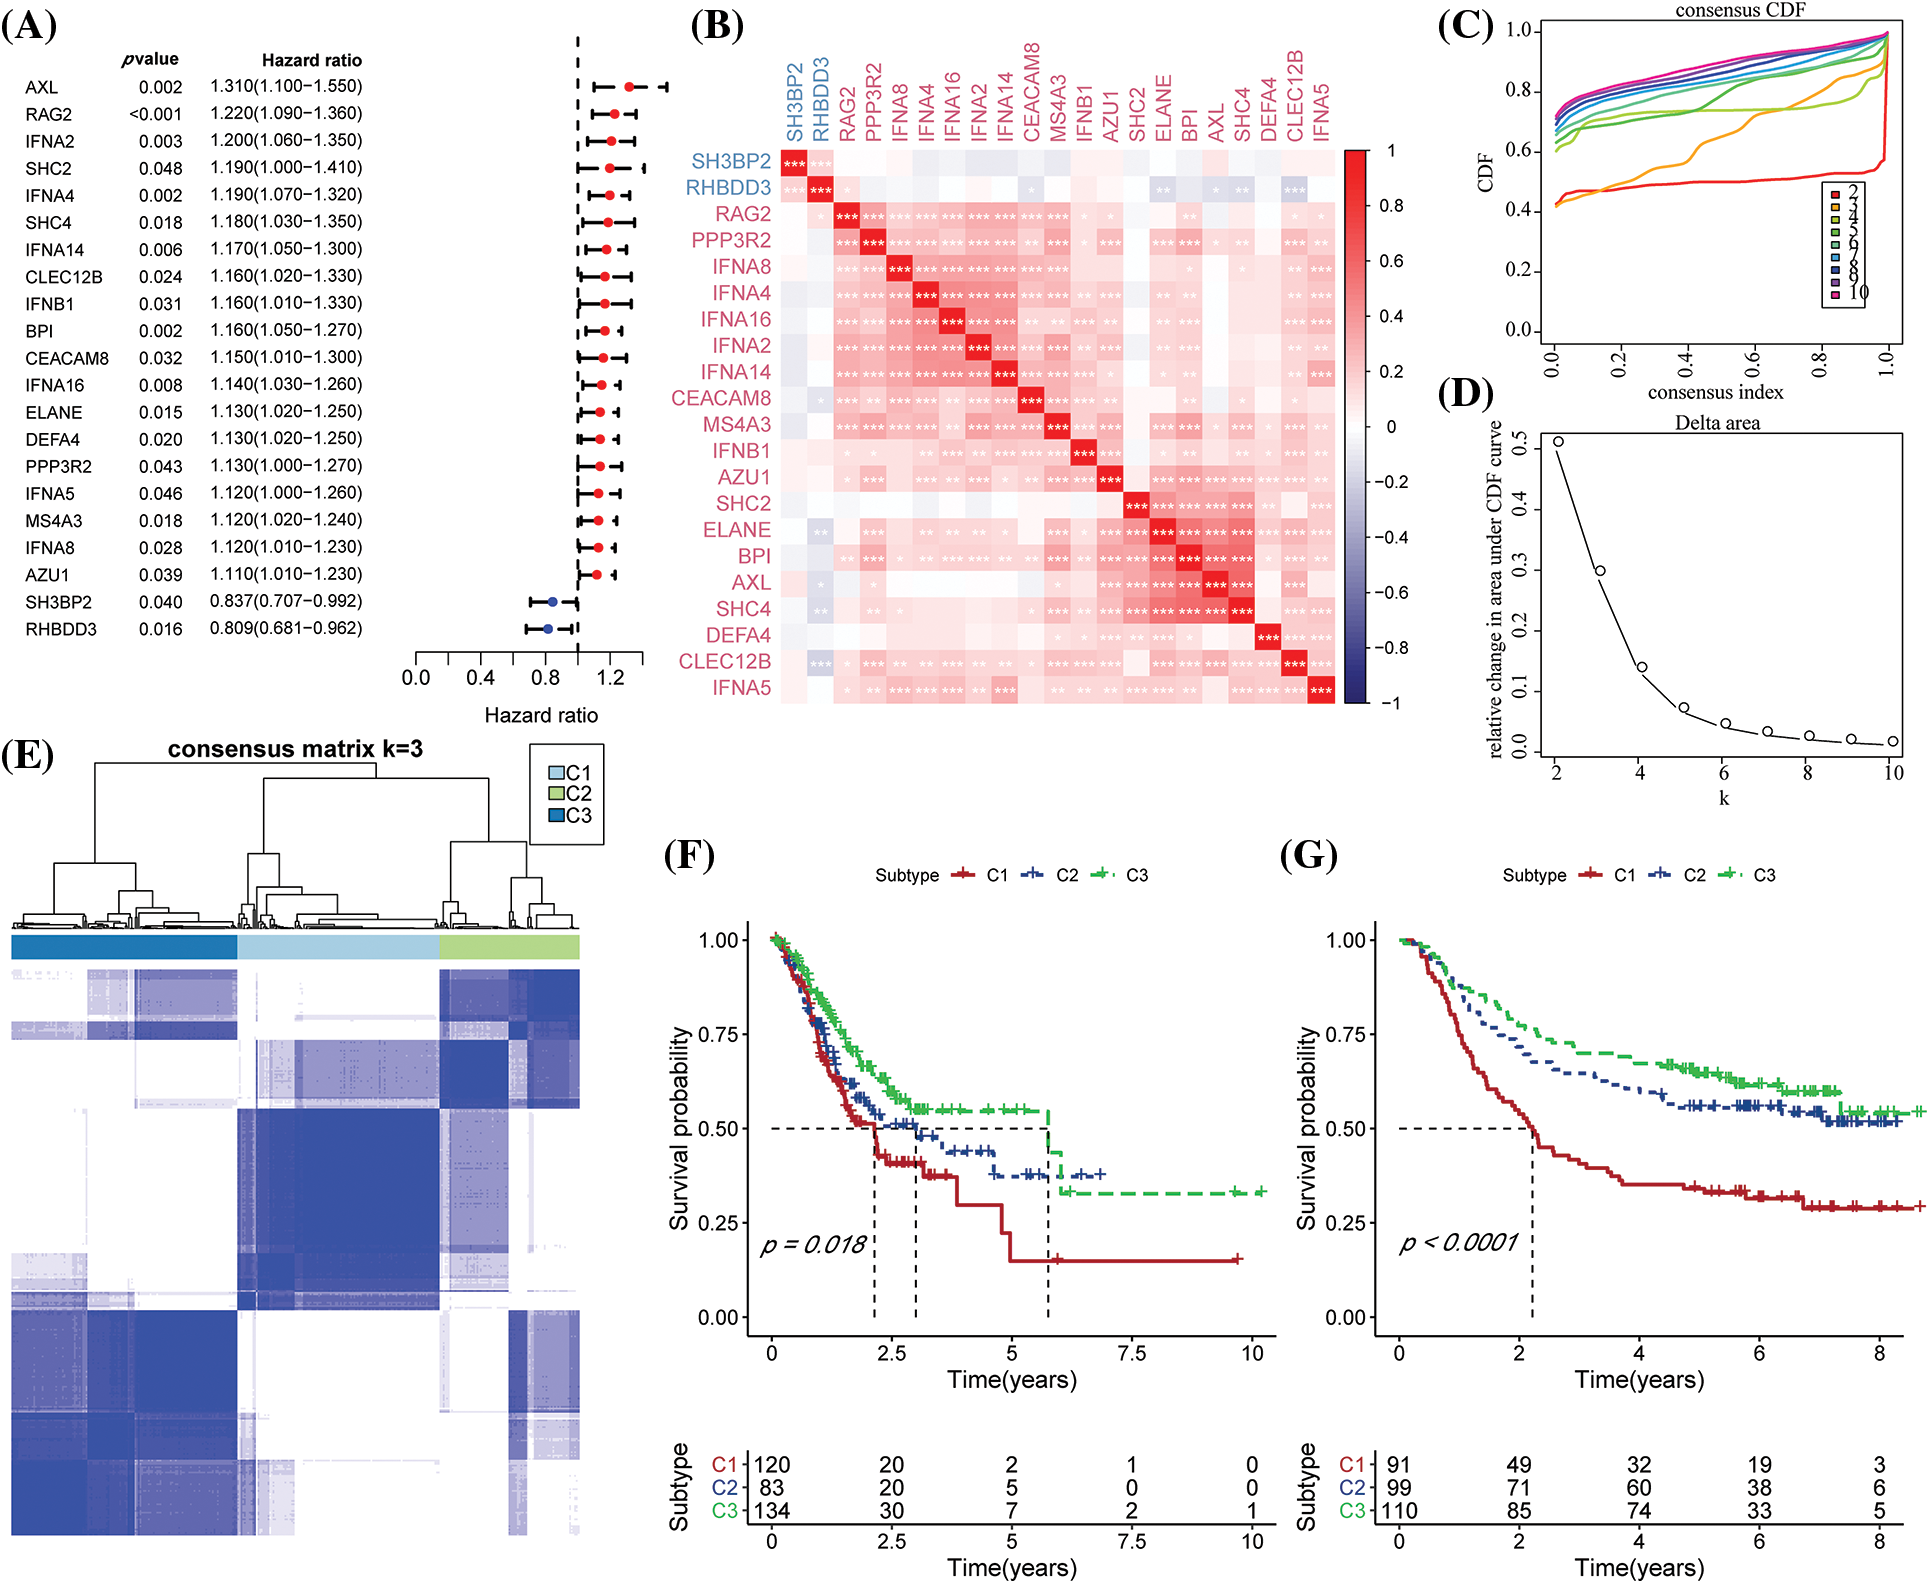
Figure 1: Molecular typing based on the natural killer (NK) cell-linked prognostic genes. (A) Forest map of NK cell-linked genes with a significant prognosis in The Cancer Genome Atlas-Stomach Adenocarcinoma (TCGA-STAD) dataset; (B) Univariate Cox significant correlation of NK cell gene expression in TCGA-STAD dataset; (C) CDF curves for TCGA-STAD samples; (D) CDF Delta curves for TCGA-STAD samples. Delta area curves were plotted using consensus clustering, which showed a relative variation in the area under the cumulative distribution function (CDF) curve for every category number (k), in comparison to k-1. The X-axis indicates the value of k, while the Y-axis denotes the relative changes in the CDF-area under the curve (AUC); (E) Cluster heat maps for the samples when k = 3 in TCGA-STAD; (F) KM curves for the OS prognosis of 3 subtypes in the TCGA-STAD dataset; (G) Differences in the prognosis among the three molecular subtypes in the GSE62254 dataset.
Clinicopathological characteristics among molecular subtypes
We examined the distribution of the clinical features in each molecular subtype in the TCGA-STAD dataset to analyze clinical characteristics among the molecular subtypes. It was found that the number of patients with the N stage of N3 in the C1 subtype increased significantly, while the number of patients with the M1 stage in the M stage increased significantly. In addition, it was found that for the T stage, among C1 subtypes with poor prognosis, patients with T stages of T2, T3, and T4 were significantly higher compared to the C2 and C3 molecular subtypes. As for the pathological stage, stages II, III, and IV patients in the C1 subtype were significantly higher compared to C2 and C3 molecular subtypes. At the same time, the C1 subtype included GC patients younger than 60 years of age. More importantly, no significant difference was noted in the C1, C2, and C3 subtypes (Fig. 2A). The differences among different molecular subtypes and clinical information in GSE62254 data were also compared, and the results were consistent with the TCGA-STAD analysis outcomes (Fig. 2B).
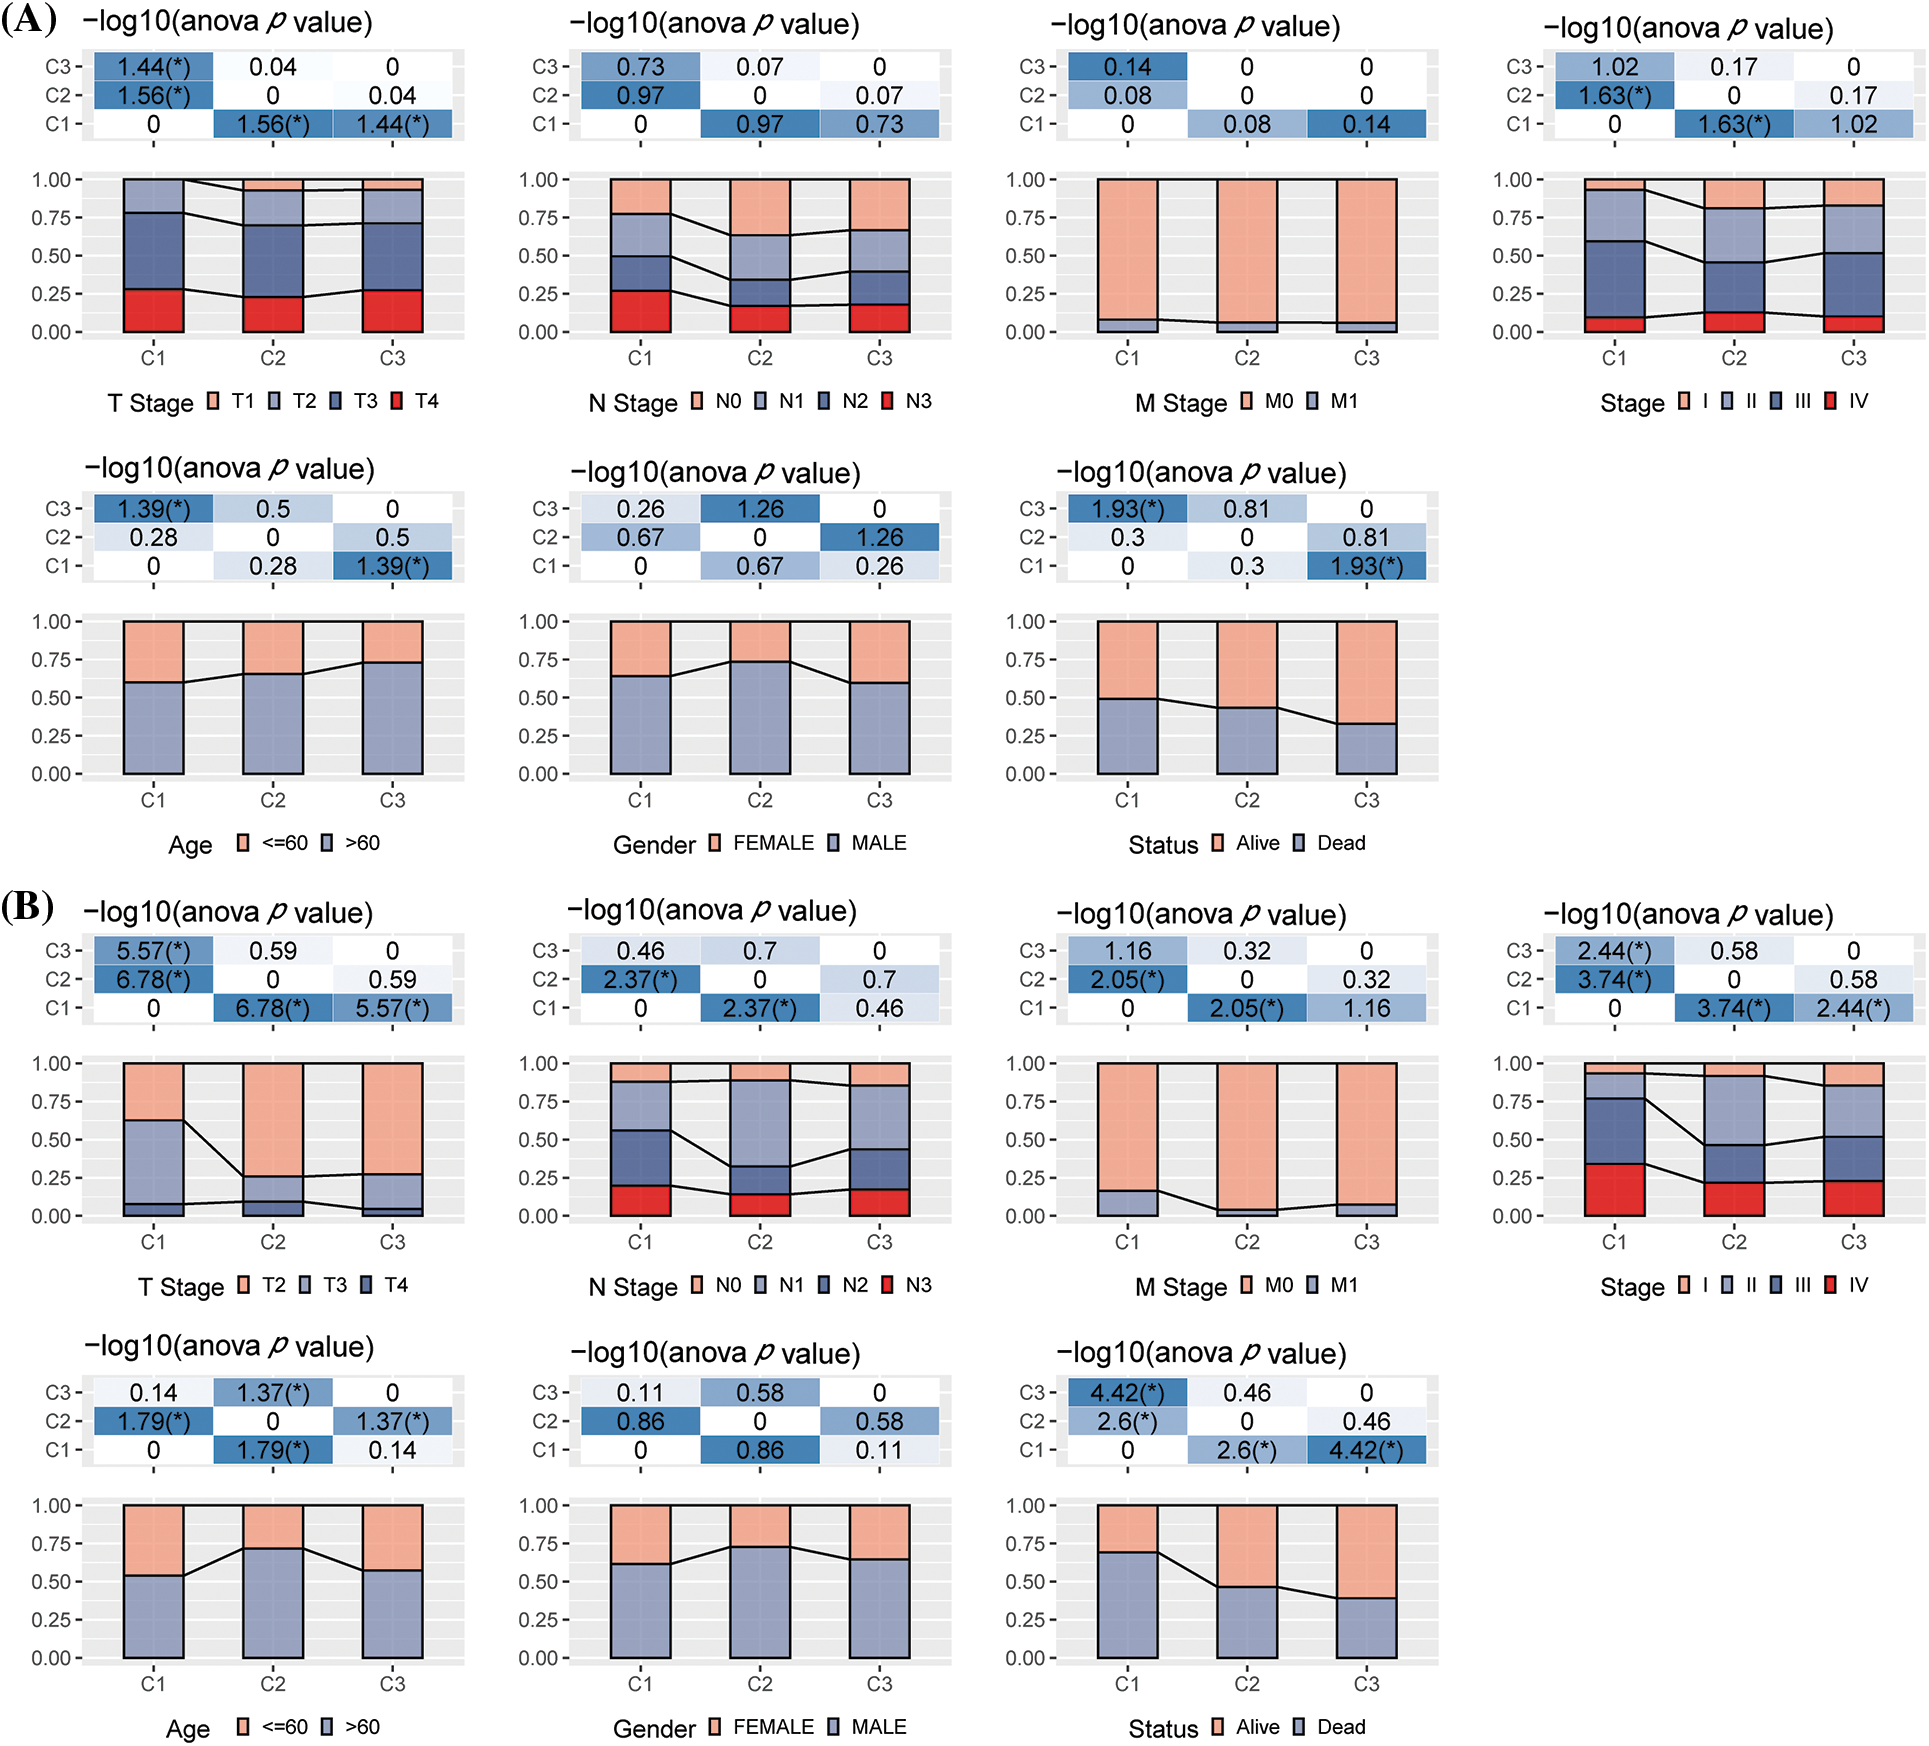
Figure 2: The differences in clinical characteristics among different molecular types. (A) Clinicopathological characteristics of The Cancer Genome Atlas-Stomach Adenocarcinoma (TCGA-STAD) molecular subtype; (B) Clinical and pathological characteristics of the GSE62254 molecular subtype; The lower section represents the proportion, whereas the upper region highlights the distribution variations in the two pairs. -log10 (p-value) was considered statistically significant (chi-square test).
Gene landscape among different molecular subtypes
We further studied the differences in genomic alterations among these three molecular subtypes in the TCGA-STAD dataset. The molecular features of the TCGA-STAD cohort in this study were obtained from an earlier pan-cancer publication (Thorsson et al., 2018). We observed that the C3 had the highest TMB, C1 had the highest intratumor heterogeneity, and C2 had the highest aneuploidy score, homologous recombination deficiency, purity, and ploidy (Fig. 3A). In addition, the molecular subtype of GC was acquired from a previous study, which identified five molecular subtypes (i.e., genomically stable (GS), chromosomal instability (CIN), Epstein-Barr virus (EBV), microsatellite instability (MSI), and plus tumors with elevated single nucleotide variants (HM-SNV)) (Liu et al., 2018). These two molecular subtypes were compared, and it was seen that the CIN accounted for more in the C1 and C2 subtypes, while microsatellite instability (MSI) in the C3 subtype was significantly higher than C1 and C2 subtypes. We also compared the MSI status variations in the molecular subtypes. The majority of patients in the C1 and C2 subgroups were Microsatellite stable (MSS) (Figs. 3B–3C). Furthermore, the discrepancies in gene mutations among the distinct molecular subtypes were studied. The top twenty genes with substantial mutations were displayed. The mutation frequencies of TTN, MUC16, and other genes varied significantly among the three molecular subtypes (Fig. 3D).
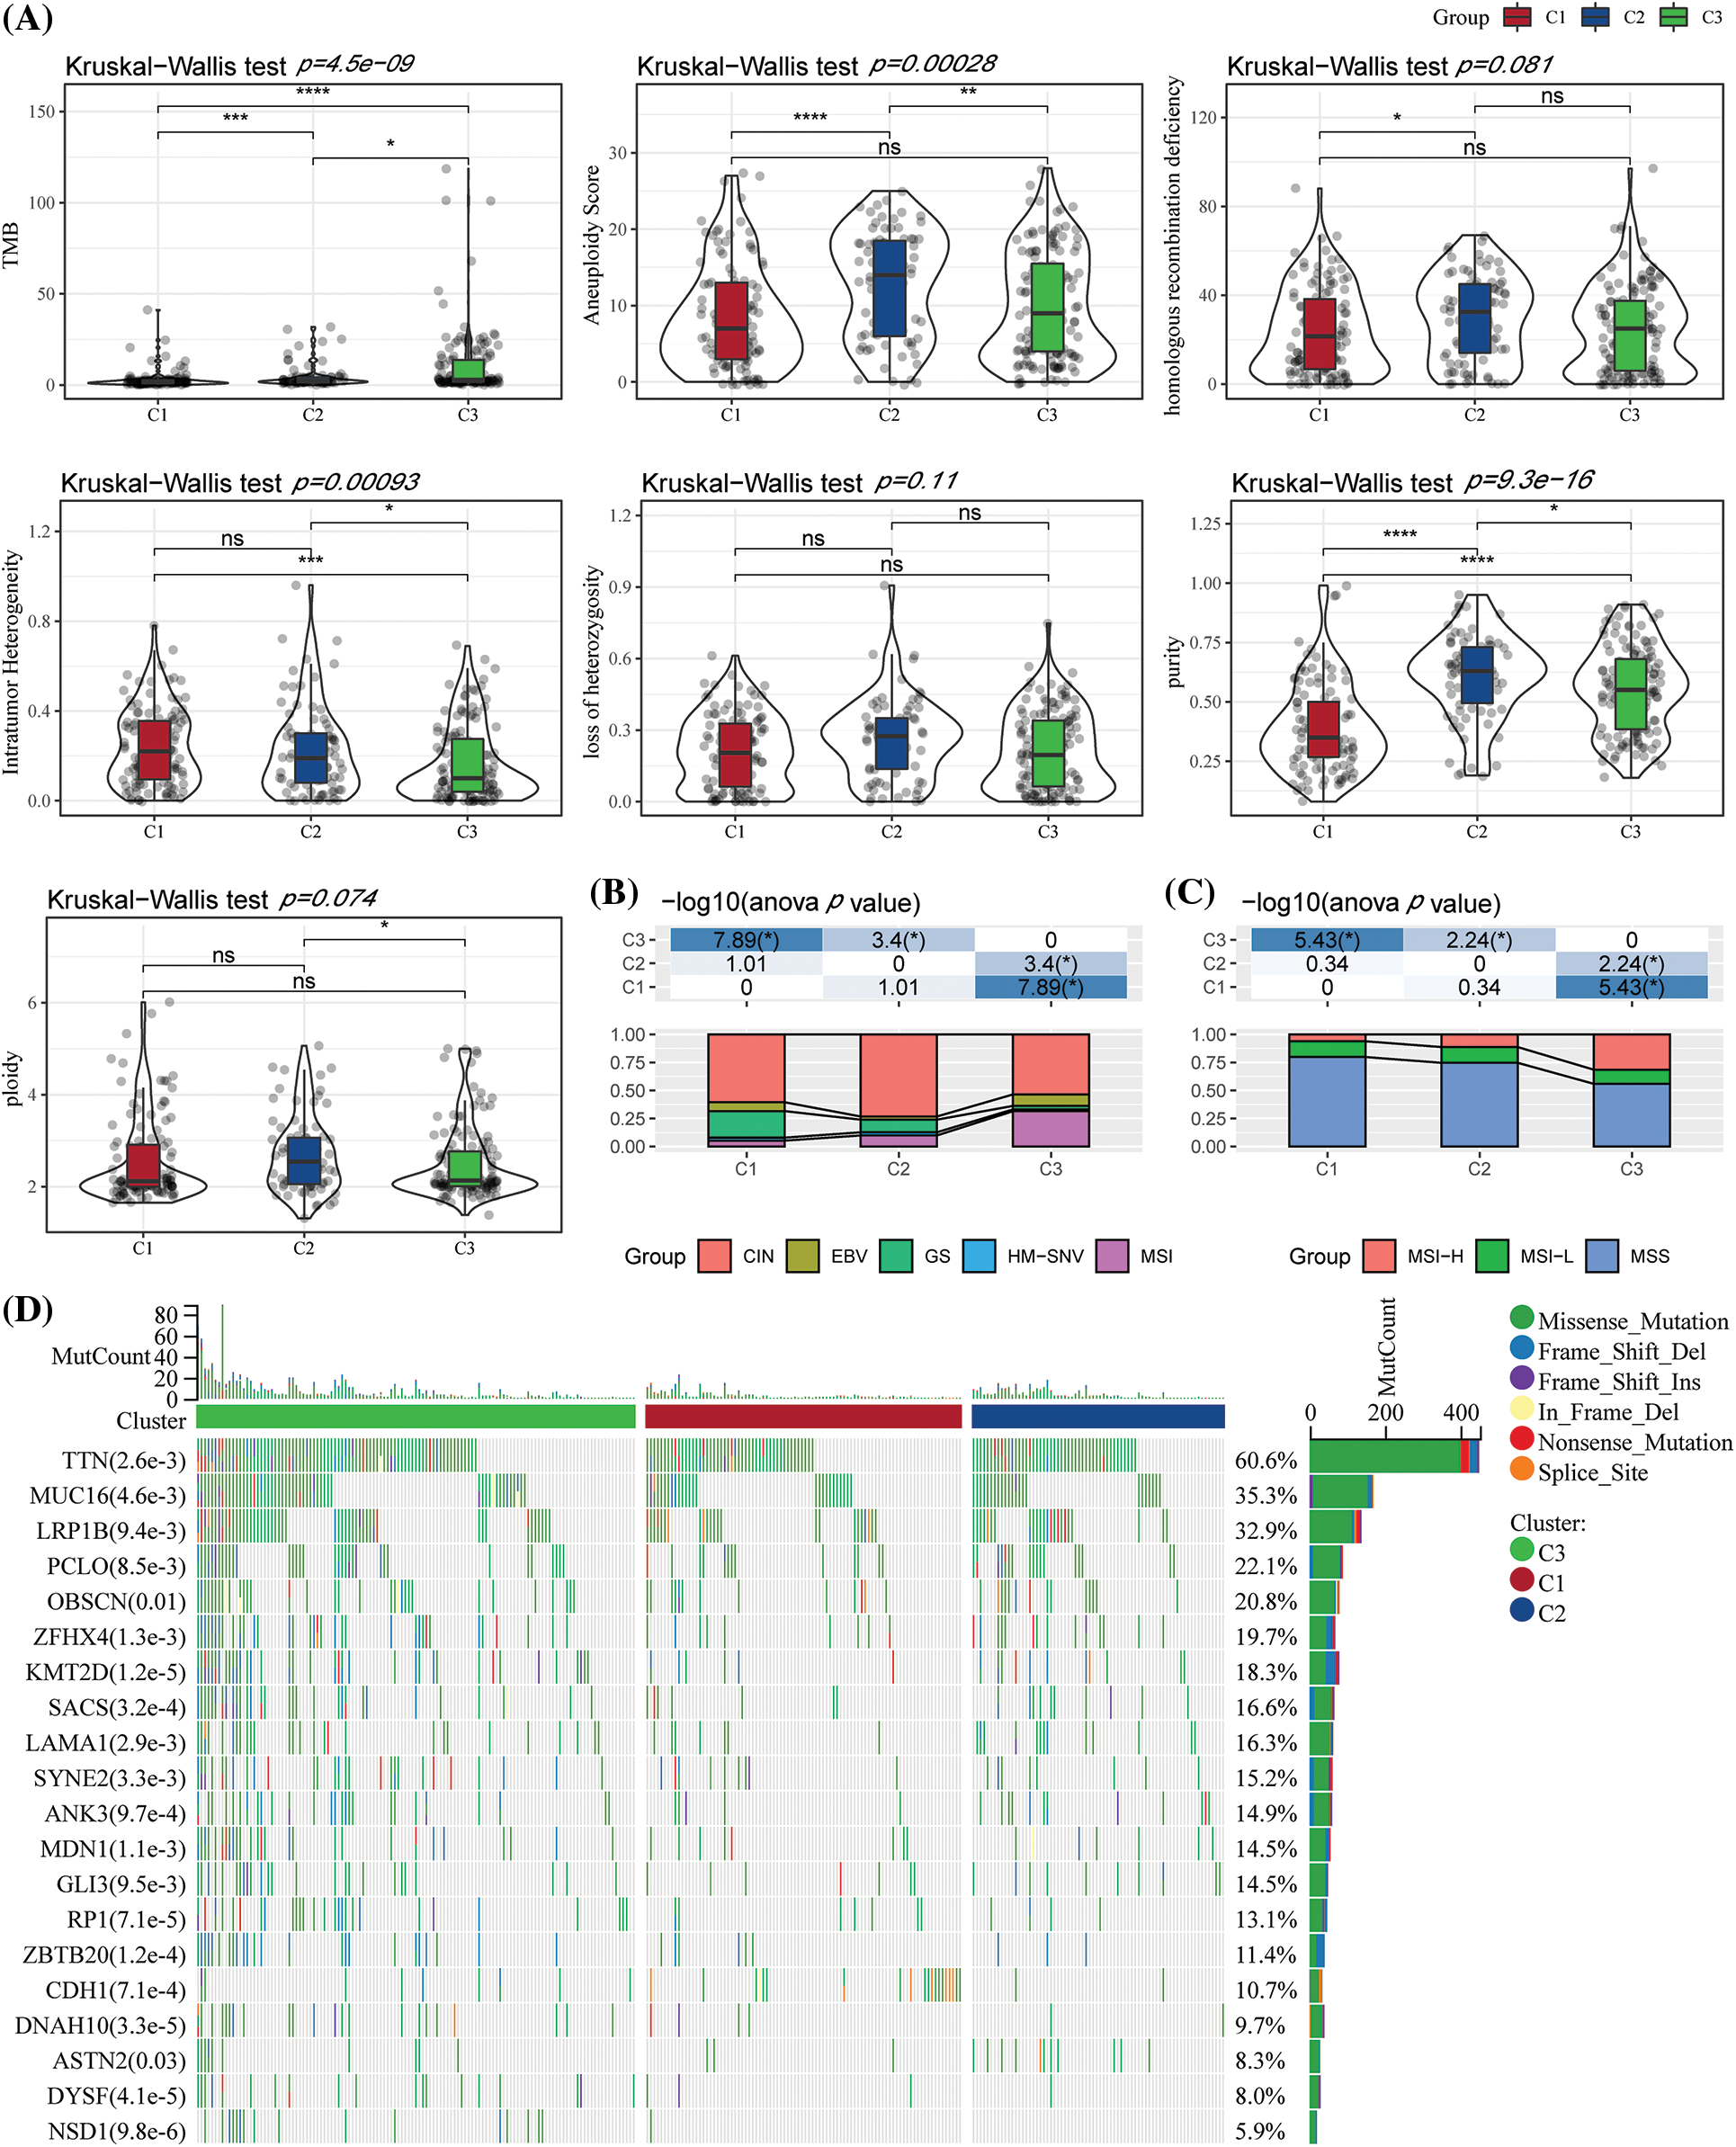
Figure 3: Genome variations in the molecular subtypes of The Cancer Genome Atlas (TCGA) dataset. (A) Variations in the homologous recombination defects, fraction altered, number of segments, aneuploidy score, and Tumor Mutation Burden in TCGA molecular subtypes were compared; (B) Comparison of the three molecular subtypes with all molecular subtypes described in earlier studies; (C) Difference in three molecular subtypes “MSI status”; (D) Somatic mutations in three molecular subtypes (chi-square test). *p < 0.05; **p < 0.01; ***p < 0.001; ****p < 0.0001.
Pathway analysis variations among molecular subtypes
We next analyzed differentially activated pathways in the different molecular subtypes. When compared with GSE62254, TCGA-STAD was significantly enriched in 31 pathways (Fig. 4A). Generally, the activated pathways mainly were some epithelial-mesenchymal transition (EMT)-linked pathways, such as EPITHELIAL_MESENCHYMAL_TRANSITION, TGF_BETA_SIGNALING and several immune-related pathways. In addition, pathway differences among the TCGA-STAD subtypes were also analyzed. Generally, EMT-associated pathways in C1 patients were activated. For example, in the C1 subtype, the EPITHELIAL_MESENCHYMAL_TRANSITION pathway was significantly activated compared with C2 and C3. In addition, several immune-linked pathways were also activated in the C1 subtype, such as INTERFERON_GAMMA_RESPONSE. Therefore, these subtypes differ in pathway activation, which may affect the prognosis of different subtypes (Fig. 4B).

Figure 4: Channel differences in the various datasets and molecular typing. (A) Bubble diagram of the Gene Set Enrichment Analysis (GSEA)analysis results of C1 vs. C3 subtype in two gastric cancer (GC) datasets; (B) Bubble diagram of GSEA analysis results compared with different molecular subtypes in The Cancer Genome Atlas-Stomach Adenocarcinoma (TCGA-STAD) dataset.
Immune characteristics among molecular subtypes
CIBERSORT software and ESTIMATE software were used to assess the infiltration of various immune cells to further analyze the differences in the immunological TME across various molecular subtypes. Most immunological cell types had significant differences among subtypes, in which the infiltration level of macrophages in the M2 phase in C1 was significantly increased, while macrophages in the M0 phase in C1 were significantly decreased. More importantly, there was a slight difference among activated NK cells in subtypes, but the infiltration of resting NK cells was significantly decreased (Fig. 5A) in C1 subtypes. Additionally, the immune score of the C1 subtype was noticeably higher as it showed a greater immune cell infiltration (Fig. 5B). Additionally, the same algorithm and outcomes from the TCGA-STAD were utilized to compare the infiltration levels of the immune cells using the GSE62254 data (Figs. 5C–5D). Moreover, the levels of the inflammatory activity of three molecular subtypes were calculated. Apart from MHC_I, there were significant differences among these seven meta-genes clusters, indicating an immune inflammation caused by the high degree of immune cell infiltration in the C1 subtype. Moreover, it also indicated that over-activation of immunity may promote the development of tumors instead, resulting in a poor prognosis. This observation was also observed in the GSE62254 dataset (Figs. 5E–5F).
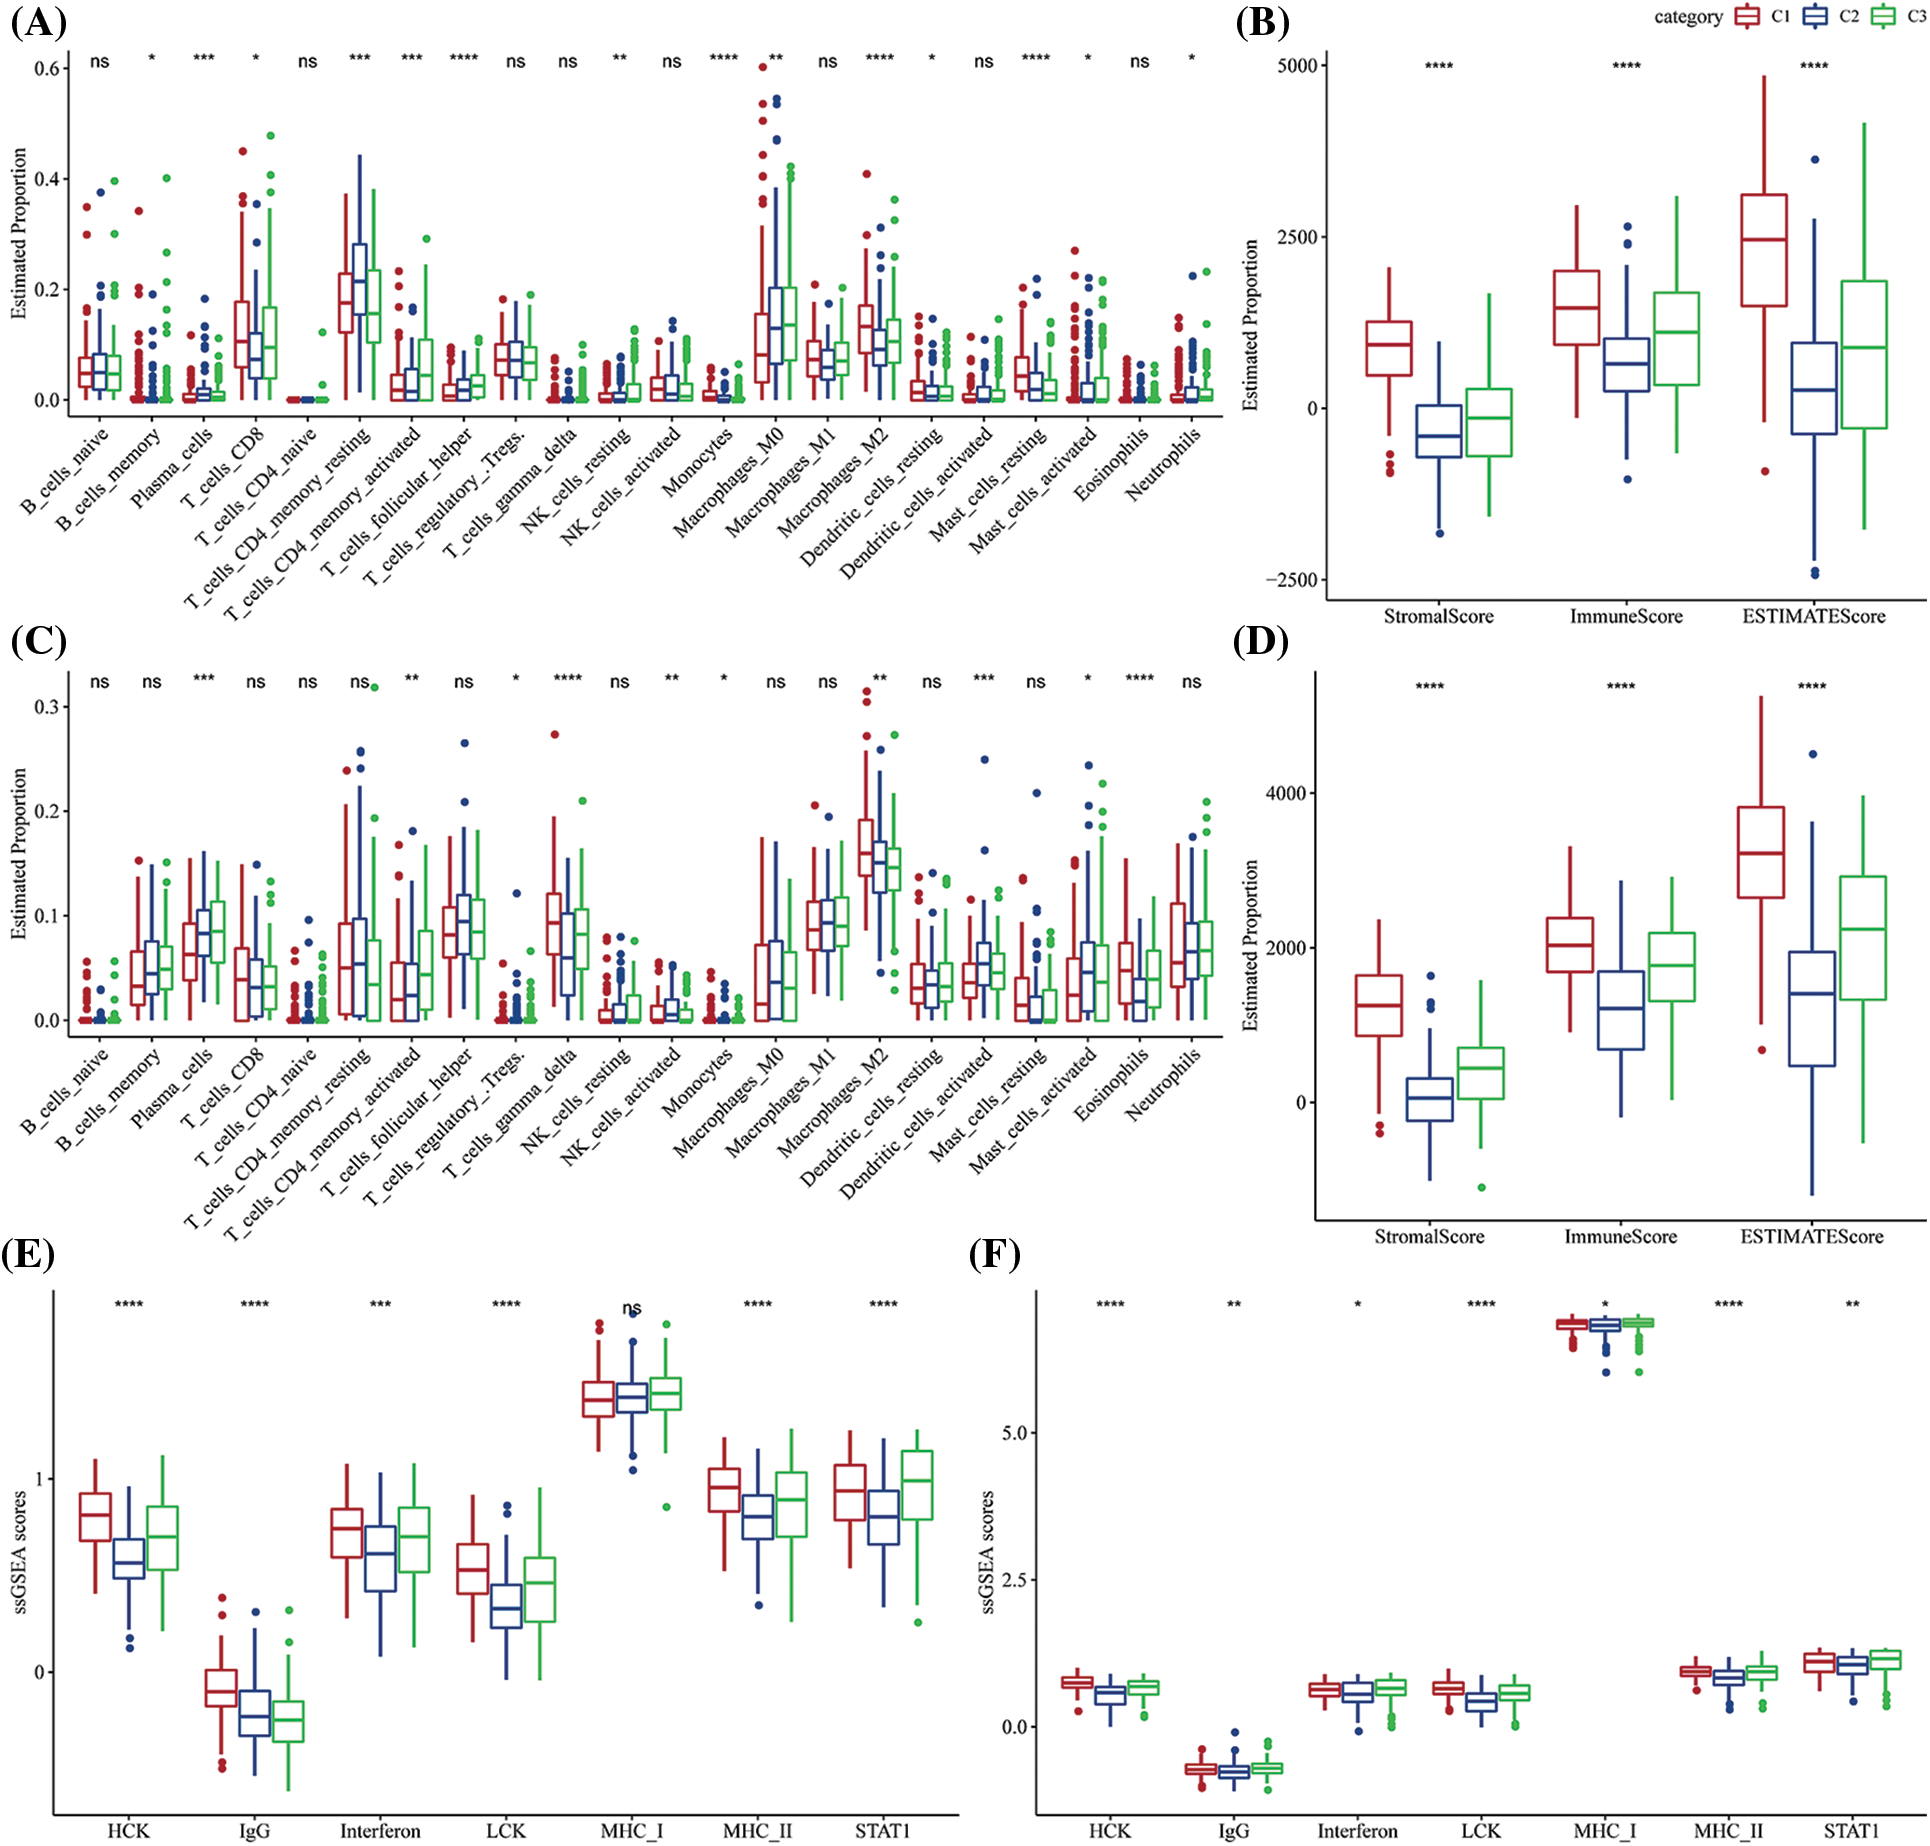
Figure 5: The proportion of immune cell components in two different gastric cancer (GC) datasets. (A) Difference in the scores of 22 immune cells in The Cancer Genome Atlas-Stomach Adenocarcinoma (TCGA-STAD) dataset among the molecular subtypes; (B) Differences in the ESTIMATE immune infiltration among the molecular subtypes in TCGA-STAD; (C) Differences in the scores of the 22 immune cells in GSE62254 between the molecular subtypes; (D) Differences in the ESTIMATE immune infiltration between the molecular subtypes in the GSE62254 dataset; (E) Differences in scores of seven inflammatory-related gene clusters among different molecular subtypes in TCGA-STAD; (F) Differences in scores of seven inflammatory-related gene clusters among different molecular subtypes in GSE62254. ns p > 0.05; *p < 0.05; **p < 0.01; ***p < 0.001; ****p < 0.0001.
Immune/chemotherapy treatment differences among molecular subtypes
Few representative molecules were assessed for Immune Checkpoint Blockade (ICB) of cancer immunotherapy. The results indicated that programmed death 1 (PD-1), programmed death ligand 1 (PD-L1), and cytotoxic T lymphocyte-associated antigen 4 (CTLA4) were significantly overexpressed in the C3 subtype (Fig. 6A) Further, the response of IFN-γ was significantly enhanced in C1 and C3 subtypes (Fig. 6B). Simultaneously, a comparison of the expression differences of INFG gene in the three subtypes showed that INFG was significantly overexpressed in the C3 subtype (Fig. 6C). In addition, the CYT score reflecting the cytotoxicity was significantly higher in C1 and C3 molecular subtypes than in the C2 subtype (Fig. 6D). Additionally, the T-cell-inflamed GEP score was utilized for predicting the clinical responses of different molecular subtypes and the potential to obtain the unique characteristics of neoantigenicity and T-cell activation, respectively. It was found that the T-cell-inflamed GEP score was significantly increased in C1 and C3 subtypes (Fig. 6E). More crucially, the C1 subtype had a high TIDE score, indicating a higher risk of immunological escape. Further, C1 was the molecular subtype with the greatest exclusion and dysfunction scores (Fig. 6F). We also studied the response of different molecular subtypes in TCGA-STAD to conventional chemotherapy agents such as paclitaxel, cisplatin, docetaxel, and 5-fluorouracil. Paclitaxel and 5-fluorouracil sensitivity were increased in the C1 subtype (Fig. 6G).
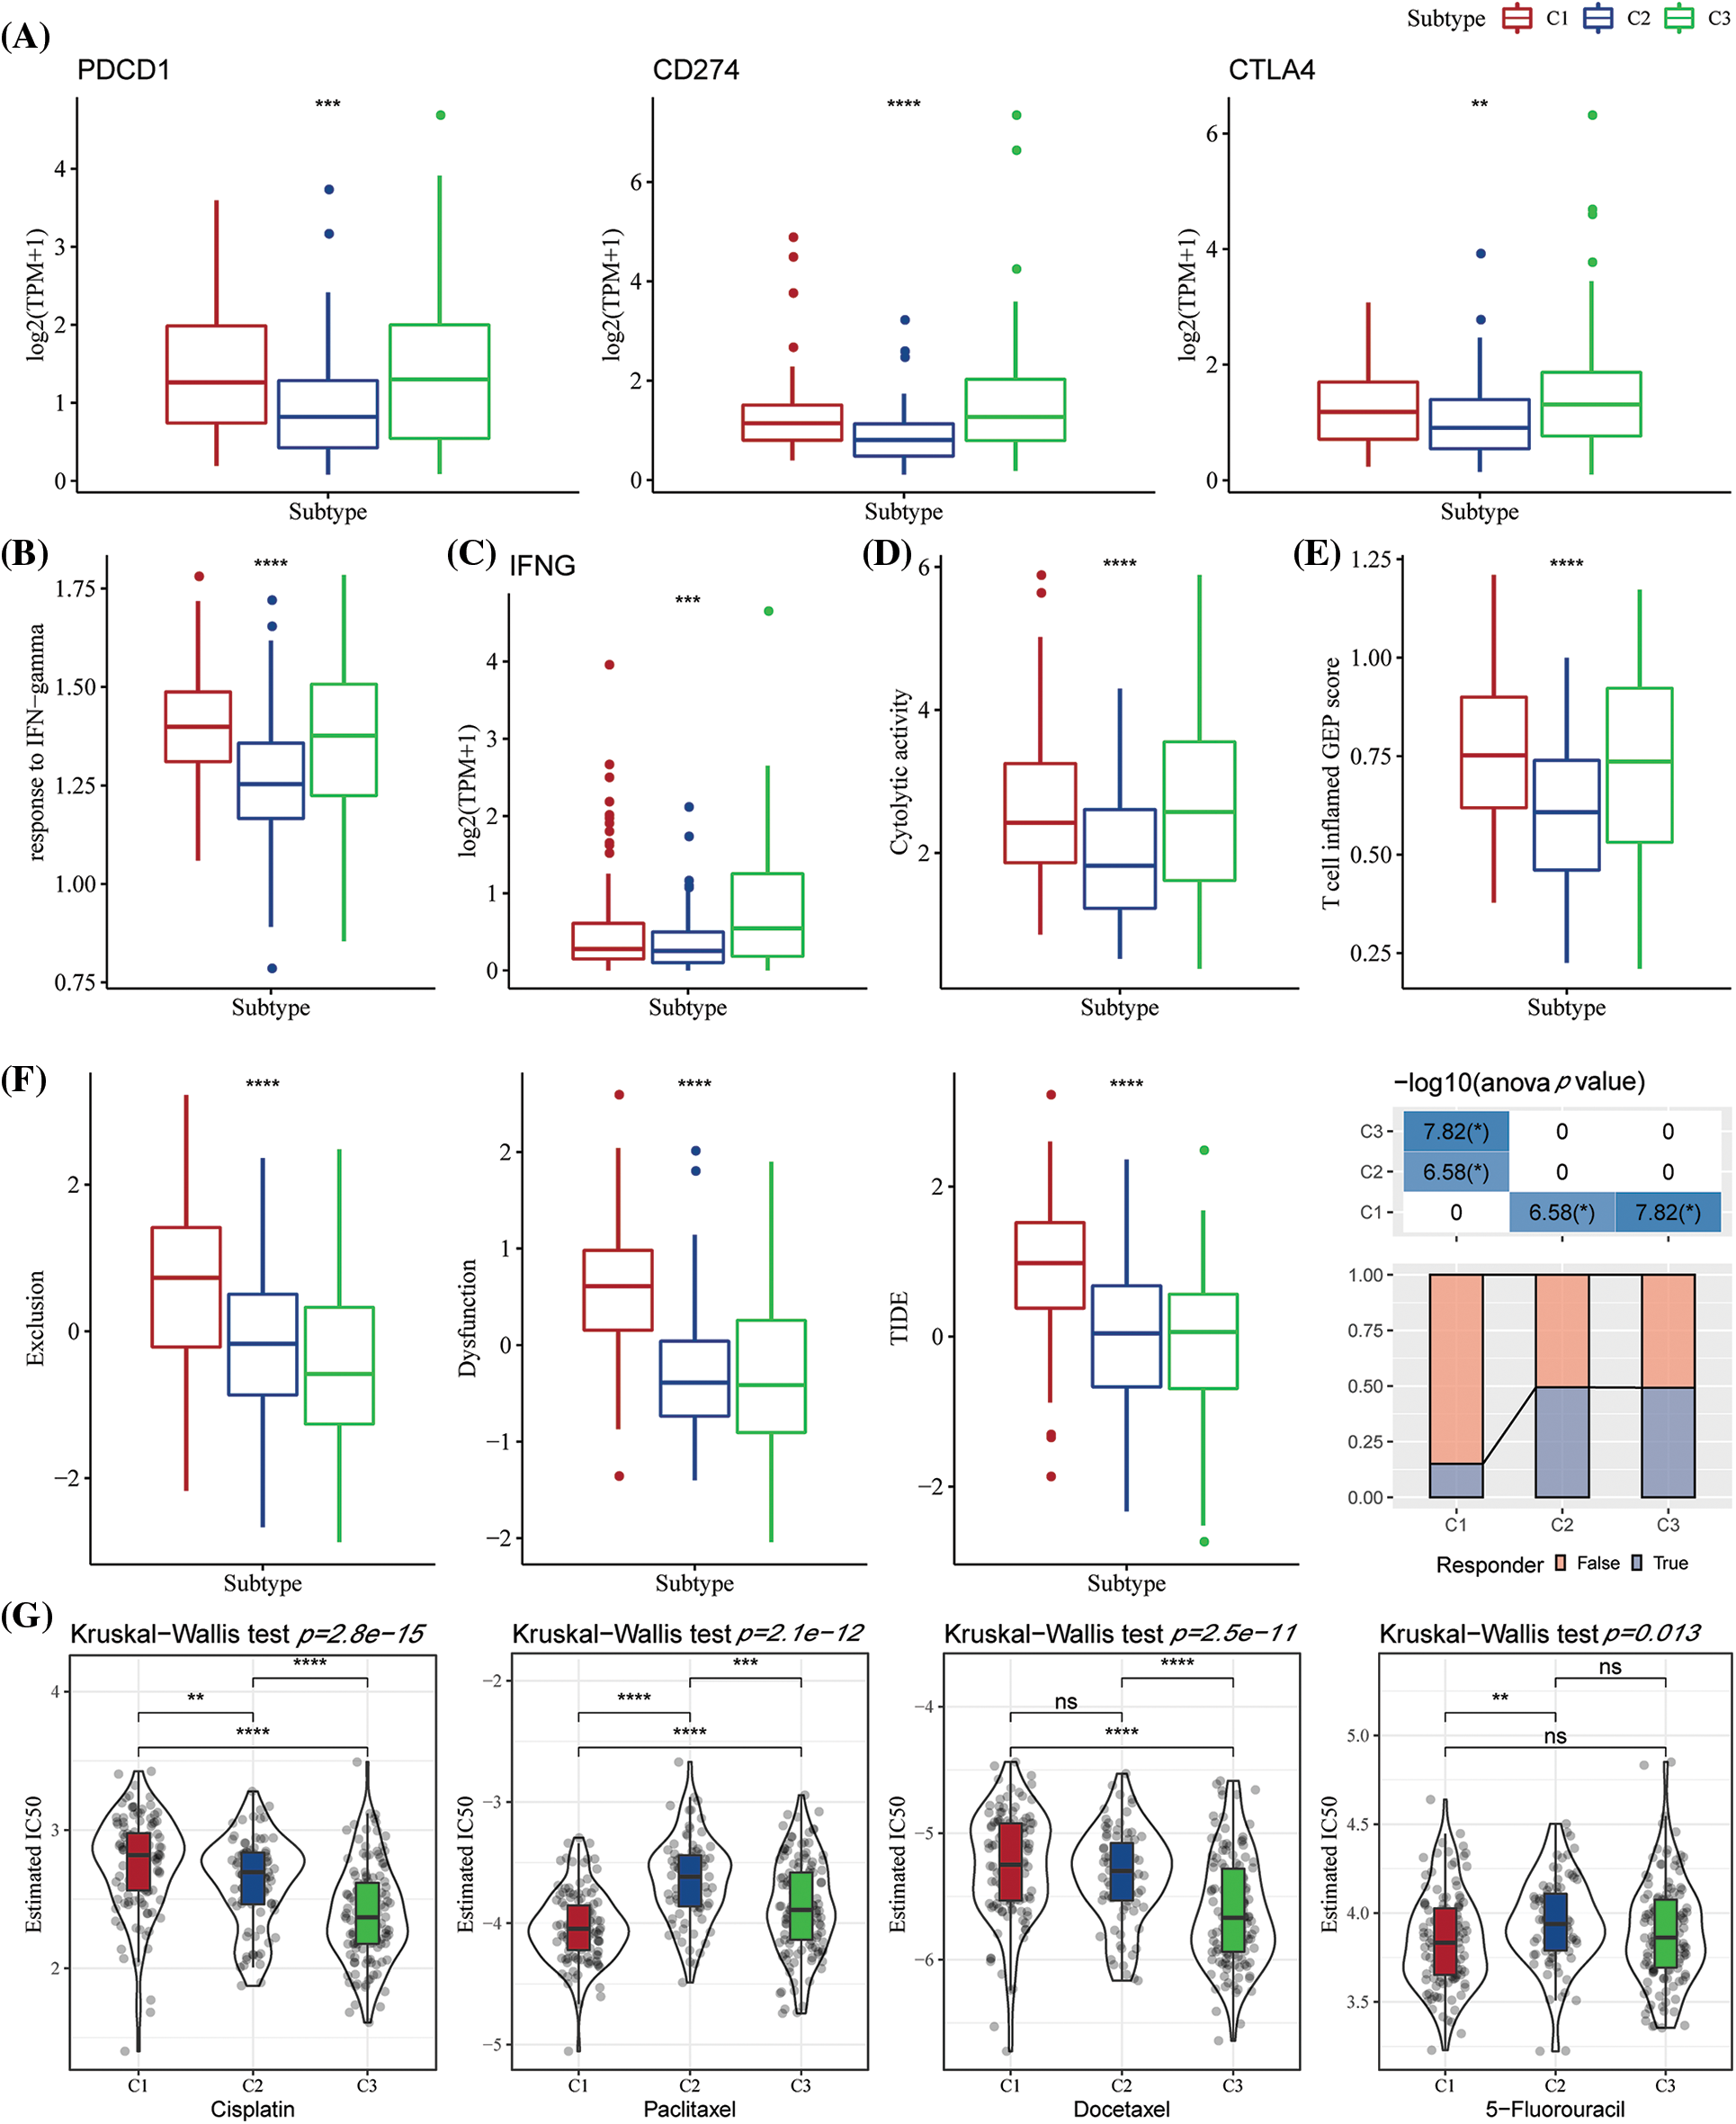
Figure 6: The differences in the immunotherapy response level among various molecular subtypes. (A) Differences in the expression of immune checkpoint genes between various molecular subtypes; (B) Differences in the “response to interferon-gamma (IFN-gamma)” between various molecular subtypes; (C) Differences in the expression of the interferon-gamma (INFG) gene in various subtypes; (D) Differences in the “cytolytic activity” between various subtypes; (E) The difference in the “T cell inflamed GEP score” among different molecular subtypes; (F) The difference in the Tumor Immune Dysfunction and Exclusion (TIDE) scores among different subtypes; (G) Box plots for the calculated half maximal inhibitory concentration (IC50) values for different drugs like paclitaxel, cisplatin, docetaxel, and 5-Fluorouracil in The Cancer Genome Atlas-Stomach Adenocarcinoma (TCGA-STAD) dataset. ns p > 0.05; **p < 0.01; ***p < 0.001; ****p < 0.0001.
Differential expression analysis among molecular subtypes
In the previous analysis, NK cell genes were identified through univariate Cox analyses, and three different molecular subtypes were identified. We next explored the differential genes among different subtypes. The differential gene volcano map of C1 vs. other subtypes contained 271 down-regulated genes and 1158 up-regulated genes (Suppl. Fig. S1A). In the C2 vs. other subtype differential gene volcano map, 341 down-regulated genes and 89 up-regulated genes were determined (Suppl. Fig. S1B). In the C3 vs. others differential gene volcano map, 494 down-regulated genes and 59 up-regulated genes were noted (Suppl. Fig. S1C).
Furthermore, by analyzing the functional enrichment of DEGs in C3 vs. others, C1 vs. others, and C2 vs. others, it was seen that the DEGs of the C1 subtype were significantly enriched in some signal pathways related to metastasis and invasion, such as focal adhesion, collagen-containing extracellular matrix, extracellular matrix, and organization (Suppl. Fig. S1D). In the C2 subtype, drug metabolism-cytochrome P450, antimicrobial humoral response, and other pathways related to drug metabolism and immunity were enriched (Suppl. Fig. S1E). Further, the cell cycle, chemokine receptor binding, chromosome segregation, and other pathways were enriched in the C3 subtype (Suppl. Fig. S1F).
Determination of key natural killer cell genes
We selected 1565 genes finally by identifying differential genes among molecular subtypes in the previous analysis. Following this, a univariate Cox regression analysis was performed to examine DEGs across various subtypes. We discovered a total of 448 genes with a larger influence on GC patient prognosis (p0.05), including 407 risk genes and 41 protective genes (Suppl. Fig. S2A). To reduce the number of genes in the suggested risk model, the 448 genes with a significant relation to GC prognosis were further compressed using Lasso regression. We first investigated the modified trajectory of each independent variable. According to the analysis, the proportion of independent variable coefficients that decreased to zero increased as the lambda value increased. The model was developed using 10-fold cross-validation, and the CI for each lambda value was explored. The model achieved an ideal level, as indicated in the figure, when lambda = 0.0697. Therefore, 13 genes were chosen as target genes for the subsequent step when the value of lambda was 0.0697 (Suppl. Fig. S2B). Furthermore, based on the 13 genes obtained in the Lasso analysis results, stepwise multivariate regression analysis determined five NK cell-related genes affecting prognosis: MATN3, SERPINE1, ARHGEF39, VSNL1, and ENTPD2 (Suppl. Figs. S2C–S2D).
Designing and verifying the proposed risk model
Based on the formula described by the RS of these samples, the RS of NK cell-related signatures for each sample were calculated and normalized. The results of the RS distribution of patients in the TCGA-STAD dataset indicated that the RS-high samples had a poor prognosis (Fig. 7A). Additionally, the classification effectiveness of the prognosis prediction at 1 year, 2 years, and 3 years was examined, correspondingly, and the model showed a higher AUC area (Fig. 7B). Finally, groups with RS values below 0 were classified as low risk, whereas those with RS values over 0 were classified as high risk. The KM curve was then created that demonstrated the highly significant differences between the RS-high and RS-low groups. Of the 173 samples divided into the RS-high groups and the 164 samples included in the RS-low groups, patients with higher RS had worse OS in the training dataset (Fig. 7C). We then confirmed the reliability of the clinical prognostic model of the NK cell-related gene signature by testing it in the GSE62254 and GSE15459 datasets. The same formula was used to determine the RS for patients. Similar findings to those of the training set were seen in the verification analysis. While the RS-high had a bad prognosis, the prognosis of the RS-low was good (Figs. 7D–7G).
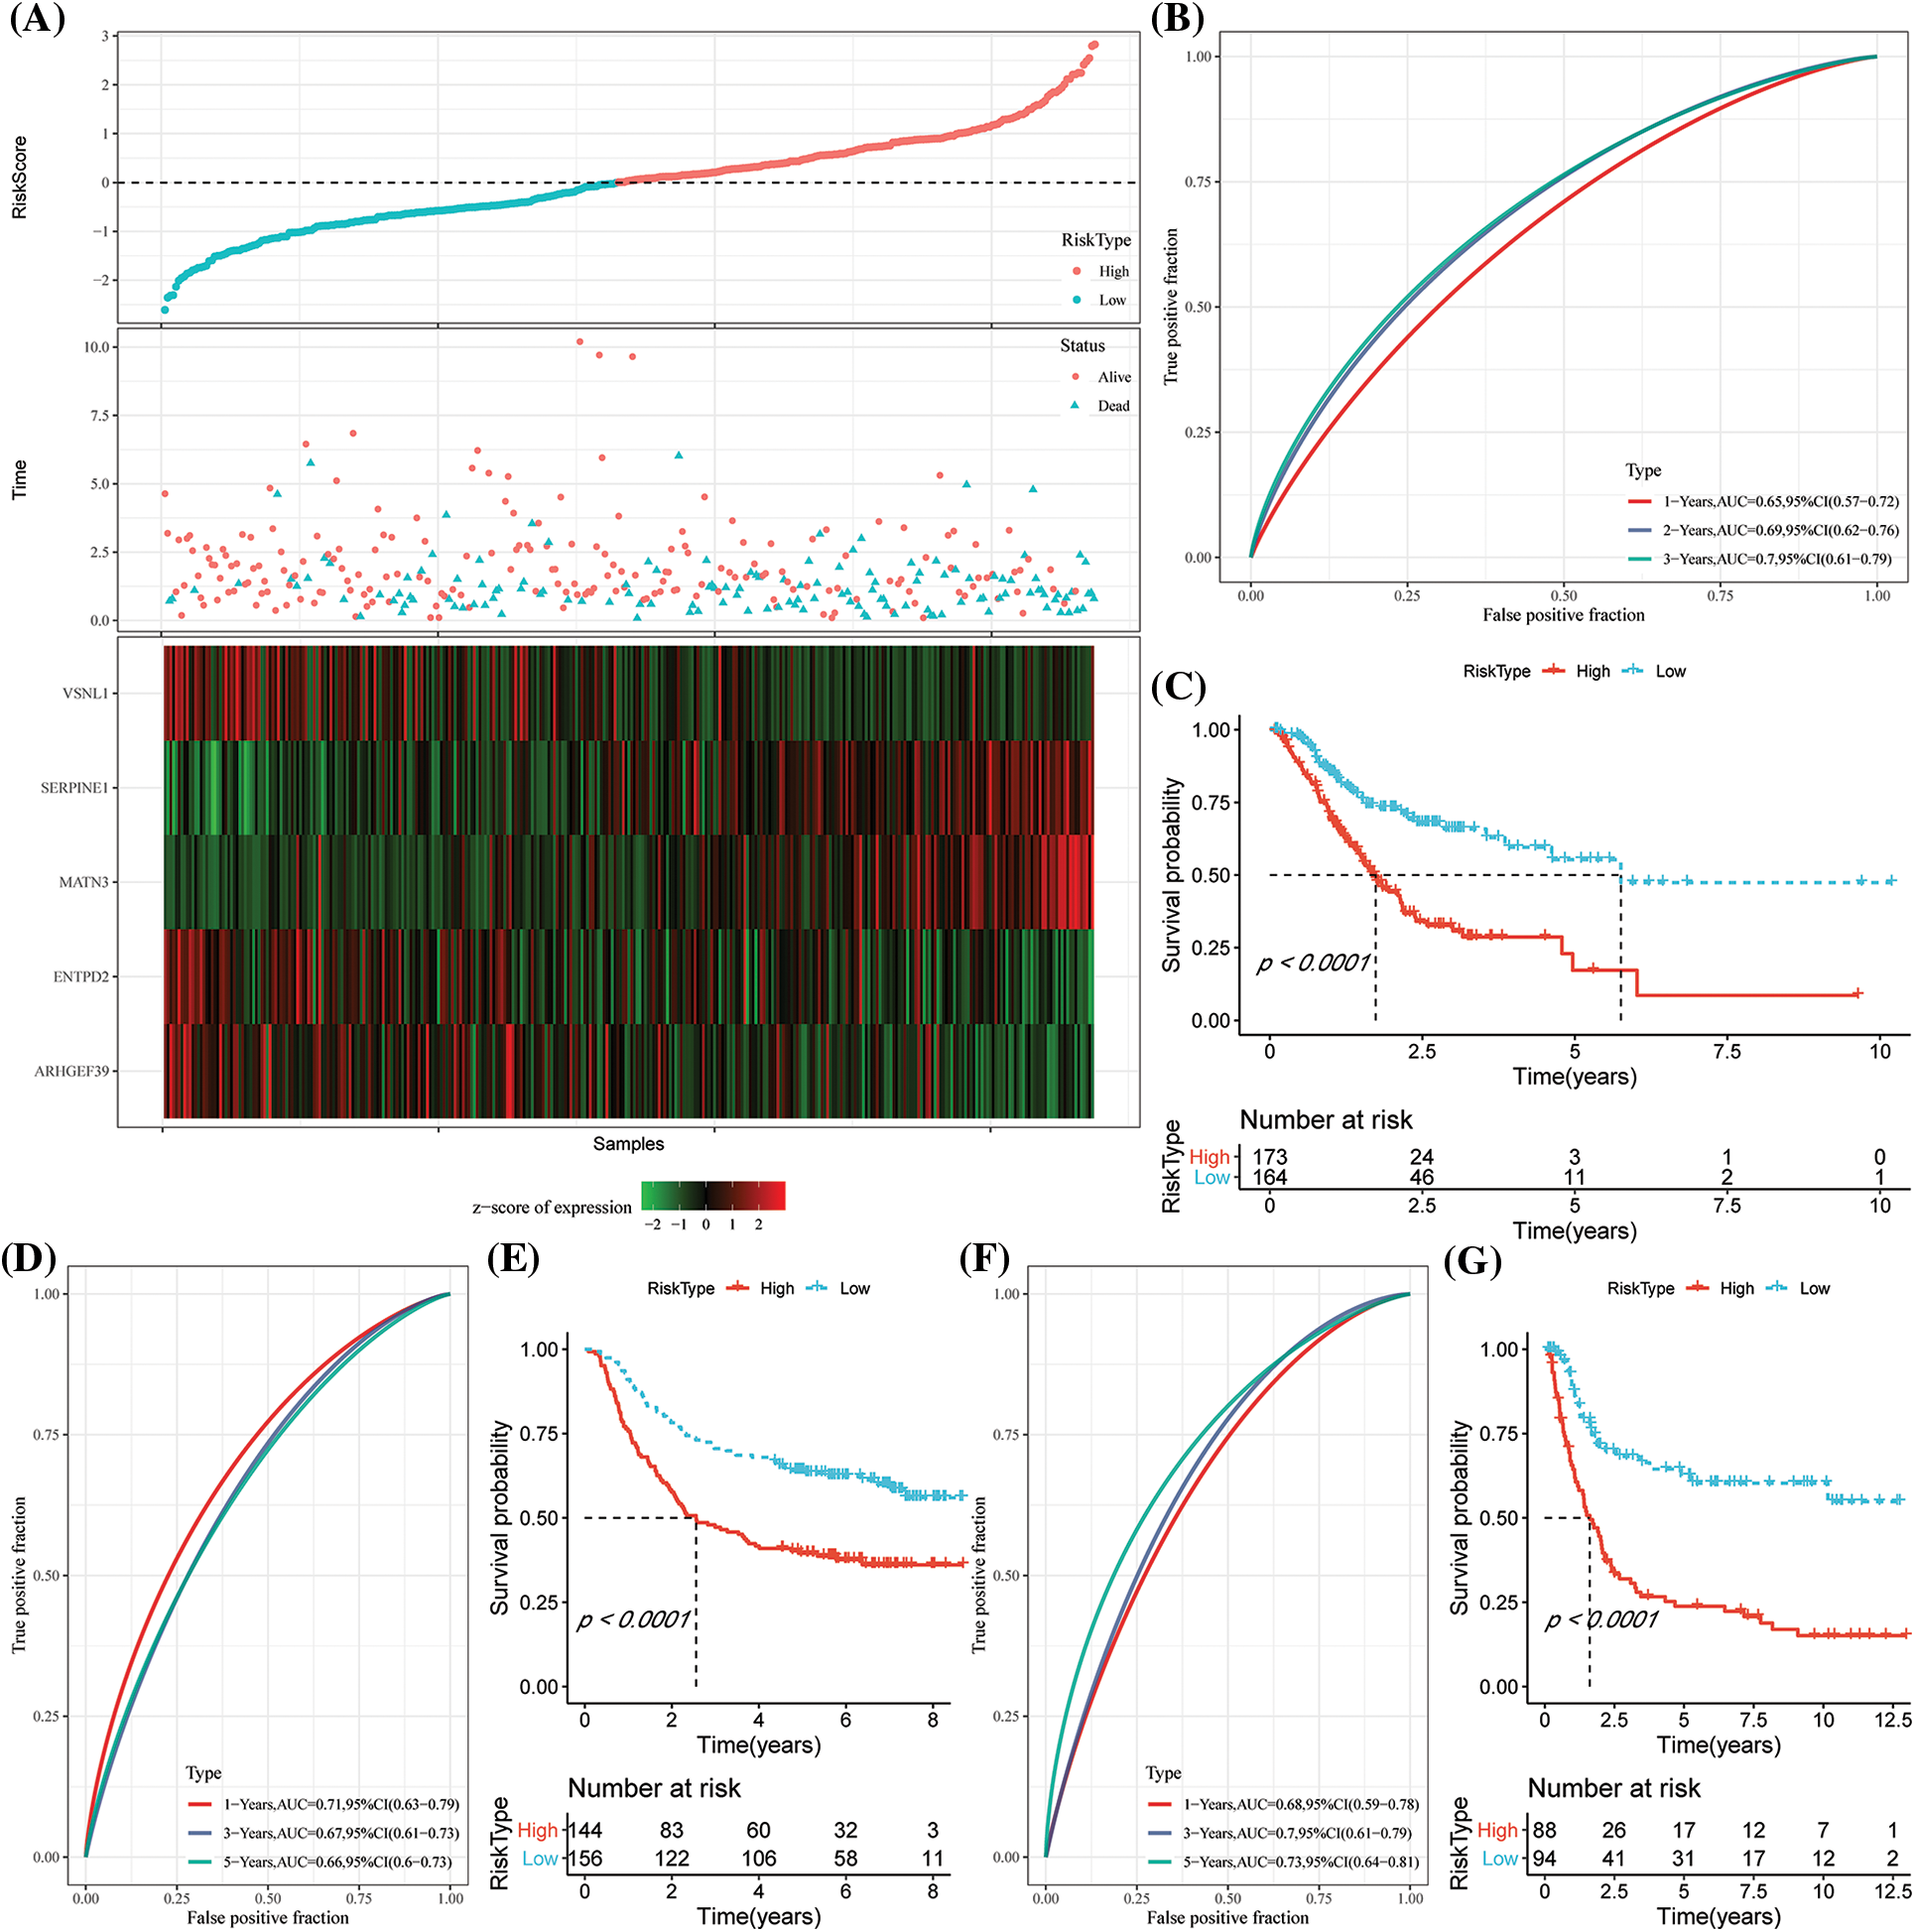
Figure 7: Construction of the prognostic model by risk genes. (A) The expression of the risk score (RS), overall survival (OS) status, OS duration, and necroptosis-linked genes in The Cancer Genome Atlas-Stomach Adenocarcinoma (TCGA-STAD) dataset; (B) Receiver Operating Characteristics (ROC) curves and the area under the curve (AUC) classified by the RS in TCGA-STAD; (C) KM curve distribution of the RS in TCGA-STAD; (D–E) ROC curves and the KM survival curve of the RS in GSE62254; (F–G) ROC curves and KM survival curves of RS in the GSE15459 dataset.
Expression of the risk score in different clinicopathological characteristics
Analysis of the distribution of the RS among the clinical pathological characteristic groups in the TCGA-STAD dataset showed that patients with the late-clinical stage displayed a significantly higher RS than those at the early clinical stage. In addition, the results showed that patients younger than 60 years old had higher RS (Suppl. Fig. S3A). Further, according to the findings, the C1 molecular subtype had a much greater RS than the C3 molecular subtype, which had a better prognosis. In addition, the RS-high group included a majority of the C1 molecular subtypes (Suppl. Fig. S3B). We next compared the prognostic differences in the high- and low-risk groups with regard to different clinical pathological characteristics determined in the TCGA-STAD dataset. The results revealed that the risk group also had favorable results in different clinical groups, implying the reliability of the risk group (Suppl. Fig. S3C). At the same time, the RS differences among various clinical attributes in the GSE62254 cohort were also compared. It was seen that a higher clinical grade was related to a higher RS. In addition, the RS variations in the different molecular subtypes were compared, and the distribution of molecular subtypes and risk types were determined. The RS model proposed in this study also showed robust working in the GSE62254 cohort.
Immune infiltration/pathway characteristics among risk score groups
We subsequently analyzed the TME in patients of the different RS groups. In the low- and high-risk groups in the TCGA-STAD dataset, the relative abundance of the 22 different immune cells was compared. It was observed that both the RS groups showed significant differences in the abundance of immune cells (Fig. 8A). Furthermore, the relation of these 22 immune cell components with the RS was analyzed. It was found that the RS was significantly and negatively associated with the resting NK cells but was positively related to the M2 macrophages (Fig. 8B). We used ESTIMATE to assess the immune cell infiltration. The high-RS group showed a higher immune infiltration (Fig. 8C) compared to the low-RS group. For assessing the correlation between the RS and the biological functions of various samples, the expression profiles in the TCGA-STAD were selected and analyzed using the ssGSEA. The results indicated that the RS-high category was significantly enriched in several EMT-related pathways, including HALLMERK_TGF_BETA_SIGNALING, HALLMARK_IL2_STAT5_ SIGNALING, etc. (Fig. 8D). The correlation between the enrichment score of the functions and RS was then estimated and the functions with a correlation >0.4 were chosen. We noted that the RS was positively correlated with cell cycle-linked pathways (Fig. 8E).
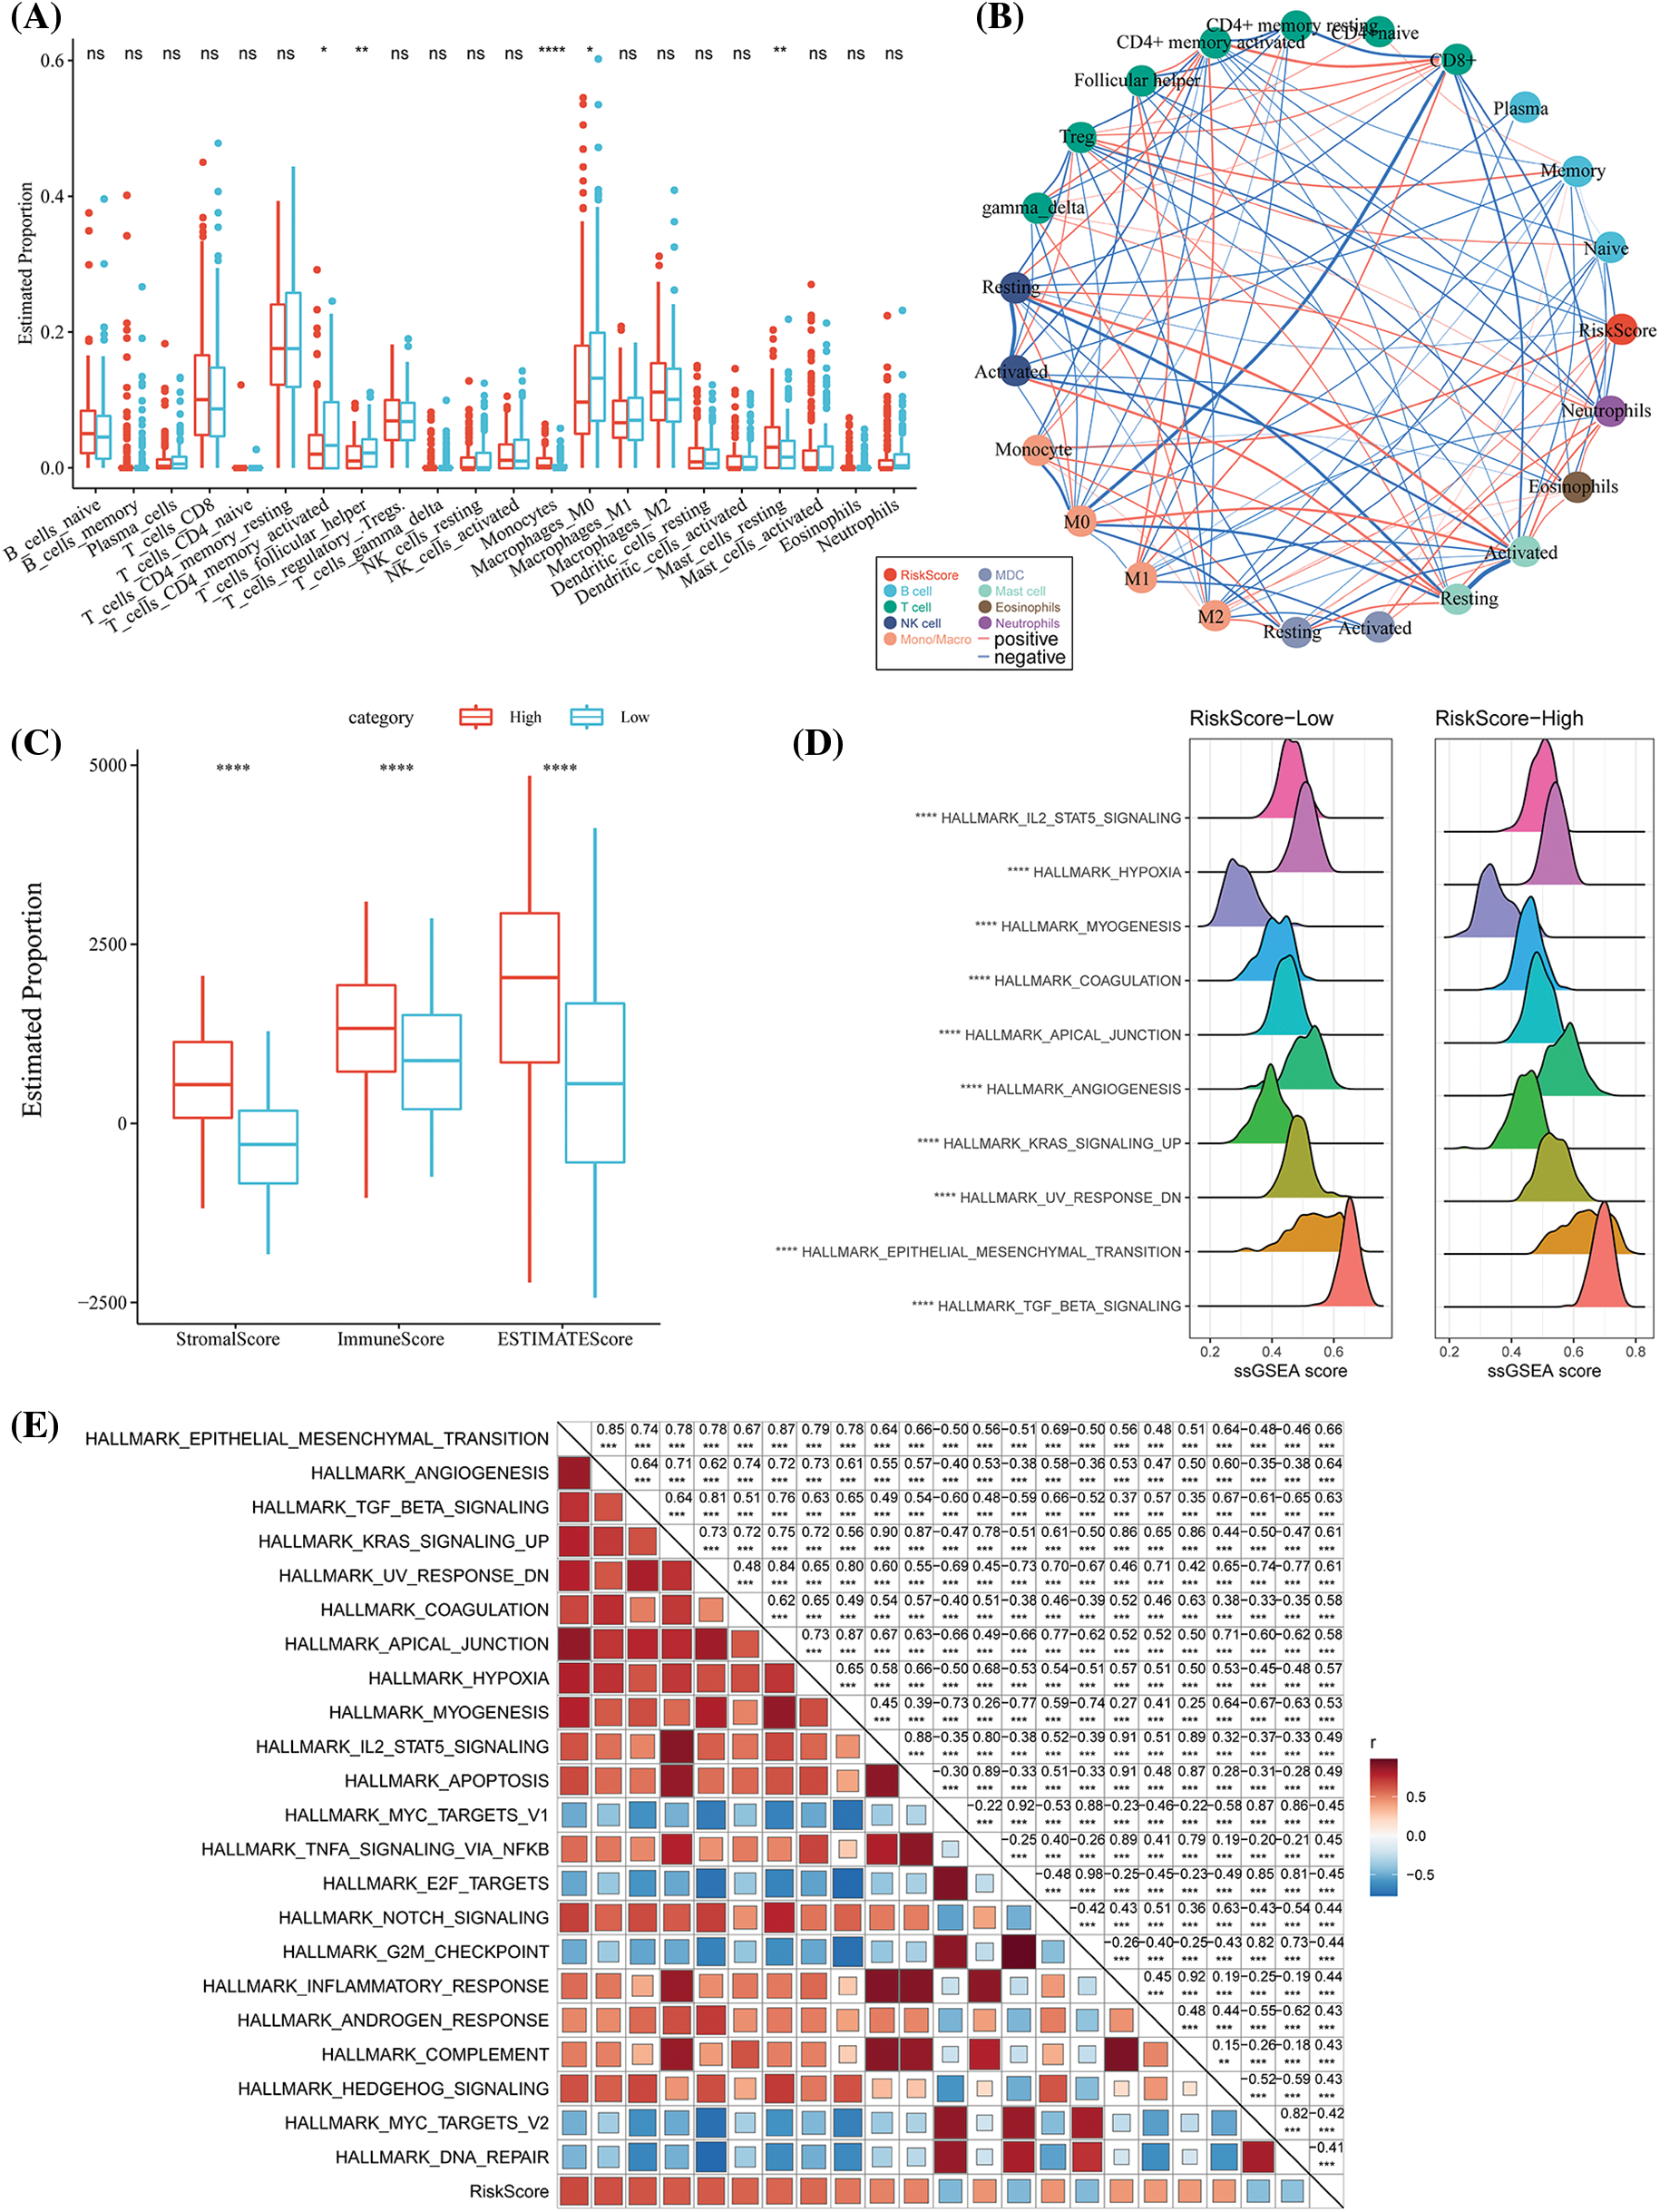
Figure 8: Differences in the immune infiltration level among the different risk score (RS) groups. (A) The proportion of immune cell components in The Cancer Genome Atlas-Stomach Adenocarcinoma (TCGA-STAD) dataset; (B) Correlation analysis between 22 immune cell components in TCGA-STAD and the RS; (C) The proportion of immune cell molecules assessed using the ESTIMATE tool in TCGA-STAD; (D) The top 10 pathways with the most significant differences between RS-high and RS-low groups; (E) The correlation analysis results between the Kyoto Encyclopedia of Genes and Genomes (KEGG) pathways and the RS where the correlation with RS was greater than 0.4. ns p > 0.05; **p < 0.01; ****p < 0.0001.
Differences in immunotherapy and chemotherapy among risk score groups
We found that the T-cell-informed GEP score was significantly increased in the RS-high group (Fig. 9A). Simultaneously, the RS-high subtype also showed a significantly enhanced IFN-γ response (Fig. 9B). The results indicated no significant differences in the CYT scores that were used for assessing the cytotoxicity between the risk groups (Fig. 9C). We then evaluated a few representative immune checkpoint molecules, and no differential expression between CTLA4 and PD-L1 in terms of the risk resistance was found (Fig. 9D). TIDE was used for assessing the probable clinical effects of immunotherapy in the defined risk group. It was seen that the RS-high subtype had a high TIDE score, indicating that the RS-high subtype was more likely to escape from traditional immunotherapy. In addition, it was also noted that the RS-high molecular subtype had the highest exclusion and dysfunction scores (Fig. 9E). Further, the responses of different RS groups in the TCGA-STAD cohort were also analyzed against conventional chemotherapy drugs like paclitaxel, cisplatin, docetaxel, and 5-fluorouracil. We found that the RS-low was more sensitive to the chemotherapy drugs cisplatin and docetaxel on the whole (Fig. 9F).

Figure 9: Differences in the immunotherapy response level among different RS groups. (A) The differences in “T cell inflamed gene expression profile (GEP) score” among different molecular subtypes; (B) Differences in “response to interferon-gamma (IFN−γ)” among different molecular subtypes; (C) The differences in “cytolytic activity” among different molecular subtypes; (D) The differences in the expression levels of the immune checkpoint genes among various molecular subtypes; (E) The differences in direct Tumor Immune Dysfunction and Exclusion (TIDE) analysis among different risk groups; (F) Box plots for the calculated half-maximal inhibitory concentration (IC50) values for traditional chemotherapy drugs like paclitaxel, cisplatin, docetaxel, and 5-fluorouracil in The Cancer Genome Atlas-Stomach Adenocarcinoma (TCGA-STAD) dataset. ns p > 0.05; **p < 0.01; ***p < 0.001; ****p < 0.0001.
The risk score further improved the prognostic model and survival prediction in combination with the clinical and pathological characteristics
The decision tree was constructed according to the clinical variables, including age, gender, TNM stage, pathological information, and the RS of patients in TCGA-STAD. We found that four different risk subgroups could be identified using the decision tree, among which RiskType was the most powerful prognostic factor, and the four risk groups showed significant differences in their OS rates (Figs. 10A–10B). Patients with RS-low scores were included in the risk groupings “Lowest,” “Low,” and “Mediate,” which had poorer prognoses. Additionally, disparities in the distribution of the molecular subtypes in the different risk categories were observed, with the molecular subtypes C1 and C2 of the “High” risk subgroup accounting for the majority of these variances (Figs. 10C–10D). The findings of the univariate Cox analysis of RS and clinicopathological characteristics (HR = 1.72, 95% CI: 1.45–2.04) and the multivariate Cox analysis (HR = 1.72, 95% CI: 1.44–2.05) revealed that the RS was the most important prognostic factor (Figs. 10E–10F). A nomogram combining the RS with other clinicopathological features was developed to quantify the survival probability and risk assessment of the GC patients. Again, RS showed the greatest effect on the survival rate prediction (Fig. 10G). Furthermore, the calibration curve was plotted. For three calibration points at 1 year, 2 years, and 3 years, the prediction calibration curve and the standard curve results were comparable, indicating a strong prediction by the nomogram (Fig. 10H). Further evaluation of the reliability of the model was reflected by DCA, and the RS and nomogram had advantages over the extreme curve that were much greater. When compared to other clinicopathological variables, the nomogram and the RS had the highest potential in survival prediction (Fig. 10I). The ROC analysis showed that the 1-, 2- and 3-year AUC of the nomogram had the highest AUC in the 1-, 2- and 3-year ROC analysis (Fig. 10J).
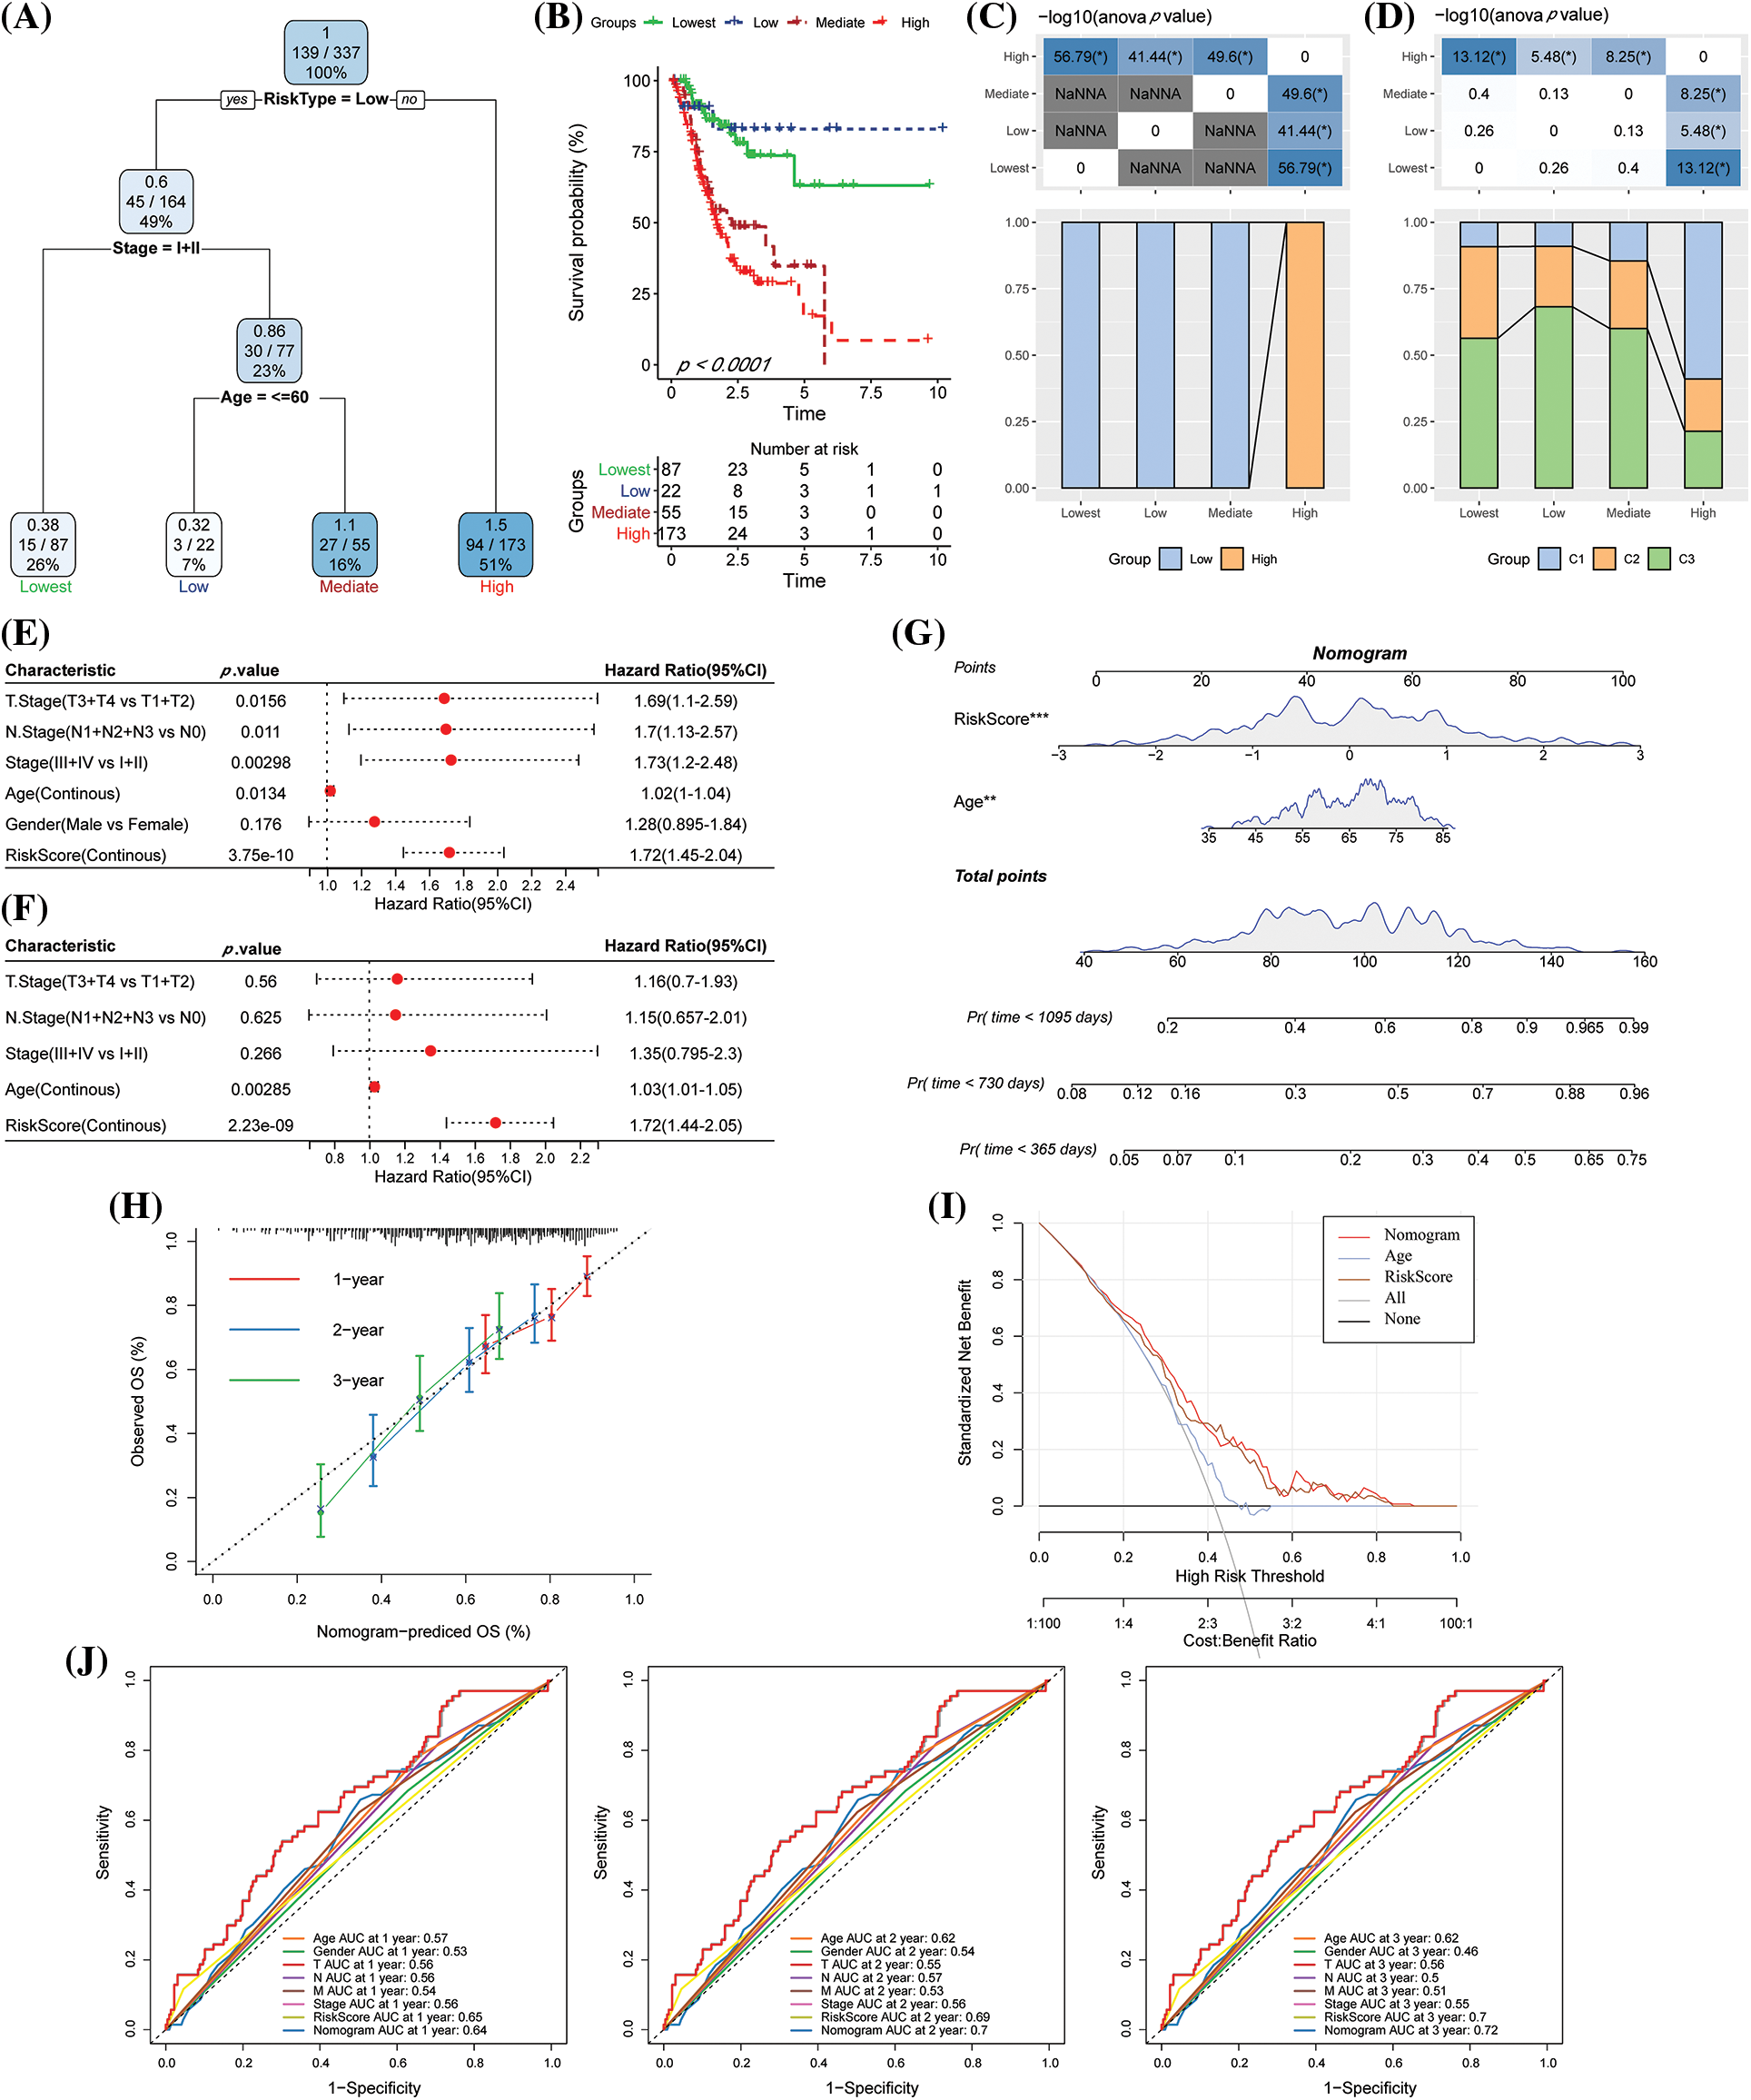
Figure 10: The risk score (RS) was the best influencing prognostic factor as determined by the decision tree. (A) Patients with complete data like age, RS, gender, and TNM stages were employed for designing the overall survival (OS) decision tree for optimizing the risk stratification; (B) Significant variations in the OS values were noted among the four risk subgroups; (C–D) Comparative analysis among different groups; (E–F) Univariate and multivariate Cox analysis of RS and clinicopathological characteristics; (G) Nomogram model; (H) Calibration curves for the proposed nomogram for the OS duration of 1, 3, and 5 years; (I) Decision curves of the proposed nomogram model. (J) ROC analysis of nomogram, RS, and clinical features.
In this study, three molecular subtypes with distinct prognostic impacts, pathogenic aspects, pathways, mutational differences, and immunological properties were identified using NK cell-related genes using consistent clustering. Subsequently, a signature of 5 genes was constructed, which was highly robust, unrelated to clinicopathological traits, and had a consistent prognostic impact across independent datasets. The RS was integrated with clinicopathological variables to further enhance the prognostic model and survival prediction.
According to reports, clinicopathological factors such as tumor volume, clinical stage, lymphatic and vascular infiltration, and lymph node metastases were all substantially correlated with NK cell activity in GC (Takeuchi et al., 2001). Further, significantly less NK cell infiltration within the tumor was linked to a lower chance of survival and a faster course of the disease in GC patients (Li et al., 2016, Peng et al., 2017). Additionally, it was demonstrated that the frequency of NK cell apoptosis was correlated with the advancement of GC and was considerably greater in GC patients (21.3% ± 11.6%) than in healthy controls (11.2% ± 5.2%; p = 0.0016) (Saito et al., 2013). In another report, patients with gastric and colorectal cancer had fewer NK cells in contrast to patients without liver metastases (10.1% ± 11.6% vs. 16.6% ± 8.9%, p = 0.039) (Gulubova et al., 2009). Further, the NK cell percentage and NK cell activity in the blood were significantly higher after gastrectomy (Wang et al., 2013). Several studies have also uncovered prognostic models for NK cells in several cancers, including colorectal cancer (Shembrey et al., 2022), head and neck cancer (Chi et al., 2022), and lung adenocarcinoma (Song et al., 2022). They have been effective in predicting prognosis, the immune microenvironment and immunotherapy. Our study is the first to use NK cells to construct two molecular subtypes as well as a 5-gene signature, which was effective in predicting prognosis, immunotherapy, and the immune microenvironment in GC.
The five genes, including matn3, serpine1, arhgef39, vsnl1, and entpd2 were employed to construct a gene signature for GC. Previous research has shown that MATN3 is found in matrices produced by cultured chondrosarcoma cells and is involved in the development of cartilage and bone (Vincourt et al., 2008). Further, MATN3 mutations were associated with common bone diseases and rare dyschondroplasia (Dasa et al., 2019, Mabuchi et al., 2004). Furthermore, some studies have demonstrated a marked dysregulation of MATN3 in a variety of tumors, such as ductal adenocarcinoma of the pancreas and osteosarcoma (Ding et al., 2020, Yiqi et al., 2020). SERPINE1 was found to be noticeably overexpressed in a range of tumor tissues using high-throughput sequencing technologies (Huang et al., 2021). Additionally, increased SERPINE1 activity encouraged the spread of GC (Li et al., 2019), and high SERPINE1 expression may be a sign of poor prognosis for GC (Chen et al., 2022). Furthermore, ARHGEF39 expression was elevated and connected to GC cell proliferation and migration, according to a study (Wang et al., 2018). Lauren’s categorization, lymph node metastases, distant metastasis, TNM stage, and prognosis in GC were all positively linked with VSNL1 expression (Dai et al., 2020). Notably, the overexpression of ENTPD2 was an indicator of a poor prognosis in HCC (Oura et al., 2021). These data implied that the gene signature constructed using these five genes had a definite value and feasibility.
Though we applied bioinformatics tools on a large sample set to find NK-associated subgroups of GC with substantial prognostic differences and a prediction model, we must acknowledge limitations in our work. We intended to lay a larger focus in the future on research that was both fundamentally experimental and functionally in-depth. When separating the molecular subtypes, we did not take into account additional factors. This is because the samples lacked critical clinical follow-up information, most notably diagnostic details, such as whether or not the patients had other health issues.
We first used NK cell-related genes to reliably group stable molecular subtypes. These three molecular subgroups differed in terms of prognosis, clinical features, pathway characteristics, mutation attributes, and immunological characteristics. Subsequently, using DEGs analysis among molecular subtypes and Lasso analysis, five genes associated with NK cell prognosis were chosen. Furthermore, our RS model was established in line with NK cell prognosis-related genes, which had a high prediction accuracy and survival prediction capacity. It was also robust, irrespective of clinicopathological characteristics, and had a consistent prognostic impact across various datasets. Finally, the RS was integrated with clinicopathological variables to improve the prognostic model and prediction of survival for GC.
Acknowledgement: None.
Funding Statement: The authors received no specific funding for this study.
Author Contributions: The authors confirm their contribution as follows: study conception and design: Gaozhong Li, Qing Jia; data collection: Gaozhong Li; analysis and interpretation of results: Fuxin Li; draft manuscript preparation: Ning Wei. All authors reviewed the results and approved the final version of the manuscript.
Availability of Data and Materials: The datasets generated during and/or analyzed during the current study are available from the corresponding author upon reasonable request.
Ethics Approval: Not applicable.
Conflicts of Interest: The authors declare that they have no conflicts of interest to report regarding the present study.
References
Allemani C, Matsuda T, di Carlo V, Harewood R, Matz M et al. (2018). Global surveillance of trends in cancer survival 2000–14 (CONCORD-3Analysis of individual records for 37,513,025 patients diagnosed with one of 18 cancers from 322 population-based registries in 71 countries. Lancet 391: 1023–1075. [Google Scholar] [PubMed]
Auberger P, Tamburini-Bonnefoy J, Puissant A (2020). Drug resistance in hematological malignancies. International Journal of Molecular Sciences 21: 6091. [Google Scholar] [PubMed]
Blanche P, Dartigues JF, Jacqmin-Gadda H (2013). Estimating and comparing time-dependent areas under receiver operating characteristic curves for censored event times with competing risks. Statistics in Medicine 32: 5381–5397. [Google Scholar] [PubMed]
Chen B, Khodadoust MS, Liu CL, Newman AM, Alizadeh AA (2018). Profiling tumor infiltrating immune cells with CIBERSORT. Methods in Molecular Biology 1711: 243–259. [Google Scholar] [PubMed]
Chen S, Li Y, Zhu Y, Fei J, Song L, Sun G, Guo L, Li X (2022). SERPINE1 overexpression promotes malignant progression and poor prognosis of gastric cancer. Journal of Oncology 2022: 2647825. [Google Scholar] [PubMed]
Chi H, Xie X, Yan Y, Peng G, Strohmer DF, Lai G, Zhao S, Xia Z, Tian G (2022). Natural killer cell-related prognosis signature characterizes immune landscape and predicts prognosis of HNSCC. Frontiers in Immunology 13: 1018685. [Google Scholar] [PubMed]
Cooper MA, Fehniger TA, Caligiuri MA (2001). The biology of human natural killer-cell subsets. Trends in Immunology 22: 633–640. [Google Scholar] [PubMed]
Dai QQ, Wang YY, Jiang YP, Li L, Wang HJ (2020). VSNL1 promotes gastric cancer cell proliferation and migration by regulating P2X3/P2Y2 receptors and is a clinical indicator of poor prognosis in gastric cancer patients. Gastroenterology Research and Practice 2020: 7241942. [Google Scholar] [PubMed]
Dasa V, Eastwood JRB, Podgorski M, Park H, Blackstock C, Antoshchenko T, Rogala P, Bieganski T, Jazwinski SM, Czarny-Ratajczak M (2019). Exome sequencing reveals a novel COL2A1 mutation implicated in multiple epiphyseal dysplasia. American Journal of Medical Genetics Part A 179: 534–541. [Google Scholar] [PubMed]
Ding J, Liu Y, Lai Y (2020). Identifying MMP14 and COL12A1 as a potential combination of prognostic biomarkers in pancreatic ductal adenocarcinoma using integrated bioinformatics analysis. PeerJ 8: e10419. [Google Scholar] [PubMed]
Eusebi LH, Telese A, Marasco G, Bazzoli F, Zagari RM (2020). Gastric cancer prevention strategies: A global perspective. Journal of Gastroenterology and Hepatology 35: 1495–1502. [Google Scholar] [PubMed]
Geeleher P, Cox N, Huang RS (2014). pRRophetic: An R package for prediction of clinical chemotherapeutic response from tumor gene expression levels. PLoS One 9: e107468. [Google Scholar] [PubMed]
Guillerey C, Huntington ND, Smyth MJ (2016). Targeting natural killer cells in cancer immunotherapy. Nature Immunology 17: 1025–1036. [Google Scholar] [PubMed]
Gulubova M, Manolova I, Kyurkchiev D, Julianov A, Altunkova I (2009). Decrease in intrahepatic CD56+ lymphocytes in gastric and colorectal cancer patients with liver metastases. APMIS: Acta Pathologica, Microbiologica, et Immunologica Scandinavica 117: 870–879. [Google Scholar] [PubMed]
Hänzelmann S, Castelo R, Guinney J (2013). GSVA: Gene set variation analysis for microarray and RNA-seq data. BMC Bioinformatics 14: 7. [Google Scholar]
Huang X, Zhang F, He D, Ji X, Gao J, Liu W, Wang Y, Liu Q, Xin T (2021). Immune-related gene SERPINE1 is a novel biomarker for diffuse lower-grade gliomas via large-scale analysis. Frontiers in Oncology 11: 646060. [Google Scholar] [PubMed]
Jiang P, Gu S, Pan D, Fu J, Sahu A et al. (2018). Signatures of T cell dysfunction and exclusion predict cancer immunotherapy response. Nature Medicine 24: 1550–1558. [Google Scholar] [PubMed]
Li T, Zhang Q, Jiang Y, Yu J, Hu Y, Mou T, Chen G, Li G (2016). Gastric cancer cells inhibit natural killer cell proliferation and induce apoptosis via prostaglandin E2. Oncoimmunology 5: e1069936. [Google Scholar] [PubMed]
Li L, Zhu Z, Zhao Y, Zhang Q, Wu X, Miao B, Cao J, Fei S (2019). FN1, SPARC, and SERPINE1 are highly expressed and significantly related to a poor prognosis of gastric adenocarcinoma revealed by microarray and bioinformatics. Scientific Reports 9: 7827. [Google Scholar] [PubMed]
Liberzon A, Birger C, Thorvaldsdóttir H, Ghandi M, Mesirov JP, Tamayo P (2015). The molecular signatures database (MSigDB) hallmark gene set collection. Cell Systems 1: 417–425. [Google Scholar] [PubMed]
Liu Y, Sethi NS, Hinoue T, Schneider BG, Cherniack AD et al. (2018). Comparative molecular analysis of gastrointestinal adenocarcinomas. Cancer Cell 33: 721–735.e8. [Google Scholar] [PubMed]
Mabuchi A, Haga N, Maeda K, Nakashima E, Manabe N et al. (2004). Novel and recurrent mutations clustered in the von Willebrand factor a domain of MATN3 in multiple epiphyseal dysplasia. Human Mutation 24: 439–440. [Google Scholar] [PubMed]
Newman AM, Liu CL, Green MR, Gentles AJ, Feng W, Xu Y, Hoang CD, Diehn M, Alizadeh AA (2015). Robust enumeration of cell subsets from tissue expression profiles. Nature Methods 12: 453–457. [Google Scholar] [PubMed]
Oura K, Morishita A, Tani J, Masaki T (2021). Tumor immune microenvironment and immunosuppressive therapy in hepatocellular carcinoma: A review. International Journal of Molecular Sciences 22: 5801. [Google Scholar] [PubMed]
Pan D, Kobayashi A, Jiang P, Ferrari de Andrade L, Tay RE et al. (2018). A major chromatin regulator determines resistance of tumor cells to T cell-mediated killing. Science 359: 770–775. [Google Scholar] [PubMed]
Peng LS, Zhang JY, Teng YS, Zhao YL, Wang TT et al. (2017). Tumor-associated monocytes/macrophages impair NK-Cell function via TGFβ1 in human gastric cancer. Cancer Immunology Research 5: 248–256. [Google Scholar] [PubMed]
Petryszyn P, Chapelle N, Matysiak-Budnik T (2020). Gastric cancer: Where are we heading? Digestive Diseases 38: 280–285. [Google Scholar] [PubMed]
Raskov H, Orhan A, Salanti A, Gaggar S, Gögenur I (2021). Natural killer cells in cancer and cancer immunotherapy. Cancer Letters 520: 233–242. [Google Scholar] [PubMed]
Saito H, Takaya S, Osaki T, Ikeguchi M (2013). Increased apoptosis and elevated Fas expression in circulating natural killer cells in gastric cancer patients. Gastric Cancer 16: 473–479. [Google Scholar] [PubMed]
Shembrey C, Foroutan M, Hollande F (2022). A new natural killer cell-specific gene signature predicting recurrence in colorectal cancer patients. Frontiers in Immunology 13: 1011247. [Google Scholar] [PubMed]
Shen W, Song Z, Xiao Z, Huang M, Shen D et al. (2022). Sangerbox: A comprehensive, interaction-friendly clinical bioinformatics analysis platform. iMeta 1. https://doi.org/10.1002/imt2.36 [Google Scholar] [CrossRef]
Song P, Li W, Guo L, Ying J, Gao S, He J (2022). Identification and validation of a novel signature based on NK cell marker genes to predict prognosis and immunotherapy response in lung adenocarcinoma by integrated analysis of single-cell and bulk RNA-sequencing. Frontiers in Immunology 13: 850745. [Google Scholar] [PubMed]
Sung H, Ferlay J, Siegel RL, Laversanne M, Soerjomataram I, Jemal A, Bray F (2021). Global cancer statistics 2020: GLOBOCAN estimates of incidence and mortality worldwide for 36 cancers in 185 countries. CA: A Cancer Journal for Clinicians 71: 209–249. [Google Scholar] [PubMed]
Takeuchi H, Maehara Y, Tokunaga E, Koga T, Kakeji Y, Sugimachi K (2001). Prognostic significance of natural killer cell activity in patients with gastric carcinoma: A multivariate analysis. The American Journal of Gastroenterology 96: 574–578. [Google Scholar] [PubMed]
Thorsson V, Gibbs DL, Brown SD, Wolf D, Bortone DS et al. (2018). The immune landscape of cancer. Immunity 48: 812–830.e14. https://doi.org/10.1016/j.immuni.2018.03.023 [Google Scholar] [PubMed] [CrossRef]
Vincourt JB, Vignaud JM, Lionneton F, Sirveaux F, Kawaki H et al. (2008). Increased expression of matrilin-3 not only in osteoarthritic articular cartilage but also in cartilage-forming tumors, and down-regulation of SOX9 via epidermal growth factor domain 1-dependent signaling. Arthritis and Rheumatism 58: 2798–2808. https://doi.org/10.1002/art.23761 [Google Scholar] [PubMed] [CrossRef]
Wang H, Li M, Tao X, Qian Y, Chen L, Tao G (2018). ARHGEF39 promotes gastric cancer cell proliferation and migration via Akt signaling pathway. Molecular and Cellular Biochemistry 440: 33–42. https://doi.org/10.1007/s11010-017-3153-3 [Google Scholar] [PubMed] [CrossRef]
Wang Z, Si X, Xu A, Meng X, Gao S, Qi Y, Zhu L, Li T, Li W, Dong L (2013). Activation of STAT3 in human gastric cancer cells via interleukin (IL)-6-type cytokine signaling correlates with clinical implications. PLoS One 8: e75788. https://doi.org/10.1371/journal.pone.0075788 [Google Scholar] [PubMed] [CrossRef]
Wilkerson MD, Hayes DN (2010). ConsensusClusterPlus: A class discovery tool with confidence assessments and item tracking. Bioinformatics 26: 1572–1573. https://doi.org/10.1093/bioinformatics/btq170 [Google Scholar] [PubMed] [CrossRef]
Yiqi Z, Ziyun L, Qin F, Xingli W, Liyu Y (2020). Identification of 9-gene epithelial-mesenchymal transition related signature of osteosarcoma by integrating multi cohorts. Technology in Cancer Research & Treatment 19: 1533033820980769. https://doi.org/10.1177/1533033820980769 [Google Scholar] [PubMed] [CrossRef]
Yoshihara K, Shahmoradgoli M, Martínez E, Vegesna R, Kim H et al. (2013). Inferring tumour purity and stromal and immune cell admixture from expression data. Nature Communications 4: 2612. https://doi.org/10.1038/ncomms3612 [Google Scholar] [PubMed] [CrossRef]
Yu G, Wang LG, Han Y, He QY (2012). clusterProfiler: An R package for comparing biological themes among gene clusters. Omics: A Journal of Integrative Biology 16: 284–287. https://doi.org/10.1089/omi.2011.0118 [Google Scholar] [PubMed] [CrossRef]
Zhang Z (2016). Variable selection with stepwise and best subset approaches. Annals of Translational Medicine 4: 136. https://doi.org/10.21037/atm.2016.03.35 [Google Scholar] [PubMed] [CrossRef]
Zhao H, Wu L, Yan G, Chen Y, Zhou M, Wu Y, Li Y (2021). Inflammation and tumor progression: Signaling pathways and targeted intervention. Signal Transduction and Targeted Therapy 6: 263. https://doi.org/10.1038/s41392-021-00658-5 [Google Scholar] [PubMed] [CrossRef]
Supplementary Materials
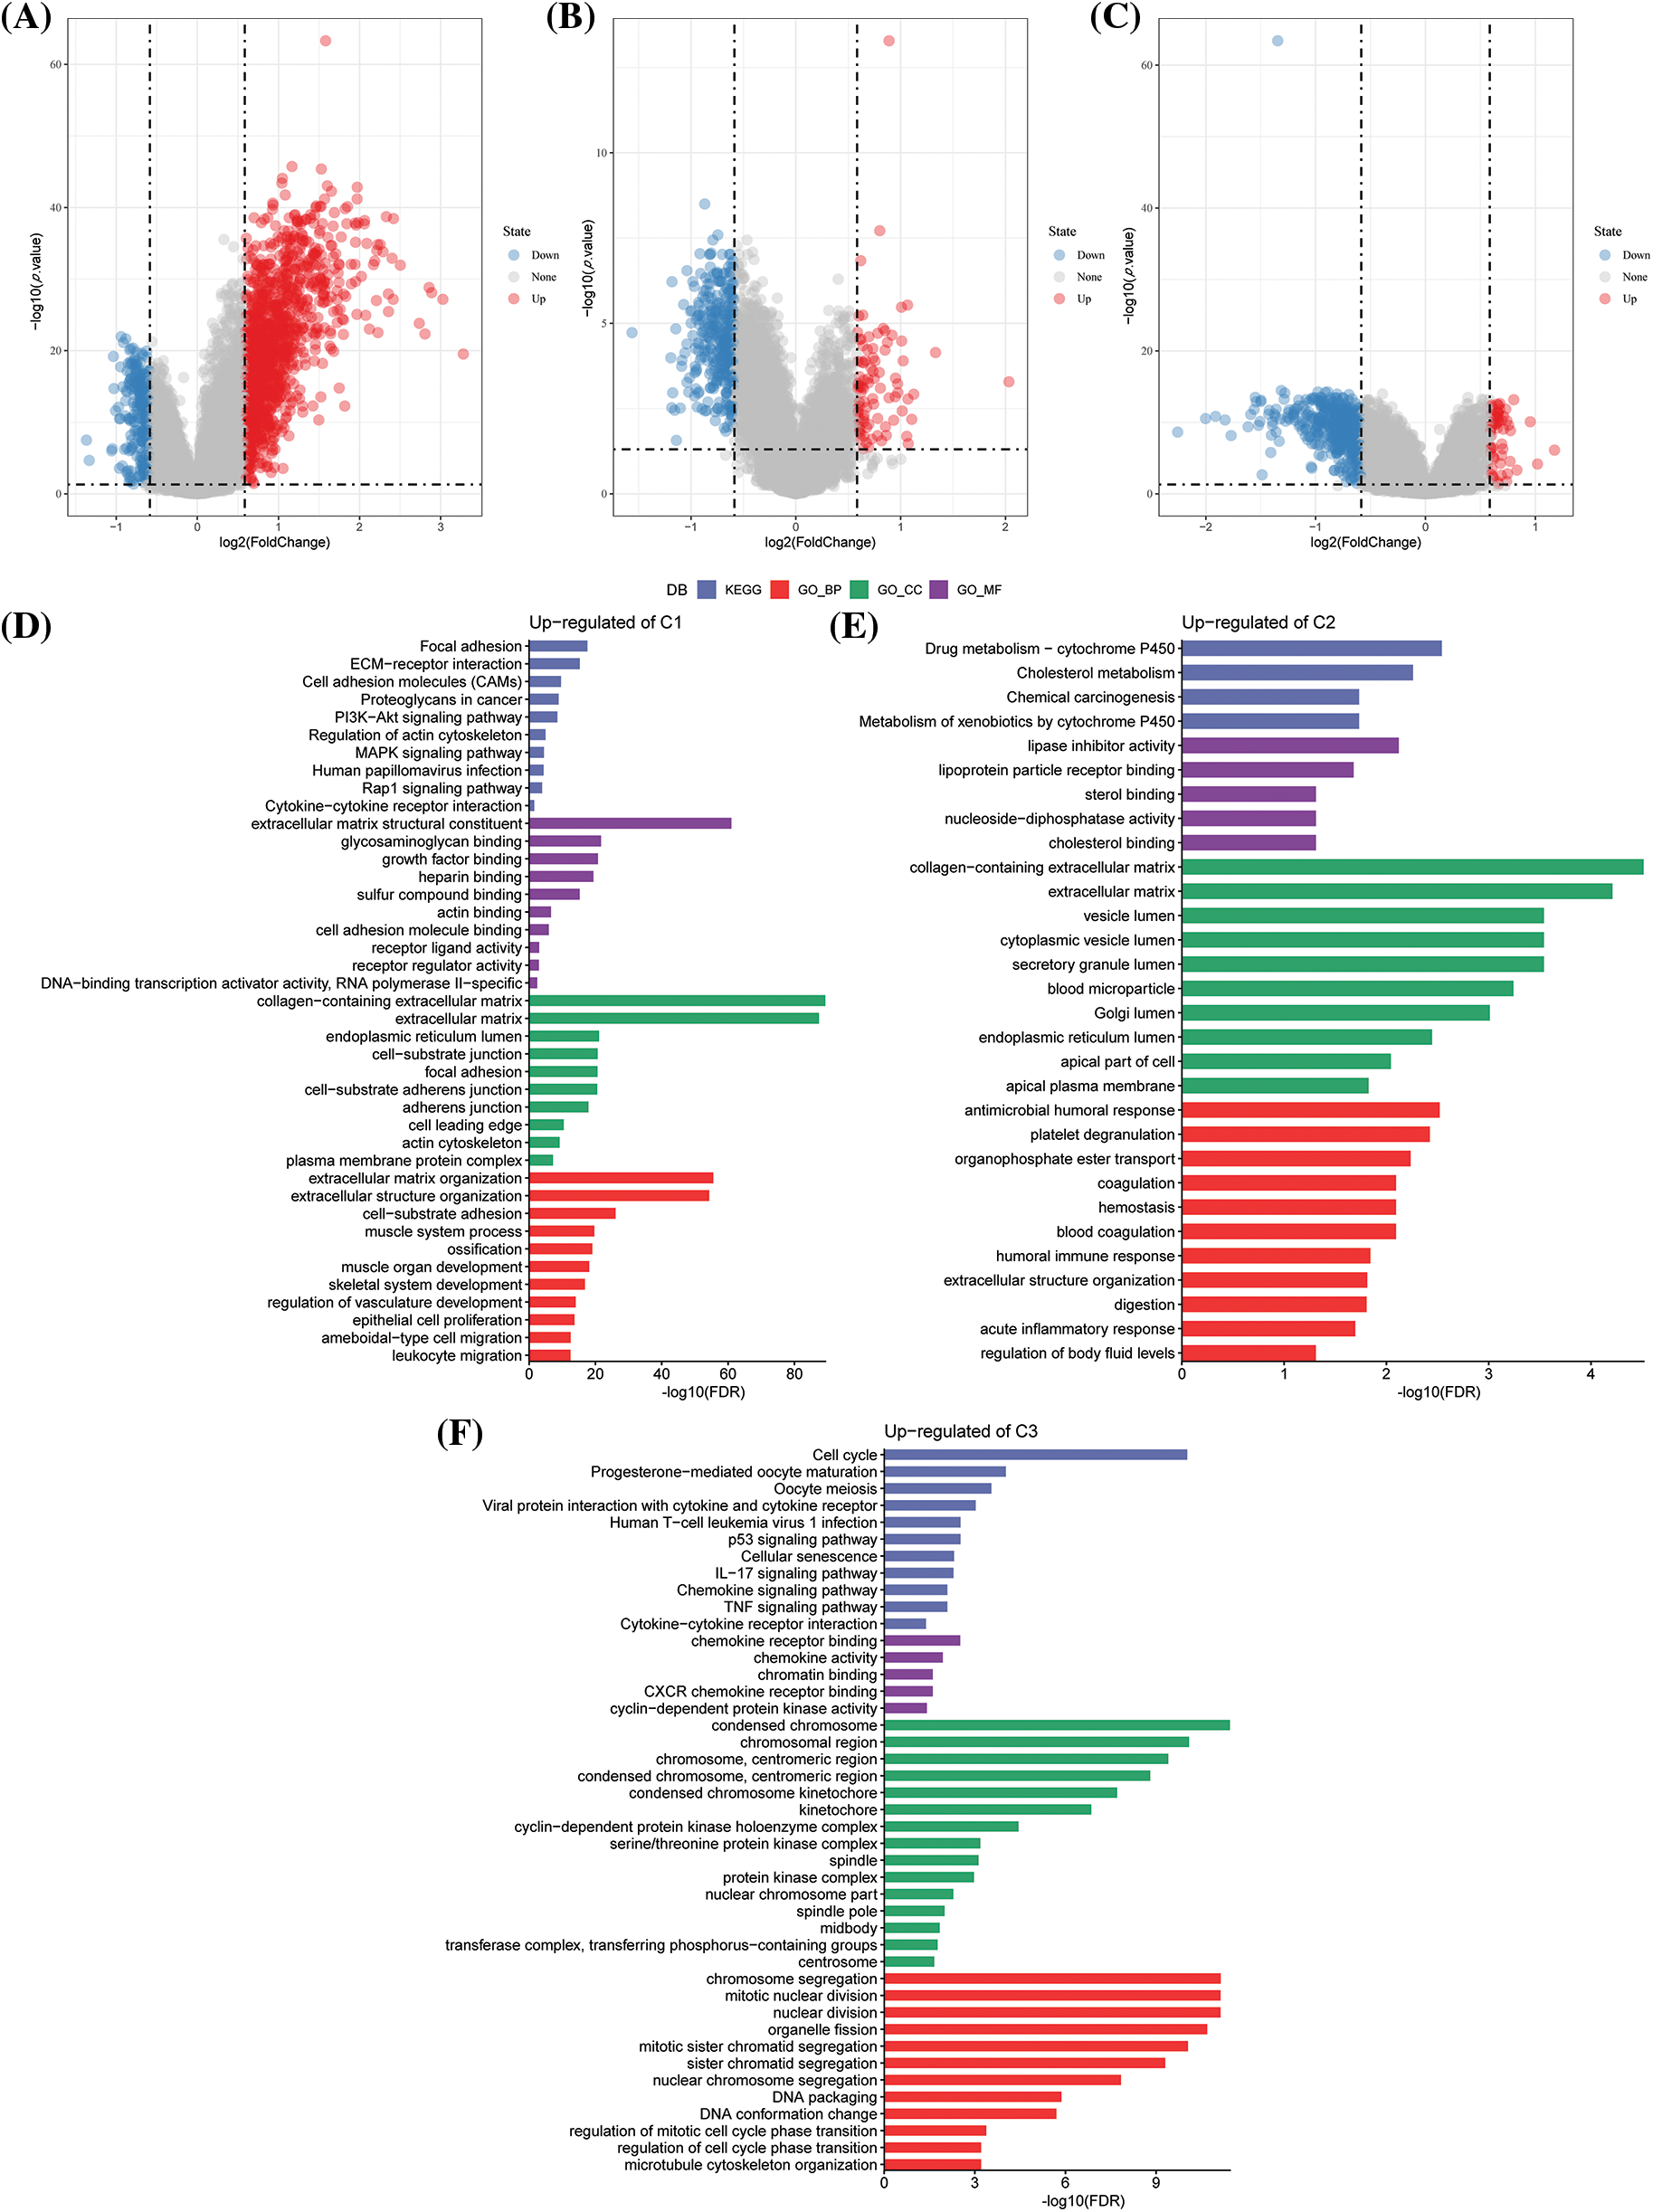
Figure S1: Differential genes and enrichment analysis among different subtypes. (A) Volcano diagram of C1 vs. other differentially expressed genes (DEGs) in The Cancer Genome Atlas-Stomach Adenocarcinoma (TCGA-STAD) dataset; (B) Volcano diagram of C2 vs. other DEGs in TCGA-STAD; (C) Volcano diagram of C3 vs. other DEGs in TCGA-STAD; (D) Gene Ontology (GO) and Kyoto Encyclopedia of Genes and Genomes (KEGG) functional enrichment analysis for the C1 vs. other differentially up-regulated genes in TCGA-STAD; (E) GO and KEGG functional enrichment analysis of C2 vs. other differentially up-regulated genes in TCGA-STAD; (F) GO and KEGG functional enrichment analysis of C3 vs. other differentially up-regulated genes in TCGA-STAD.
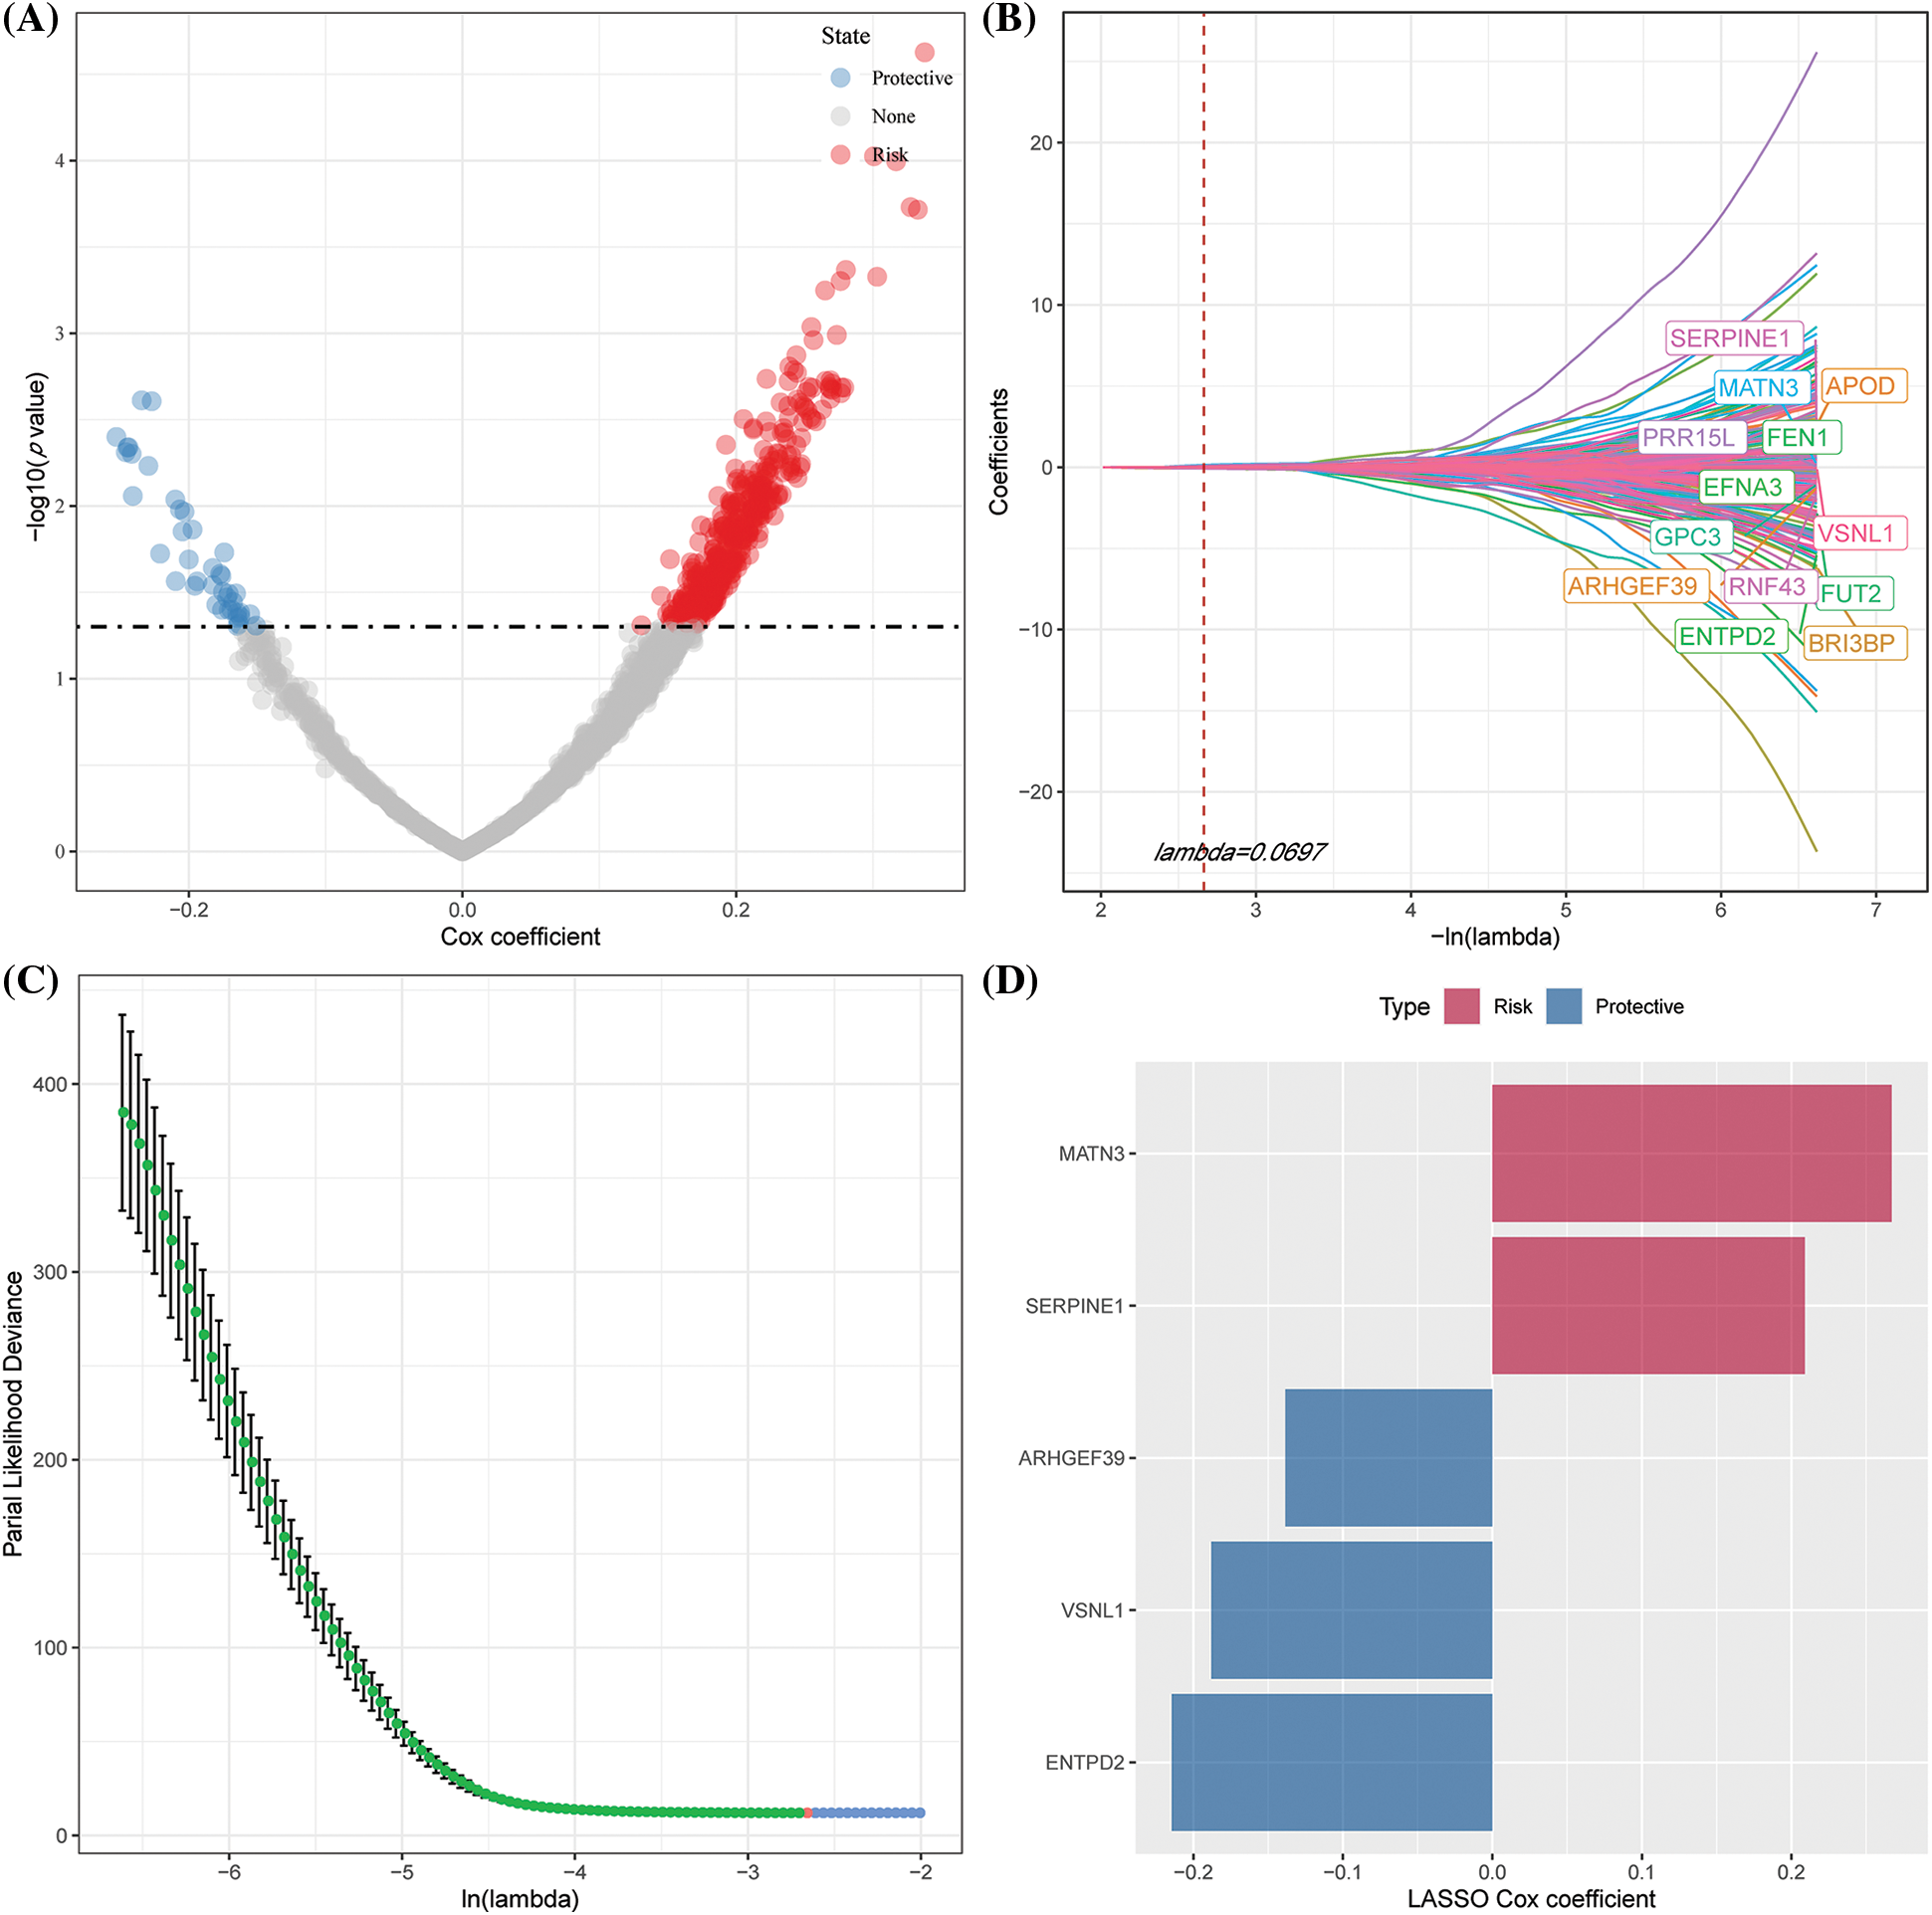
Figure S2: Identifying key risk genes. (A) 448 promising candidates were detected amongst the differentially expressed genes (DEGs); (B) The trajectory of each independent variable with lambda; (C) CI under lambda; (D) Distribution of Lasso coefficients of the natural killer (NK) cell-related gene signature.

Figure S3: Differences in clinical characteristics among different risk score (RS) groups. (A) Differences in the risk score (RS) among different clinicopathological groups in The Cancer Genome Atlas-Stomach Adenocarcinoma (TCGA-STAD); (B) RS differences among different molecular subtypes and differences between molecular subtypes and RS groups in TCGA-STAD; (C) Kaplan Meier (KM) curves of RS among different clinicopathological groups and between the low and high-risk groups in the TCGA-STAD dataset.
Cite This Article
 Copyright © 2023 The Author(s). Published by Tech Science Press.
This work is licensed under a Creative Commons Attribution 4.0 International License , which permits unrestricted use, distribution, and reproduction in any medium, provided the original work is properly cited.
 Downloads
 Citation Tools