
 Submit a Paper
 Propose a Special lssue
 Open Access
ARTICLE
Butyrophilin Downregulation in Chronic Lymphocytic Leukaemia: An Important Barrier to γδ T Cell-Mediated Cytotoxicity
Department of Clinical Immunology, Medical University of Lublin, Chodzki 4a, Lublin, 20-093, Poland
* Corresponding Author: Michał Zarobkiewicz. Email:
(This article belongs to the Special Issue: The Role of γδ T Cells and iNKT Cells in Cancer: Unraveling Molecular Mechanisms and Therapeutic Potential)
BIOCELL 2025, 49(6), 1085-1099. https://doi.org/10.32604/biocell.2025.063960
Received 30 January 2025; Accepted 30 April 2025; Issue published 24 June 2025
 View Full Text
 Download PDF
Abstract
Introduction: Butyrophilins (BTNs) belong to the immunoglobulin superfamily; they play crucial roles in immune regulation, especially in γδ T cell activation. While their expression has been studied in solid tumours, their involvement in hematologic malignancies remains poorly understood. Objectives: We hypothesised that BTNs are dysregulated in chronic lymphocytic leukaemia (CLL), contributing to γδ T cell dysfunction and potentially influencing disease progression. Methods: In this study, we analyzed publicly available microarray and RNA-seq datasets to investigate the expression patterns of BTN genes in CLL. Results: Our findings reveal significant dysregulation of BTN gene expression in CLL, with BTN2A1, BTN3A1, BTN3A2, and BTN3A3 being markedly downregulated in peripheral blood mononuclear cells (PBMCs) and bone marrow samples from CLL patients compared to healthy volunteers, while BTN1A1 was upregulated. Furthermore, BTN2A2 was selectively downregulated in neoplastic B cells, whereas BTN3A1 was upregulated in T cells from CLL patients compared to healthy volunteers. Notably, lower BTN expression was associated with an unmutated IGVH status and male sex. Kaplan-Meier survival analysis demonstrated that higher expression of BTN2A1, BTN3A1, BTN3A2, and BTN3A3 correlated with a significantly longer overall survival. Conclusions: Given the established role of BTN2A1 and BTN3A1 in the phosphoantigen-mediated activation of Vδ2 γδ T cells, their downregulation may contribute to γδ T cell dysfunction in CLL. These results highlight the potential prognostic value of BTN gene expression in CLL and underscore the need for further studies exploring its mechanistic role in disease progression and immune evasion.Keywords
Butyrophilins (BTN) are a family of proteins encoded by 7 genes: BTN1A1, BTN2A1, BTN2A2, BTN2A3, BTN3A1, BTN3A2, BTN3A3. Since BTN2A3 is a pseudogene, there are only six functional BTNs [1]. They belong to the superfamily of immunoglobulins and structurally resemble the regulatory B7 family of molecules [2,3]. BTNs are strongly expressed in lymphoid tissues, including B cells and T cells [2]. Among them, BTN1A1 is rarely expressed in leukocytes, whereas BTN2A2 is exclusively expressed in these cells. All other BTNs are widely expressed in different tissues, both healthy and cancerous [1]. So far, BTN expression has been primarily studied in solid tumours [4]. For instance, low expression of BTN3A3 is a negative prognostic factor in non-small cell lung cancer [5]. Similarly, higher expression of BTN3A1 in bladder cancer indicates better overall survival [6].
BTN2A1, BTN3A1, BTN3A2, and BTN3A3 are involved in γδ T cell stimulation, while BTN1A1 and BTN2A2 exert inhibitory effects [3]. BTN2A1 and BTN3A1 are crucial for the phosphoantigen-dependent activation of human Vδ2 cells [3,7]. Even though the function of BTN3A1 had been recognised for some time, only the discovery of BTN2A1’s importance was a breakthrough [8]. Under physiological conditions, the phosphoantigen level in normal human cells remains low. However, in numerous infections or neoplastic processes, the concentration of phosphoantigens increases. Phosphoantigens bind the intracellular B30.2 domain of BTN3A1, which leads to its heterodimerisation or heteropolymerisation with BTN2A1 and possibly also BTN3A2. This complex is then recognized by the Vγ9Vδ2 TCR unit, resulting in Vδ2 activation [9–11].
γδ T cells constitute a small fraction of total T cells (approx. 2%–5%), yet they are a crucial part of the immune system due to their ability to rapidly respond to infections, e.g., tuberculosis, and cancer. While they are essential in normal immunosurveillance, γδ T cells may also be implicated in the pathogenesis of various diseases, including multiple sclerosis or asthma [12–14]. They are typically divided into Vδ1, Vδ2, and Vδ3 based on the variable fragment of the T cell receptor (TCR) δ they use [15]. Each subset recognises distinct, partially conserved antigens: Vδ1 primarily binds to self-antigens such as MIC-A (MHC class I polypeptide–related sequence A) or MIC-B (MHC class I polypeptide–related sequence B), Vδ2 responds to phosphoantigens, whereas the antigen targets of Vδ3 remain poorly characterised [16–19].
γδ T cells, especially the Vδ2 ones, are exhausted and dysfunctional in the course of chronic lymphocytic leukaemia (CLL) [20]. While human γδ T cells, both Vδ1 and Vδ2 ones, from healthy donors recognise and potently kill CLL cell lines like MEC-1 in vitro, those derived from CLL patients show severely limited cytotoxic activity [21,22]. CLL patients have previously been divided based on the proliferative capacity of Vδ2 cells into responders and non-responders; the non-responders are more likely to have unmutated IGVH (immunoglobulin heavy chain variable region), an important negative prognostic marker in CLL [23–25]. Notably, IGVH mutation status is of clinical significance. While the classical front-line therapy consists of a fludarabine, cyclophosphamide, and rituximab regimen, patients with unmutated IGVH are less likely to respond well to treatment and fail to achieve long-term remissions. Additionally, they are more frequently affected by severe toxicities, including treatment-related myeloid neoplasms [26]. Various mechanisms underlying impaired proliferation were proposed and tested, but the expression pattern of BTNs in CLL has never been investigated.
We hypothesised that BTNs are significantly dysregulated in CLL patients and that their altered expression contributes to γδ T cell dysfunction, which in turn may affect disease progression and patient survival. To test our assumptions, we extracted the expression data of BTN genes from publicly available datasets and, after normalisation, conducted comparative analyses.
Microarray datasets were retrieved from the Gene Expression Omnibus (GEO) Dataset website, a repository maintained by the National Library of Medicine (https://www.ncbi.nlm.nih.gov/gds) [27]. Datasets that included CLL patients were selected, but only untreated samples were considered for the analysis. Additionally, datasets containing healthy controls were included for comparison. The following datasets were analyzed: GSE20211 [28], GSE21029 [29], GSE21942 [30], GSE9476 [31], GSE22255 [32], GSE22356 [33], GSE27567 [34], GSE6691 [35], GSE47552 [36], GSE22529 [37], GSE54017 [38]. Additionally, RNAseq data from a large cohort of CLL patients from the Broad Institute, along with limited clinical data, were obtained from cBioPortal [39,40].
Series matrix files were downloaded, and gene expression data were normalised using Min-Max scaling (0–10). Normalisation enabled direct comparison of data from different datasets. Probes corresponding to BTN family genes were extracted, with probe names selected based on annotations specific to each microarray platform used in the study. The normalisation, probe selection, and metadata extraction were handled by a Python script. If more than one probe corresponded to the same gene, all of them were extracted, and an average expression was calculated. Data for T cells were extracted from a single dataset, thus, they did not require any normalisation and are presented as transcripts per million (TPM). Similarly, the Broad Institute dataset did not require normalisation as it was independently analyzed.
Statistical analysis was performed in GraphPad Prism 9 (GraphPad Software, San Diego, CA, USA). The Shapiro-Wilk test was used to assess data distribution. Due to a non-normal distribution, the Mann-Whitney U test was used to calculate p-values. Data are presented as individual points with marked median and IQR (interquartile range). Survival analysis was assessed in JASP 0.19.3 (Department of Psychological Methods, University of Amsterdam) with Kaplan-Meier curves, and the statistical significance was then calculated with the Mantel-Haenszel (log-rank) test.
3.1 Butyrophilins Are Downregulated in CLL-Derived PBMCs
Initially, we analyzed the total expression of BTN genes in peripheral blood mononuclear cells (PBMCs) of CLL patients and healthy volunteers. BTN2A1, BTN3A1, BTN3A2, and BTN3A3 were all significantly downregulated in CLL patients (Fig. 1B,D–F). This suggests a broad dysregulation of BTNs in CLL pathophysiology. In contrast, BTN1A1 was upregulated in CLL patients (Fig. 1A), while BTN2A2 did not exhibit any statistically significant differences (Fig. 1C).
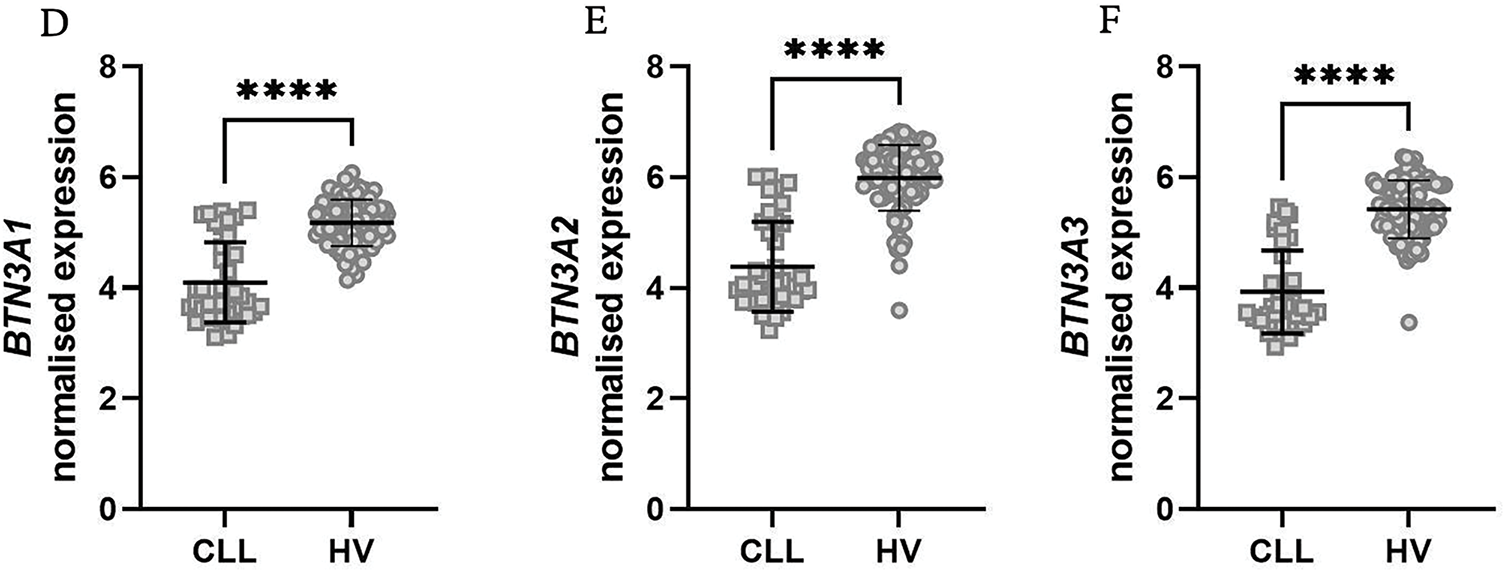
Figure 1: Expression levels of various butyrophilin (BTN) genes in PBMCs from healthy volunteers (HV) and patients with chronic lymphocytic leukaemia (CLL). The normalised expression data for BTN1A1 (A), BTN2A1 (B), BTN2A2 (C), BTN3A1 (D), BTN3A2 (E), and BTN3A3 (F) are displayed as scatter dot plots with a median and interquartile range. Statistical analysis indicates significant upregulation of BNT1A1 (A), while downregulation of BTN2A1, BTN3A1, BTN3A2, and BTN3A3 (B–E) in CLL samples compared to HV was noted. BTN2A2 expression (C) shows no significant difference. Statistical significance was assessed using the U Mann-Whitney test. **p < 0.01; ***p < 0.001; ****p < 0.0001; ns, not significant
3.2 All Six Butyrophilins are Significantly Dysregulated in the Bone Marrow of CLL Patients
Following our PBMC analysis, we extended our investigation to bone marrow samples from both CLL patients and healthy volunteers. Consistent with our PBMC findings, BTN1A1 was again significantly upregulated in CLL patients (Fig. 2A), while the remaining five BTN genes were significantly downregulated (Fig. 2B–F). A notable difference should be noted for BTN2A2, which did not differ in PBMCs, while being substantially downregulated in bone marrow.
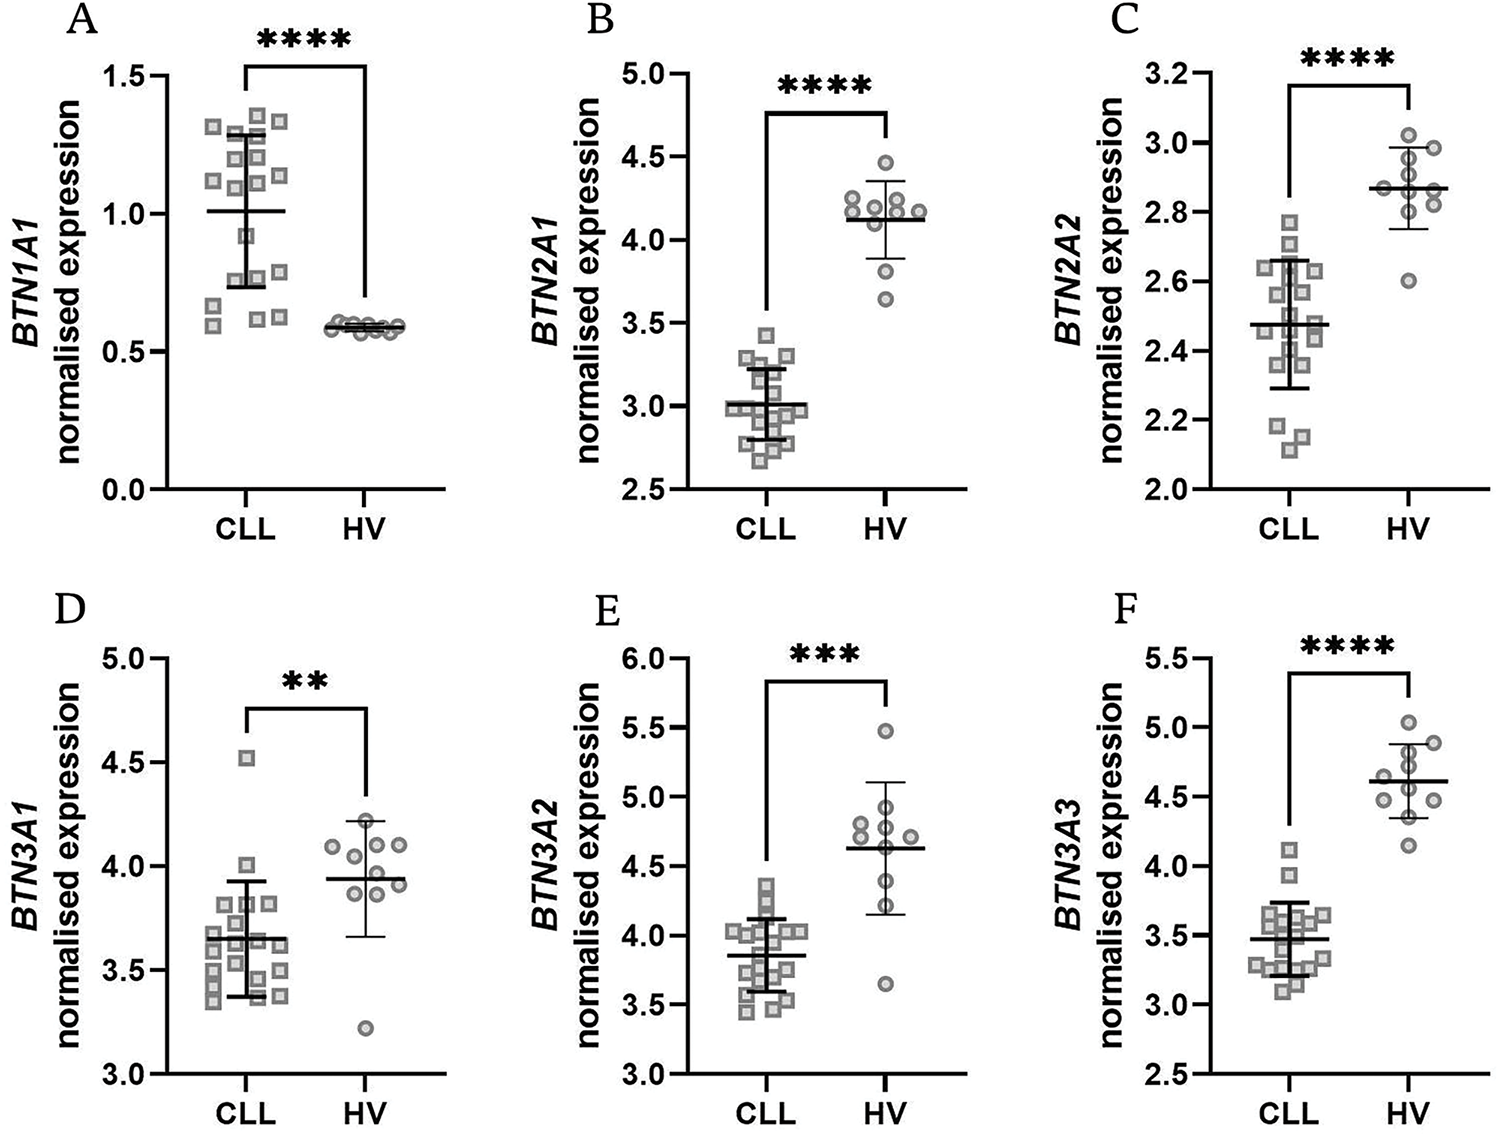
Figure 2: Expression levels of various butyrophilin (BTN) genes in bone marrow samples from healthy volunteers (HV) and chronic lymphocytic leukaemia (CLL) patients. BTN1A1 showed a significant increase in CLL patients (A), while BTN2A1, BTN2A2, BTN3A1, BTN3A2, and BTN3A3 showed a significant decrease (B–F). Normalised expression levels are displayed as scatter dot plots with median and interquartile range. Statistical significance was assessed using the U Mann-Whitney test. **p < 0.01; ***p < 0.001; ****p < 0.0001
3.3 BTN2A2 Is Downregulated in Isolated Neoplastic B Cells, and BTN3A1 Is Upregulated in T Cells from CLL Patients
To refine our understanding of BTN dysregulation in specific immune compartments, we analyzed BTN expression in isolated neoplastic B cells and T cells obtained from the peripheral blood of CLL patients and healthy volunteers. In contrast to PBMCs, a relatively uniform expression of nearly all butyrophilins was noted in B cells except for BTN2A2, which was significantly downregulated in CLL (Fig. 3A–F).
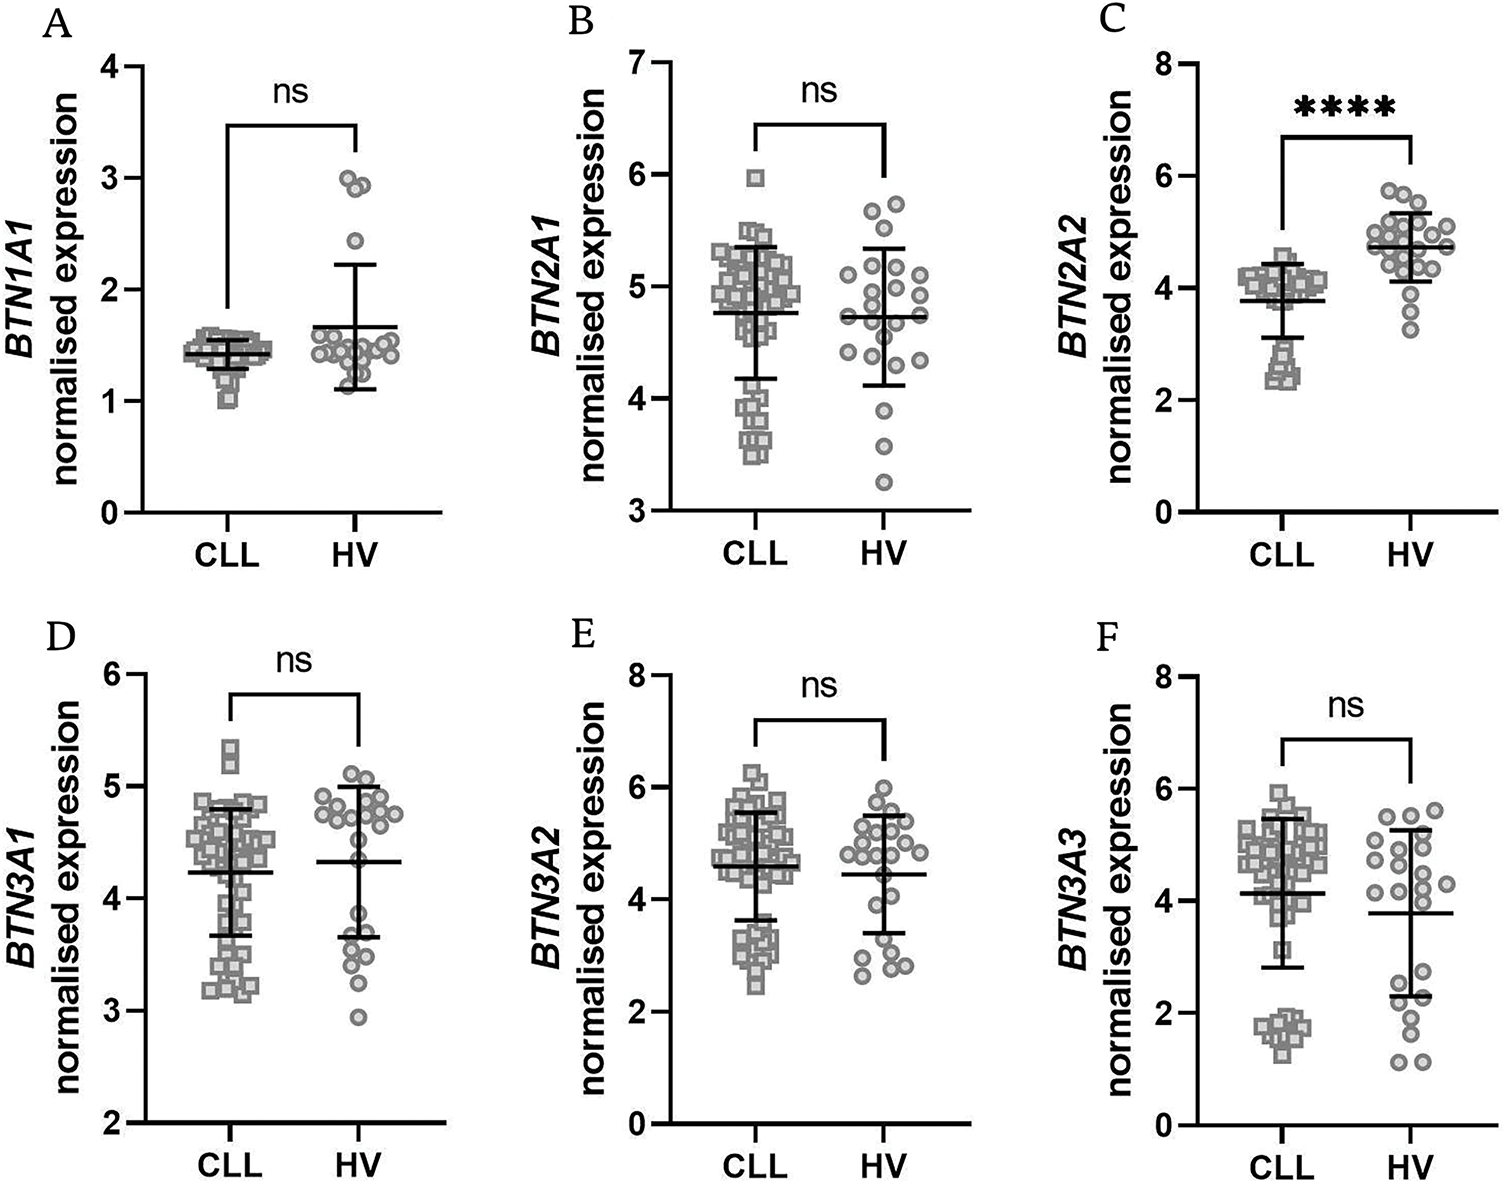
Figure 3: Normalised expression levels of BTN1A1, BTN2A1, BTN2A2, BTN3A1, BTN3A2, and BTN3A3 in isolated B cells from healthy donors (HV) and neoplastic B cells from chronic lymphocytic leukaemia (CLL) patients. BTN2A2 expression was significantly lower in CLL patients (C), while no differences were noted for other BTNs (A,B,D–F). Data are displayed as scatter dot plots with median and interquartile range. Statistical significance was assessed using the U Mann-Whitney test. ****p < 0.0001; ns, not significant
BTN1A1 was not expressed in T cells, whereas BTN3A1 was markedly upregulated in T cells from CLL patients (Fig. 4C). The expression pattern of the remaining BTN genes showed no substantial differences (Fig. 4A,B,C,E).
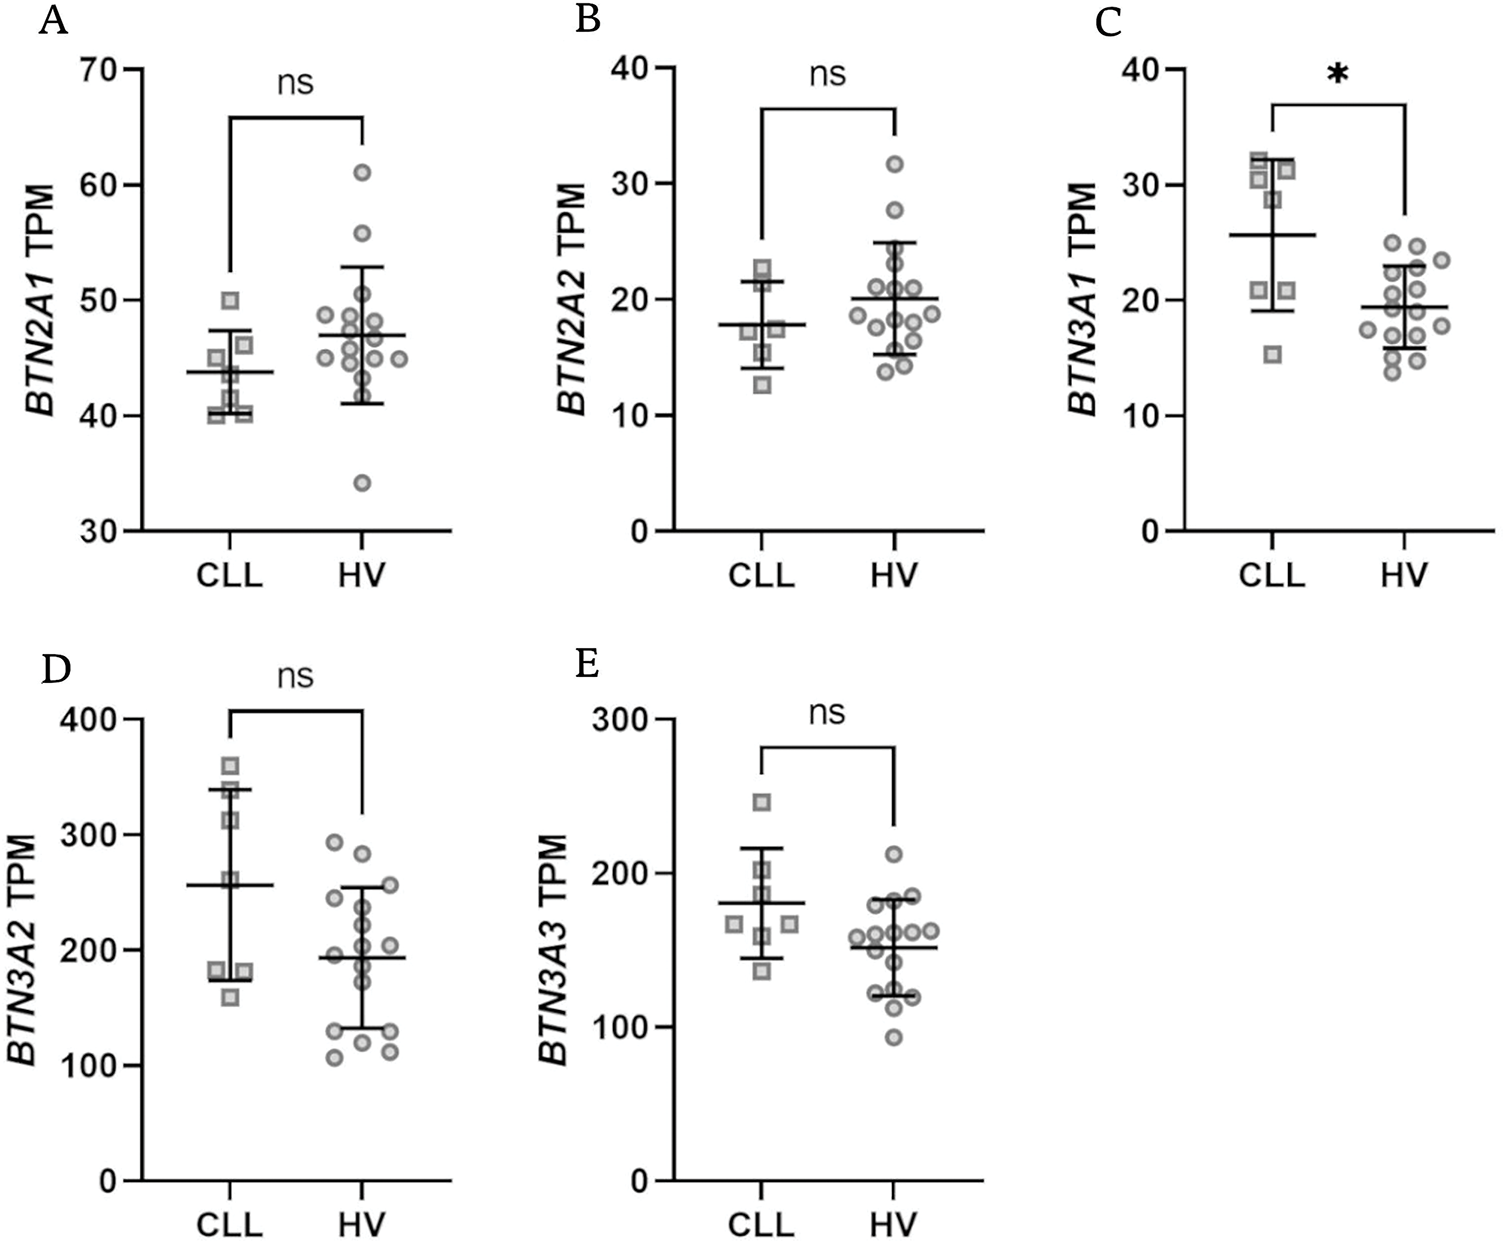
Figure 4: Expression levels of BTN genes in isolated T lymphocytes from healthy volunteers (HV) and chronic lymphocytic leukaemia (CLL) patients. There was no expression of BTN1A1. Only BTN3A1 showed a significant difference with notable upregulation in CLL patients (C); no differences were noted for BTN2A1, BTN2A2, BTN3A2, BTN3A3 (A,B,D,E). Data are expressed in transcripts per million (TPM), with statistical significance assessed using the Mann-Whitney U test. Data are displayed as scatter dot plots with median and interquartile range. *p < 0.05; ns, not significant
3.4 The Expression of BTN Genes Is Downregulated in Patients with Unmutated IGVH as Well as in Male Subjects
Then, we analyzed the Broad Institute dataset that contained gene expression data from PBMCs of 715 CLL patients [40]. We subdivided the patients into those with mutated and unmutated IGVH genes. The former group had significantly higher expression of all BTN genes (Fig. 5A–F).
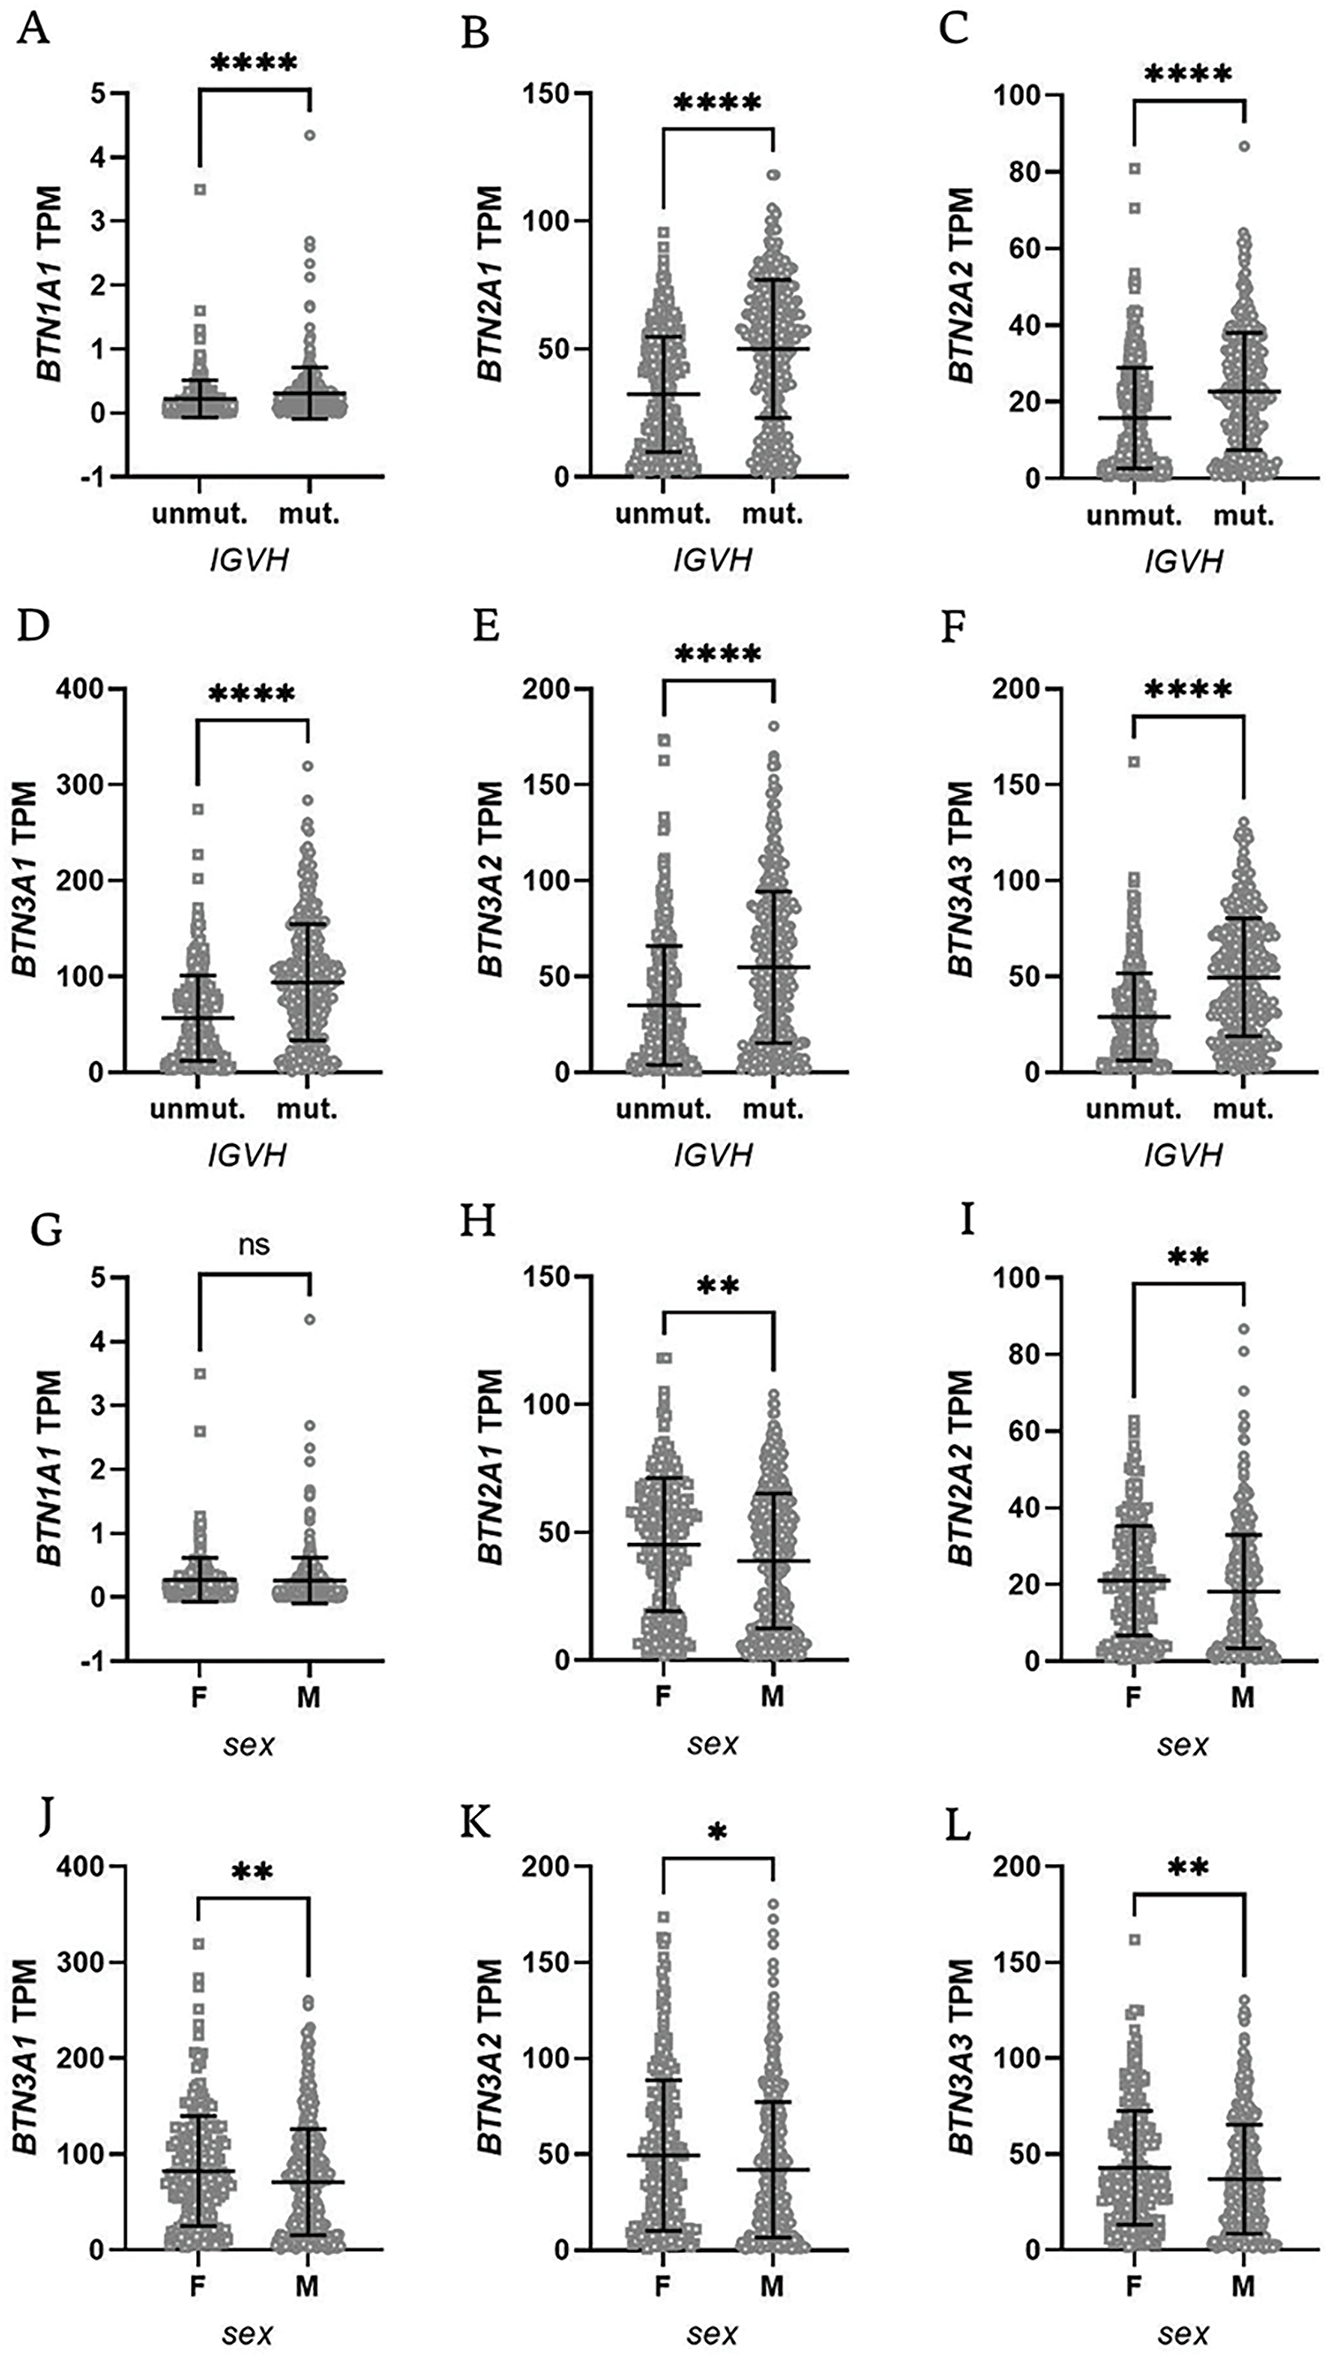
Figure 5: Butyrophilin (BTN) gene expression in CLL patients stratified by IGVH mutation status and sex. Patients were grouped based on IGVH mutation status (mutated vs. unmutated, panels A–F) or sex (female vs. male, panels G–L). A significantly lower expression of BTN genes was observed in unmutated IGVH cases, as well as in male patients. Data are displayed as scatter dot plots with median and interquartile range. Statistical significance was assessed using the Mann-Whitney U test, with significance levels indicated as follows: *p < 0.05; **p < 0.01; ****p < 0.0001; ns, not significant; F, female; M, male
Additionally, the dataset included information on patient sex, allowing for further stratification into male and female groups. Interestingly, female subjects had significantly higher expression of BTN genes except for BTN1A1 (Fig. 5G–L).
3.5 Patients with Higher BTN Expression Had Longer Overall Survival
Finally, we analyzed the impact of BTNs on overall survival (OS) in CLL patients (Fig. 6A–F). The Broad Institute dataset included both survival status and duration, with follow-up data extending up to 20 years for a limited subset of patients. While BTN1A1 and BTN2A2 expression did not affect OS, significant differences were observed for the remaining BTN genes.
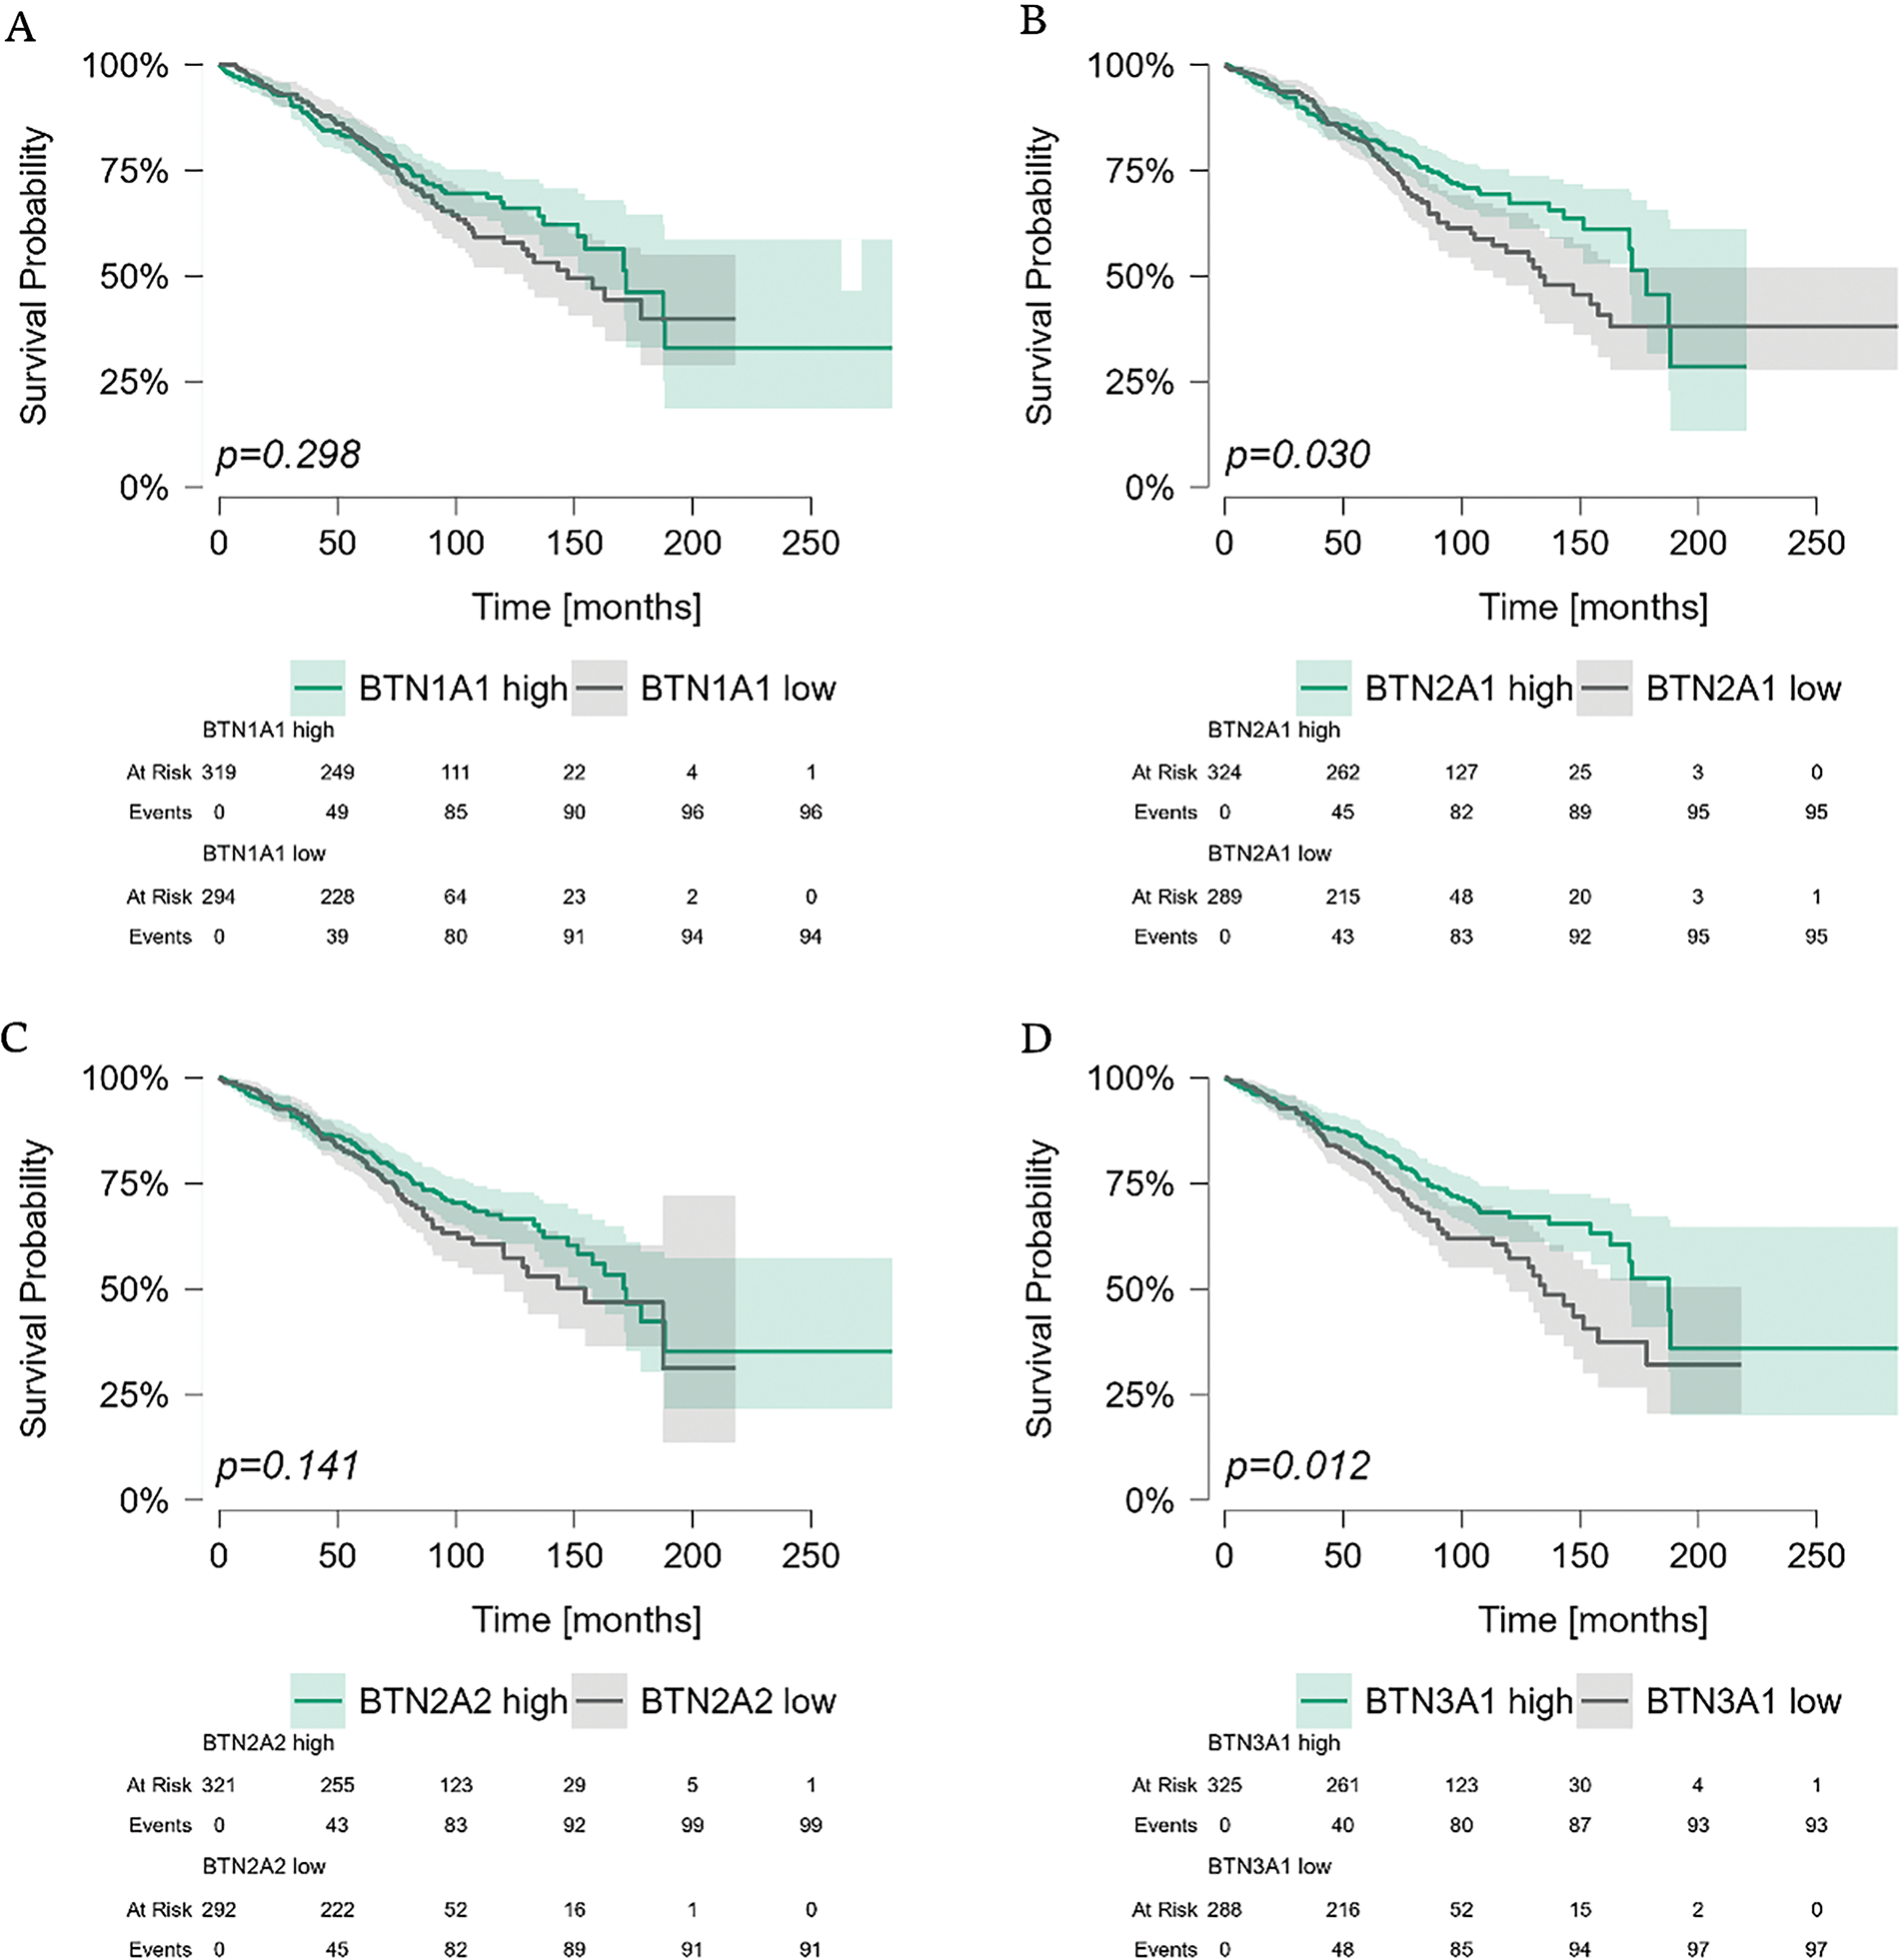
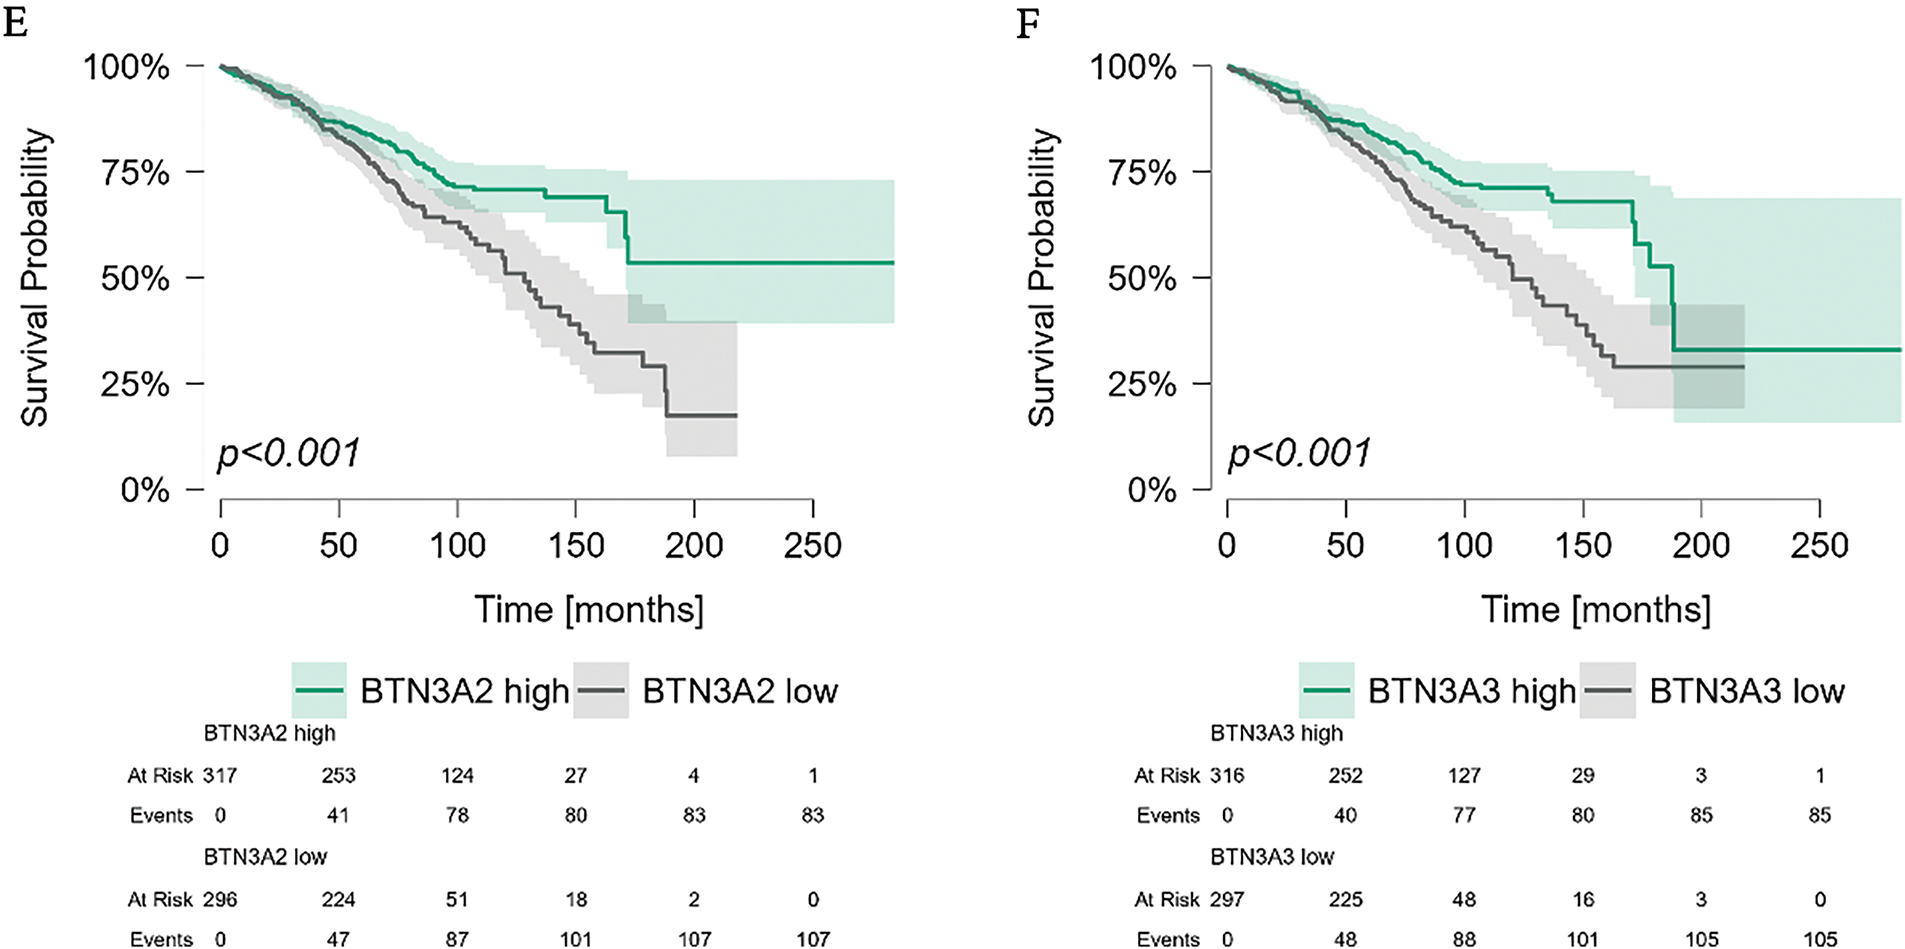
Figure 6: Kaplan-Meier survival analysis of CLL patients stratified by butyrophilin (BTN) expression in PBMCs. Patients were divided into high and low-expression groups based on the median expression value for each BTN gene. Survival was analyzed using the Kaplan-Meier curves; statistical significance was assessed using the Mantel-Haenszel (log-rank) test. Time is shown in months. Significant differences in survival were observed for BTN2A1 (p = 0.030), BTN3A1 (p = 0.012), BTN3A2 (p < 0.001), and BTN3A3 (p < 0.001), whereas BTN1A1 (p = 0.298) and BTN2A2 (p = 0.141) (A–F) showed no significant impact on survival
As the expression of BTN genes in PBMCs differed between sexes, we stratified patients by sex into male and female groups, and analyzed OS in these subgroups based on the expression levels of individual BTN genes. Generally, results for both sexes were comparable. No differences in OS were noted for BTN1A1 and BTN2A2 (Fig. 7A,C), and similar differences for both male and female subgroups were observed in BTN3A1, BTN3A2, and BTN3A3 (Fig. 7D–F). The only visible inter-sex difference was noted for BTN2A1, which seems to impact the OS in female patients, but not in males (Fig. 7B).
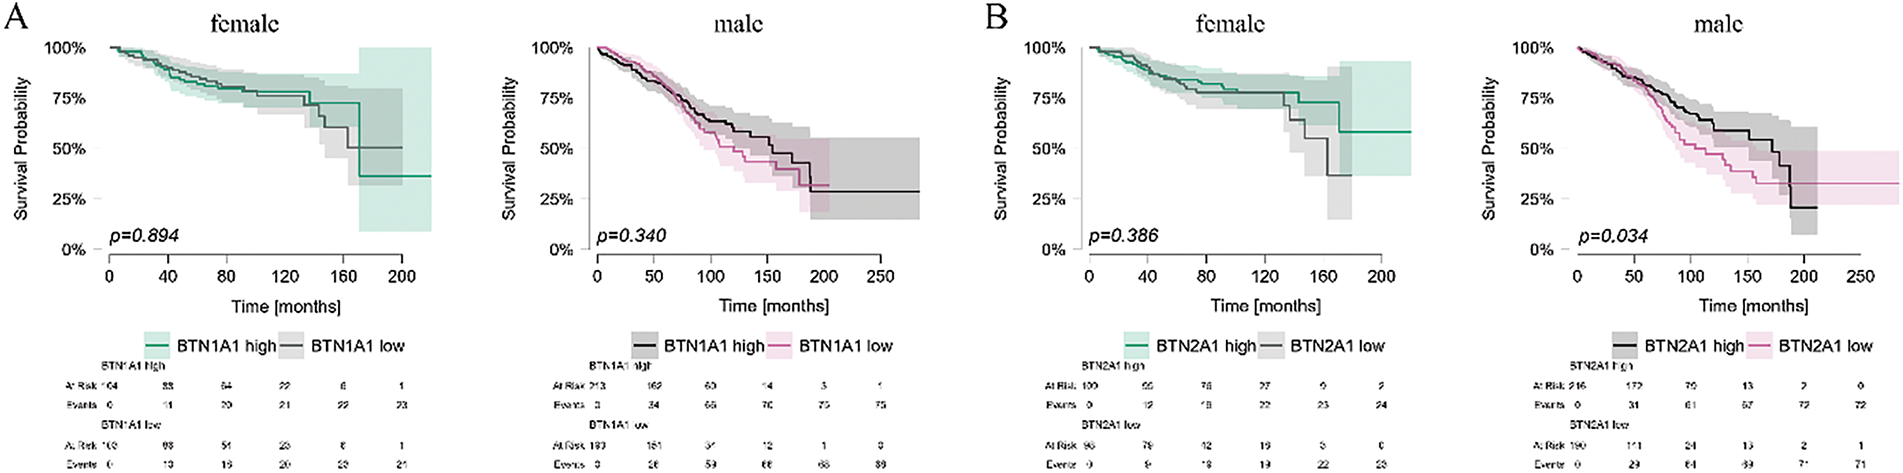
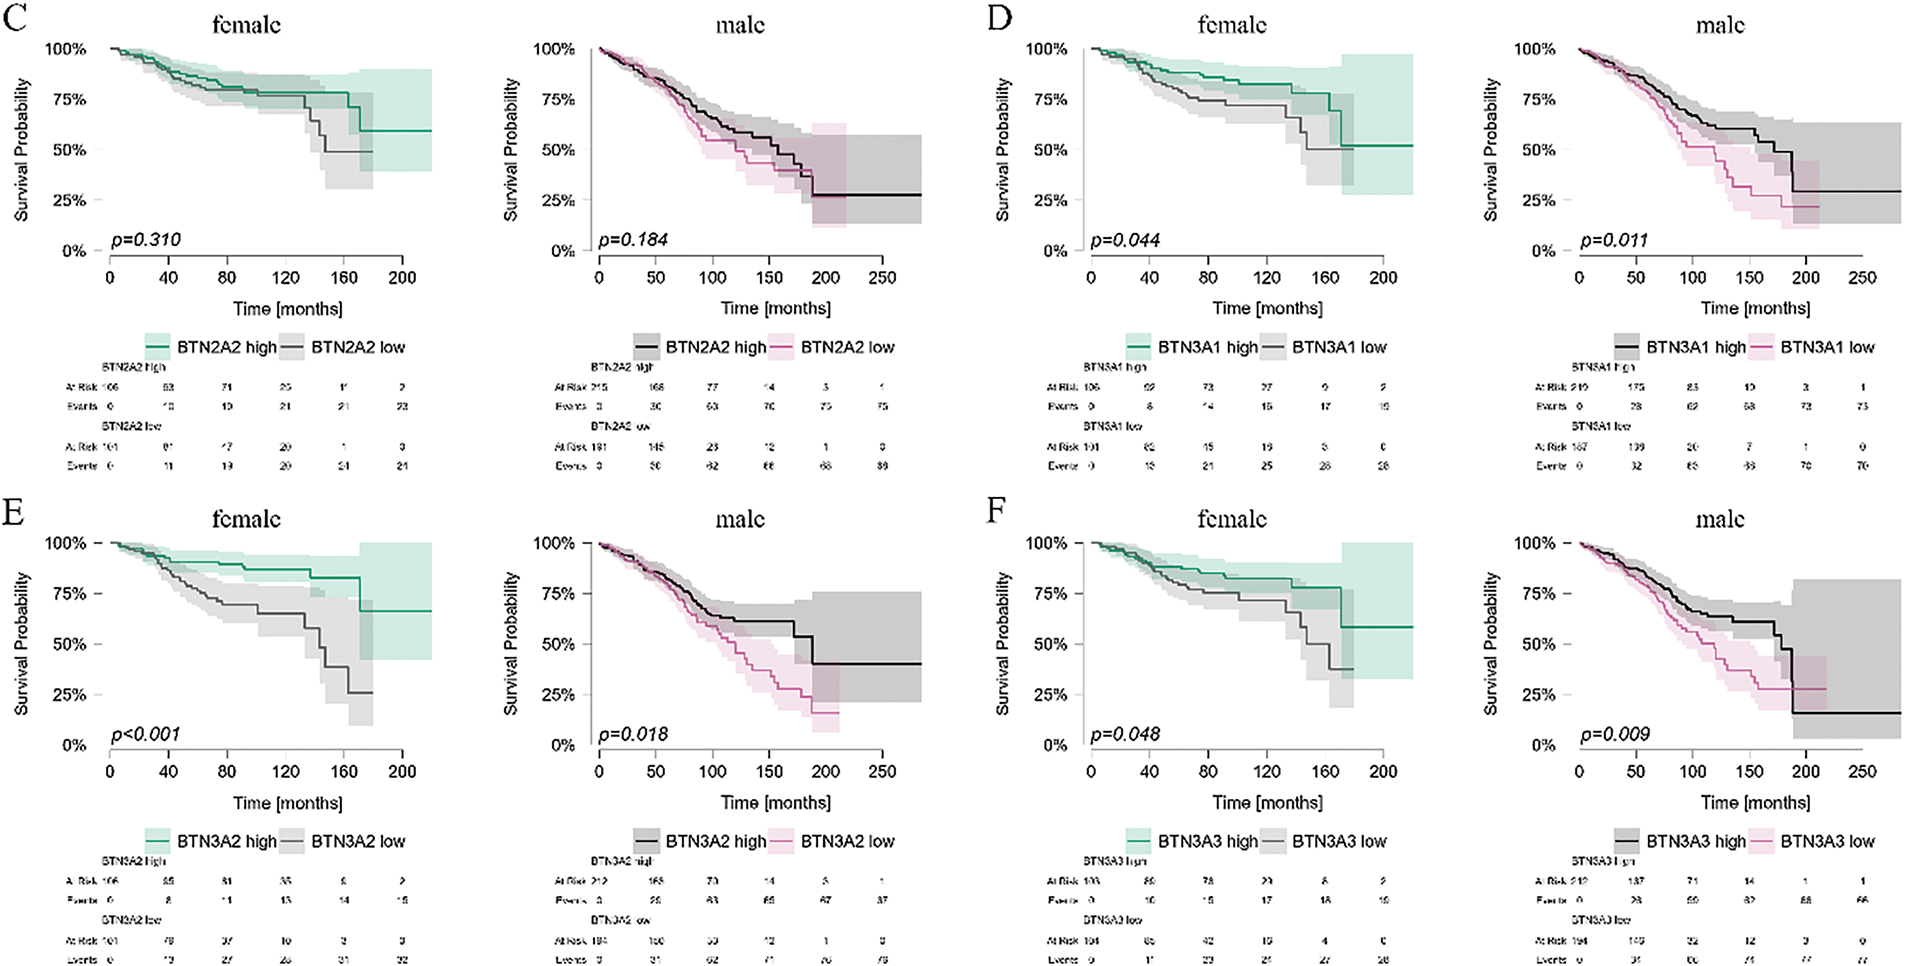
Figure 7: Kaplan-Meier survival analysis of CLL patient survival stratified by butyrophilin (BTN) expression in PBMCs, analyzed separately for male and female individuals. Patients were divided into high and low-expression groups based on the median expression value for each BTN gene: BTN1A1 (A); BTN2A1 (B); BTN2A2 (C); BTN3A1 (D); BTN3A2 (E); BTN3A3 (F). Survival was analyzed using the Kaplan-Meier curves; statistical significance was assessed using the Mantel-Haenszel (log-rank) test. Time is shown in months. Significant (p < 0.05) differences are marked by the indication of p values on the graph
In this study, we identified significant dysregulation of BTN gene’ expression in CLL. Moreover, this dysregulation had significant clinical implications, as higher BTN expression was linked to longer OS.
BTNs are crucial for the phosphoantigen-mediated activation of the Vδ2 subset of γδ T cells. As previously mentioned, γδ T cells in CLL are exhausted and functionally impaired [20]. To date, we lack any mechanistic explanation for this phenomenon. The dysregulation of BTN2A1 and BTN3A1 and their significantly lower expression in CLL are probably at least partially responsible for the γδ T dysfunction. Indeed, as recently proved by Cano et al., the expression of BTN2A1 on cancerous cells is necessary for Vδ2-mediated cytotoxic response [41]. Moreover, their findings indicate that the strength of this response is directly proportional to the surface expression of BTN2A1 on target cells [41].
Interestingly, it is a high expression of BTN3A1 that has negative prognostic value in some solid tumours like glioblastoma, pancreatic ductal adenocarcinoma, or oesophagal cancer [42–44]. On the other hand, according to Liang et al., in pan-cancer analysis of BTN3A1, its high expression is mostly a predictor of longer overall survival, e.g., in lung, breast or gastric cancer; at the same time, the negative prognostic value of BTN3A1 was noted only in testicular germ tumours and low-grade gliomas [45]. This is in line with our observations that BTN3A1 expression in PBMCs is decreased in CLL patients, even more so in those with negative prognostic markers (IGVH unmutated). More importantly, we found that higher BTN3A1 expression is a predictor of longer overall survival in CLL. Indeed, Malinowska et al. reported a case of acute myeloid leukaemia with translocations that involved the BTN3A1 gene and caused loss of heterozygosity; they concluded that it may significantly contribute towards leukaemic cell malignancy [46]. Interestingly, BTN3A2 and BTN3A3 demonstrate the most pronounced separation of survival curves; however, the underlying reasons for this remain unclear. Current literature does not provide an explanation, suggesting that further studies are needed to explain this phenomenon.
Similarly to our observations, BTN2A1, BTN3A1, BTN3A2, and BTN3A3 were significantly downregulated in breast cancer [47]. Moreover, Ren et al. also noted better overall survival in patients with high BTN2A1, BTN3A1, BTN3A2, and BTN3A3 [47]. This is also in line with our observations and further confirms their potential value and implications. Although each BTN has its own functions, they closely cooperate and synchronised expression seems necessary for proper function, most importantly for γδ T activation [48]. Thus, it is also important to analyse the expression of all BTN genes concurrently in the same samples. It may also be valuable to assess the Epstein-Barr virus (EBV) infection in the same samples. EBV is known to regulate the expression of BTN3A1 and BTN2A1 on the one hand and negatively affect the overall survival of CLL patients on the other [49–51]. Both BTN2A2 and BTN1A1 have suppressive potential and inhibit T cell activation and proliferation [52]. Interestingly, we have not observed any impact of BTN2A2 expression on OS, which is contrary to the observations in other tumours, e.g., glioma [53].
While BTN2A1 is critical for γδ T activation and cytotoxic response against cancer, it is also implicated in the transition of macrophages from pro-inflammatory M1 to suppressive M2 phenotype [41,54]. Moreover, Kreneur et al. noted that with the use of blocking anti-BTN2A1 antibodies, they were able to induce a significant shift back from M2 to M1 [54]. While this may be beneficial in some cases, it would also significantly lower the potential of γδ T cells; thus, caution is needed, especially in cases like CLL, where BTN2A1 is already lowered. While anti-BTN2A1 antibodies may have limited potential in CLL, they could be useful in tumours with higher BTN expression, like glioblastoma [55]. Additionally, γδ T cell infiltration is a positive prognostic marker in various solid tumours, e.g., head and neck cancer, where γδ T infiltration is directly proportional to the expression of BTNs in tumour cells [56].
Finally, the pattern of BTN1A1 expression is worth noting. As mentioned in the introduction, BTN1A1 expression is negligible in leukocytes. Our data indicate that, indeed, there is no expression of BTN1A1 in T lymphocytes, but in B cells and total PBMCs, it remains low, yet detectable.
Although our findings contribute to a better understanding of CLL, some limitations must be discussed. The current study was based on a re-analysis of publicly available datasets, which enabled the inclusion of a relatively high number of samples from patients with potentially different sociodemographic backgrounds. At the same time, this approach substantially affected the amount of other data available—the majority of datasets had only very limited clinical information available. The survival analysis is based on a large dataset that includes patients from the USA, Spain, and Germany treated over an extended period. While this diverse dataset allows for the inclusion of a high number of patients with varied sociodemographic backgrounds, it is important to acknowledge that differences in treatment protocols across countries may influence overall survival and introduce potential bias in our results. Another key limitation of our analysis is the use of bulk PBMCs and bone marrow samples, which do not account for variations in CLL cell load among patients. Given that PBMCs in CLL patients are largely composed of malignant B cells, while those from healthy controls contain a diverse mix of immune populations, direct comparisons may be affected by this cellular imbalance. Ideally, the CLL load should be taken into consideration. However, current dataset limitations prevent precise adjustments for CLL cell load. Future validation using isolated cell populations or adjusting for CLL burden would provide a more accurate assessment, and we aim to address this in upcoming studies. Nevertheless, we obtained encouraging results that implicate the need for further studies on fresh CLL samples with concomitant assessment of EBV infection and γδ T cells.
A strong dysregulation of BTNs in CLL samples indicates their potential clinical importance. This is further corroborated by the survival analysis results. Patients with lower expression of BTNs had significantly shorter OS. Moreover, patients with unmutated IGVH, thus those with worse prognosis, demonstrated markedly lower expression of BTNs as well. Notably, the expression of BTN genes in PBMCs had a significant impact on overall survival, highlighting their potential prognostic value. Since BTN expression in PBMCs can be easily assessed at diagnosis using a simple qPCR assay, it could potentially be incorporated into clinical practice to enhance risk stratification and improve patient management. Given the established role of BTN2A1 and BTN3A1 in γδ T cell activation, their downregulation may contribute to γδ T cell dysfunction, potentially affecting immune surveillance and disease progression. Further research is needed to validate these results in prospective cohorts and to explore the underlying mechanisms driving BTN dysregulation in CLL and their importance for the function of γδ T cells.
Acknowledgement: None.
Funding Statement: The study was funded by the National Science Center in Poland, Preludium grant number 2019/35/N/NZ6/02973.
Author Contributions: Conceptualization: Natalia Lehman, Agnieszka Bojarska-Junak, Michał Zarobkiewicz; Data curation: Michał Zarobkiewicz; Formal Analysis: Michał Zarobkiewicz; Funding acquisition: Michał Zarobkiewicz; Investigation: Natalia Lehman, Agnieszka Bojarska-Junak, Michał Zarobkiewicz; Methodology: Michał Zarobkiewicz; Project administration: Michał Zarobkiewicz; Resources: Michał Zarobkiewicz; Software: Michał Zarobkiewicz; Supervision: Michał Zarobkiewicz; Validation: Michał Zarobkiewicz; Visualization: Michał Zarobkiewicz; Writing—original draft: Michał Zarobkiewicz; Writing—review & editing: Natalia Lehman, Agnieszka Bojarska-Junak, Michał Zarobkiewicz. All authors reviewed the results and approved the final version of the manuscript.
Availability of Data and Materials: The datasets used in this study are publicly available and are listed in the Methods section. Further details, including access links, can be found in the referenced sources.
Ethics Approval: Not applicable.
Conflicts of Interest: The authors declare no conflicts of interest to report regarding the present study.
References
1. Abeler-Dörner L, Swamy M, Williams G, Hayday AC, Bas A. Butyrophilins: an emerging family of immune regulators. Trends Immunol. 2012;33(1):34–41. doi:10.1016/j.it.2011.09.007. [Google Scholar] [PubMed] [CrossRef]
2. Compte E, Pontarotti P, Collette Y, Lopez M, Olive D. Frontline: characterization of BT3 molecules belonging to the B7 family expressed on immune cells. Eur J Immunol. 2004;34(8):2089–99. doi:10.1002/eji.200425227. [Google Scholar] [PubMed] [CrossRef]
3. Herrmann T, Karunakaran MM. Butyrophilins: γδ T cell receptor ligands, immunomodulators and more. Front Immunol. 2022;13:876493. doi:10.3389/fimmu.2022.876493. [Google Scholar] [PubMed] [CrossRef]
4. Mehdikhani F, Bahar A, Bashi M, Mohammadlou M, Yousefi B. From immunomodulation to therapeutic prospects: unveiling the biology of butyrophilins in cancer. Cell Biochem Funct. 2024;42(5):e4081. doi:10.1002/cbf.4081. [Google Scholar] [PubMed] [CrossRef]
5. Cheng X, Ma T, Yi L, Su C, Wang X, Wen T et al. Low expression of BTN3A3 indicates poor prognosis and promotes cell proliferation, migration and invasion in non-small cell lung cancer. Ann Transl Med. 2021;9(6):478. doi:10.21037/atm-21-163. [Google Scholar] [PubMed] [CrossRef]
6. Dobosz P, Stempor PA, Roszik J, Herman A, Layani A, Berger R, et al. Checkpoint genes at the cancer side of the immunological synapse in bladder cancer. Transl Oncol. 2020;13(2):193–200. doi:10.1016/j.tranon.2019.10.018. [Google Scholar] [PubMed] [CrossRef]
7. Payne KK, Mine JA, Biswas S, Chaurio RA, Perales-Puchalt A, Anadon CM et al. BTN3A1 governs antitumor responses by coordinating αβ and γδ T cells. Science. 2020;369:942–9. doi:10.1126/science.aay2767. [Google Scholar] [PubMed] [CrossRef]
8. Rigau M, Ostrouska S, Fulford TS, Johnson DN, Woods K, Ruan Z, et al. Butyrophilin 2A1 is essential for phosphoantigen reactivity by γδ T cells. Science. 2020;367(6478):eaay5516. doi:10.1126/science.aay5516. [Google Scholar] [PubMed] [CrossRef]
9. Uldrich AP, Rigau M, Godfrey DI. Immune recognition of phosphoantigen-butyrophilin molecular complexes by γδ T cells. Immunol Rev. 2020;298(1):74–83. doi:10.1111/imr.12923. [Google Scholar] [PubMed] [CrossRef]
10. Herrmann T, Fichtner AS, Karunakaran MM. An update on the molecular basis of phosphoantigen recognition by Vγ9Vδ2 T cells. Cells. 2020;9(6):1433. doi:10.3390/cells9061433. [Google Scholar] [PubMed] [CrossRef]
11. Herrmann T, Karunakaran MM. Phosphoantigen recognition by Vγ9Vδ2 T cells. Eur J Immunol. 2024;54(11):2451068. doi:10.1002/eji.202451068. [Google Scholar] [PubMed] [CrossRef]
12. Zarobkiewicz MK, Wawryk-Gawda E, Kowalska W, Janiszewska M, Bojarska-Junak A. γδ T lymphocytes in asthma: a complicated picture. Arch Immunol Ther Exp. 2021;69(1):4. doi:10.1007/s00005-021-00608-7. [Google Scholar] [PubMed] [CrossRef]
13. Zarobkiewicz MK, Kowalska W, Roliński J, Bojarska-Junak AA. γδ T lymphocytes in the pathogenesis of multiple sclerosis and experimental autoimmune encephalomyelitis. J Neuroimmunol. 2019;330(199):67–73. doi:10.1016/j.jneuroim.2019.02.009. [Google Scholar] [PubMed] [CrossRef]
14. Bank I. The role of gamma delta T cells in autoimmune rheumatic diseases. Cells. 2020;9(2):462. doi:10.3390/cells9020462. [Google Scholar] [PubMed] [CrossRef]
15. Park JH, Lee HK. Function of γδ T cells in tumor immunology and their application to cancer therapy. Exp Mol Med. 2021;53(3):318–27. doi:10.1038/s12276-021-00576-0. [Google Scholar] [PubMed] [CrossRef]
16. Wu J, Groh V, Spies T. T cell antigen receptor engagement and specificity in the recognition of stress-inducible MHC class I-related chains by human epithelial γδ T cells. J Immunol. 2002;169(3):1236–40. doi:10.4049/jimmunol.169.3.1236. [Google Scholar] [PubMed] [CrossRef]
17. Tanaka Y, Tanaka Y, Bloom BR, Morita CT, Brenner MB, Nieves E. Natural and synthetic non-peptide antigens recognized by human γδ T cells. Nature. 1995;375(6527):155–8. doi:10.1038/375155a0. [Google Scholar] [PubMed] [CrossRef]
18. Eberl M, Hintz M, Reichenberg A, Kollas A-K, Wiesner J, Jomaa H. Microbial isoprenoid biosynthesis and human gammadelta T cell activation. FEBS Lett. 2003;544(1–3):4–10. doi:10.1016/S0014-5793(03)00483-6. [Google Scholar] [PubMed] [CrossRef]
19. Wistuba-Hamprecht K, Oberg H-H, Wesch D. Function and spatial organization of tumor-invasive human γδ T cells—what do we know? Eur J Immunol. 2025;55(1):e202451075. doi:10.1002/eji.202451075. [Google Scholar] [PubMed] [CrossRef]
20. Zarobkiewicz MK, Bojarska-Junak AA. The mysterious actor—γδ T lymphocytes in chronic lymphocytic leukaemia (CLL). Cells. 2022;11(4):661. doi:10.3390/cells11040661. [Google Scholar] [PubMed] [CrossRef]
21. Siegers GM, Dhamko H, Wang X-H, Mathieson AM, Kosaka Y, Felizardo TC, et al. Human Vδ1 γδ T cells expanded from peripheral blood exhibit specific cytotoxicity against B-cell chronic lymphocytic leukemia-derived cells. Cytotherapy. 2011;13(6):753–64. doi:10.3109/14653249.2011.553595. [Google Scholar] [PubMed] [CrossRef]
22. De Weerdt I, Hofland T, Lameris R, Endstra S, Jongejan A, Moerland PD, et al. Improving CLL Vγ9Vδ2-T-cell fitness for cellular therapy by ex vivo activation and ibrutinib. Blood. 2018;132(21):2260–72. doi:10.1182/blood-2017-12-822569. [Google Scholar] [PubMed] [CrossRef]
23. Kaufman M, Yan X-J, Li W, Ghia EM, Langerak AW, Rassenti LZ, et al. Impact of the types and relative quantities of IGHV gene mutations in predicting prognosis of patients with chronic lymphocytic leukemia. Front Oncol. 2022;12:897280. doi:10.3389/fonc.2022.897280. [Google Scholar] [PubMed] [CrossRef]
24. Oscier DG, Gardiner AC, Mould SJ, Glide S, Davis ZA, Ibbotson RE, et al. Multivariate analysis of prognostic factors in CLL: clinical stage, IGVH gene mutational status, and loss or mutation of the p53 gene are independent prognostic factors. Blood. 2002;100(4):1177–84. doi:10.1182/blood.V100.4.1177.h81602001177_1177_1184. [Google Scholar] [CrossRef]
25. Coscia M, Vitale C, Peola S, Foglietta M, Rigoni M, Griggio V, et al. Dysfunctional Vγ9Vδ2 T cells are negative prognosticators and markers of dysregulated mevalonate pathway activity in chronic lymphocytic leukemia cells. Blood. 2012;120(16):3271–9. doi:10.1182/blood-2012-03-417519. [Google Scholar] [PubMed] [CrossRef]
26. Coombs CC. Frontline therapy of CLL—changing treatment paradigms. Curr Hematol Malig Rep. 2024;19(2):65–74. doi:10.1007/s11899-024-00726-x. [Google Scholar] [PubMed] [CrossRef]
27. Edgar R, Domrachev M, Lash AE. Gene Expression Omnibus: NCBI gene expression and hybridization array data repository. Nucleic Acids Res. 2002;30(1):207–10. doi:10.1093/nar/30.1.207. [Google Scholar] [PubMed] [CrossRef]
28. Mowery YM, Weinberg JB, Kennedy MN, Bond KM, Moore JO, Lanasa MC, et al. LMP-420: a novel purine nucleoside analog with potent cytotoxic effects for CLL cells and minimal toxicity for normal hematopoietic cells. Leukemia. 2010;24(9):1580–7. doi:10.1038/leu.2010.150. [Google Scholar] [PubMed] [CrossRef]
29. Herishanu Y, Pérez-Galán P, Liu D, Biancotto A, Pittaluga S, Vire B, et al. The lymph node microenvironment promotes B-cell receptor signaling, NF-κB activation, and tumor proliferation in chronic lymphocytic leukemia. Blood. 2011;117(2):563–74. doi:10.1182/blood-2010-05-284984. [Google Scholar] [PubMed] [CrossRef]
30. Kemppinen AK, Kaprio J, Palotie A, Saarela J. Systematic review of genome-wide expression studies in multiple sclerosis. BMJ Open. 2011;1(1):e000053. doi:10.1136/bmjopen-2011-000053. [Google Scholar] [PubMed] [CrossRef]
31. Stirewalt DL, Meshinchi S, Kopecky KJ, Fan W, Pogosova-Agadjanyan EL, Engel JH, et al. Identification of genes with abnormal expression changes in acute myeloid leukemia. Genes Chromos Canc. 2008;47(1):8–20. doi:10.1002/gcc.20500. [Google Scholar] [PubMed] [CrossRef]
32. Krug T, Gabriel JP, Taipa R, Fonseca BV, Domingues-Montanari S, Fernandez-Cadenas I, et al. TTC7B emerges as a novel risk factor for ischemic stroke through the convergence of several genome-wide approaches. J Cereb Blood Flow Metab. 2012;32(6):1061–72. doi:10.1038/jcbfm.2012.24. [Google Scholar] [PubMed] [CrossRef]
33. Risbano MG, Meadows CA, Coldren CD, Jenkins TJ, Edwards MG, Collier D, et al. Altered immune phenotype in peripheral blood cells of patients with scleroderma-associated pulmonary hypertension. Clin Transl Sci. 2010;3(5):210–8. doi:10.1111/j.1752-8062.2010.00218.x. [Google Scholar] [PubMed] [CrossRef]
34. LaBreche HG, Nevins JR, Huang E. Integrating factor analysis and a transgenic mouse model to reveal a peripheral blood predictor of breast tumors. BMC Med Genom. 2011;4(1):61. doi:10.1186/1755-8794-4-61. [Google Scholar] [PubMed] [CrossRef]
35. Gutiérrez NC, Ocio EM, de las Rivas J, Maiso P, Delgado M, Fermiñán E et al. Gene expression profiling of B lymphocytes and plasma cells from Waldenström’s macroglobulinemia: comparison with expression patterns of the same cell counterparts from chronic lymphocytic leukemia, multiple myeloma and normal individuals. Leukemia. 2007;21(3):541–9. doi:10.1038/sj.leu.2404520. [Google Scholar] [PubMed] [CrossRef]
36. Lopez-Corral L, Corchete LA, Sarasquete ME, Mateos MV, Garcia-Sanz R, Ferminan E et al. Transcriptome analysis reveals molecular profiles associated with evolving steps of monoclonal gammopathies. Haematologica. 2014;99(8):1365–72. doi:10.3324/haematol.2013.087809. [Google Scholar] [PubMed] [CrossRef]
37. Gutierrez A, Tschumper RC, Wu X, Shanafelt TD, Eckel-Passow J, Huddleston PM, et al. LEF-1 is a prosurvival factor in chronic lymphocytic leukemia and is expressed in the preleukemic state of monoclonal B-cell lymphocytosis. Blood. 2010;116(16):2975–83. doi:10.1182/blood-2010-02-269878. [Google Scholar] [PubMed] [CrossRef]
38. Shimabukuro-Vornhagen A, Zoghi S, Liebig TM, Wennhold K, Chemitz J, Draube A, et al. Inhibition of protein geranylgeranylation specifically interferes with CD40-dependent B cell activation, resulting in a reduced capacity to induce T cell immunity. J Immunol. 2014;193(10):5294–305. doi:10.4049/jimmunol.1203436. [Google Scholar] [PubMed] [CrossRef]
39. Gao J, Aksoy BA, Dogrusoz U, Dresdner G, Gross B, Sumer SO, et al. Integrative analysis of complex cancer genomics and clinical profiles using the cBioPortal. Sci Signal. 2013;6(269):pl1. doi:10.1126/scisignal.2004088. [Google Scholar] [PubMed] [CrossRef]
40. Knisbacher BA, Lin Z, Hahn CK, Nadeu F, Duran-Ferrer M, Stevenson KE, et al. Molecular map of chronic lymphocytic leukemia and its impact on outcome. Nat Genet. 2022;54(11):1664–74. doi:10.1038/s41588-022-01140-w. [Google Scholar] [PubMed] [CrossRef]
41. Cano CE, Pasero C, De Gassart A, Kerneur C, Gabriac M, Fullana M et al. BTN2A1, an immune checkpoint targeting Vγ9Vδ2 T cell cytotoxicity against malignant cells. Cell Rep. 2021;36(2):109359. doi:10.1016/j.celrep.2021.109359. [Google Scholar] [PubMed] [CrossRef]
42. Benyamine A, Loncle C, Foucher E, Blazquez JL, Castanier C, Chrétien AS, et al. BTN3A is a prognosis marker and a promising target for Vγ9Vδ2 T cells based-immunotherapy in pancreatic ductal adenocarcinoma (PDAC). OncoImmunology. 2018;7(1):e1372080. doi:10.1080/2162402X.2017.1372080. [Google Scholar] [PubMed] [CrossRef]
43. Kone A-S, Ghouzlani A, Qandouci A, Issam Salah NEI, Bakoukou Y, Lakhdar A, et al. High expression of BTN3A1 is associated with clinical and immunological characteristics and predicts a poor prognosis in advanced human gliomas. Front Immunol. 2024;15:1397486. doi:10.3389/fimmu.2024.1397486. [Google Scholar] [PubMed] [CrossRef]
44. Yang W, Cheng B, Chen P, Sun X, Wen Z, Cheng Y. BTN3A1 promotes tumor progression and radiation resistance in esophageal squamous cell carcinoma by regulating ULK1-mediated autophagy. Cell Death Dis. 2022;13(11):984. doi:10.1038/s41419-022-05429-w. [Google Scholar] [PubMed] [CrossRef]
45. Liang F, Zhang C, Guo H, Gao S-H, Yang F-Y, Zhou G-B, et al. Comprehensive analysis of BTN3A1 in cancers: mining of omics data and validation in patient samples and cellular models. FEBS Open Bio. 2021;11(9):2586–99. doi:10.1002/2211-5463.13256. [Google Scholar] [PubMed] [CrossRef]
46. Malinowska I, Sikorska-Fic B, Romiszewska M, Stefaniak A, Pastwińska A, Górska E, et al. A case of acute myeloid leukemia with novel translocation t (6;11)(p22.2;q23) and concurrent insertion ins (11;9)(q23;p21.3p21.3). Adv Exp Med Biol. 2017;1021:93–8. doi:10.1007/5584_2017_86. [Google Scholar] [PubMed] [CrossRef]
47. Ren H, Li S, Liu X, Li W, Hao J, Zhao N. Multi-omics analysis of the expression and prognostic value of the butyrophilins in breast cancer. J Leukoc Biol. 2021;110(6):1181–95. doi:10.1002/JLB.5MA0321-158RR. [Google Scholar] [PubMed] [CrossRef]
48. Wu Z, Lamao Q, Gu M, Jin X, Liu Y, Tian F, et al. Unsynchronized butyrophilin molecules dictate cancer cell evasion of Vγ9Vδ2 T-cell killing. Cell Mol Immunol. 2024;21(4):362–73. doi:10.1038/s41423-024-01135-z. [Google Scholar] [PubMed] [CrossRef]
49. Liu Y, Lui KS, Ye Z, Chen L, Cheung AKL. Epstein-barr virus BRRF1 induces butyrophilin 2A1 in nasopharyngeal carcinoma NPC43 cells via the IL-22/JAK3-STAT3 pathway. Int J Mol Sci. 2024;25(24):13452. doi:10.3390/ijms252413452. [Google Scholar] [PubMed] [CrossRef]
50. Liang J-H, Gao R, Xia Y, Gale RP, Chen R-Z, Yang Y-Q, et al. Prognostic impact of Epstein-Barr virus (EBV)-DNA copy number at diagnosis in chronic lymphocytic leukemia. Oncotarget. 2015;7(2):2135–42. doi:10.18632/oncotarget.6281. [Google Scholar] [PubMed] [CrossRef]
51. Azhdari F, Faghih Z, Haghighat S, Jamalidoust M, Hosseini SY, Hashemi SMA, et al. Comparison of Epstein-Barr virus copy number in white blood cells of chronic lymphocytic leukemia patients with laboratory prognostic biomarker. BMC Res Notes. 2024;17(1):281. doi:10.1186/s13104-024-06942-1. [Google Scholar] [PubMed] [CrossRef]
52. Smith IA, Knezevic BR, Ammann JU, Rhodes DA, Aw D, Palmer DB, et al. BTN1A1, the mammary gland butyrophilin, and BTN2A2 are both inhibitors of T cell activation. J Immunol. 2010;184(7):3514–25. doi:10.4049/jimmunol.0900416. [Google Scholar] [PubMed] [CrossRef]
53. Wang H, Pu S, Xu H, Yang L, Shao L, Chen X, et al. BTN2A2, a new biomarker and therapeutic target for glioma. Aging. 2023;15:10996–1011. doi:10.18632/aging.205039. [Google Scholar] [PubMed] [CrossRef]
54. Kerneur C, Foucher E, Guillén Casas J, Colazet M, Le K-S, Fullana M, et al. BTN2A1 targeting reprograms M2-like macrophages and TAMs via SYK and MAPK signaling. Cell Rep. 2024;43(10):114773. doi:10.1016/j.celrep.2024.114773. [Google Scholar] [PubMed] [CrossRef]
55. He D, Qin Z, Liu Z, Ji X, Gao J, Guo H, et al. Comprehensive analysis of the prognostic value and immune infiltration of butyrophilin subfamily 2/3 (BTN2/3) members in pan-glioma. Front Oncol. 2022;12:816760. doi:10.3389/fonc.2022.816760. [Google Scholar] [PubMed] [CrossRef]
56. Lu H, Dai W, Guo J, Wang D, Wen S, Yang L, et al. High abundance of intratumoral γδ T cells favors a better prognosis in head and neck squamous cell carcinoma: a bioinformatic analysis. Front Immunol. 2020;11:573920. doi:10.3389/fimmu.2020.573920. [Google Scholar] [PubMed] [CrossRef]
Cite This Article
 Copyright © 2025 The Author(s). Published by Tech Science Press.
This work is licensed under a Creative Commons Attribution 4.0 International License , which permits unrestricted use, distribution, and reproduction in any medium, provided the original work is properly cited.
 Downloads
 Citation Tools