
 Submit a Paper
 Propose a Special lssue
 Open Access
ARTICLE

Targeting EphA2 with CRISPR/Cas9 Identifies a Novel EphA2-CDH1 Regulatory Axis in Migration of Castration-Resistant Prostate Cancer
1 Department of Radiology, Jieshou City People’s Hospital, Fuyang, 236500, China
2 Department of Radiology, The Second Affiliated Hospital of Soochow University, Suzhou, 215004, China
3 Department of Radiology, Jieshou Hospital Affiliated to Anhui Medical College, Fuyang, 236500, China
4 Suzhou Medical College, Soochow University, Suzhou, 215123, China
* Corresponding Authors: Yue Xiao. Email: ; Chaogang Wei. Email:
# These authors contributed equally to this work
(This article belongs to the Special Issue: Genetic Biomarkers of Cancer: Insights into Molecular and Cellular Mechanisms)
BIOCELL 2025, 49(7), 1207-1223. https://doi.org/10.32604/biocell.2025.065658
Received 19 March 2025; Accepted 03 June 2025; Issue published 25 July 2025
 View Full Text
 Download PDF
Abstract
Objectives: Progression to castration-resistant prostate cancer (CRPC) and metastasis are the greatest challenges to effective treatment. Anticancer strategies targeting the key kinases associated with the development of CRPC may represent a breakthrough. The tyrosine kinase receptor Erythropoietin-producing hepatocellular (Eph) A2 receptor is highly expressed in CRPC cell lines and may be associated with tumor invasion and metastasis. However, the effects and exact mechanisms of EphA2 in CRPC are only partially understood. This study aimed to investigate the impact of EphA2 on CRPC cell behaviors and underlying molecular pathways Methods: CRISPR/Cas9-mediated gene editing induced EphA2-disrupted in human-derived PC3 and DU145 cells. Single-guide RNAs (sgRNAs) targeting EphA2 were designed, and editing efficiency was validated. Optimal sgRNA sequences were selected to generate EphA2-knockdown (KD) and -overexpressing (OE) cell lines. Cell migration, proliferation, and apoptosis were assessed via functional assays. Transcriptomic analysis, quantitative PCR, and Western blotting were performed to identify downstream effectors. Bioinformatics analyses were used to correlate EphA2 and CDH1 expression with clinical parameters in prostate cancer patients. Results: Editing efficiency was found to vary among different sgRNAs targeting the EphA2 gene. EphA2-KD significantly inhibited CRPC cell migration but did not affect cell proliferation or apoptosis. Conversely, EphA2-OE significantly enhanced the migration of DU145 cells. Molecular analyses revealed that the expression of CDH1 (an important marker of the epithelial-mesenchymal transition (EMT) in tumors) was significantly upregulated in PC3-EphA2-KD cells and downregulated in DU145-EphA2-OE cells, indicating that CDH1 is a downstream regulator of EphA2. Bioinformatic analysis revealed that higher EphA2 levels and lower CDH1 expression were both associated with an advanced tumor T stage, higher Gleason scores, and lymph node metastases in prostate cancer patients. More importantly, EphA2 was found to be an important predictor of lymph node metastasis, in addition to the Gleason score. Adding EphA2 to the Gleason score could significantly improve the detection of lymph node metastasis. Conclusion: CRISPR/Cas9-mediated EphA2-KD significantly suppressed the migration of CRPC cells through the inhibition of the EphA2-CDH1 axis. Strategies targeting the EphA2 gene may be promising for the treatment of CRPC.Keywords
Prostate cancer represents the most prevalent malignancy among elderly males and ranks as the second leading cause of cancer-related mortality in Western countries [1]. Androgen deprivation therapy (ADT), the standard treatment for advanced androgen-sensitive prostate cancer, often fails due to the inevitable progression to castration-resistant prostate cancer (CRPC) [2]. This lethal transition currently lacks effective clinical interventions, driving urgent needs for novel therapeutic targets. Recent research has prioritized kinase-focused approaches, with particular emphasis on developing small-molecule inhibitors against CRPC-critical signaling nodes [3–5]. Identifying key regulatory kinases in CRPC pathogenesis represents a crucial step toward overcoming treatment resistance.
The Eph receptor family represents the most abundant group of receptor tyrosine kinases (RTKs), with demonstrated roles in cellular processes ranging from morphogenesis to oncogenesis [6]. Among these, EphA2 exhibits unique pathophysiological characteristics—while maintaining minimal expression in normal tissues, it becomes markedly overexpressed across multiple malignancies, particularly in aggressive breast, ovarian, and prostate carcinomas [7–10]. Clinical correlative studies consistently associate elevated EphA2 levels with advanced tumor grade and stage [11], though its functional significance in CRPC remains insufficiently explored [12,13]. Current investigations face challenges due to inconsistent findings across tumor models, necessitating more precise molecular tools. CRISPR/Cas9 genome editing has emerged as the gold standard for functional gene studies, offering unparalleled specificity in generating knockout models [14]. The CRISPR/Cas9 system employs target-specific sgRNA (20-nt), Cas9 endonuclease, and NHEJ-mediated repair to generate frameshift mutations. To date, no studies have leveraged this approach to investigate EphA2 in CRPC, representing a significant knowledge gap [15].
Given the significant variability in the gene-editing efficiency of the CRISPR/Cas9 system, in a prior study, we employed a novel E.coli-based white-to-blue screening assay to choose optimized single-guide RNAs (sgRNAs) for the EphA2 gene [16]. Drawing on the results of previous research, our objective was to use lentiviral CRISPR/Cas9-mediated genome editing to create EphA2 gene knockdown (KD) in CRPC cell lines. Specifically, we targeted PC3 cells with high-level EphA2 expression and DU145 cells with medium-level EphA2 expression [7]. Furthermore, we delved into the fundamental mechanisms of EphA2’s role in CRPC and its clinical implications. Our findings offer additional proof that EphA2 could serve as a promising therapeutic target for CRPC.
In this study, CRPC cell lines PC3 and DU145 were purchased from the Cell Bank of the Chinese Academy of Sciences (Shanghai, China). The cell lines were examined to exclude mycoplasma contamination. PC3 and DU145 cells were routinely maintained using Ham’s F-12K medium (Procell LifeSciTech Co., catalog number CM-0505, Wuhan, Hubei, China) and DMEM (Gibco, Thermo Fisher, catalog number 11965092, Waltham, MA, USA). Both media were supplemented with 10% fetal bovine serum (FBS) (Gibco, Thermo Fisher, catalog number 10099141), 100 U/mL penicillin, and 100 μg/mL streptomycin (Beyotime Biotech, catalog number C0222, Shanghai, China), and cultures were incubated at 37°C in a 5% CO2 humidified atmosphere.
The EphA2 expression plasmid (Sino Biological, catalog number: HG13926-CY, Beijing, China), control plasmid (Sino Biological, catalog number: CV011, Beijing, China) and recombinant human epidermal growth factor (EGF) (Sino Biological, catalog number: 10605-HNAE, Beijing, China) were procured from Sino Biological Inc. (Beijing, China). The study utilized the following antibodies: rabbit monoclonal antibody against EphA2 (CST, catalog number: 6997, Danvers, MA, USA), rabbit monoclonal antibody against CDH1 (Cell Signaling Technology, catalog number: 3195, Danvers, MA, USA), goat anti-mouse IgG-HRP secondary antibody (CST, catalog number: 7076, Danvers, MA, USA), and goat anti-rabbit IgG-HRP secondary antibody (CST, catalog number: 7074, Danvers, MA, USA). A mouse polyclonal antibody against β-actin (Beyotime Biotech, catalog number: AF0003, Shanghai, China) was used as loading control.
2.3 Selection of EphA2-Targeting sgRNA Sequences
One of the sgRNA sequences targeting the DNA sequence of the EphA2 gene (GenBank accession number: NC_000001.11) was optimally selected in our previous studies using the white-to-blue colony formation assay. Two other sgRNA sequences were intelligently selected using the online sgRNA design tool (https://design.synthego.com) according to the scores. The three sgRNA sequences are shown in Fig. 1A. The three sgRNA sequences were then packaged into three lentiviral vectors. The lentiviral packaging system primarily consisted of an enhanced green fluorescent protein (EGFP)-tagged recombinant lentiviral vector (GeneChem Technology, catalog number: GV393, Shanghai, China) encoding both Cas9 nuclease and EphA2-specific sgRNA (sequence verified). The CRISPR/Cas9 lentiviral vector targeting the EphA2 gene (GeneChem Technology, catalog number: LVPCA07767, Shanghai, China) was constructed and Sanger-sequenced by GeneChem Technology (Shanghai, China).
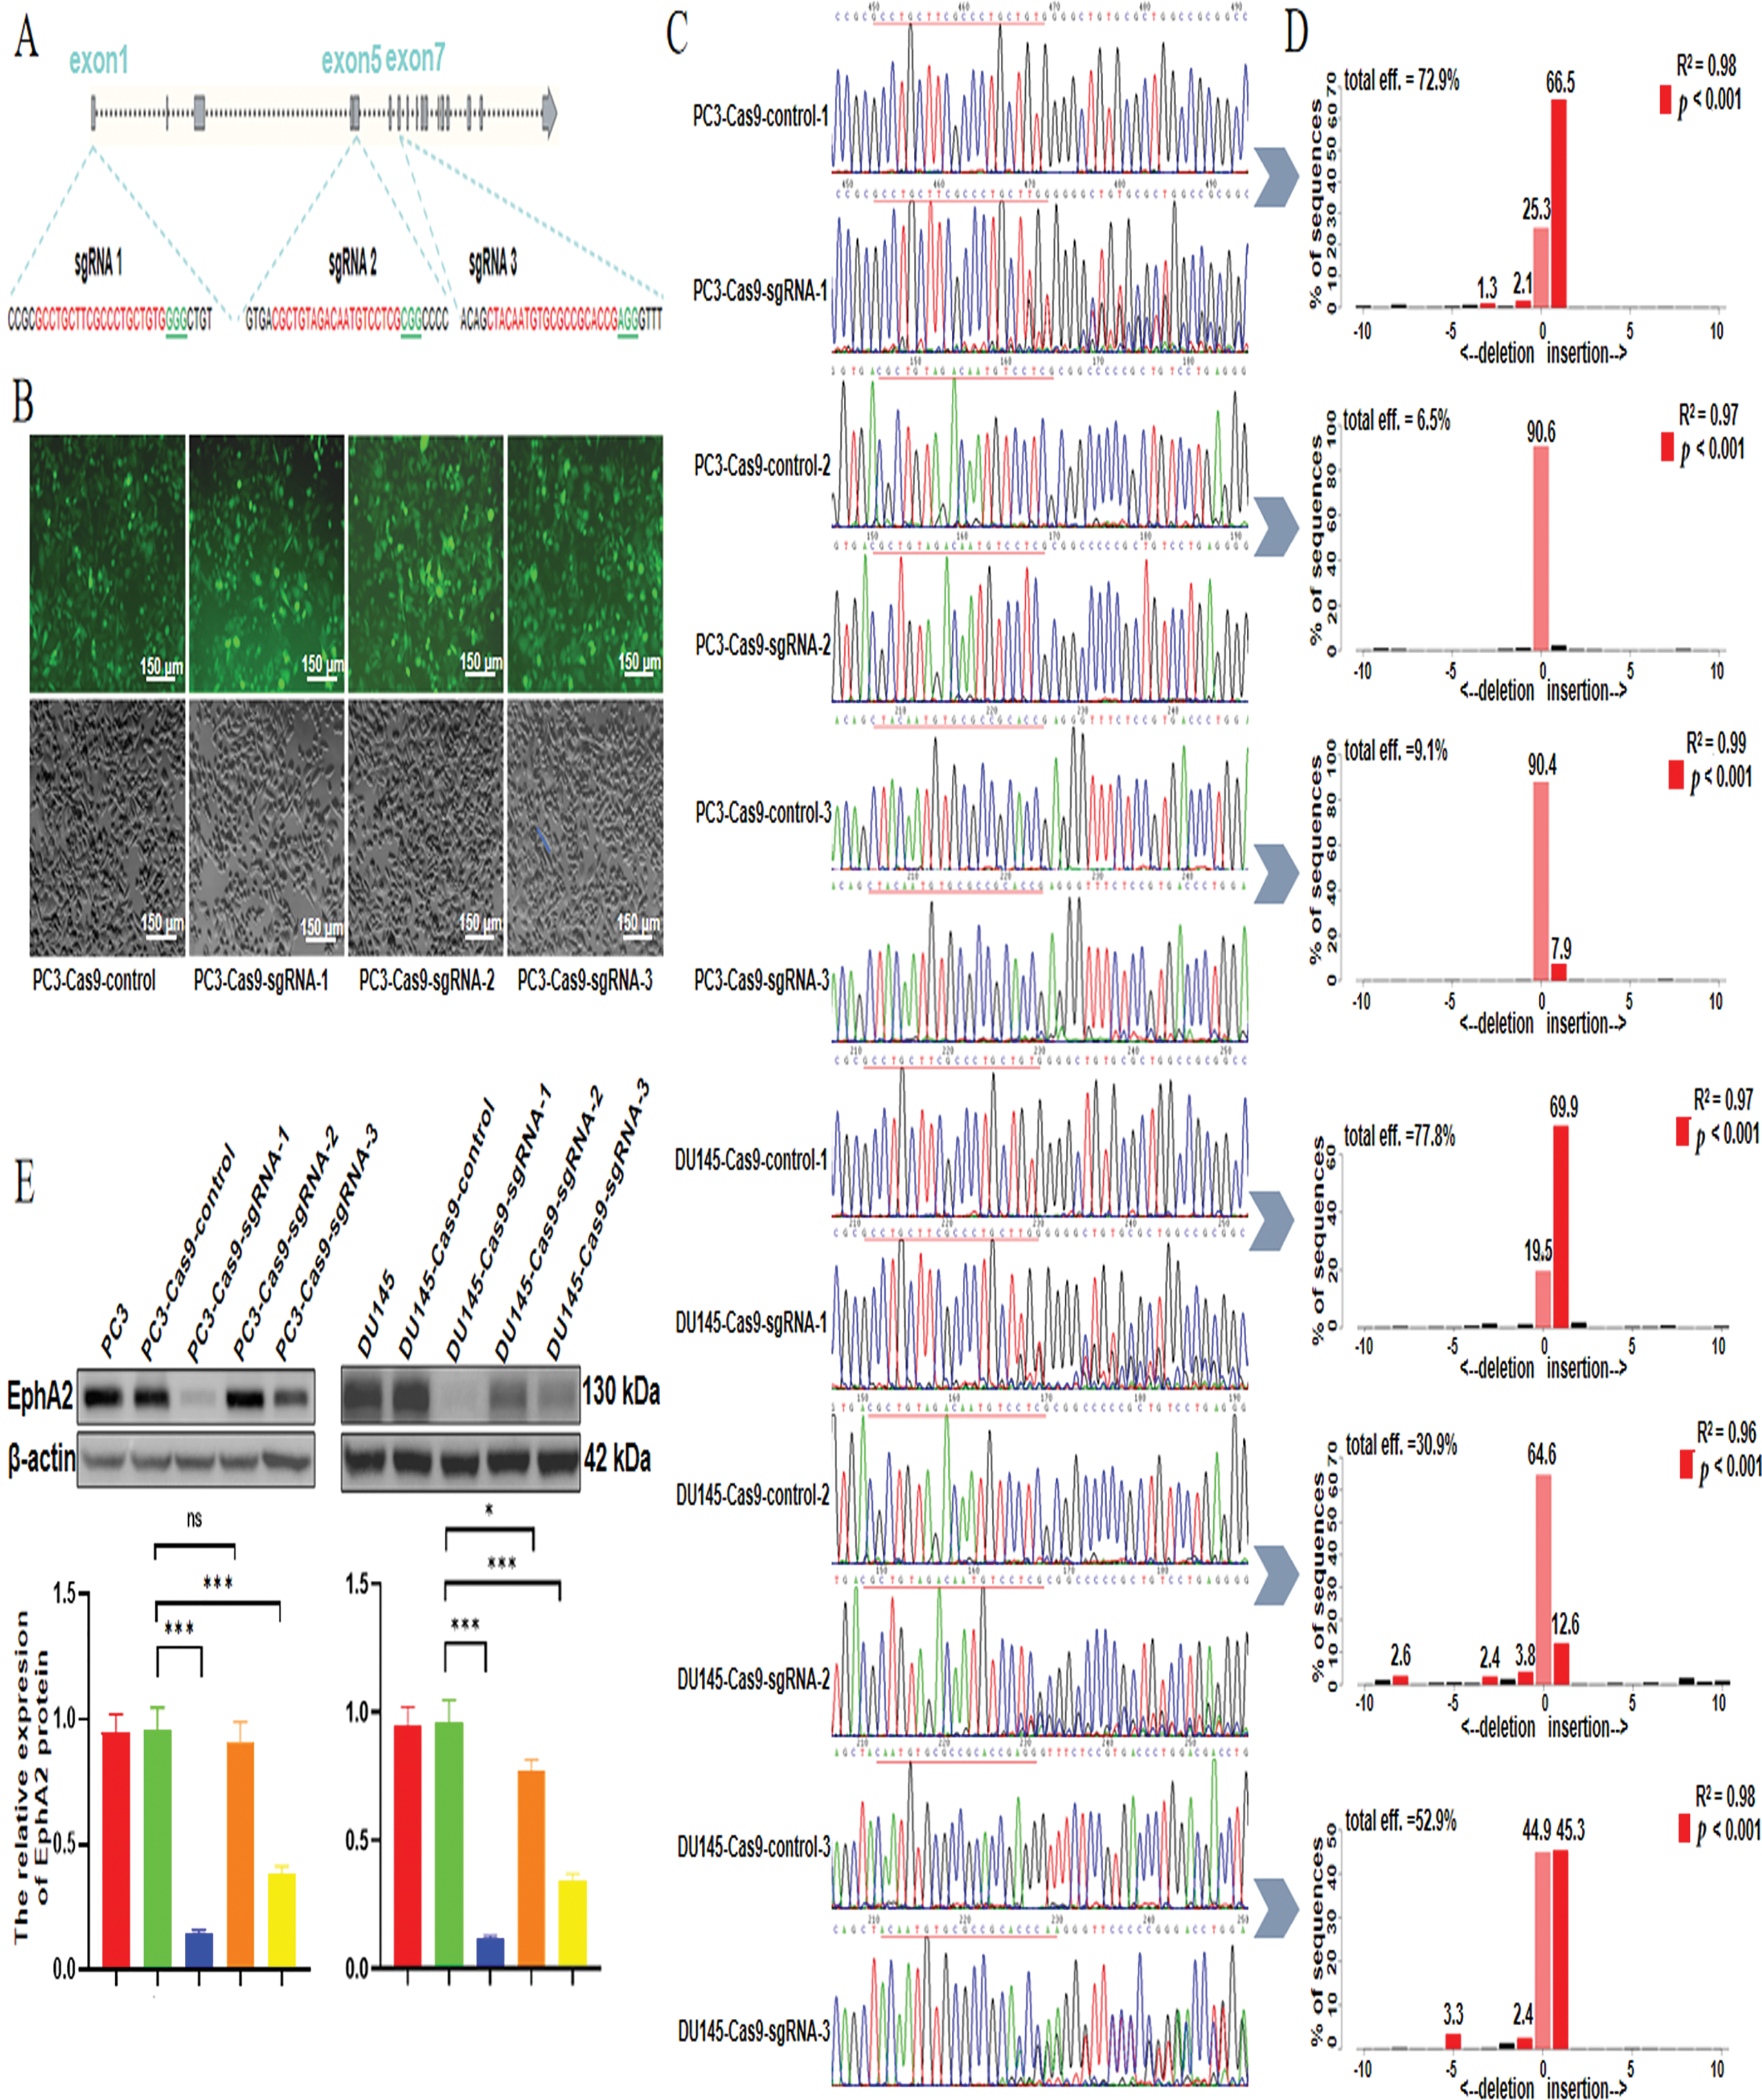
Figure 1: Selection of the optimal sgRNA for the CRISPR/Cas9 system. (A) Loci of three selected sgRNA sequences in the EphA2 gene. (B) The lentiviral transfection efficiency was confirmed via fluorescence microscopy, and more than 90% of the EGFP-positive cells were detected. (C) DNA Sanger sequencing results. The sequences after the target sites (underlined) displayed miscellaneous and irregular peaks rather than a single peak, indicating the target sites were disrupted by the CRISPR system. Compared with the control, sgRNA-1 resulted in obvious irregular miscellaneous peaks in both cell lines. (D) According to the quantitative TIDE analysis, the total indel frequency of EphA2-sgRNA-1 was 72.9% in PC3-EphA2-KD cells and 77.8% in DU145-EphA2-KD cells. (E) Western blot analysis revealed significantly lower EphA2 expression levels induced by EphA2-sgRNA-1 in both PC3-EphA2-KD and DU145-EphA2-KD cells than those induced by EphA2-sgRNA-2 and EphA2-sgRNA-3. All experiments were performed in triplicate. Significance was defined as p < 0.05 (*p < 0.05, ***p < 0.001, ns p ≥ 0.05)
2.4 Generation of CRISPR-Mediated Stable EphA2 Knockdown Cell Lines
PC3 and DU145 cells (3 × 10⁵) seeded in 6-well plates were respectively infected with the three CRISPR/Cas9 lentiviral vectors (EphA2-Cas9-sgRNA-1, EphA2-Cas9-sgRNA-2 and EphA2-Cas9-sgRNA-3) and the control lentivirus carrying a nontargeting sgRNA sequence. These cells were then maintained at 37°C for 72 h in a CO2 incubator. The lentiviral transfection efficiency was confirmed by determining the percentage of EGFP-positive cells using a Zeiss Axio Observer 7 fluorescence microscopy(Carl Zeiss AG, model: Axio Observer 7, Jena, Germany). CRISPR-stable EphA2-knockdown PC3 and DU145 cell lines (PC3-EphA2-KD and DU145-EphA2-KD) and control cell lines (PC3-Cas9-control and DU145-Cas9-control) were generated from more than 90% EGFP-positive cells.
2.5 Detection of EphA2 Gene Knockdown Efficiency
To assess the knockdown efficiency of the EphA2 gene, we collected PC3-EphA2-KD, DU145-EphA2-KD, PC3-Cas9-control, and DU145-Cas9-control cell lines. We used the TIANamp Genomic DNA Kit (Tiangen Biological Technology, catalog number: DP304, Beijing, China) to extract genomic DNA from all samples. Table 1 shows the sequences of primers for PCR amplification. PCR amplification was performed under the following cycling conditions: 34 cycles comprising 30 s at 95°C, 30 s at 60°C, and 30 s at 72°C, following the manufacturer’s recommendations. After PCR, the products were subjected to Sanger sequencing analysis by Sangon Biotech (Shanghai, China). To quantify the knockdown efficiency of the EphA2 gene, we utilized the Tracking of Indels by Decomposition (TIDE) online software (http://shinyapps.datacurators.nl/tide/). This software streamlines the rapid and reliable evaluation of genome-editing efficiency mediated by the CRISPR/Cas9 system at specific genomic loci [17]. Its operation relies solely on sequence trace data from two standard capillary (Sanger) sequencing runs: one from a control sample and the other from an edited sample. For our analysis, we set the p-value threshold at ≤0.001.
2.6 EphA2 Overexpression Experiment
For EphA2 overexpression, 3 × 10⁵ DU145 cells per well were seeded in 6-well plates. At 80%–90% confluency, cells were transfected with LipofectamineTM 3000 transfection reagent (Invitrogen, Thermo Fisher Scientific, catalog number: L3000015, MA, USA) with either EphA2 expression plasmid or empty vector control. After 48 h of incubation under standard conditions (37°C, 5% CO2), transfection efficiency was systematically validated through quantitative real-time PCR (relative fold-change expression) and Western blot analysis (band intensity quantification normalized to β-actin).
2.7 Total RNA Isolation and qPCR Analysis
Total RNA was obtained from target cells via TRIzol Reagent (Thermo Fisher, catalog number: 15596026, Waltham, MA, USA). cDNA synthesis was carried out using the NovoScript® Plus One-Step cDNA Synthesis System (Novoprotein, catalog number: E047-01A, Shanghai, China). qPCR reactions (20 μL volume) contained: NovoScript® SYBR qPCR SuperMix Plus (Novoprotein, catalog number: E096-01A), Gene-specific primers (200 nM each, Table 2), Diluted cDNA template (1:5, 3 μL). Amplification was monitored using a QuantStudio 3 qPCR System (Thermo Fisher Scientific, catalog number: A28137). Data were normalized using GAPDH as the endogenous control.
Target cell lysis was performed using Beyotime’s RIPA buffer (Beyotime Biotechnology, catalog number: P0013B, Shanghai, China) for 20 min on ice. Lysates were cleared by centrifugation at 12,000× g for 25 min at 4°C. A refrigerated centrifuge (Eppendorf, model: 5425 R, Hamburg, Germany) was used for this step. Protein samples (35 μg) were resolved on 10% SDS-PAGE gels (Epizyme Biotech, catalog number: PG112, Shanghai, China) and electrotransferred to PVDF membranes (Merck Millipore, catalog number: IPVH00010, Burlington, MA, USA) at 300 mA (90 min). The membranes were first blocked with 5% non-fat milk in TBST buffer for 1 h at room temperature with gentle shaking, then incubated with primary antibodies (1:1500 dilution in 5% milk-TBST) overnight at 4°C, and finally probed with HRP-conjugated secondary antibodies (1:5000 dilution in 5% milk-TBST) for 1 h at RT with agitation. Protein signals were developed using ECL substrate (Epizyme Biotech, catalog number: SQ201, Shanghai, China) and quantified with ImageJ (v1.53, NIH, USA). β-Actin (Beyotime Biotechnology, catalog number: AF0003) served as loading control.
PC3 and DU145 cells (3 × 10³ cells per well) were seeded in 96-well plates with 100 μL complete medium (RPMI-1640 + 10% FBS) and cultured for 6–120 h. Viability was assessed by adding 10 μL Cell Counting Kit-8 (CCK-8) assay (Dojindo, catalog number: CK04-20, Kumamoto, Japan) per well, incubating for 2 h (37°C, 5% CO2), and measuring OD450 using a Spark® microplate reader (TECAN, M1000, Männedorf, Switzerland). Experiments included three biological replicates with technical triplicates.
Apoptosis was quantified using Annexin V-allophycocyanin (APC)/7-aminoactinomycin D (7-AAD) kit (Keygene Biotech, catalog number: KGA1031, Nanjing, China), while cell cycle distribution was assessed with Propidium Iodide (PI) Kit (Beyotime, catalog number: C1052, Shanghai, China). Treated cells were resuspended in PBS and analyzed using a CytoFLEX LX flow cytometer (Beckman Coulter, Model B53000, Brea, CA, USA) with CytExpert 2.4 software.
Upon reaching 95% confluence, the cells in the 6-well plates were wounded by creating a line with a 200 µL pipette tip. Following three PBS washes to remove debris, cells were maintained in serum-free F-12K or DMEM at 37°C. Wound closure was monitored every 12 h for 48 h using an EVOS™ FL Auto 2 microscope (AMG, AMEV7000, MA, USA) at 10× magnification. Migration rates were calculated as: % Migration = [(Area 0 h−Area nh)/Area 0 h] × 100 using ImageJ software (National Institutes of Health, Bethesda, MD, USA) for quantification.
2.12 Transwell Migration Assay
Migration potential was determined via Transwell® chambers (Corning Costar, catalog number: 3422, Cambridge, MA, USA) featuring 8-μm pores. Briefly, 4 × 10⁴ cells in serum-reduced medium (1% FBS) were added to the upper compartment, while the lower chamber received 1.5 mL of complete medium supplemented with 15% FBS. Following 24 h incubation (37°C, 5% CO2), migrated cells were fixed with 4% paraformaldehyde for 15 min and stained with 0.1% crystal violet (Sangon Biotech, catalog number: C620035, Shanghai, China) for 20 min. Non-migrated cells were mechanically removed using cotton-tipped applicators. Membranes were imaged at 200× magnification using an Axio Observer 7 microscope (Carl Zeiss AG, 431007-9000-000, Oberkochen, Germany) with five random fields counted per insert.
PC3-EphA2-KD and PC3-Cas9-control cells and DU145-EphA2-OE and DU145-control cells in 10 cm petri dishes were collected, transferred to 1.5 mL Eppendorf tubes, and then centrifuged to remove the supernatant. The samples were then prepared and processed by LC Biotech Corporation (Hangzhou, China). Transcriptome sequencing combined with the published literature in PubMed were used to evaluate the expression levels of genes to identify candidate differentially expressed genes (DEGs). The expression levels of these candidate DEGs were assessed using qPCR and Western blotting.
We used clinical data from The Cancer Genome Atlas (TCGA) database (https://xenabrowser.net/datapages/ (accessed on 02 June 2025)) to analyze the expression of the EphA2 and CDH1 genes in prostate cancer and to determine the relationships with clinical outcomes (including the pathological T stage, lymph node metastasis and Gleason score). We used these TCGA data to predict the diagnostic performance of EphA2 and CDH1 in lymph node metastasis in clinical prostate cancer samples.
All analyses were conducted using SPSS version 22.0 (IBM, Armonk, NY, USA) and MedCalc version 15.2.2 (MedCalc Software, Ostend, Belgium), with visualizations created in GraphPad Prism 8 (GraphPad Software, San Diego, CA, USA) and Adobe Illustrator CS5 version 15.0.0 (Adobe, San Jose, CA, USA). Data normality was verified by Kolmogorov-Smirnov testing. For normally distributed continuous variables, independent samples t-test (two-group) or one-way ANOVA with Tukey post-hoc tests (multiple groups) were applied. Non-parametric equivalents employed Mann-Whitney U and Kruskal-Wallis with Dunn’s correction, respectively. Multivariate logistic regression was employed to develop predictive models for lymph node metastasis, and diagnostic performance was evaluated using Receiver Operating Characteristic (ROC) curves with 95% confidence intervals (CIs). All p-values were two-tailed, and statistical significance was defined as p < 0.05.
3.1 CRISPR/Cas9-Induced Mutations at Specific Sites in the EphA2 Gene
After PC3 and DU145 cells were infected with the three CRISPR/Cas9 lentiviral vectors, as shown in Fig. 1B, CRISPR/Cas9-mediated stable EphA2 knockdown cell lines were successfully established because more than 90% of the EGFP-positive cells were monitored via fluorescence microscopy. As shown by the DNA sequencing results (Fig. 1C), the EphA2 gene knockdown efficiencies for the three sgRNA target sites were significantly different in both PC3 and DU145 cells. Compared with control cells, EphA2-sgRNA-1-KD cells presented obvious irregular miscellaneous peaks in addition to a normal single peak in PC3-EphA2-KD and DU145-EphA2-KD cells, followed by EphA2-sgRNA-3. However, EphA2-sgRNA-2 showed only a normal single peak and no differences compared with control cells. In addition, the quantitative TIDE analysis (Fig. 1D) revealed that the total indel frequency of EphA2-sgRNA-1 was 72.9% in PC3-EphA2-KD cells and 77.8% in DU145-EphA2-KD cells, compared to EphA2-sgRNA-3 (9.1%, 52.9%; p < 0.001) and EphA2-sgRNA-2 (6.5%, 30.9%; p < 0.001). Western blot analysis revealed significantly lower EphA2 expression levels induced by EphA2-sgRNA-1 in both PC3-EphA2-KD and DU145-EphA2-KD cells than those induced by EphA2-sgRNA-2 and EphA2-sgRNA-3 (p < 0.001, Fig. 1E). These results indicate that mutations at target sites of the EphA2 gene can be induced by the CRISPR/Cas9 system. However, the CRISPR/Cas9-mediated EphA2 gene-editing efficiencies were highly variable among the three sgRNAs and were the highest for EphA2-sgRNA-1, which was used as the optimal sgRNA targeting the EphA2 gene for subsequent assays.
3.2 Effects of EphA2 on the Biological Functions of CRPC Cells
After PC3 and DU145 cells were infected with a lentivirus targeting the EphA2 gene (EphA2-sgRNA-1), wound healing and transwell migration assays were used to investigate the effect of EphA2 on CRPC cell migration in vitro. PC3-EphA2-KD (PC3-Cas9-sgRNA-1) and DU145-EphA2-KD (DU145-Cas9-sgRNA-1) cells showed significantly lower migration rates than control cells (PC3-Cas9-control, DU145-Cas9-control) in the wound-healing assay (p < 0.001, Fig. 2A). Moreover, the number of migrated PC3-EphA2-KD and DU145-EphA2-KD cells in the transwell migration assay was notably lower in the experimental group when compared with the control group (p < 0.001, Fig. 2B). However, no obvious differences in cell proliferation or cell apoptosis were observed between the EphA2 knockdown and control groups of PC3 and DU145 cells in vitro (p > 0.05, Fig. 2C–E).
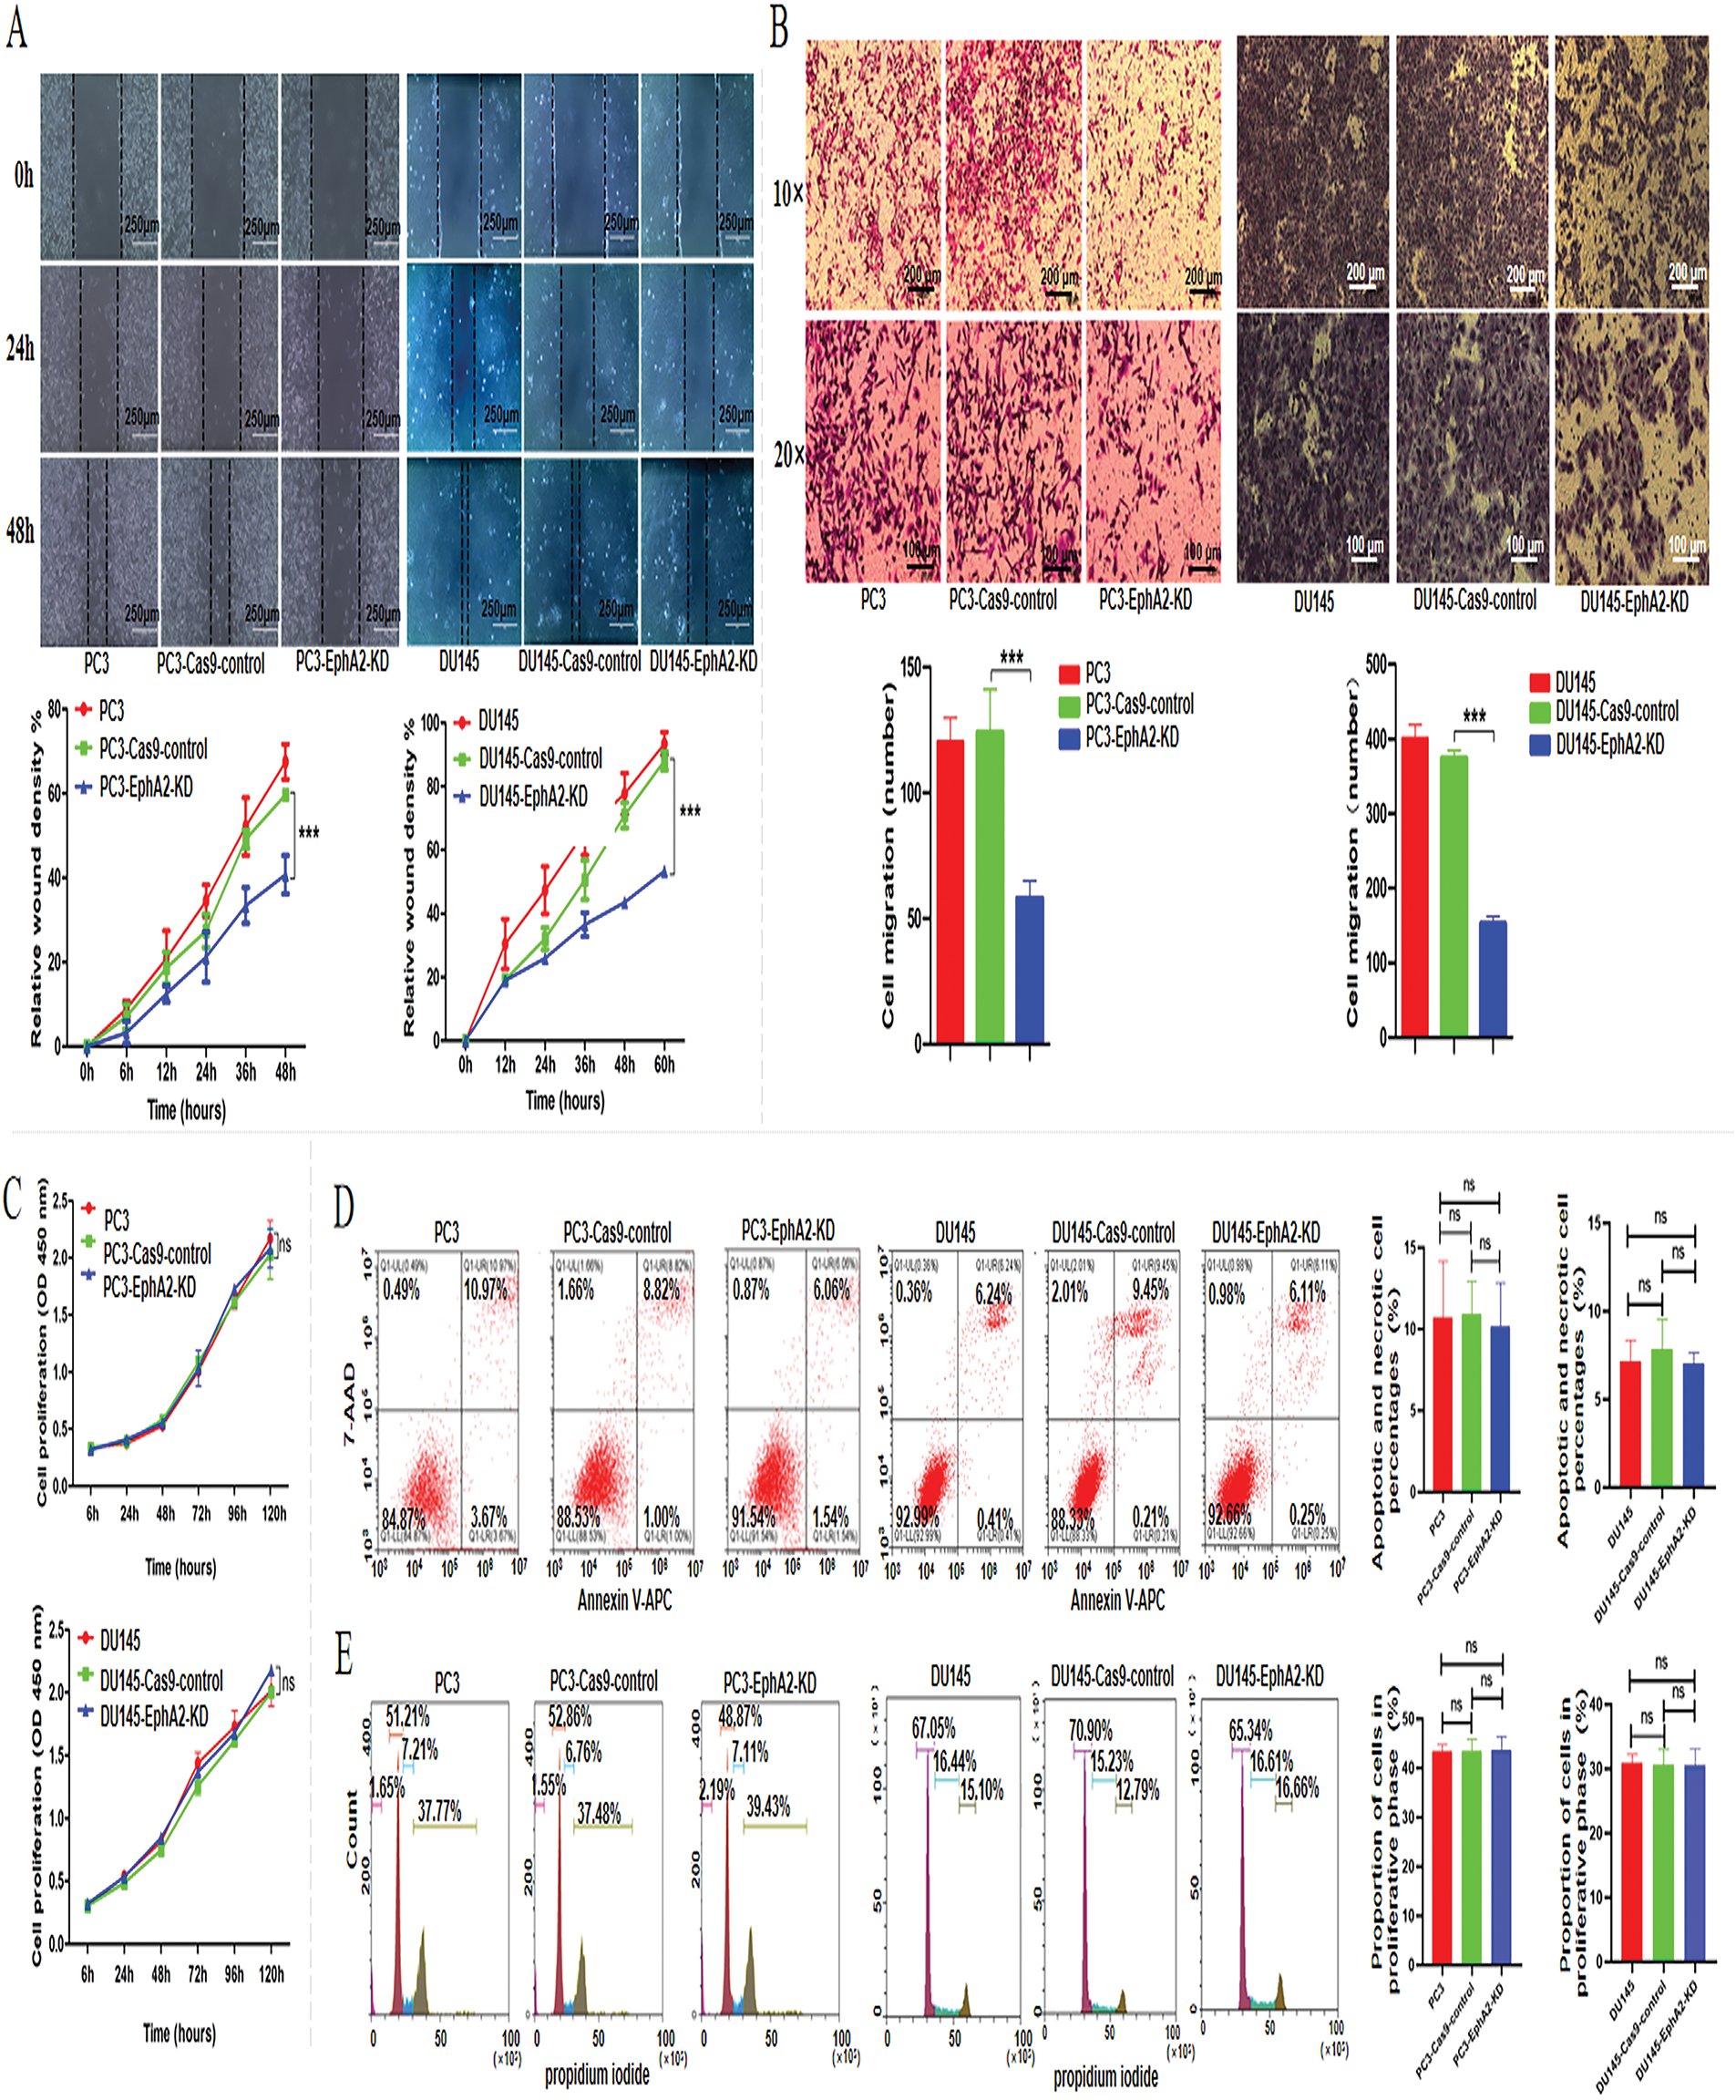
Figure 2: Knockdown of the EphA2 gene and changes in biological functions. (A, B) Cell migration assay. Representative images and quantified migration areas/cell counts from the wound-healing and transwell assays. (C) Tumor cell proliferation was analyzed via the CCK-8 assay. For flow cytometry analysis (D, E), cell apoptosis was detected with an APC/7-AAD kit, and cell cycle distribution was analyzed using a propidium iodide (PI) kit. All experiments were performed in triplicate. Significance was defined as p < 0.05 (***p < 0.001, ns p ≥ 0.05)
To further investigate the impact of EphA2 overexpression on oncogenic activity, we established DU145-EphA2-OE and DU145-control cell lines. The former was generated by transfecting an EphA2 expression plasmid, while the latter was transfected with an empty vector. The plasmid transfection efficiency was tested using qPCR and western blot analysis (Fig. 3A). In DU145-EphA2-OE cells, EphA2 protein expression was approximately 10-fold higher than in DU145-control cells, indicating specific overexpression mediated by the plasmid. We showed increased migration of DU145-EphA2-OE cells (p < 0.05, Fig. 3B,C), whereas no significant differences in cell proliferation or apoptosis were observed among different groups (p > 0.05, Fig. 3D–F). These results demonstrated that EphA2 facilitated the migration of CRPC cells but not their proliferation or cell apoptosis in vitro.
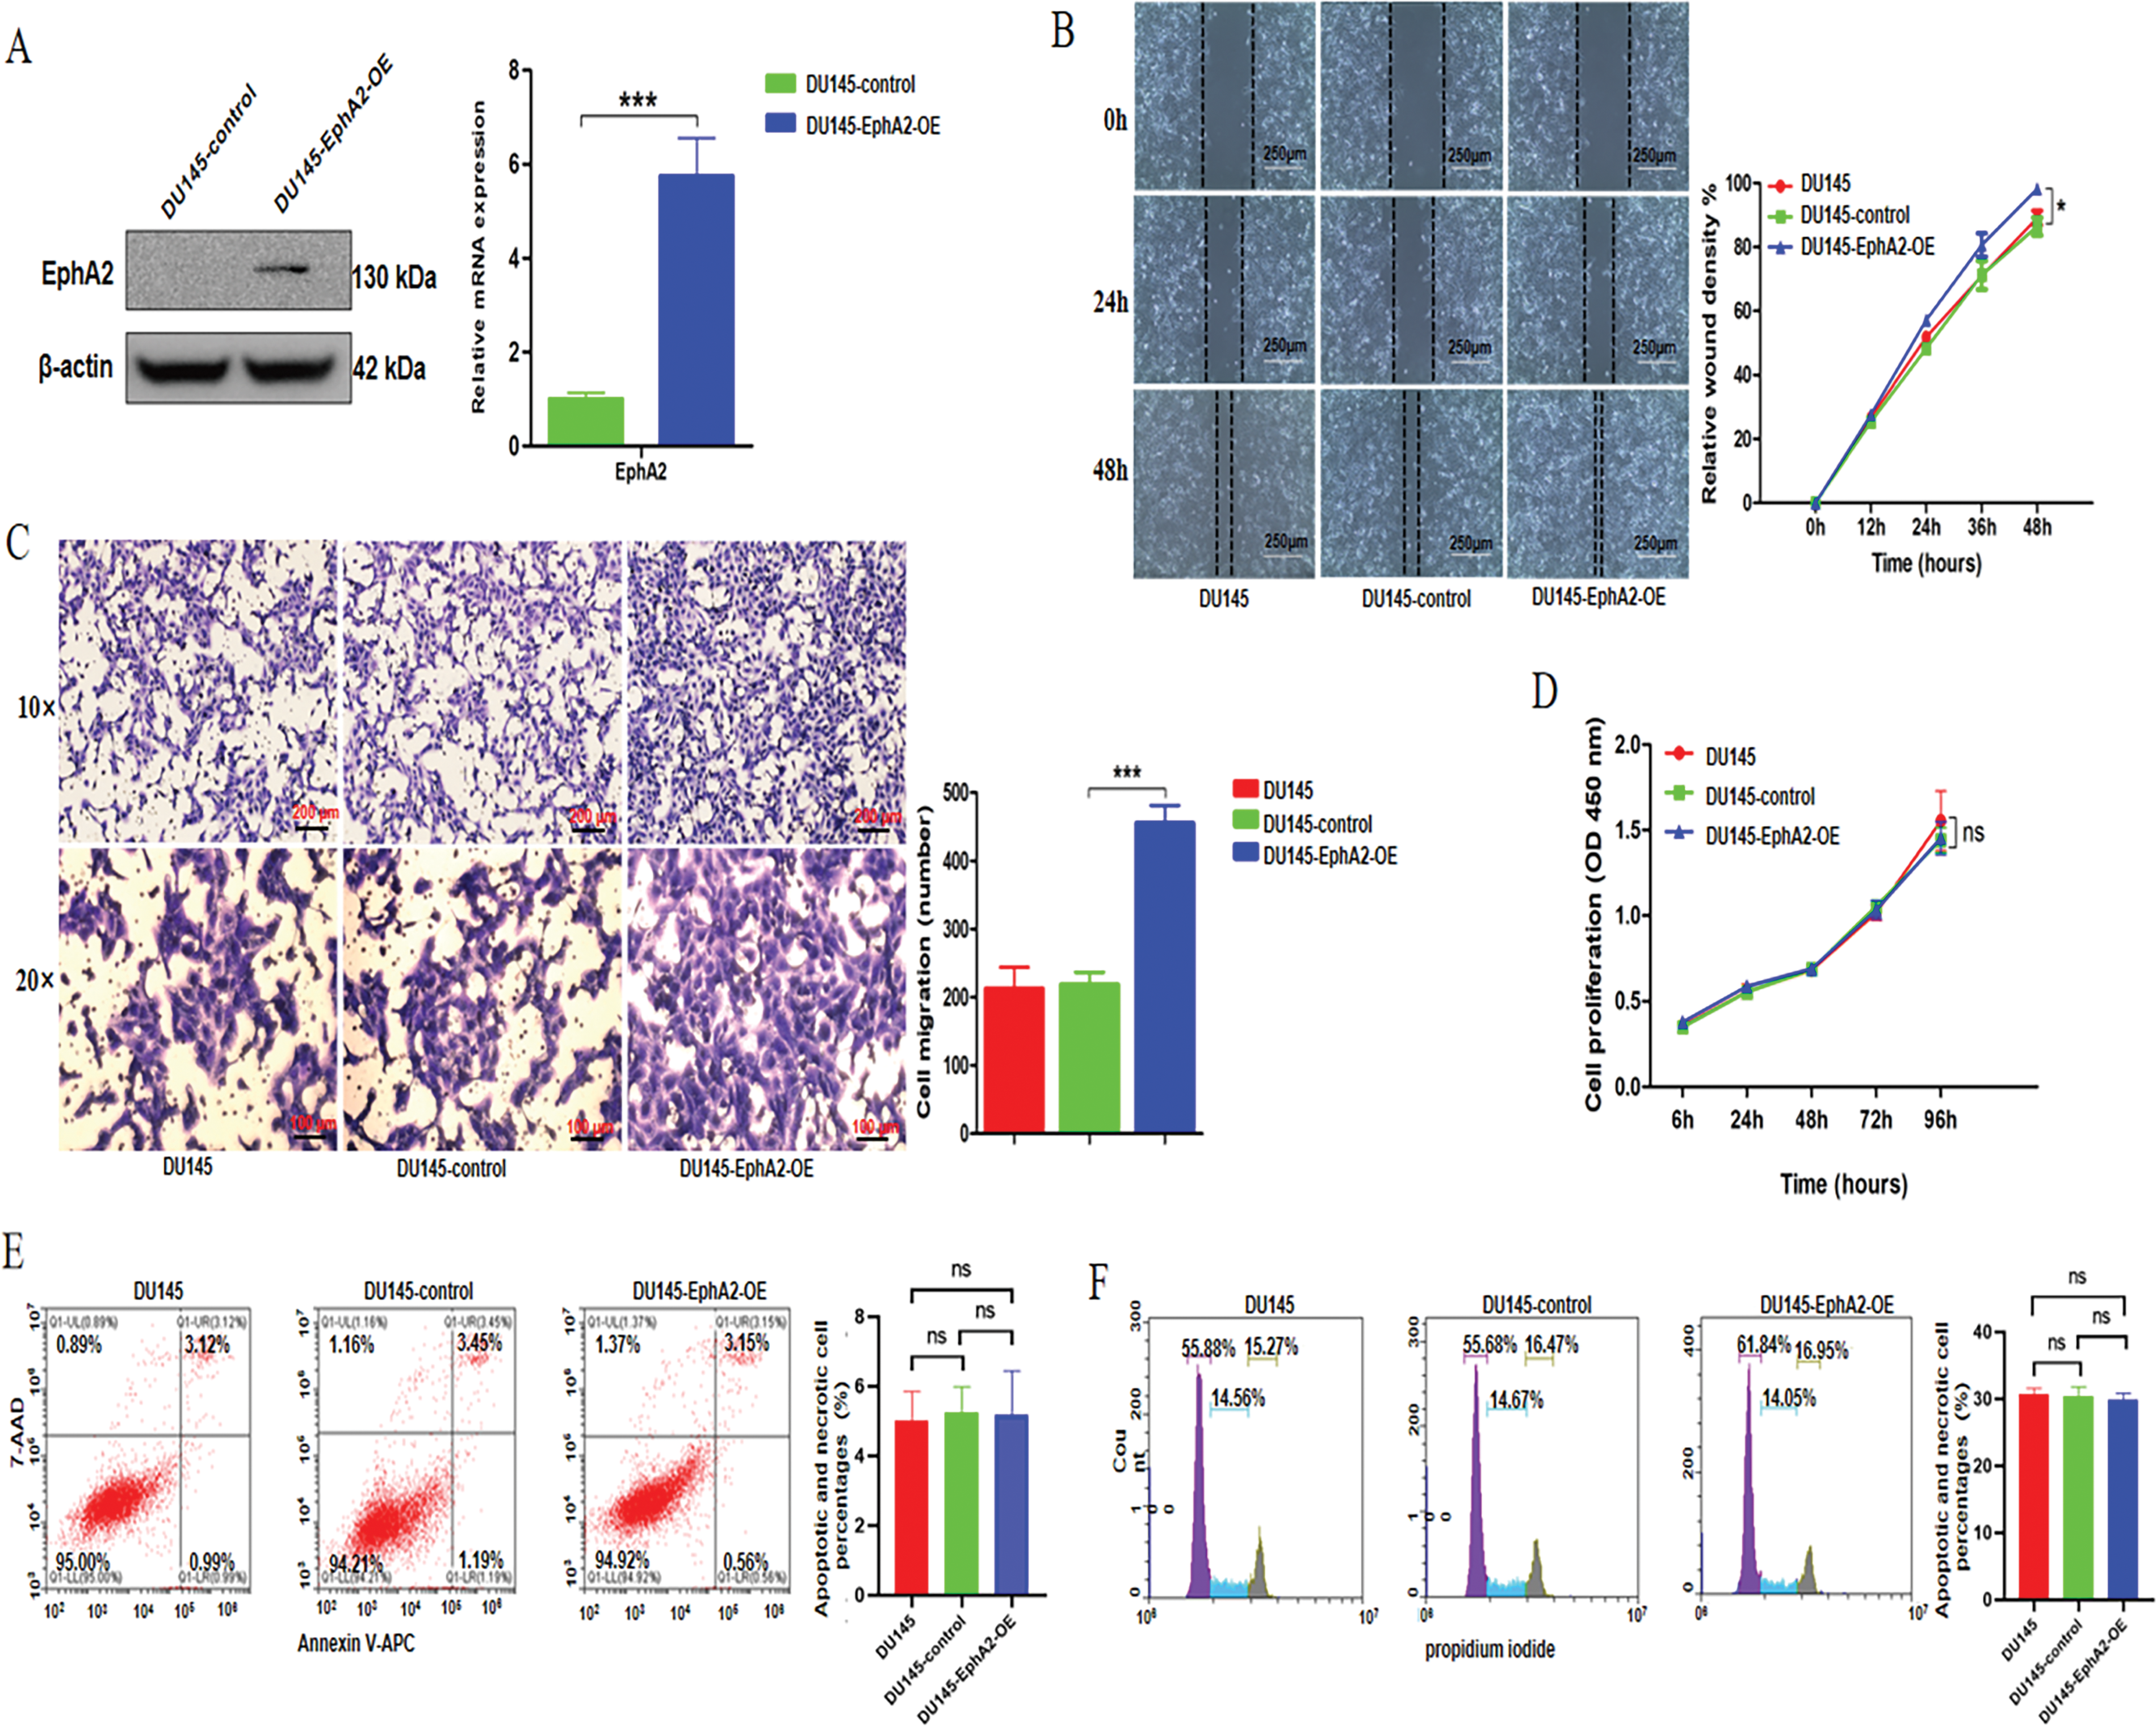
Figure 3: Overexpression of the EphA2 gene and changes in biological functions. (A) qPCR and Western blot analyses. Compared with the DU145-control cells, the expression level of EphA2 was clearly increased in the DU145-EphA2-OE cells. (B, C) Cell migration assay. Representative images and migration areas/numbers from the wound-healing and transwell assays. (D) Analysis of tumor cell proliferation using the CCK-8 assay. (E, F) Flow cytometry. Cell apoptosis and the cell cycle were assessed using an APC/7-AAD kit and a propidium iodide (PI) Kit, respectively. All experiments were performed in triplicate. Significance was defined as p < 0.05 (*p < 0.05, ***p < 0.001, ns p ≥ 0.05)
3.3 CDH1 Was Predicted to Be Downstream of EphA2
We further explored the potential mechanisms of EphA2 using transcriptome sequencing and published work to identify candidate downstream DEGs associated with EphA2 in the PC3-EphA2-KD and PC3-Cas9-control groups and the DU145-EphA2-OE and DU145-control groups. As shown in Fig. 4A, we identified 18 DEGs, of which 10 DEGs were both downregulated in the EphA2-KD group and upregulated in the EphA2-OE group, whereas 8 DEGs were both upregulated in the EphA2-KD group and downregulated in the EphA2-OE group, as illustrated in a Venn diagram. Finally, 10 candidate DEGs (CDH1, RAB10, STRN, PSEN1, FZD6, ERBB2, PLS1, INSR, GNG12 and TRIOBP) were screened after combination with the results of previous studies. The levels of these 10 candidate DEGs are presented in a more intuitive manner (Fig. 4B).
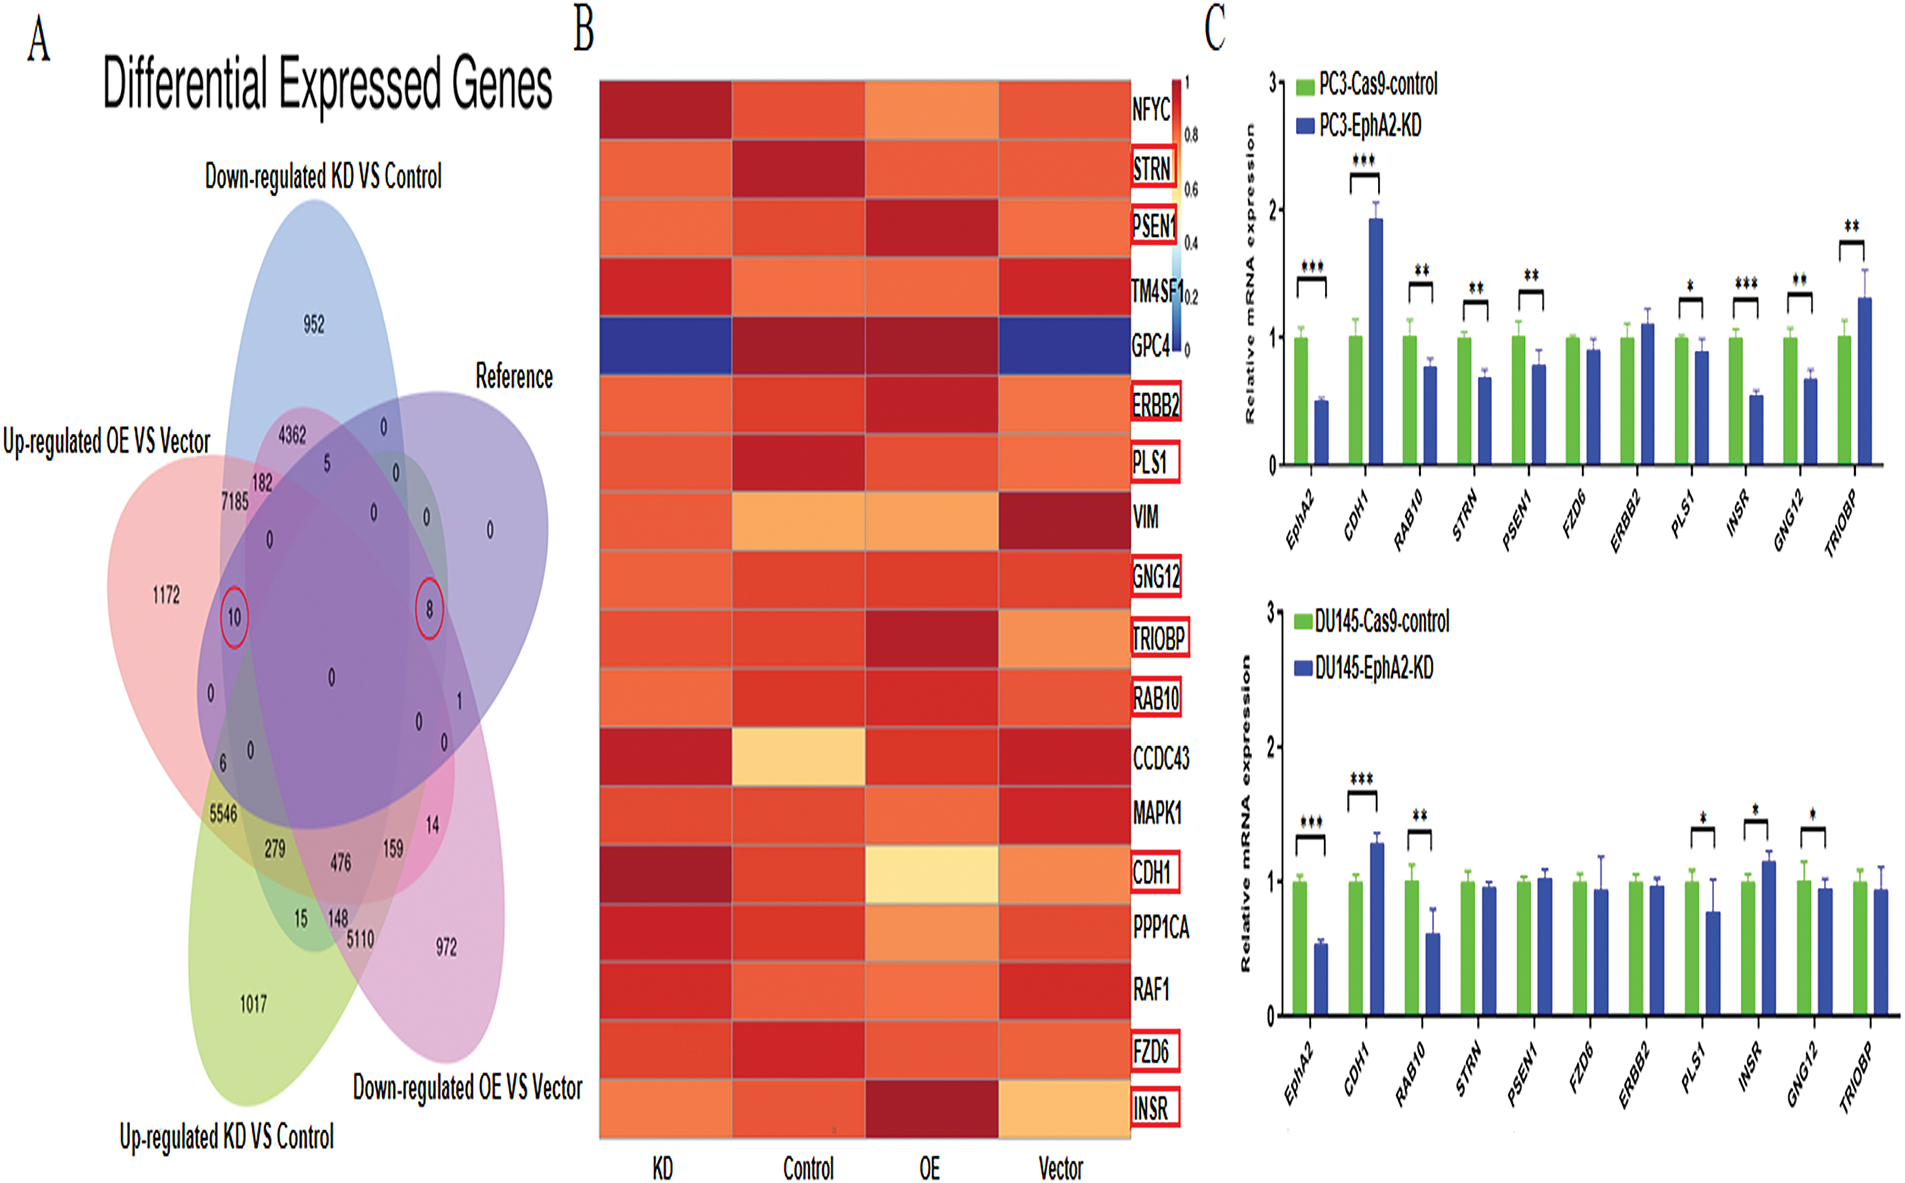
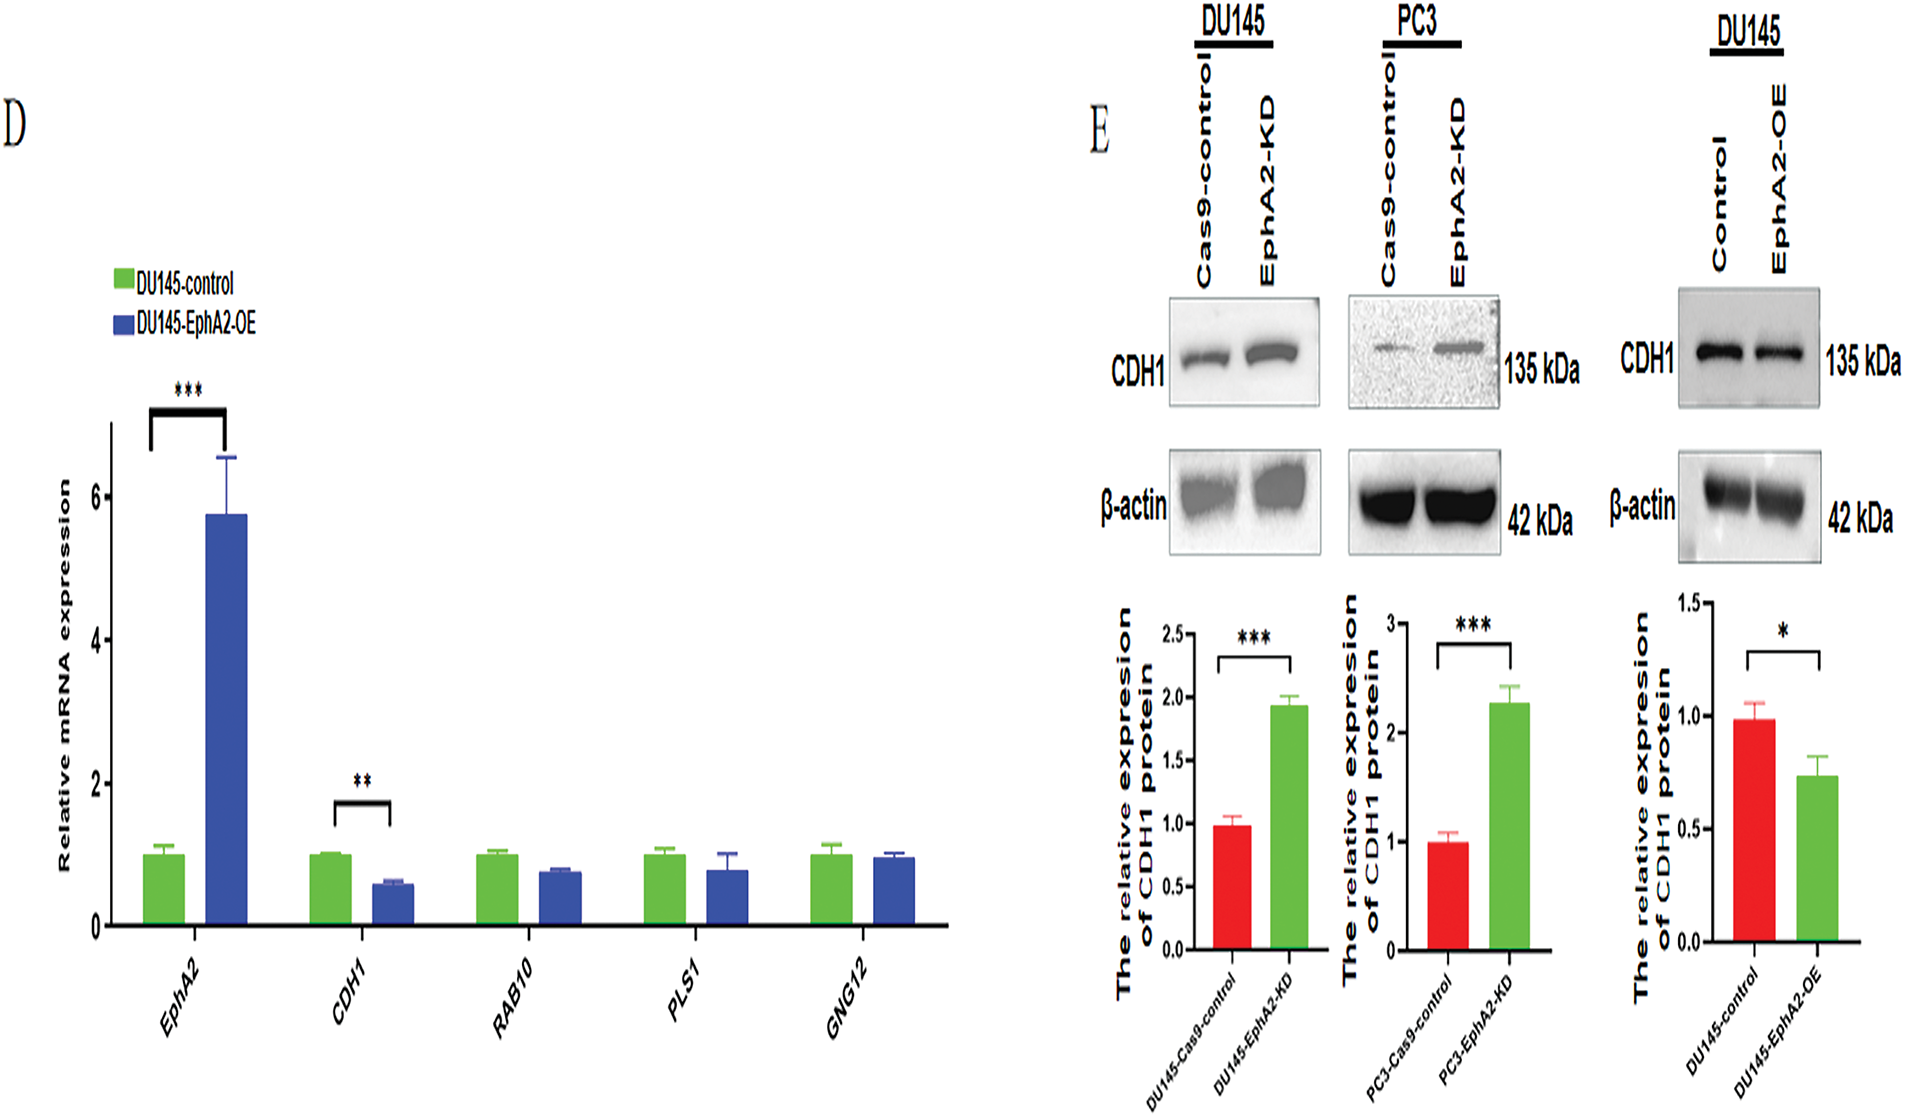
Figure 4: EphA2 gene knockdown and overexpression followed by RNA-seq and a search of the published literature identified the targets important for cell migration. (A) Venn diagram. 18 genes were identified in all, and among them 10 DEGs were both downregulated in the EphA2-KD group and upregulated in the EphA2-OE group, whereas 8 DEGs were both upregulated in the EphA2-KD group and downregulated in the EphA2-OE group. (B) Ten candidate targets were screened after combination with results from the previous literature. All target genes are shown in the heatmap (red circles). (C) The mRNA expression of 10 target genes in EphA2 knockdown cells, of which 4 target genes were significantly up- or downregulated. (D) The mRNA expression of 4 target genes in EphA2-overexpressing cells. CDH1 expression was significantly downregulated upon EphA2 overexpression. (E) Western blot analysis. CDH1 expression was significantly upregulated in both PC3-EphA2-KD and DU145-EphA2-KD cells, whereas it was markedly downregulated in DU145-EphA2-OE cells. Statistical significance was defined as p < 0.05 (*p < 0.05, **p < 0.01, ***p < 0.001)
These 10 candidate DEGs were then verified via qPCR and Western blotting. As depicted in Fig. 4C, the gene expression levels of CDH1, RAB10, PLS1 and GNG12 were significantly different between EphA2-KD and Cas9-control cells in both PC3 and DU145 cells, whereas only CDH1 expression was significantly different between DU145-EphA2-OE and DU145-control cells (Fig. 4D, p < 0.05). We also found that CDH1 expression was significantly elevated in both PC3-EphA2-KD and DU145-EphA2-KD cells, whereas it was remarkably reduced in DU145-EphA2-OE cells (Fig. 4E, p < 0.05). These results indicated that CDH1 is a downstream regulator of EphA2 and that its expression level is negatively correlated with EphA2. CDH1, recognized as a key marker of epithelial-mesenchymal transition (EMT) in tumors, plays a pivotal role in regulating tumor invasion and metastasis.
3.4 The Clinical Relevance of the EphA2-CDH1 Axis in Prostate Cancer
The expression levels of EphA2 and CDH1 in clinical samples need to be further investigated based on the negative correlation in vitro. A total of 477 clinical samples from TCGA database were ultimately included and divided into different groups, including lymph node metastasis (“no”, n = 71; “yes”, n = 406), tumor T stage (“T2”, n = 188; “≥T3”, n = 289) and Gleason score (“6”, n = 45; “7”, n = 238; “8”, n = 61; “9–10”, n = 133). EphA2 gene expression was statistically significantly higher in samples with lymph node metastasis than in those without (Fig. 5A,B, p < 0.05). CDH1 gene underexpression was significantly associated with advanced tumor T stage and higher Gleason score (Fig. 5C–F, p < 0.05). These results indicated that prostate cancer patients with higher EphA2 expression but lower CDH1 expression had a greater risk of lymph node metastasis, advanced tumor T stage and higher Gleason score.
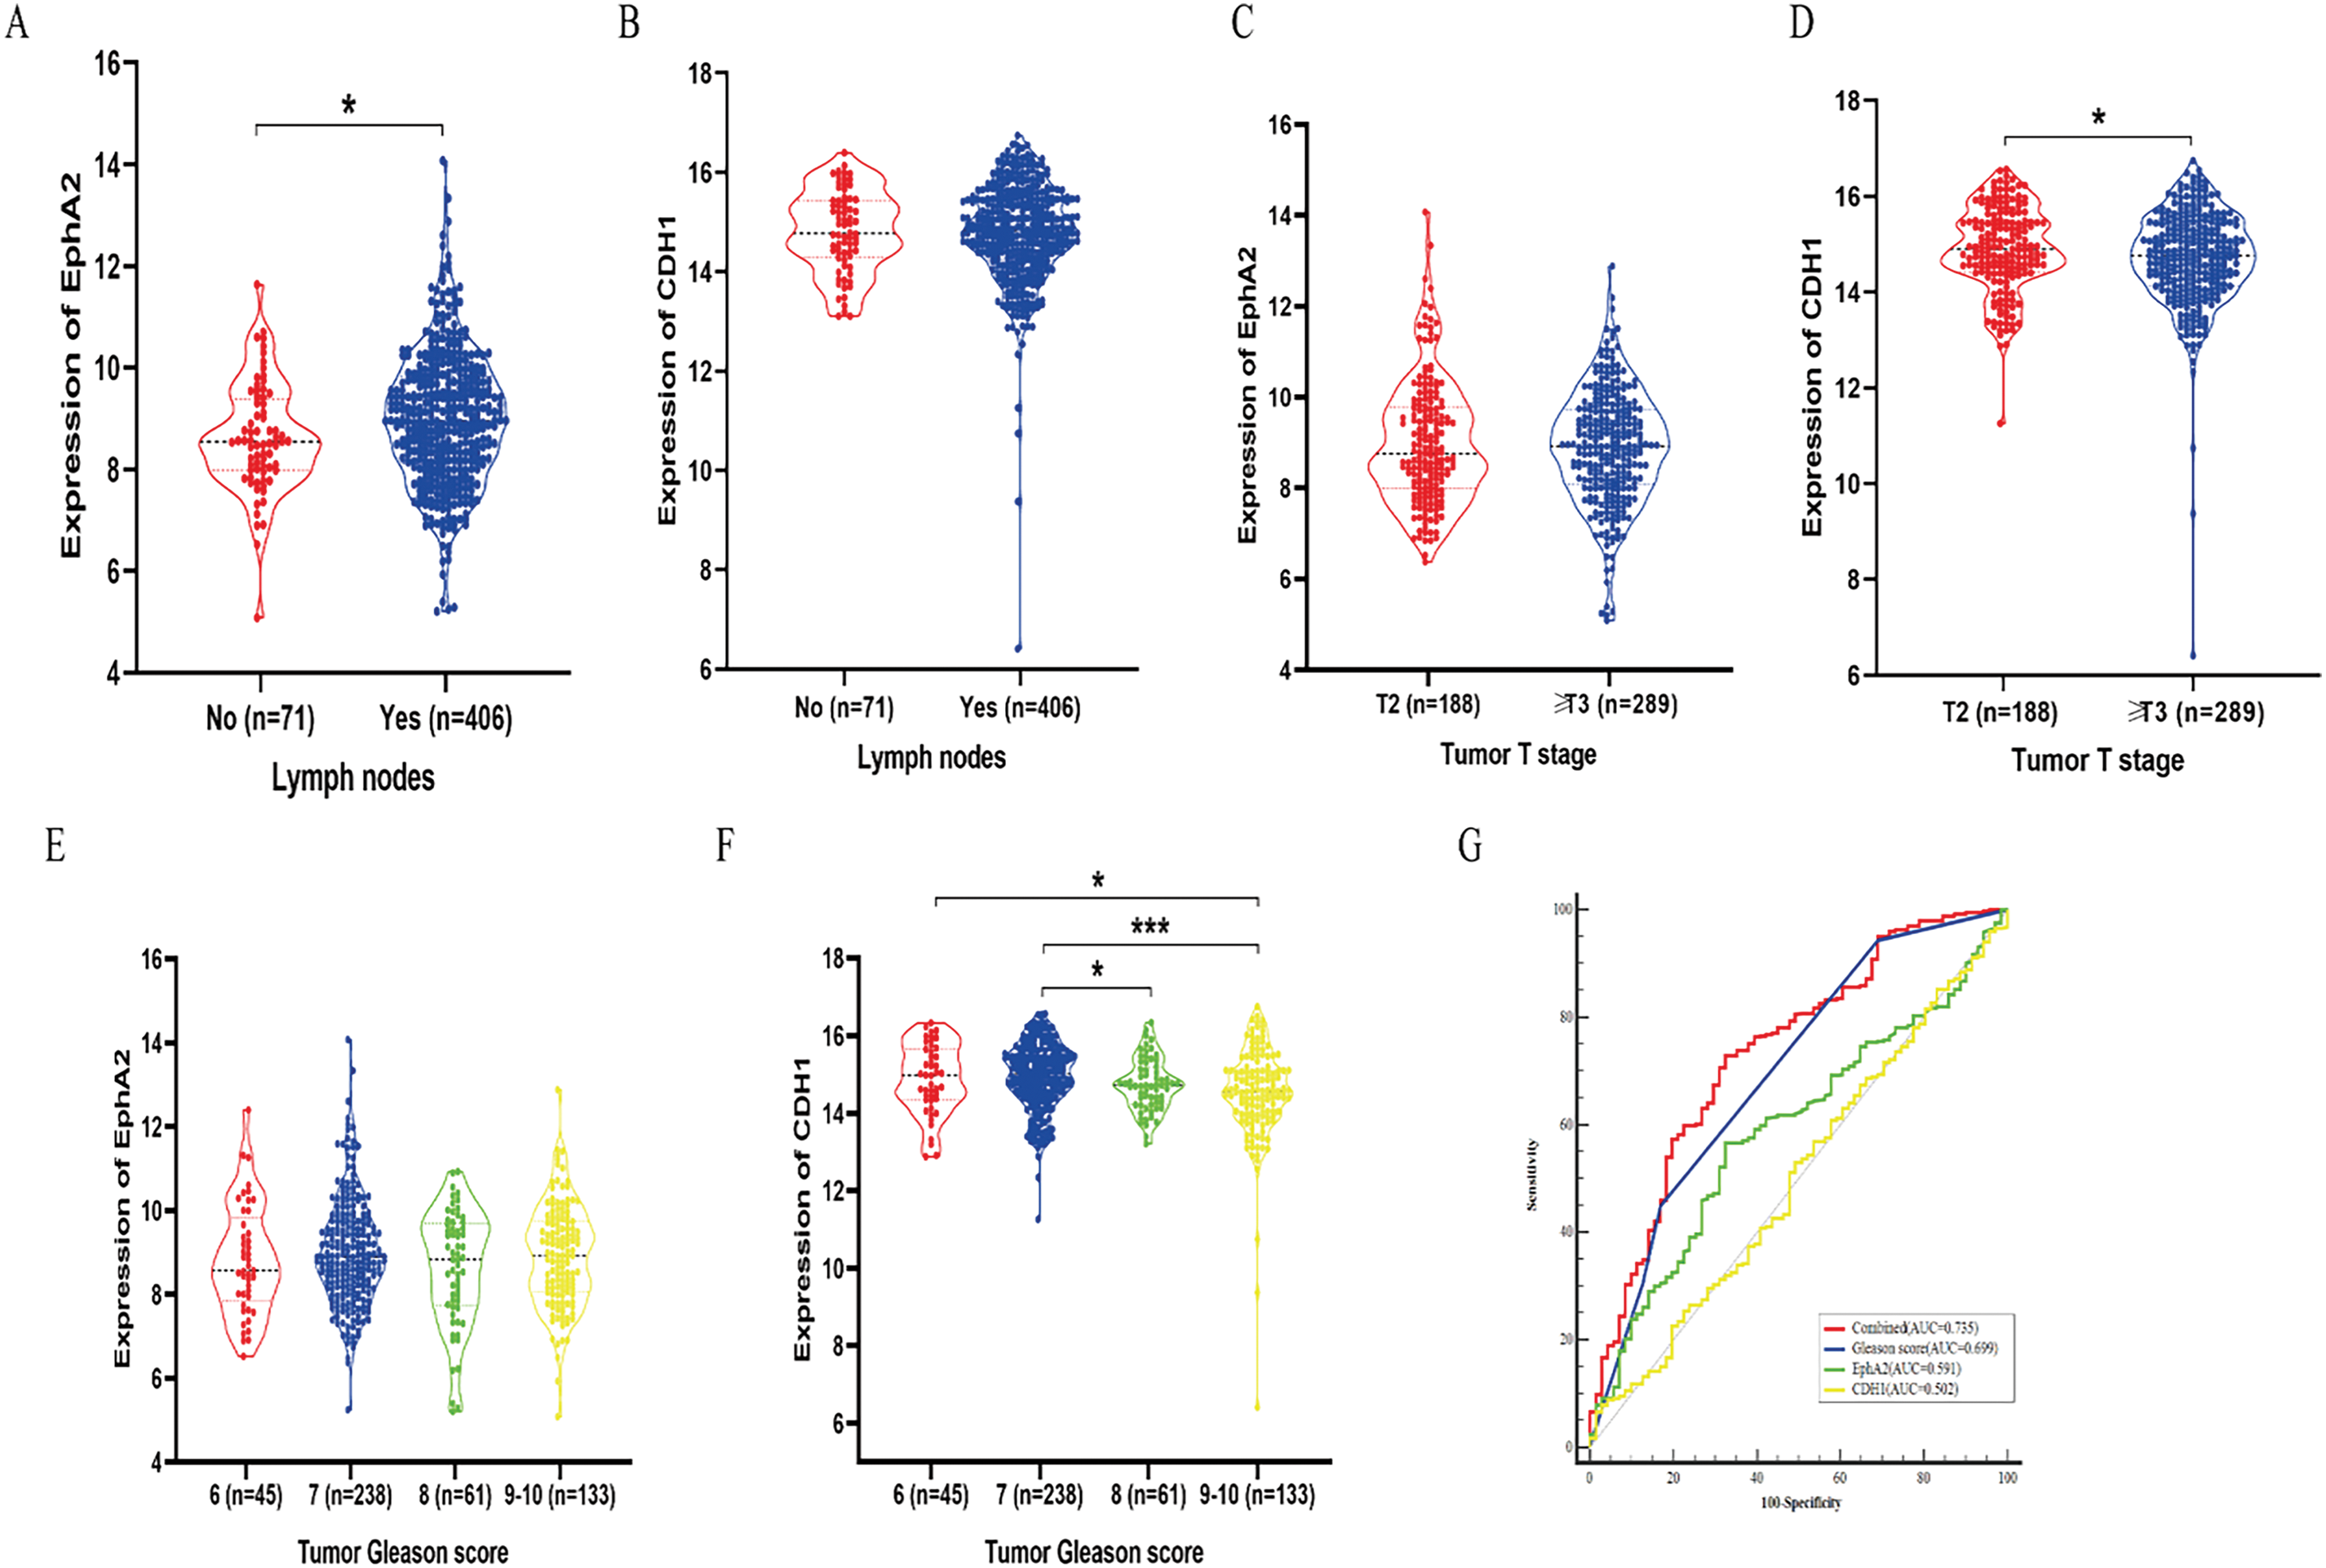
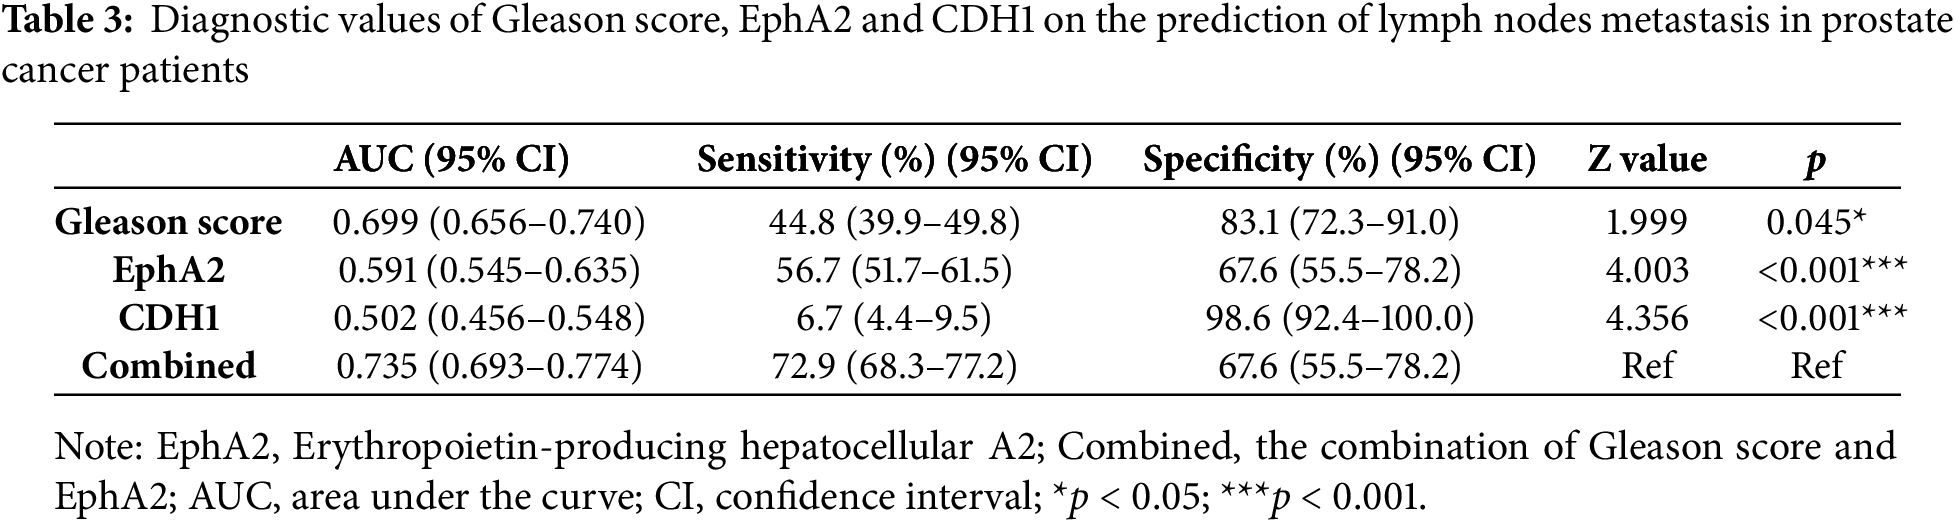
Figure 5: Study of the clinical relevance of EphA2 and CDH1 in prostate cancer based on TCGA database. (A, B) EphA2 gene expression was statistically significantly higher in samples with lymph node metastasis than in those without. (C, D) CDH1 gene underexpression was significantly associated with advanced tumor T stage. (E, F) CDH1 gene underexpression was significantly associated with higher Gleason score. (G) The ROC curve analysis demonstrated that the combined model of Gleason score and EphA2 expression had the highest AUC of 0.735, which was significantly higher than that of the Gleason score (AUC = 0.699), EphA2 expression (AUC = 0.591), and CDH1 expression (AUC = 0.502). Statistical significance was defined as p < 0.05 (*p < 0.05, ***p < 0.001)
Multivariate binary logistic regression was used to further elucidate the value of EphA2 for predicting lymph node metastasis in clinical samples. We found that in addition to the Gleason score, EphA2 expression was an independent indicator for predicting lymph node metastasis. ROC curve analysis further demonstrated that the combined model of Gleason score and EphA2 expression had the highest AUC of 0.735, which was greater than that of the Gleason score (AUC = 0.699), EphA2 expression (AUC = 0.591), and CDH1 expression (AUC = 0.502), with significant differences (p < 0.05, Fig. 5G). As shown in Table 3, the combination model had a higher sensitivity (72.9%) than the Gleason score (44.8%), EphA2 expression (56.7%), and CDH1 expression (6.7%), which indicated that adding EphA2 expression to the Gleason score could improve the detection of lymph node metastasis.
Despite continuous ADT therapy and maintenance of serum testosterone levels below 50 ng/dL, CRPC still continues to progress and is not effectively controlled by conventional treatments. EphA2, a member of the largest known family of receptor tyrosine kinases, is overexpressed in CRPC cells and may be associated with CRPC progression. However, the oncogenic function of EphA2 in CRPC has been underexplored in prior research. In this study, we employed a novel and robust CRISPR/Cas9 system to achieve EphA2 gene knockdown in CRPC cells, which differed from the methods used in previous studies. Oner et al. [18] used a small interfering RNA (siRNA) to induce short-term silencing of EphA2. Transiently transfected siRNAs are not integrated into the genome and can be lost by environmental factors and cell division, which directly affects the stability and reliability of the results. Compared with siRNAs, CRISPR/Cas9 achieved permanent knockdown of the target gene. CRISPR-based stable transfection was used to explore the function of the EphA2 gene better. In addition, the targeted gene editing efficiency of CRISPR/Cas9 was susceptible to effects of the sgRNA sequence. Our results demonstrated that sgRNA-1 achieved the highest EphA2 gene-editing efficiency (72.9% in PC3 and 77.8% in DU145 cells), significantly outperforming the other two sgRNAs. Our findings demonstrate significant variability in gene-editing efficiency among sgRNA sequences targeting different genomic loci, highlighting the critical need to optimize sgRNA selection for maximal efficacy. This result aligns with prior observations reported by Seki and Rutz [19] and Yuen et al. [20].
In the present study, we targeted the EphA2 gene in both PC3 and DU145 cells with CRISPR/Cas9 and found that silencing EphA2 significantly inhibited CRPC cell migration, which was also reported by Petty et al. [21]. However, they used a small-molecule inhibitor of the EphA2 receptor to observe its biological properties in PC3 cells only and did not include DU145 cells. In addition, we overexpressed the EphA2 gene to further verify its role in CRPC cells, thus using more comprehensive research methods and obtaining more reliable results. We also found that CRISPR/Cas9-mediated knockdown of EphA2 could not effectively induce apoptosis or inhibit cell proliferation in CRPC cell lines, which was different from the results of Chen et al. [12]. They showed that the overexpression of EphA2 enhanced the proliferation and invasion of LNCaP prostate cancer cells, which may be explained by the multiple functions of EphA2 in different types of prostate cancer cells. However, our results were consistent with those of Salem et al. [22], who used an EphA2 receptor inhibitor to suppress EphA2 and showed no differences in cell proliferation ability. Similar results were also reported by Oner et al. [18].
Because EphA2 enhances the invasion and migration of CRPC cells, the molecular mechanisms of EphA2-induced cell metastasis should be further explored. In our study, 18 candidate DEGs were initially selected based on transcriptome sequencing and the previously published literature and then verified by qPCR and Western blotting; these DEGs were clear and easy to replicate throughout the screening process. Our results revealed that CDH1 is downstream of EphA2 and that its expression is negatively correlated with EphA2 expression. To our knowledge, the relationship between CDH1 and EphA2 in CRPC has not been reported before. Song et al. [23] reported that silencing EphA2 upregulates CDH1 expression in gastric cancer, a finding that aligns with the results of our study. The CDH1 gene encodes E-cadherin, which plays a pivotal role in maintaining cell adhesion and inhibiting tumor metastasis. The loss of its expression correlates with the EMT. A negative correlation between E-cadherin loss and tumor metastasis has been reported previously [24,25]. Therefore, our results suggest that EphA2 may promote CRPC cell migration through CDH1. Previous studies have also investigated the mechanisms of EphA2 in tumors. Balamurugan et al. [24] reported that EphA2 promotes metastasis through β-catenin signaling pathway activation in breast cancer, but our results revealed no significant correlation between EphA2 and β-catenin, which may be due to the different signaling pathways involved in different types of tumors. Batson et al. [26] reported that EphA receptors (EphA2 and EphA4) regulate PC3 cell invasion through the Vav2-RhoA signaling axis, but differential expression of the Rho family was not detected in our study. Yeo et al. [27] discovered the role of EphA2 in vasculogenic mimicry through the Akt pathway in PC3 cells. However, no significant difference in Akt phosphorylation was observed between PC3 and DU145 cells in our study, possibly because different concentrations of serum were used for induction rather than the EphA2 gene knockdown used directly in Yeo’s study. These results also indicate that EphA2 is involved in prostate cancer metastasis through multiple signaling pathways and that the EphA2-CDH1 axis positively affects CRPC cell migration in our study.
In addition, clinical data from TCGA database were used to further analyze the correlation between EphA2 and CDH1 expression and their relationships with lymph node metastasis, tumor T stage and Gleason score. We found that patients with higher EphA2 expression but lower CDH1 expression were more likely to develop lymph node metastasis and had a greater risk of an advanced pathological T stage and a higher Gleason score. More interestingly, EphA2 expression was an independent predictor of lymph node metastasis in addition to the Gleason score, but CDH1 expression was not. This result may be because CDH1 is only one of many genes downstream of EphA2 involved in tumor invasion and migration. Adding EphA2 expression to the Gleason score could significantly improve the detection of lymph node metastasis, also demonstrating the importance of EphA2 in tumor invasion and migration. As a common pathological indicator, the Gleason score is positively correlated with metastatic prostate cancer [28], including lymph node metastasis which is relatively common in prostate cancer patients with a Gleason score over 8 [29,30]. However, the Gleason score alone was not accurate in assessing lymph node metastasis, especially for prostate cancer patients with a Gleason score less than 7. We found that the sensitivity of the Gleason score alone was less than 50%. We also found that the combination of the Gleason score and EphA2 expression could significantly improve the detection of lymph node metastasis in prostate cancer patients, with the sensitivity increasing to 72.9% and the AUC increasing to 0.735. These findings demonstrate that the combined assessment of EphA2 expression and Gleason score enhances the discriminatory power for predicting tumor lymph node metastasis. This result is an important new finding that has not been previously reported.
Our study has several limitations. First, we only used clinical samples in the public database for analysis, but there is a lack of clinical data in our institution. More clinical samples should be recruited to improve the reliability of the results. Second, we investigated only the positive role of EphA2 in CRPC metastasis in vitro, not in vivo. Although the lack of animal experiments is the main limitation, we have to admit the fact that the prostate cancer metastasis model was not easy to establish and most studies have not yet successfully constructed this model. The lung metastasis model of prostate cancer established by a tail vein injection ignores the key process of tumor cell migration and invasion from the prostate in situ, which makes the results insufficiently reliable. Using the EGFP-labeled prostate cancer metastasis model constructed by Salem et al. [22] as a reference, we attempted to establish an orthotopic prostate cancer model in nude mice that simulated the real pathophysiological process of CRPC. However, we found that most of the nude mice did not survive, and no obvious EGFP fluorescence was observed. We will continue to establish an orthotopic prostate cancer model in the future. Third, we opted for a mixed cell population rather than generating well-defined knockout clones. Constructing monoclonal cell lines exhibits variable success rates among different cell lines, proving to be time-consuming and low-yielding. Our initial efforts in screening monoclonal cells and applying fluorescence-activated cell sorting (FACS) in PC3 and DU145 cell lines were thwarted by weak promoter-driven fluorescence. Nevertheless, the sgRNA we optimized demonstrates high efficiency. Our study has revealed that knocking out the EphA2 gene does not impede the proliferation of the PC3 and DU145 cell lines. Given that cell lines with the EphA2 gene knocked out initially accounted for a large proportion, as cells continue to expand, the proportion of these gene-knocked-out cell lines is not likely to decrease but even likely to increase, thus ensuring the reliability of our experimental results.
CRISPR/Cas9-mediated EphA2 gene knockdown significantly suppressed CRPC cell migration by inhibiting the EphA2-CDH1 axis. Higher EphA2 expression but lower CDH1 expression was associated with a greater risk of lymph node metastasis, an advanced tumor T stage and a higher Gleason score. Adding EphA2 expression to the Gleason score could significantly improve the detection of lymph node metastasis. Strategies targeting the EphA2-CDH1 axis may be promising treatments for CPRC.
Acknowledgement: None.
Funding Statement: This research was funded by the National Natural Science Foundation of China (Grant No. 81801754), the Suzhou Science and Technology Bureau Development Plan (Grant No. SYS2020147), the 26th Batch of Extra-Curricular Academic Research Fund Project of Soochow University (Grant No. KY2024235B).
Author Contributions: The authors confirm contribution to the paper as follows: study conception and design: Yue Xiao, Chaogang Wei; experimental operation: Yan Song, Peng Pan, Xiaojing Li, Ningfan Hu, Lanyi Wei; data collection: Yan Song, Yiting Chen, Peng Pan, Xiaojing Li; analysis and interpretation of results: Yan Song, Yiting Chen, Peng Pan, Xiaojing Li; original draft: Yan Song, Yiting Chen; manuscript revision: Yue Xiao, Chaogang Wei. All authors reviewed the results and approved the final version of the manuscript.
Availability of Data and Materials: Sequence data that support the findings of this study have been deposited in the Gene Expression Omnibus (GEO) with the primary accession code GSE267508. Further inquiries can be directed to the corresponding authors.
Ethics Approval: Not applicable.
Conflicts of Interest: The authors declare no conflicts of interest to report regarding the present study.
References
1. Siegel RL, Miller KD, Wagle NS, Jemal A. Cancer statistics, 2023. CA Cancer J Clin. 2023;73(1):17–48. doi:10.3322/caac.21763. [Google Scholar] [PubMed] [CrossRef]
2. Riaz IB, Naqvi SAA, He H, Asghar N, Siddiqi R, Liu H, et al. First-line systemic treatment options for metastatic castration-sensitive prostate cancer: a living systematic review and network meta-analysis. JAMA Oncol. 2023;9(5):635–45. doi:10.1001/jamaoncol.2022.7762. [Google Scholar] [PubMed] [CrossRef]
3. Zhong S, Peng S, Chen Z, Chen Z, Luo JL. Choosing kinase inhibitors for androgen deprivation therapy-resistant prostate cancer. Pharmaceutics. 2022;14(3):498. doi:10.3390/pharmaceutics14030498. [Google Scholar] [PubMed] [CrossRef]
4. He Y, Xu W, Xiao YT, Huang H, Gu D, Ren S. Targeting signaling pathways in prostate cancer: mechanisms and clinical trials. Signal Transduct Target Ther. 2022;7(1):198. doi:10.1038/s41392-022-01042-7. [Google Scholar] [PubMed] [CrossRef]
5. Bello T, Paindelli C, Diaz-Gomez LA, Melchiorri A, Mikos AG, Nelson PS, et al. Computational modeling identifies multitargeted kinase inhibitors as effective therapies for metastatic, castration-resistant prostate cancer. Proc Natl Acad Sci U S A. 2021;118(40):e2103623118. doi:10.1073/pnas.2103623118. [Google Scholar] [PubMed] [CrossRef]
6. Lisle JE, Mertens-Walker I, Rutkowski R, Herington AC. Stephenson SA. Eph receptor and their ligands: promising molecular biomarkers and therapeutic targets in prostate cancer. Biochim Biophys Acta. 2013;1835(2):243–57. doi:10.1016/j.bbcan.2013.01.003. [Google Scholar] [PubMed] [CrossRef]
7. Tandon M, Vemula SV, Mittal SK. Emerging strategies for EphA2 receptor targeting for cancer therapeutics. Expert Opin Ther Targets. 2011;15(1):31–51. doi:10.1517/14728222.2011.538682. [Google Scholar] [PubMed] [CrossRef]
8. Liu B, Sun W, Gao W, Li L, Cao Z, Yang X, et al. microRNA-451a promoter methylation regulated by DNMT3B expedites bladder cancer development via the EPHA2/PI3K/AKT axis. BMC Cancer. 2020;20(1):1019. doi:10.1186/s12885-020-07523-8. [Google Scholar] [PubMed] [CrossRef]
9. Zhou L, Lu X, Zhang B, Shi Y, Li Z. EphA2 as a new target for breast cancer and its potential clinical application. Int J Clin Exp Pathol. 2021;14(4):484–92. [Google Scholar] [PubMed]
10. Chang FL, Tsai KC, Lin TY, Chiang CW, Pan SL, Lee YC. Effectiveness of anti-erythropoietin producing Hepatocellular receptor Type-A2 antibody in pancreatic cancer treatment. Heliyon. 2023;9(11):e21774. doi:10.1016/j.heliyon.2023.e21774. [Google Scholar] [PubMed] [CrossRef]
11. Arnone CM, Polito VA, Mastronuzzi A, Carai A, Diomedi FC, Antonucci L, et al. Oncolytic adenovirus and gene therapy with EphA2-BiTE for the treatment of pediatric high-grade gliomas. J Immunother Cancer. 2021;9(5):e001930. doi:10.1136/jitc-2020-001930. [Google Scholar] [PubMed] [CrossRef]
12. Chen P, Huang Y, Zhang B, Wang Q, Bai P. EphA2 enhances the proliferation and invasion ability of LNCaP prostate cancer cells. Oncol Lett. 2014;8(1):41–6. doi:10.3892/ol.2014.2093. [Google Scholar] [PubMed] [CrossRef]
13. Taddei ML, Parri M, Angelucci A, Bianchini F, Marconi C, Giannoni E, et al. EphA2 induces metastatic growth regulating amoeboid motility and clonogenic potential in prostate carcinoma cells. Mol Cancer Res. 2011;9(2):149–60. doi:10.1158/1541-7786.MCR-10-0298. [Google Scholar] [PubMed] [CrossRef]
14. Wu X, Scott DA, Kriz AJ, Chiu AC, Hsu PD, Dadon DB, et al. Genome-wide binding of the CRISPR endonuclease Cas9 in mammalian cells. Nat Biotechnol. 2014;32(7):670–6. doi:10.1038/nbt.2889. [Google Scholar] [PubMed] [CrossRef]
15. Asmamaw M, Zawdie B. Mechanism and applications of CRISPR/Cas-9-mediated genome editing. Biologics. 2021;15:353–61. doi:10.2147/BTT.S326422. [Google Scholar] [PubMed] [CrossRef]
16. Wei C, Chen T, Zhang Y, Wang Y, Shi D, Jiang Z, et al. A novel white-to-blue colony formation assay to select for optimized sgRNAs. Mol Biotechnol. 2021;63(1):1–12. doi:10.1007/s12033-020-00280-w. [Google Scholar] [PubMed] [CrossRef]
17. Brinkman EK, Chen T, Amendola M, van Steensel B. Easy quantitative assessment of genome editing by sequence trace decomposition. Nucleic Acids Res. 2014;42(22):e168. doi:10.1093/nar/gku936. [Google Scholar] [PubMed] [CrossRef]
18. Oner E, Kotmakci M, Baird AM, Gray SG, Debelec Butuner B, Bozkurt E, et al. Development of EphA2 siRNA-loaded lipid nanoparticles and combination with a small-molecule histone demethylase inhibitor in prostate cancer cells and tumor spheroids. J Nanobiotechnol. 2021;19(1):71. doi:10.1186/s12951-021-00781-z. [Google Scholar] [PubMed] [CrossRef]
19. Seki A, Rutz S. Optimized RNP transfection for highly efficient CRISPR/Cas9-mediated gene knockout in primary T cells. J Exp Med. 2018;215(3):985–97. doi:10.1084/jem.20171626. [Google Scholar] [PubMed] [CrossRef]
20. Yuen G, Khan FJ, Gao S, Stommel JM, Batchelor E, Wu X, et al. CRISPR/Cas9-mediated gene knockout is insensitive to target copy number but is dependent on guide RNA potency and Cas9/sgRNA threshold expression level. Nucleic Acids Res. 2017;45(20):12039–53. doi:10.1093/nar/gkx843. [Google Scholar] [PubMed] [CrossRef]
21. Petty A, Myshkin E, Qin H, Guo H, Miao H, Tochtrop GP, et al. A small molecule agonist of EphA2 receptor tyrosine kinase inhibits tumor cell migration in vitro and prostate cancer metastasis in vivo. PLoS One. 2012;7(8):e42120. doi:10.1371/journal.pone.0042120. [Google Scholar] [PubMed] [CrossRef]
22. Salem AF, Gambini L, Billet S, Sun Y, Oshiro H, Zhao M, et al. Prostate cancer metastases are strongly inhibited by agonistic Epha2 ligands in an orthotopic mouse model. Cancers. 2020;12(10):2854. doi:10.3390/cancers12102854. [Google Scholar] [PubMed] [CrossRef]
23. Song B, Lin HX, Dong LL, Ma JJ, Jiang ZG. MicroRNA-338 inhibits proliferation, migration, and invasion of gastric cancer cells by the Wnt/β-catenin signaling pathway. Eur Rev Med Pharmacol Sci. 2018;22(5):1290–6. doi:10.26355/eurrev_201803_14470. [Google Scholar] [PubMed] [CrossRef]
24. Balamurugan K, Poria DK, Sehareen SW, Krishnamurthy S, Tang W, McKennett L, et al. Stabilization of E-cadherin adhesions by COX-2/GSK3β signaling is a targetable pathway in metastatic breast cancer. JCI Insight. 2023;8(6):e156057. doi:10.1172/jci.insight.156057. [Google Scholar] [PubMed] [CrossRef]
25. Djerroudi L, Bendali A, Fuhrmann L, Benoist C, Pierron G, Masliah-Planchon J, et al. E-cadherin mutational landscape and outcomes in breast invasive lobular carcinoma. Mod Pathol. 2024;37(10):100570. doi:10.1016/j.modpat.2024.100570. [Google Scholar] [PubMed] [CrossRef]
26. Batson J, Maccarthy-Morrogh L, Archer A, Tanton H, Nobes CD. EphA receptors regulate prostate cancer cell dissemination through Vav2-RhoA mediated cell-cell repulsion. Biol Open. 2014;3(6):453–62. doi:10.1242/bio.20146601. [Google Scholar] [PubMed] [CrossRef]
27. Yeo C, Lee HJ, Lee EO. Serum promotes vasculogenic mimicry through the EphA2/VE-cadherin/AKT pathway in PC-3 human prostate cancer cells. Life Sci. 2019;221:267–73. doi:10.1016/j.lfs.2019.02.043. [Google Scholar] [PubMed] [CrossRef]
28. Boehm BE, York ME, Petrovics G, Kohaar I, Chesnut GT. Biomarkers of aggressive prostate cancer at diagnosis. Int J Mol Sci. 2023;24(3):2185. doi:10.3390/ijms24032185. [Google Scholar] [PubMed] [CrossRef]
29. Kamel MH, Khalil MI, Alobuia WM, Su J, Davis R. Incidence of metastasis and prostate-specific antigen levels at diagnosis in Gleason 3+4 versus 4+3 prostate cancer. Urol Ann. 2018;10(2):203–8. doi:10.4103/UA.UA_124_17. [Google Scholar] [PubMed] [CrossRef]
30. Unger K, Hess J, Link V, Buchner A, Eze C, Li M, et al. DNA-methylation and genomic copy number in primary tumors and corresponding lymph node metastases in prostate cancer from patients with low and high Gleason score. Clin Transl Radiat Oncol. 2023;39(3):100586. doi:10.1016/j.ctro.2023.100586. [Google Scholar] [PubMed] [CrossRef]
Cite This Article
 Copyright © 2025 The Author(s). Published by Tech Science Press.
This work is licensed under a Creative Commons Attribution 4.0 International License , which permits unrestricted use, distribution, and reproduction in any medium, provided the original work is properly cited.
 Downloads
 Citation Tools