
 Submit a Paper
 Propose a Special lssue
 Open Access
ARTICLE
Comprehensive Analysis of the Expression Levels and Prognostic Values of SENP Family Genes in Liver Hepatocellular Carcinoma
1 Anhui Province Key Laboratory of Resource Insect Biology and Innovative Utilization, School of Life Sciences, Anhui Agricultural University, Hefei, 230036, China
2 Department of General Practice, People’s Hospital of Longhua, Shenzhen, 518109, China
* Corresponding Author: Shoujun Huang. Email:
# These authors contributed equally to this work
(This article belongs to the Special Issue: Genetic Biomarkers of Cancer: Insights into Molecular and Cellular Mechanisms)
BIOCELL 2025, 49(8), 1481-1504. https://doi.org/10.32604/biocell.2025.066205
Received 01 April 2025; Accepted 08 July 2025; Issue published 29 August 2025
 View Full Text
 Download PDF
Abstract
Background: Small ubiquitin-like modifier (SUMO)-specific proteases (SENPs) cleave the isopeptidic bond between SUMO1/2/3 and protein substrates, thus regulating the structure, activity, and lifetime of a variety of proteins. Recently, accumulating evidence has suggested that SENPs play a role in the initiation and progression of human cancers. Nevertheless, the potential role of the SENP family of proteins in liver cancer has yet to be fully elucidated. Methods: This study conducted a comprehensive bioinformatics analysis of the SENP family in liver cancer, including differential expression profiling, survival analysis, mutation and copy number variations (CNVs) assessment, immune infiltration and drug sensitivity correlation, functional enrichment analyses using data from The Cancer Genome Atlas (TCGA), Clinical Proteomic Tumor Analysis Consortium (CPTAC), LinkedOmics, and other public databases. Furthermore, we performed in vitro experiments using Huh-7 and Hep-3B cell lines to investigate the functional roles of SENP1 and SENP3 in hepatocellular carcinoma cell proliferation, colony formation, and migration. Results: Our results indicated that SENP1, 3, and 7 were significantly overexpressed in liver hepatocellular carcinoma (LIHC). Elevated expressions of SENP1, 3, and 7 are positively correlated with poor overall survival (OS) in LIHC patients. In addition, SENP1, 3, and 7 expressions are related to immune infiltration and drug sensitivity. SENP1, 3, and 7 co-expressed genes were enriched in mitochondrial function, ribosomal translation, and cell cycle control. Conclusion: SENP1, 3, and 7 are prognostic biomarkers and potential therapeutic targets for LIHC. Knockdown of SENP1 and SENP3 inhibited the proliferation, clonogenicity, and migration of hepatocellular carcinoma cells.Keywords
Supplementary Material
Supplementary Material FileOwing to the increasing prevalence of established risk factors, such as aging, lack of physical activity, and environmental pollution, cancer has become a key influencing factor of morbidity and mortality in both developing and developed countries. Liver cancer is one of the most common and prevalent system tumors, with a high incidence rate and fatality rate, and has received international attention. Globally, LIHC is the sixth most prevalent cancer and accounts for the fourth highest number of cancer-related deaths [1], it accounts for 90% of all primary liver cancer cases. The incidence is estimated to reach more than 1 million cases by 2025 [2]. In very early or early hepatocellular carcinoma (HCC), the most effective treatment is surgical resection, liver transplantation, or percutaneous local ablation. In this stage, the 5-year survival rate was 60%–80%, but the recurrence of LIHC was still a major obstacle, and the 5-year recurrence rate was as high as 70%. However, the majority of individuals with hepatocellular carcinoma are detected in the middle or late stage, with a 5-year survival rate of 16% [2]. Systemic therapies, such as immune checkpoint inhibitors, tyrosine kinase inhibitors, and monoclonal antibodies, are frequently used in advanced illness. Despite the approval of multiple tyrosine kinase inhibitors for first-line and second-line therapies, advancements in treatment have remained minimal over time. The recent endorsement of immune checkpoint inhibitors has enhanced the management of hepatocellular carcinoma. Unfortunately, 75% of LIHC patients fail to respond to these immunotherapies due to unknown factors, and biomarker data to help decision-making and guide advanced treatment of hepatocellular carcinoma are limited [3,4]. However, the prognosis of patients was still poor. The goal of treating LIHC in the future should be to target multiple pathways and combine drug therapies to improve OS [5]. Therefore, it is imperative to identify new biomarkers and develop targeted drugs for diagnosis and prognosis, improve the effectiveness of comprehensive treatment, extend the survival of hepatocellular carcinoma patients, and ultimately enhance their quality of life.
Hepatocarcinogenesis is usually related to gene mutations, abnormal signal transduction, and an imbalance between oncoproteins and tumor suppressor proteins. The imbalance in the expression of oncoproteins and tumor suppressor proteins is often related to the post-translational modification (PTMs) of proteins. Studies have indicated that PTMs are vital in the development and advancement of tumors [6]. Investigating the functions of modifying enzymes holds significant potential for identifying novel therapeutic targets in cancer. Oncoproteins and tumor suppressor proteins undergo various PTMs. such as acetylation, methylation, phosphorylation, ubiquitination, SUMOylation, and Neddylation, all of which influence their expression and function. Abnormal PTMs can lead to changes in cell characteristics, tumor occurrence, and cancer progression.
The SENP family is an important enzyme family that regulates the PTMs of proteins. It belongs to a family of cysteine proteases and has a conserved catalytic domain characterized by a papain-like fold [7]. SENP1 and SENP2 can catalyze the maturation of SUMO1–3 and have preferences for SUMO1/2. SENP3 and SENP5 had preferences for SUMO2/3. SENP6 and SENP7 can edit poly-SUMO2/3 chains. SENP1 and SENP2 exhibit the highest catalytic activities [8]. SENP8 does not act on SUMOylated substrates and specifically cleaves NEDD8 from its substrate [9]. Several studies have revealed that the SENP family is critically involved in the onset and progression of various malignancies. Decreasing SENP1 can reduce c-Myc [10] and HIF-1α [11], activate p53 activity [12], and inhibit cell proliferation, and is closely related to prostate cancer [13], ovarian cancer [14] and triple-negative breast cancer [15]. High expression of SENP2 is directly connected to poor advancement of nasopharyngeal cancer [16], head and neck cancers [17], and breast cancer [18]. However, it had also been reported that SENP2 inhibited breast cancer [19], bladder cancer [20], and chronic lymphocytic leukemia cells [21]. SENP3 is highly expressed in gastric cancer [22], oral squamous cell carcinoma [23], pancreatic carcinoma [24], and other cancers. SENP5 promotes the proliferation of oral squamous cell carcinoma [25] and osteosarcoma [26]. SENP6 inhibits the growth and invasion of different types of cancer [27], while a recent report found that SENP6 is a tumor suppressor in diffuse large B-cell lymphoma [28]. SENP7 can reduce the degradation of SUMOylated c-myc [29], protect the oxygen and glucose supply of cancer cells, and is related to the poor prognosis of colorectal cancer [30]. In contrast, SENP8 is the least studied member of the SENP family in cancer research. When DNA damage occurs in cancer cells, E2F1 induced apoptosis depends on SENP8 [31]. However, the SENP family has not been comprehensively analyzed in LIHC.
In this study, we evaluated pertinent data from SENP family members in the LIHC. First, the TCGA was used to examine the expression and prognosis of SENP family members in liver cancer tissues to match with neighboring cancer tissues. We then analyzed gene mutations, correlations with clinical characteristics, protein interactions, functional enrichment, immune infiltration, signal pathways, and drug sensitivity. Next, Additionally, we employed a cell-based model to explore the potential role of SENP1 and SENP3 in regulating key cellular processes in hepatocellular carcinoma, such as proliferation, clonogenicity, and migration. The findings of this study may contribute to the identification of novel diagnostic and therapeutic targets, thereby enhancing treatment efficacy for LIHC.
To explore the expression profiles of the SENP family in cancer, we first analyzed their mRNA levels in various tumor types and adjacent normal tissues using the “Gene_DE” module of the tumor immune estimating resource, version 2 (TIMER 2.0) (http://timer.cistrome.org/), based on TCGA data. Protein expression levels of SENP family members in LIHC from the CPTAC database (https://proteomics.cancer.gov/programs/cptac) (accessed on 07 July 2025) were analyzed through the University of Alabama at Birmingham Cancer Data Analysis Portal (UALCAN) website (http://ualcan.path.uab.edu/ (accessed on 01 July 2025)), where SENP5 had no available protein expression data. Moreover, promoter methylation levels were obtained by UALCAN analysis of data from TCGA.
We used the cBioPortal (https://www.cbioportal.org/) to analyze gene mutations in SENP family members in liver cancer. The “OncoPrint” module revealed the frequency, kind, and quantity of mutations. Mutation data for SENP family members across different liver cancer types were obtained from the “Cancer Types Summary” module. We analyzed the copy number alteration of SENP family members and the relationship between copy number alteration and survival time through the “mutation” section of Gene Set Cancer Analysis (GSCA) web (http://bioinfo.life.hust.edu.cn/GSCA/) (accessed on 01 July 2025).
2.3 Receiver Operating Characteristic (ROC) Curve Analysis
The pROC package [version 1.17.0.] and ggplot2 packages [3.3.3] of the R (3.6.3) software to analyze the RNA-seq data of LIHC in TCGA (https://portal.gdc.cancer.gov/) and obtain the ROC curve of the SENP family. The abscissa represents the false positive rate, whereas the ordinate represents the true positive rate.
We used the Kaplan-Meier “Survival Map” module of Gene Expression Profiling Interactive Analysis, version 2 (GEPIA2) (http://gepia2.cancer-pku.cn/#index) (accessed on 07 July 2025) to analyze the relationship between SENP family expression and OS. Patients were stratified into high- and low-expression groups based on the median (50%) expression cutoff. Survival analysis was conducted using the Kaplan–Meier method via the “Survival Analysis” module, with statistical significance evaluated by the log-rank test.
2.5 Correlation Analysis of Clinical Characteristics
The UALCAN web was used to analyze the data of LIHC patients in TCGA and CPTAC databases and the association between the mRNA and protein expression levels of SENP family members and the particular clinical features of liver cancer patients (such as tumor stage and grade, TP53 mutation, and lymph node metastasis).
2.6 Immune Infiltration Analysis, Signal Pathway Correlation, and Drug Sensitivity
We used the GSVA package and ggplot2 in R (3.6.3) to evaluate the association between SENP family expression levels and immune infiltration. Significance was assessed by Spearman’s correlation analysis. Samples were classified into two groups (High and Low) by median gene expression, and the difference in pathway activity score (PAS) between groups was defined by the student’s t-test. p value was adjusted by false discovery rate (FDR), and FDR ≤ 0.05 was considered significant. And the “Drug” module was used to investigate the relationship between SENP family expression and current chemotherapy or targeted drug sensitivity of liver cancer. This section includes the Cancer Therapeutics Response Portal (CTRP) (https://portals.broadinstitute.org/ctrp/) (accessed on 01 July 2025) and the Genomics of Drug Sensitivity in Cancer (GDSC) (http://www.cancerrxgene.org/) databases [32–34]. Pearson’s correlation analysis was conducted to assess the relationship between gene mRNA expression and drug IC50. The p-value was corrected using FDR.
2.7 Functional Enrichment Analysis
LinkedOmics (http://www.linkedomics.org/) was utilized to acquire the co-expressed genes of SENP 1, 3, and 7 and their Gene Set Enrichment Analysis (GSEA) results in LIHC. Pearson’s correlation analysis was performed. Gene Ontology (GO) and Kyoto Encyclopedia of Genes and Genomes (KEGG) analyses of the co-expressed genes were performed using R (3.6.3).
HEK293T, Huh-7, and Hep-3B cell lines were maintained in our laboratory and cultured in Dulbecco’s Modified Eagle’s medium (DMEM) (Gibco, Cat#11965092, Grand Island, NY, USA) supplemented with 10% heat-inactivated fetal bovine serum (FSP500, Excell Bio, Shanghai, China) and 1% penicillin-streptomycin solution (Procell, PB180120, Wuhan, China). Cell line authentication and assessment of mycoplasma contamination were maintained using DNA fingerprinting and a PCR-based assay, respectively, in our lab. All cell lines were grown in the logarithmic growth phase at 37°C with 5% CO2 in a humidified incubator. Cells used for experiments were within 10 passages after thawing. Trypsin (Gibco, Cat#25200056 Grand Island, NY, USA), phosphate-buffered saline (PBS) (P0096, Beyotime Biotechnology, Shanghai, China), and glutamine (100×) (Gibco, Cat#25030081 Grand Island, USA) were also used in the culture process.
2.9 Lentivirus Packaging and Hepatocellular Carcinoma Cell INFECTION
shSENP1 (sh-1:5′-TACTGGAACTAAGACATCGAG-3′; sh-2:5′-CCGAAAGACCTCAAGTGGATT-3′; sh-3:5′-CGAGAAAGATTGCGCCAGATT-3′), shSENP3 lentiviral plasmid (sh-1:5′-CCTCGCTG ACATTCCACTGGA-3′; sh-2:5′-CATTGGTCCCTCATCTCTGTT-3′), and shNC (5′-TTCTCCGAACG TGTCACGT-3′) oligos into the pLKO.1-puro vector. Next, the purified shRNA and the packaging plasmids psPAX2 and pMD2.G were co-transfected into HEK293T cells for 60–72 h by using linear polyethylenimine 40 kDa (40816ES03, Yeasen, Shanghai, China) as transfection reagents for virus production. The supernatant was sterilized by filtration through a 0.22 μm membrane filter. Huh-7 and Hep-3B cells were inoculated with the aforementioned supernatant and 8 μg/mL of positively charged polybrene (TR-1003, MERCK, Burlington, MA, USA). Stable pools were selected using 2 μg/mL puromycin (Amresco, J593, Houston, TX, USA) for 5 days.
2.10 RNA Extraction and Reverse Transcription–Quantitative Polymerase Chain Reaction (RT-qPCR)
RNA was extracted following the manufacturer’s instructions for TRIzol reagent (Thermo Fisher Scientific, Cat# 15596026, Waltham, MA, USA). Subsequently, 1 μg of RNA was combined with oligo (dT) and random primers and reverse-transcribed into complementary DNA (cDNA) using the MonScript™ RTIII All-in-One Mix with dsDNase (MR05101M, Monad, Suzhou, China). The resulting cDNA was diluted and subjected to qPCR using the Dye SYBR Green qPCR Premix (G3321-15, Servicebio, Wuhan, China) on an LC480 II Real-Time PCR System (Roche, Basel, Switzerland). The qPCR primers were as follows: SENP1, forward (5′-ACTGTGGGATGTTTGCCTGCA-3′) and reverse (5′-ACAAAGAGCTGGTCCCCCACAT-3′); SENP3 forward (5′-GGGGTGAAAAGGTGGACCAA-3′) and reverse (5′-TTCTTTACCGCCTCTGCCTG-3′); β-actin, forward (5′-TCCCCCAAAGTTCACAATGTGG-3′) and reverse (5′-GAGAAGTGGGGTGGCTTTTAGG-3′). Relative mRNA expression levels were calculated using the 2−ΔΔCt method, with β-actin as the internal reference gene. All reactions were performed in triplicate, and results were expressed as the mean ± standard deviation.
After enzymatic dissociation with trypsin to obtain a single-cell suspension, 1000–2000 cells were evenly seeded into each well of 6-well plates and cultured for approximately 14 days, and the medium was changed once every 3 days. Cell clones were visible with the naked eye. Then, the cells were fixed for 10 min using 4% paraformaldehyde and stained for 20–30 min with 0.1% crystal violet. After taking photographs under a fluorescence microscope (DMi8, Leica Company, Wetzlar, Germany), we counted the cell clones using ImageJ software (National Institutes of Health, Bethesda, MD, USA).
2.12 3-(4,5-Dimethylthiazol-2-yl)-2,5-Diphenyltetrazolium Bromide (MTT) Assay
For MTT assays, the indicated cells were seeded at a concentration of 4 × 10⁴ cells/mL in 96-well plates and grown for 0 to 5 days. The cell viability was determined using the MTT test. Each well received 10 µL of MTT solution (5 mg/mL; Roche, Cat#11465007001, Switzerland) and was incubated for 4 h at 37°C. Then, supernatant was carefully removed, and the MTT-formazan crystals produced by metabolically active cells were solubilized in 150 µL of DMSO. Finally, the absorbance was measured with a SpectraMaxi3 Multi-Mode Microplate Reader (Molecular Devices, Sunnyvale, CA, USA) at a wavelength of 490 nm, following the MTT kit protocol.
To investigate the migratory capacities of SENP1 and SENP3 knockdown hepatocellular carcinoma cells, Transwell migration assays were performed using 8.0 μm pore-size membrane chambers in a 24-well plate format. Cell suspensions (2 × 10³ cells in 200 μL serum-free medium) were added to the upper chambers, while the lower chambers were filled with 600 μL of culture medium containing 10% FBS as a chemoattractant. After 24 h of incubation, migrated cells were fixed with 4% paraformaldehyde for 10 min and stained with 0.1% crystal violet for 20–30 min. Cells were then visualized under a fluorescence microscope (Leica DMi8, Leica Microsystems, Germany). Four to five fields/well were chosen and evaluated with ImageJ software.
Briefly, equal numbers of stable knockdown Huh-7 or Hep-3B cells were sown into 6-well plates and allowed to attain confluence. When the cell monolayer reached 100% confluence, several well-spanning scratches were produced using a 10-μL pipette tip, and the culture media was changed with serum-free medium to promote for “wound healing” by cell proliferation-independent migration. Cell migration was monitored at pre-marked sites below the wells with an inverted microscope (Leica DMi8, Leica Company, Germany) to assess the cells’ migratory capabilities.
All data are expressed as mean ± standard deviation (SD). Statistical analysis was performed using one-way analysis of variance (ANOVA) in GraphPad Prism version 9.0 (GraphPad Software, San Diego, CA, USA). Each experiment was independently repeated a minimum of three times. Asterisks indicate statistically significant differences compared to the control group (*p < 0.05; **p < 0.01; ***p < 0.001).
3.1 Expression of the SENP Family in Pan Cancer and LIHC
To investigate the expression level of SENP genes in cancer, we employed the TIMER2.0 database to analyze TCGA transcriptomic data, focusing on the comparison between tumor and adjacent non-tumor tissues across multiple cancer types. As illustrated in Fig. 1A, the expression level of SENP1–8 varied significantly between tumor and adjacent normal tissues across different cancer types, with certain members showing upregulation and others downregulation. Compared with adjacent tissues, SENP1–7 was significantly overexpressed in cancers, including LIHC, cholangiocarcinoma (CHOL), and esophageal carcinoma (ESCA), while SENP8 was mainly overexpressed in nine cancers, including bladder urothelial carcinoma (BLCA), breast invasive carcinoma (BRCA), and colon adenocarcinoma (COAD). Furthermore, we used the online UALCAN database to analyse and compare the protein expression levels of the SENP family from the CPTAC database in liver cancer tissues and surrounding tissues (SENP5 had no protein expression data in liver cancer). SENP1, SENP2, and SENP3 exhibited markedly higher protein levels in liver cancer tissues compared to adjacent non-tumor tissues, whereas SENP8 showed relatively low expression in tumors. (Figs. 1B and S1A). Promoter methylation often regulates gene expression. As shown in Figs. 2 and S1B–D, promoter methylation levels of SENP2, 3, and 7 were significantly reduced in patients with liver cancer, and hypomethylation may account for the high expression of SENP2, 3, and 7 in liver cancer. High SENP1 expression may not be related to the promoter methylation status of SENP1 (Fig. 2A–D).
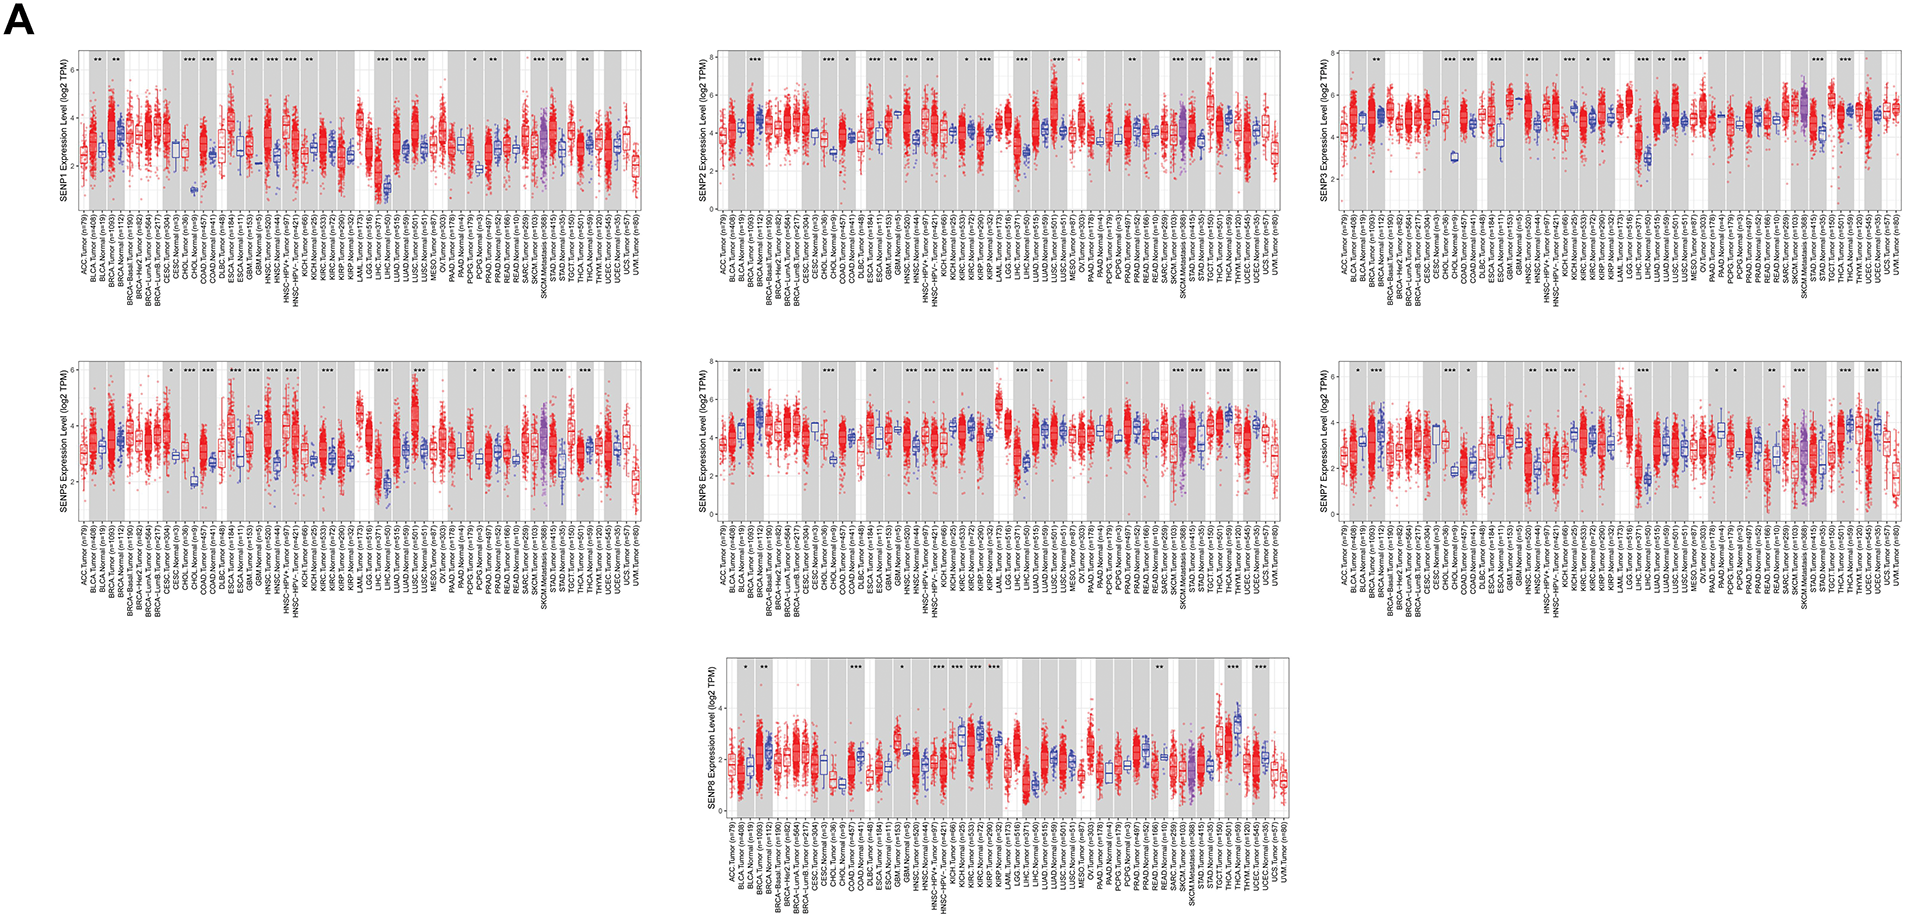
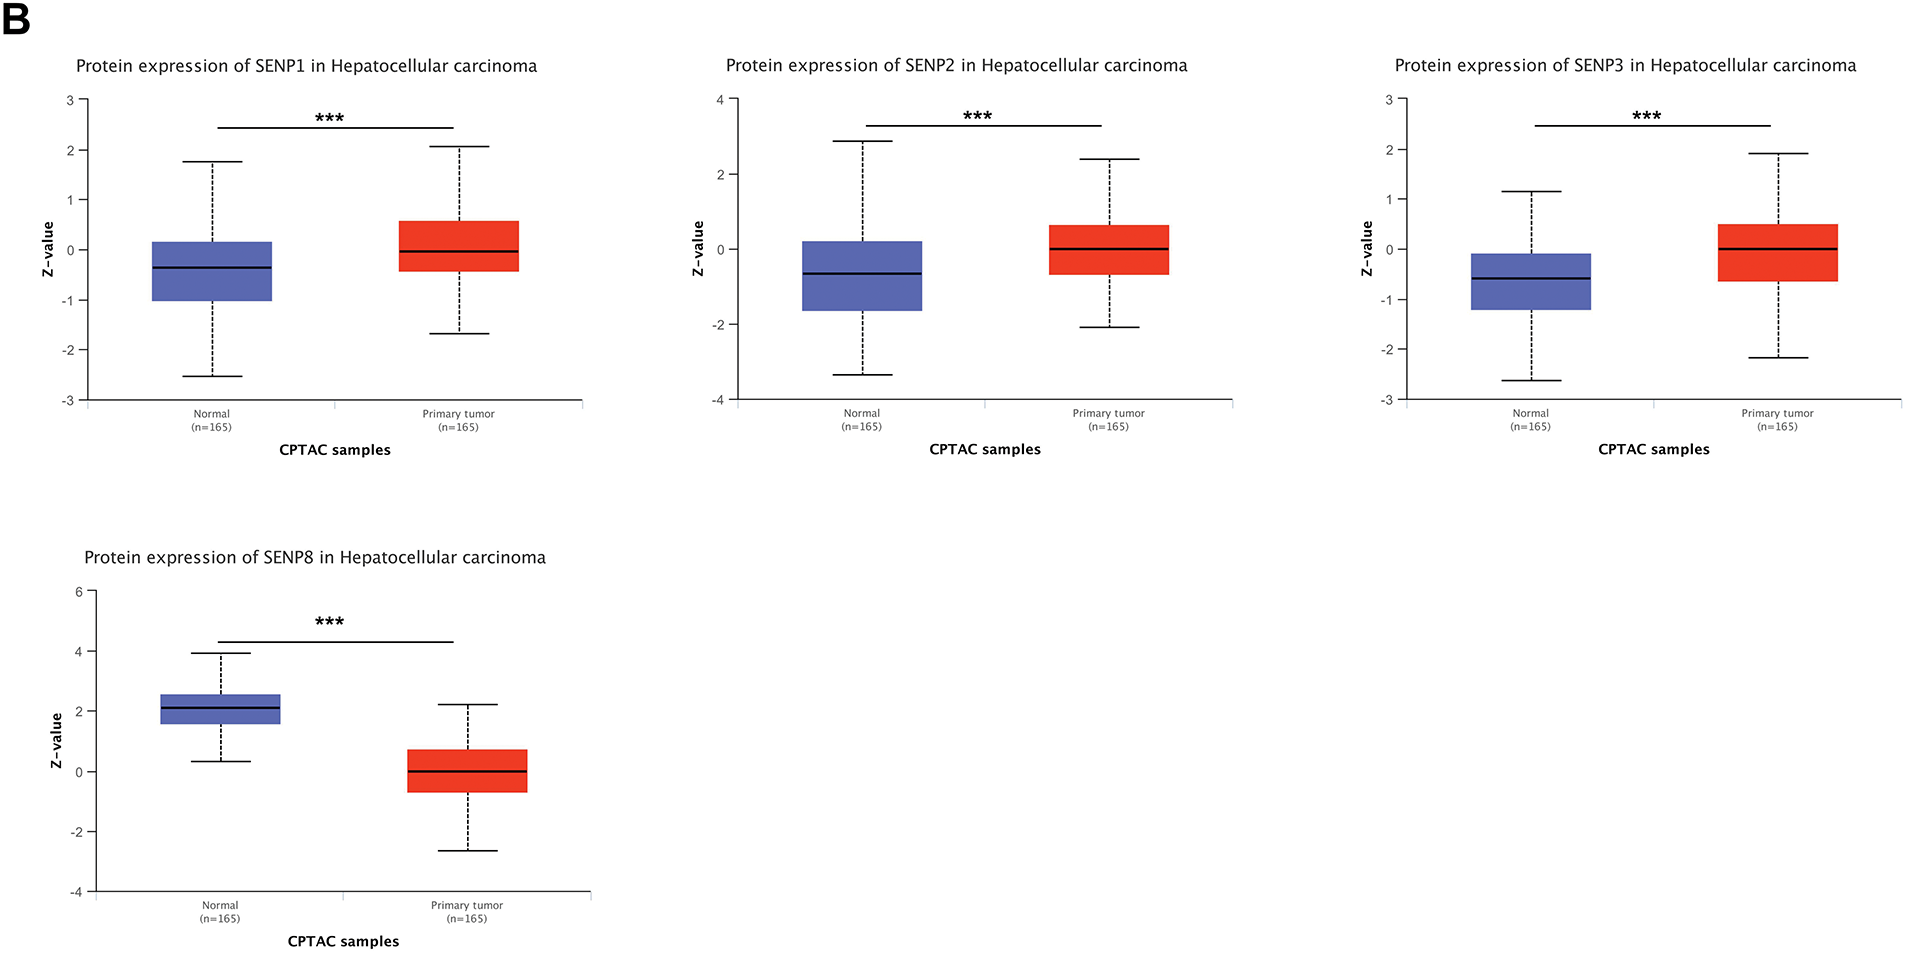
Figure 1: Expression levels of SENP family members in LIHC and adjacent normal tissues. (A) Relative mRNA expression levels of SENPs in tumor and adjacent normal tissues. (B) Protein expression levels of SENP family members in liver hepatocellular carcinoma and adjacent normal tissues. *p < 0.05; **p < 0.01; ***p < 0.001
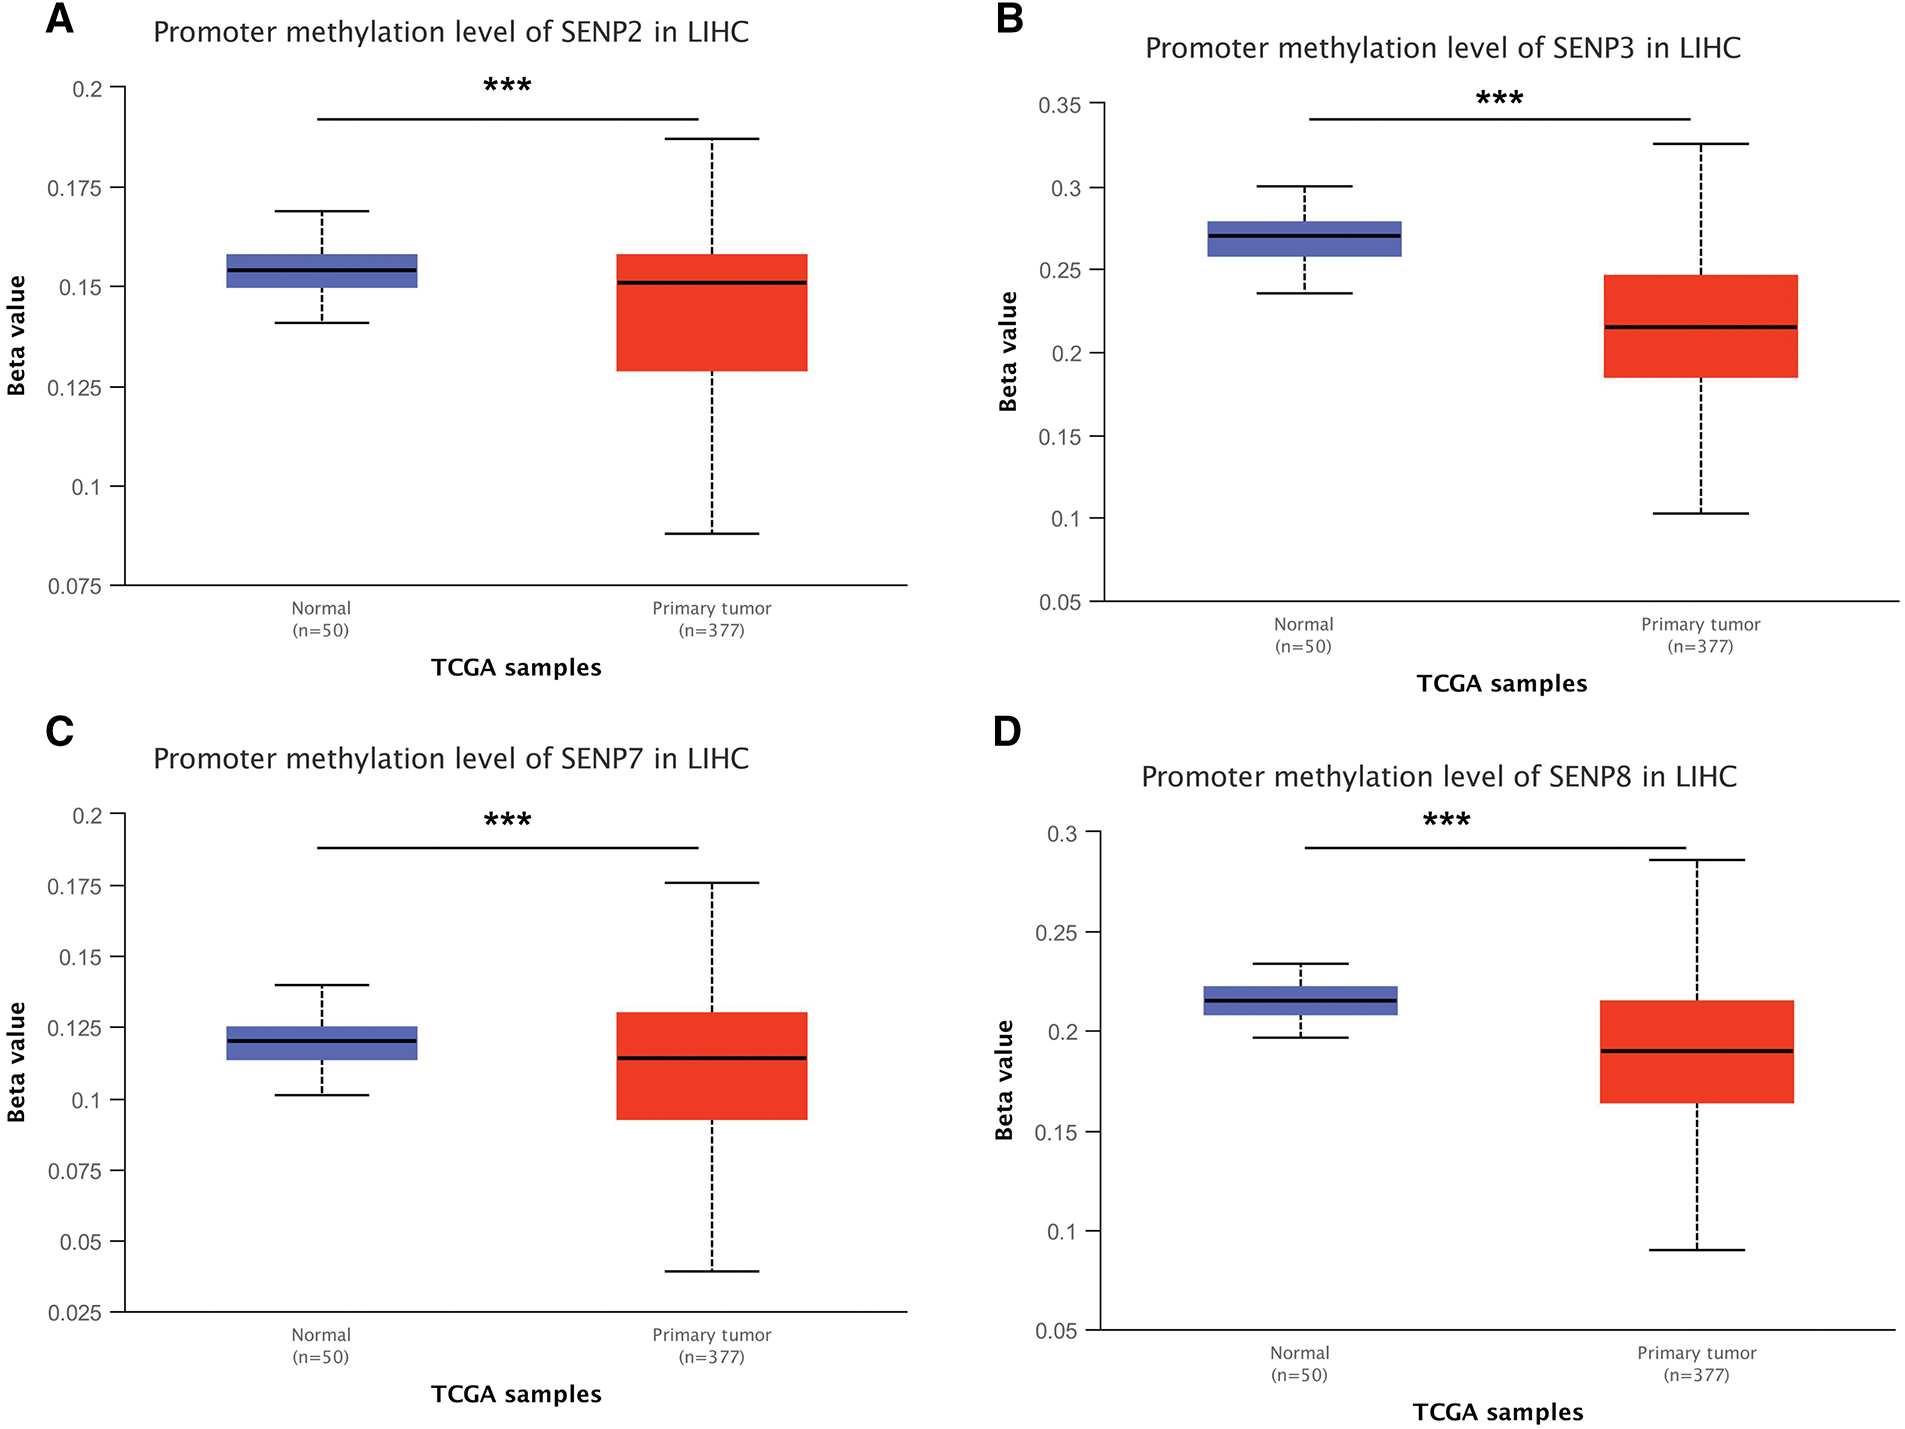
Figure 2: Promoter methylation level of the SENP family in LIHC. (A) SENP2 promoter methylation level. (B) SENP3 promoter methylation level. (C) SENP7 promoter methylation level. (D) SENP8 promoter methylation level. ***p < 0.001
3.2 Genetic Alteration of SENPs in Liver Hepatocellular Carcinoma
To investigate the SENP family’s differential expression mechanism in LIHC, we analyzed gene point mutations and chromosomal variants using the cBioPortal web tool. The gene with the highest mutation frequency was SENP6 (2.6%), followed by SENP3 (1.7%). The main types of SENP6, SENP3, and SENP1 mutations are deep deletions, missense mutations, and truncation mutations. The mutation types of SENP2 (1.6%), SENP7 (1.2%), SENP5 (1.1%), and SENP8 (0.5%) were mainly amplified and missense mutations (Fig. 3A). In another classification method, four types of gene mutations in the SENP family were found in 857 samples (10.27%) from patients with hepatocellular carcinoma, with the highest frequency of gene copy number variation (CNV) (5.6%), followed by 2.68% amplification, 2.92% deletion, and 4.43% mutation. Amplification (0.55%) and mutations (2.76%) were mainly found in hepatocellular carcinoma and intrahepatic cholangiocarcinoma. However, the mutation rate in the hepatocellular adenomas was low (Fig. 3B). According to the analysis of CNV on the GSCA website, the SENP family mainly had heterozygous CNV, and SENP3 had the highest incidence of CNV, mainly heterozygous deletions (58.11%). The percentages of heterozygous amplification and deletion in other members were similar (Fig. 3C,D). As for homozygous CNV, SENP1 and 3 did not have homozygous amplification, and homozygous deletion only occurred in SENP3 and 6 (Fig. 3E). Of note, the examination of the link between CNV and patient survival revealed that the occurrence of CNV in SENP3 was positively correlated with shorter disease-free interval (DFI), disease-specific survival (DSS), OS, and progression-free survival (PFS) in patients with LIHC (Fig. 3F). In conclusion, genetic alterations may have a significant impact on SENP3 expression but not on SENP1 expression in LIHC.
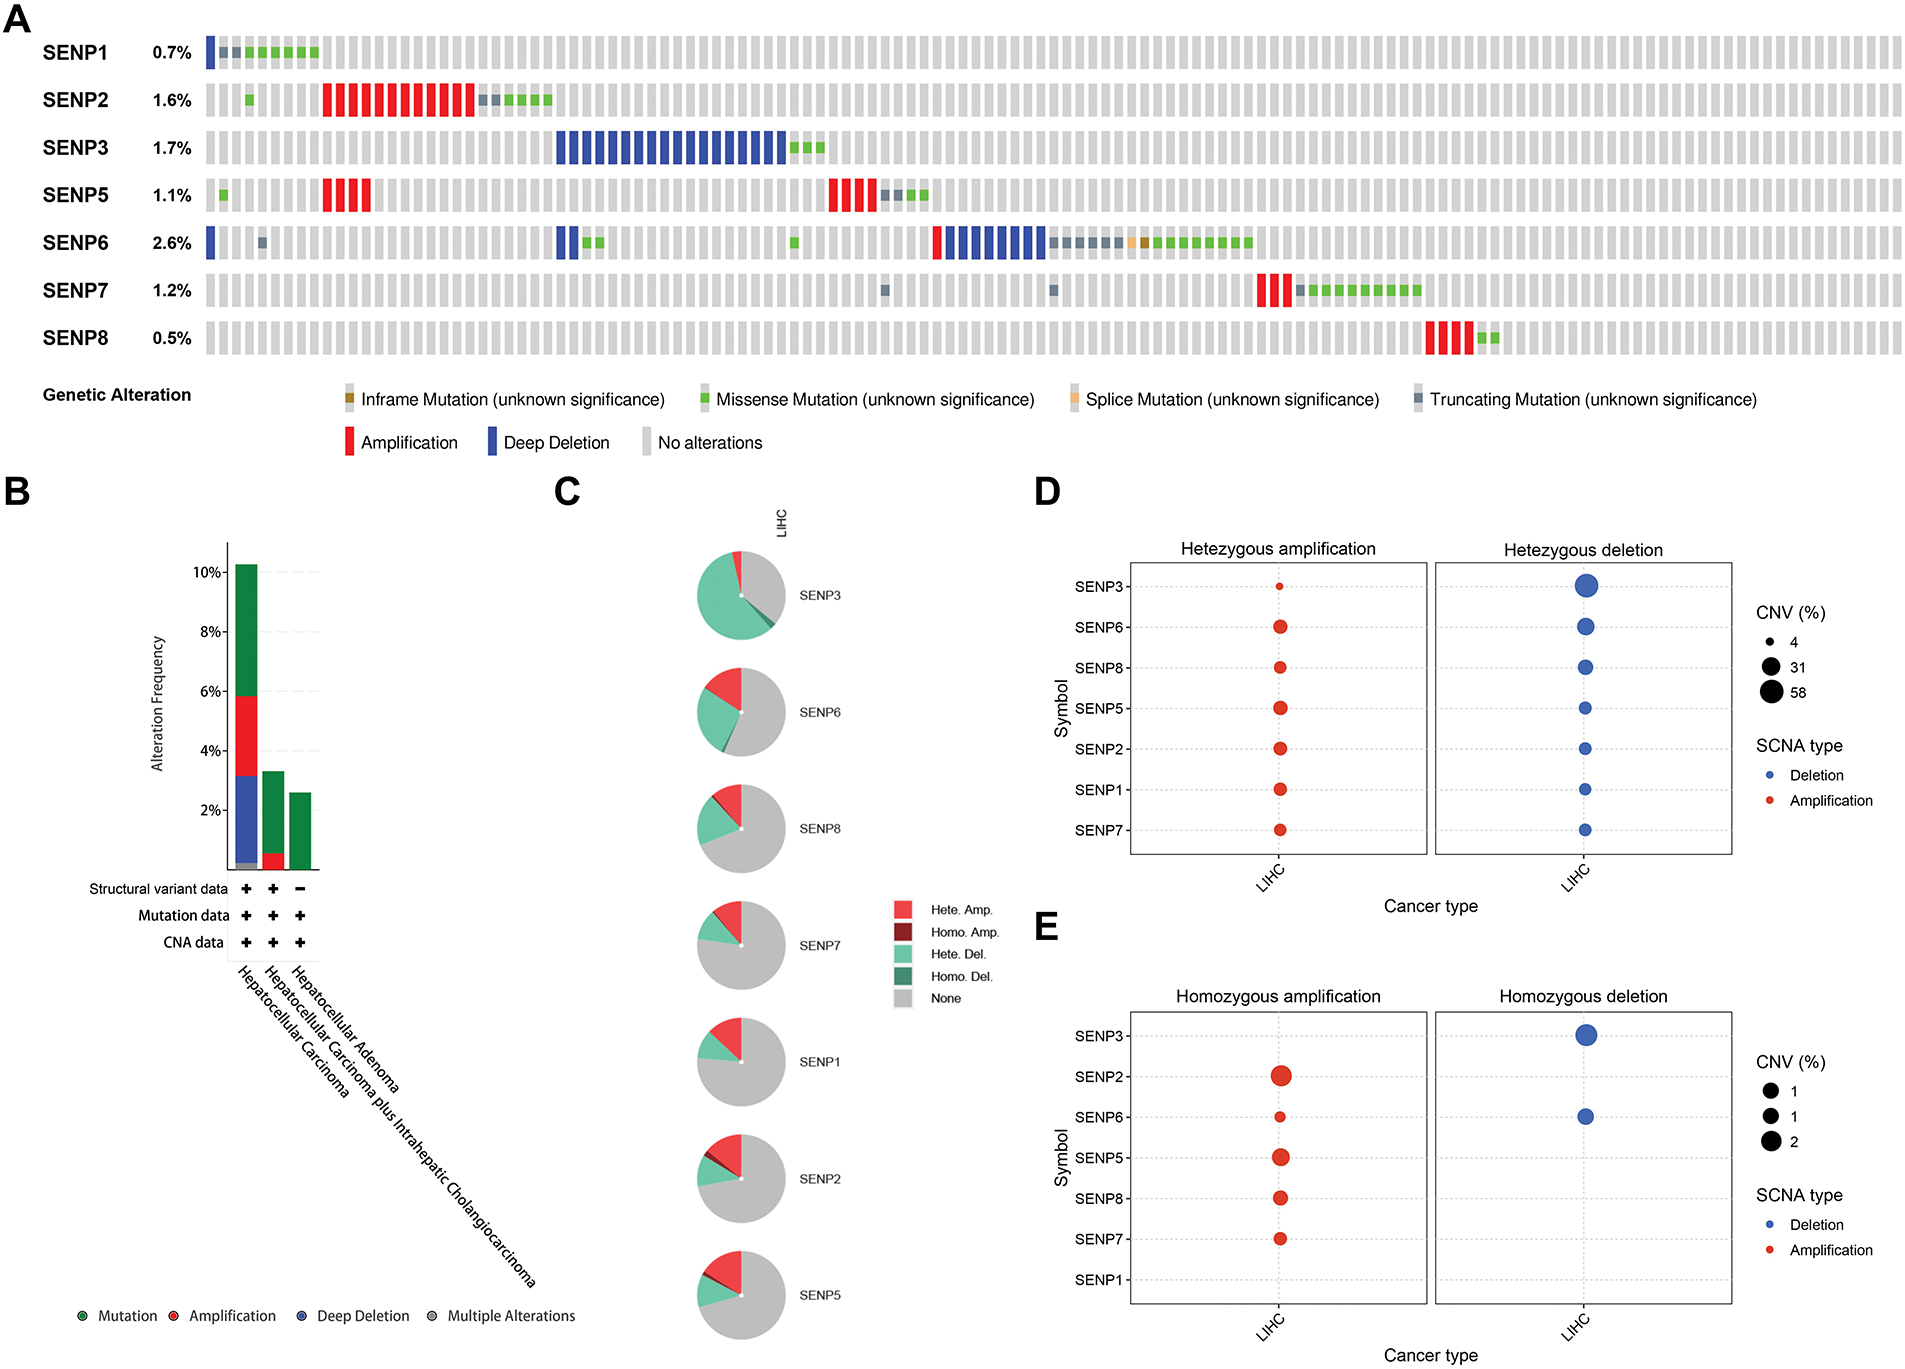
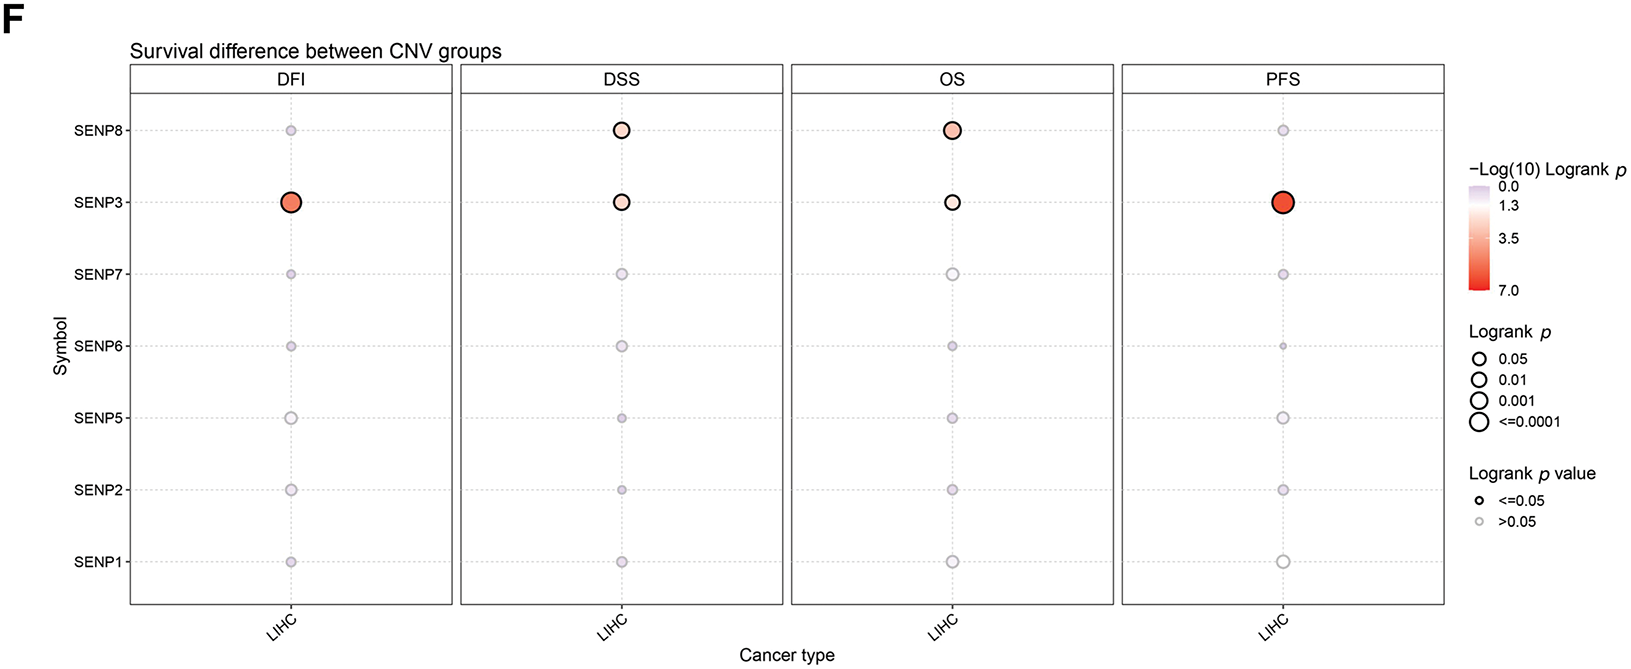
Figure 3: The genetic alterations of SENPs in LIHC. (A) The genetic alterations of SENPs in LIHC. (B) The global percentage showed genetic alterations of SENPs in different liver cancer types detailed based on the cBioprotal website. (C) Pie plots showed the percentage distribution of SENPs’ Heterozygous and Homozygous CNV in LIHC. (D) Bubble plot showing the frequency of heterozygous CNVs in SENP genes in liver cancer, with amplifications indicated in red and deletions in blue. Bubble size reflects the percentage of alterations. (E) Bubble plot showing the frequency of homozygous CNVs in SENP genes in liver cancer, with amplifications indicated in red and deletions in blue. Bubble size reflects the percentage of alterations. (F) Survival differences between wild-type and CNV of SENPs
3.3 Association between SENP Family Expression and Clinical-Pathological Features and Prognosis in LIHC Patients
The above expression and genomic analyses strongly suggest that dysregulated SENPs might be critically involved in cancer. The results of the receiver operating characteristic (ROC) curve indicated that SENP3 had the highest predictive ability (AUC = 0.901, CI = 0.863–0.939). Followed by SENP1 (AUC = 0.863, CI = 0.823–0.903), SENP2 (AUC = 0.776, CI = 0.730–0.822), SENP5 (AUC = 0.855, CI = 0.814–0.896), SENP6 (AUC = 0.702, CI = 0.649–0.755), SENP7 (AUC = 0.778, CI = 0.731–0.825) also had a certain accuracy, while SENP8 had a low accuracy (AUC = 0.539, CI = 0.475–0.603) (Fig. 4). These findings underscore the promise of SENP1 and SENP3 as indicators and predictive markers for LIHC.
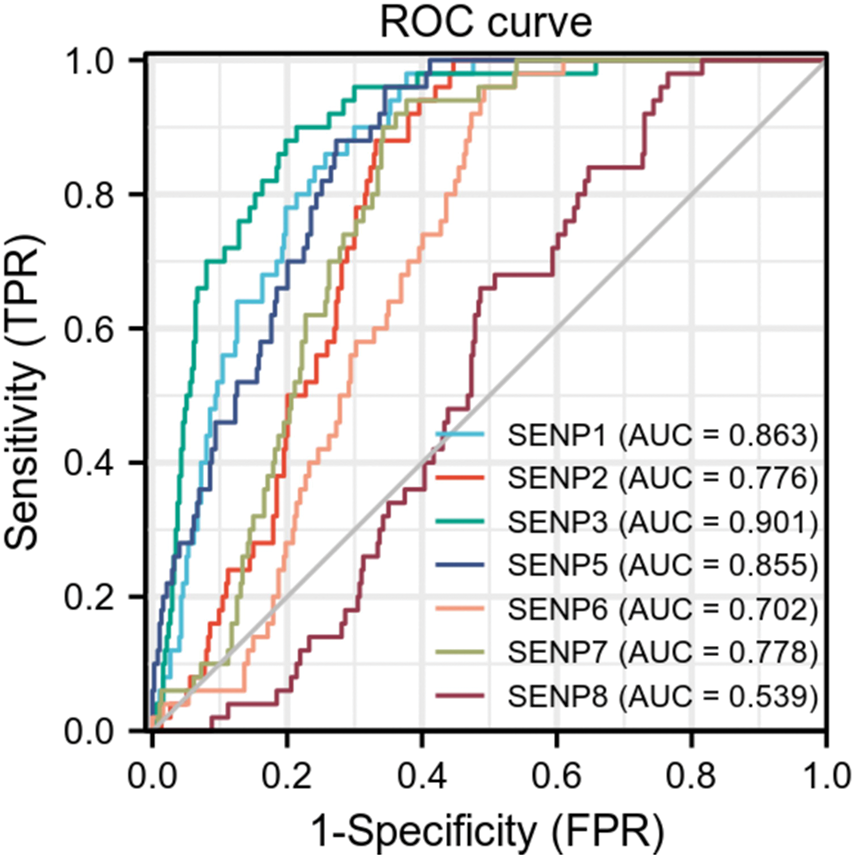
Figure 4: The ROC curves of the SENP family in liver hepatocellular carcinoma
To further investigate the relationship between SENP family member expression levels and clinical factors, GEPIA2 was used to examine the impact of SENP family members on the OS of cancer patients in the TCGA database (Fig. 5A). High expression of SENP1, 3, and 7 was shown to be mostly linked to poor OS in cancer patients. High SENP1 expression was linked to a lower OS in patients with adrenocortical carcinoma (ACC), kidney renal papillary cell carcinoma (KIRP), LIHC, and thyroid carcinoma (THCA), but a better prognosis in patients with kidney renal clear cell carcinoma (KIRC). High SENP2 expression improved the OS of KIRC patients. High SENP3 expression was linked to a poor prognosis in patients with BLCA, CHOL, LIHC, mesothelioma (MESO), and sarcoma (SARC), whereas it was associated with favorable outcomes in those with pancreatic adenocarcinoma (PAAD). SENP5 was not associated with OS. High expression of SENP6 was beneficial to the prognosis of patients with LIHC. The high expression of SENP7 was related to shorter OS of patients with COAD and LIHC. High expression of SENP8 was related to longer OS in patients with COAD and KIRC. In general, SENP1, 3, and 7 had a greater impact on the OS of patients with LIHC (Fig. 5A). Kaplan-Meier Plotter analysis revealed that the upregulated expression of SENP1, 3, and 7 was positively correlated with shorter OS in patients with LIHC at different time periods (Fig. 5B). The results indicate that in SENP family membranes, only SENP1, 3, and 7 are potentially valuable biomarkers and prognostic factors for LIHC.
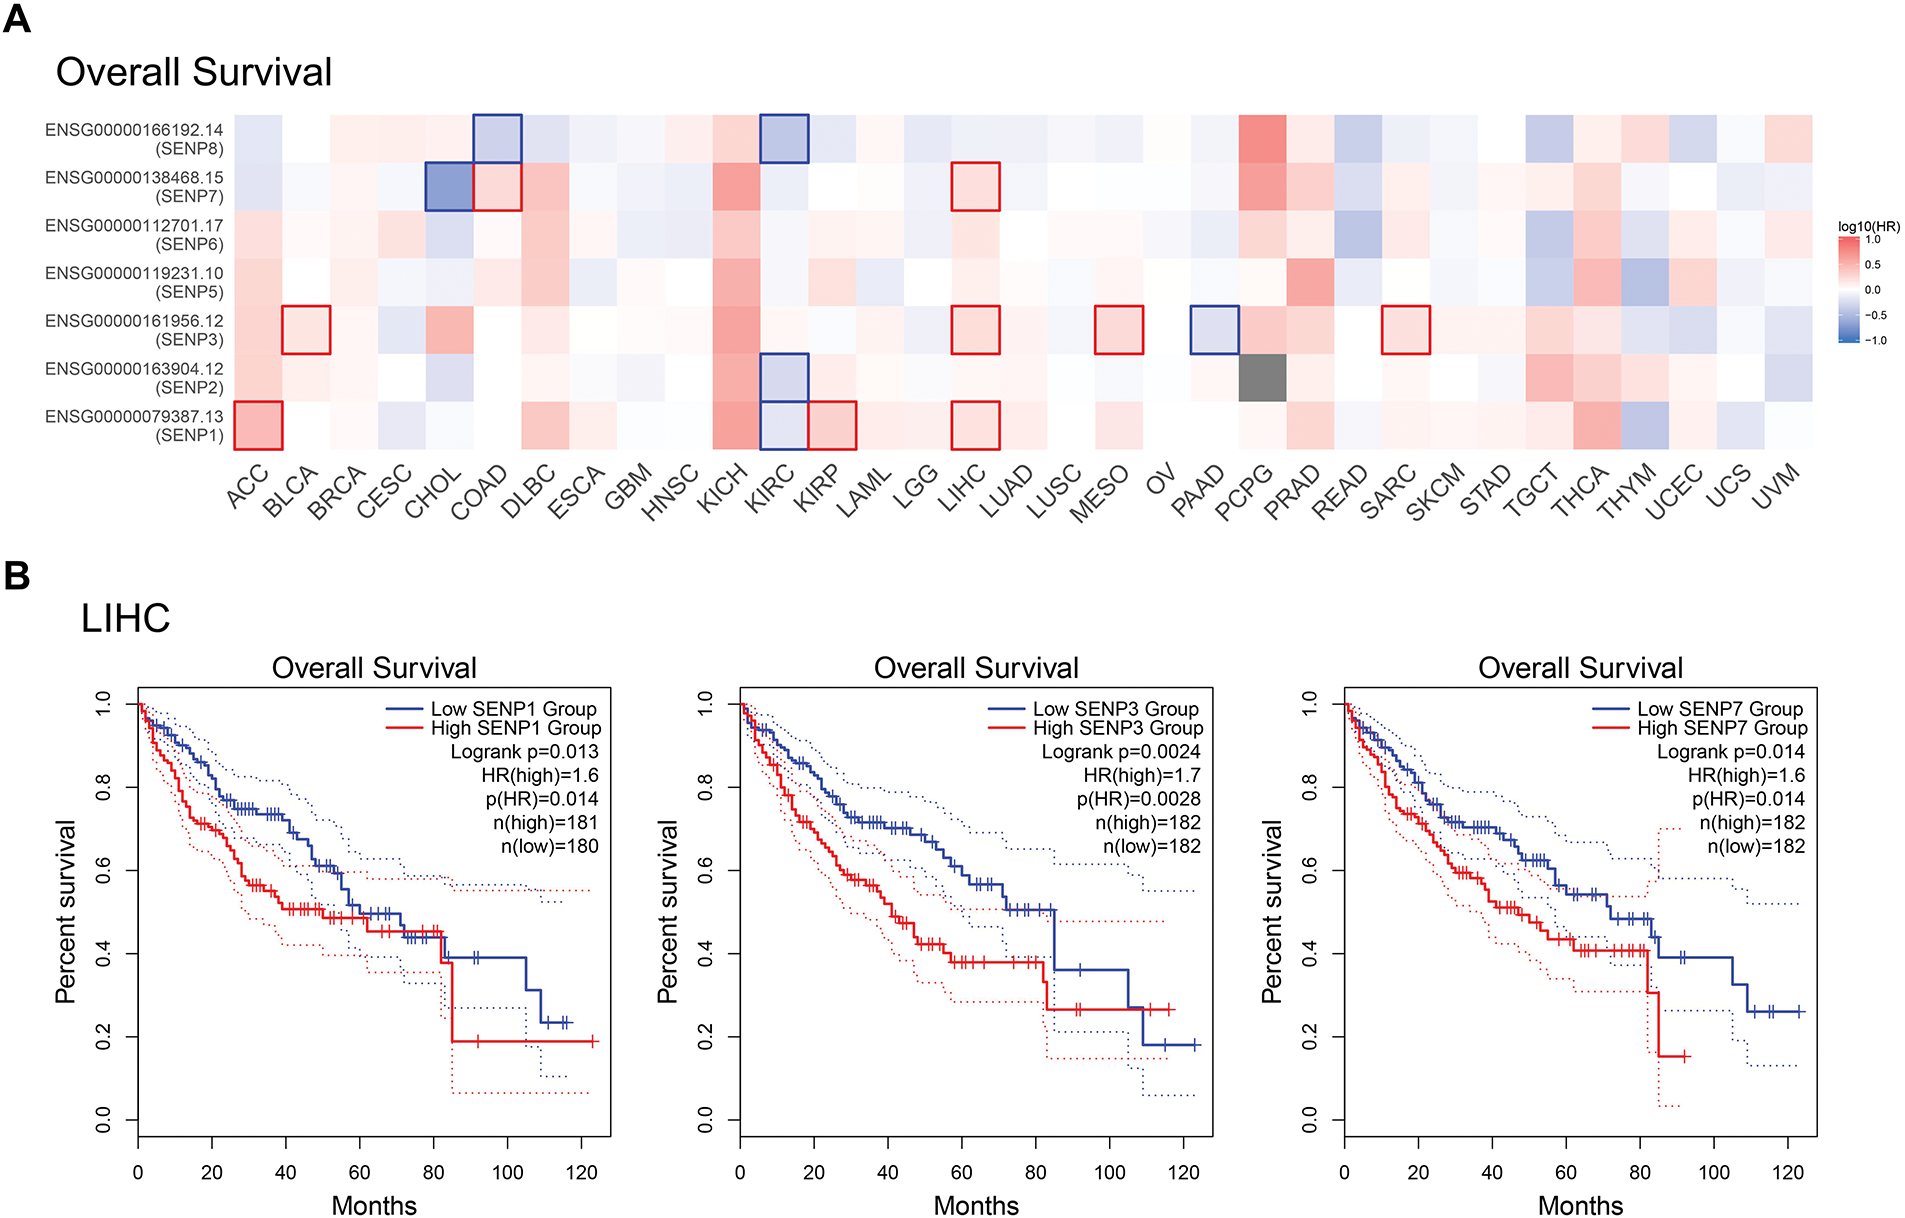
Figure 5: Correlation between SENP family gene expression and OS in patients with LIHC. (A) Survival map of Hazardous Ratio of SENP family. (B) Kaplan–Meier survival curves illustrating the relationship between SENP expression levels and OS. Only curves with statistically significant associations are shown
We also investigated the connection between SENP family expression and clinical factors such as age, sex, tumor grade, tumor stage, TP53 status, and metastasis in patients with liver cancer. The results indicated that only SENP6 and 7 mRNA expression levels had a certain degree of correlation with the age of patients with liver cancer (Fig. 6A). Only SENP7 mRNA expression was associated to sex in liver cancer patients (Fig. 6B). In other words, SENP1 and 3 are more useful general biomarkers and prognostic factors than SENP7 for LIHC to exclude the influence of age and sex.
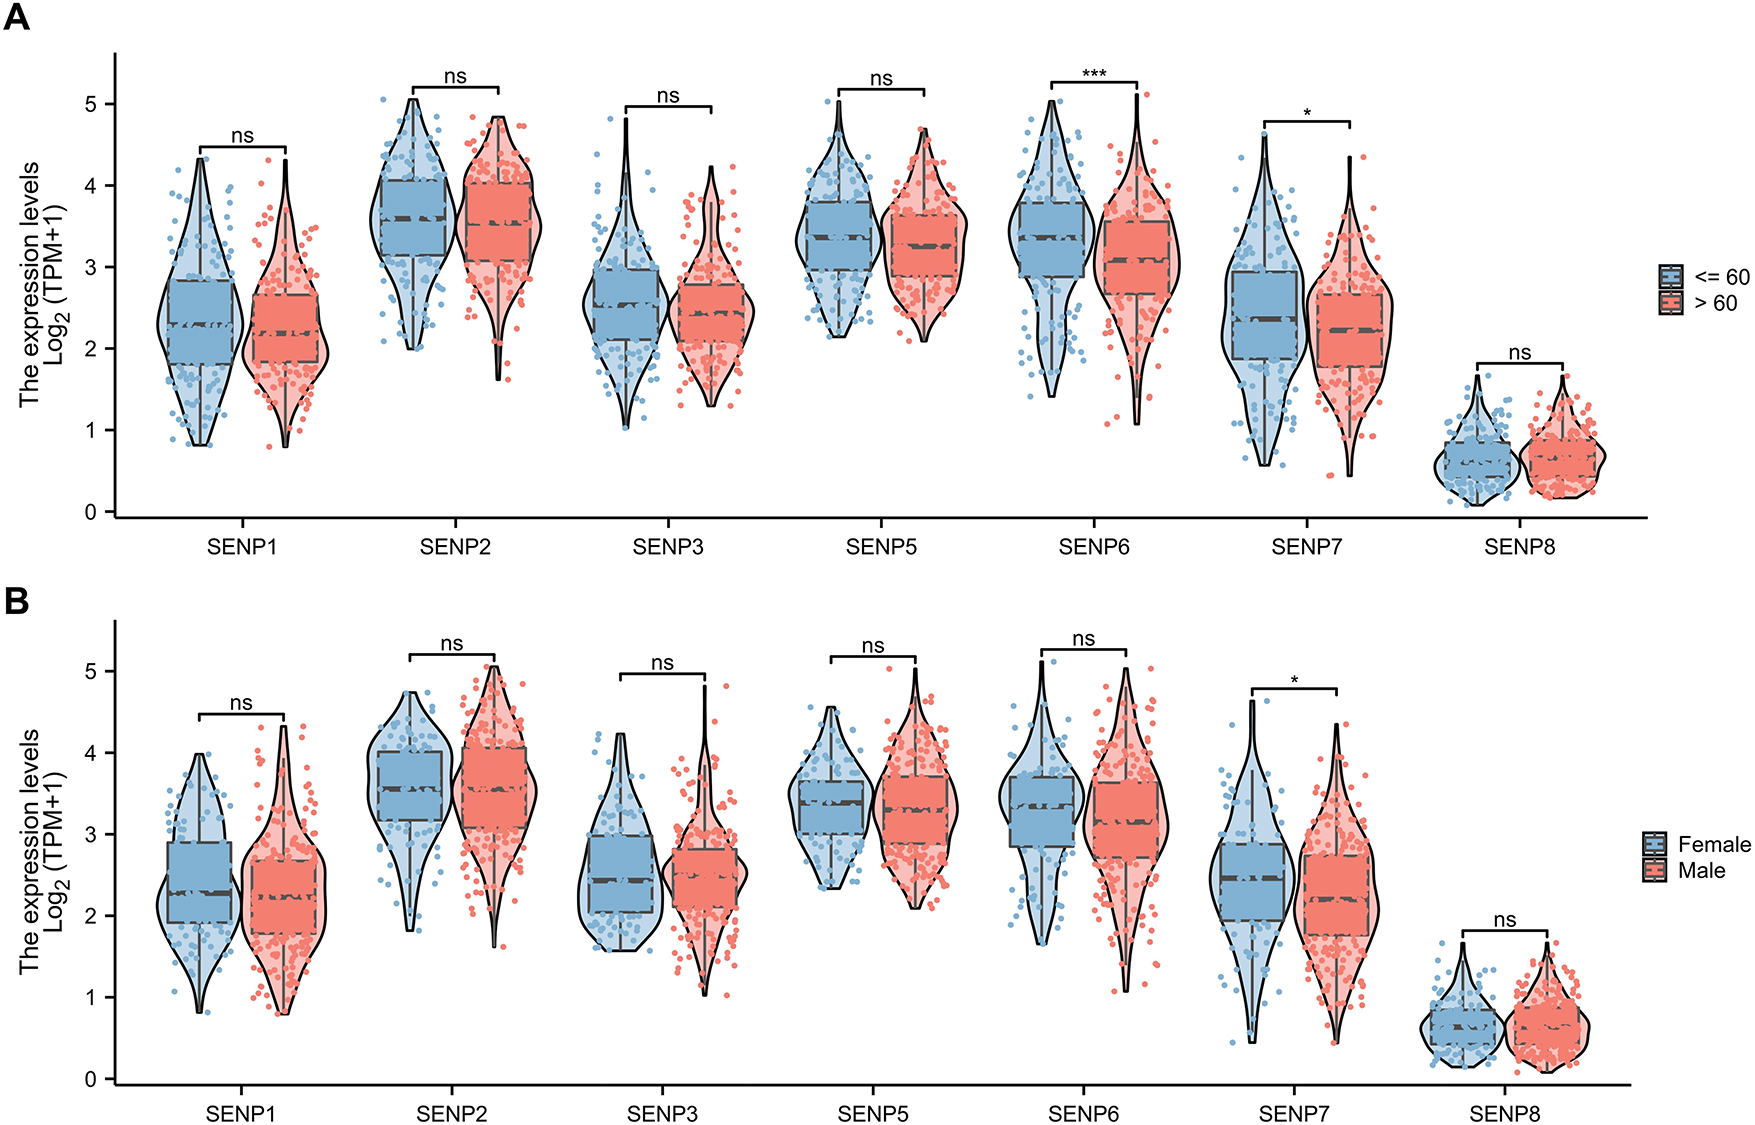
Figure 6: The violin plot of mRNA expression of SENPs in liver cancer patients of different ages and sexes. (A) The violin plot of mRNA expression of SENP family in liver cancer patients of different ages. (B) The violin plot of mRNA expression of SENP family in liver cancer patients of different sexes. *p < 0.05; ***p < 0.001; ns p > 0.05
Analyzing the expression of SENPs based on the grade of liver cancer, we found that the expression of SENP1–7 (except SENP8) was strongly positively linked with the grade (Figs. 7A and S2A). Based on stage analysis, the results indicated that the expression levels of SENP1, 3, 5, 6, 7, and 8 (except SENP2) in patients with stage 3 disease were considerably greater than those in patients with stage 1 disease (Figs. 7B and S2B). These results demonstrate that SENP1, 3, and 7 are potential biomarkers and prognostic factors for the development and progression of LIHC.
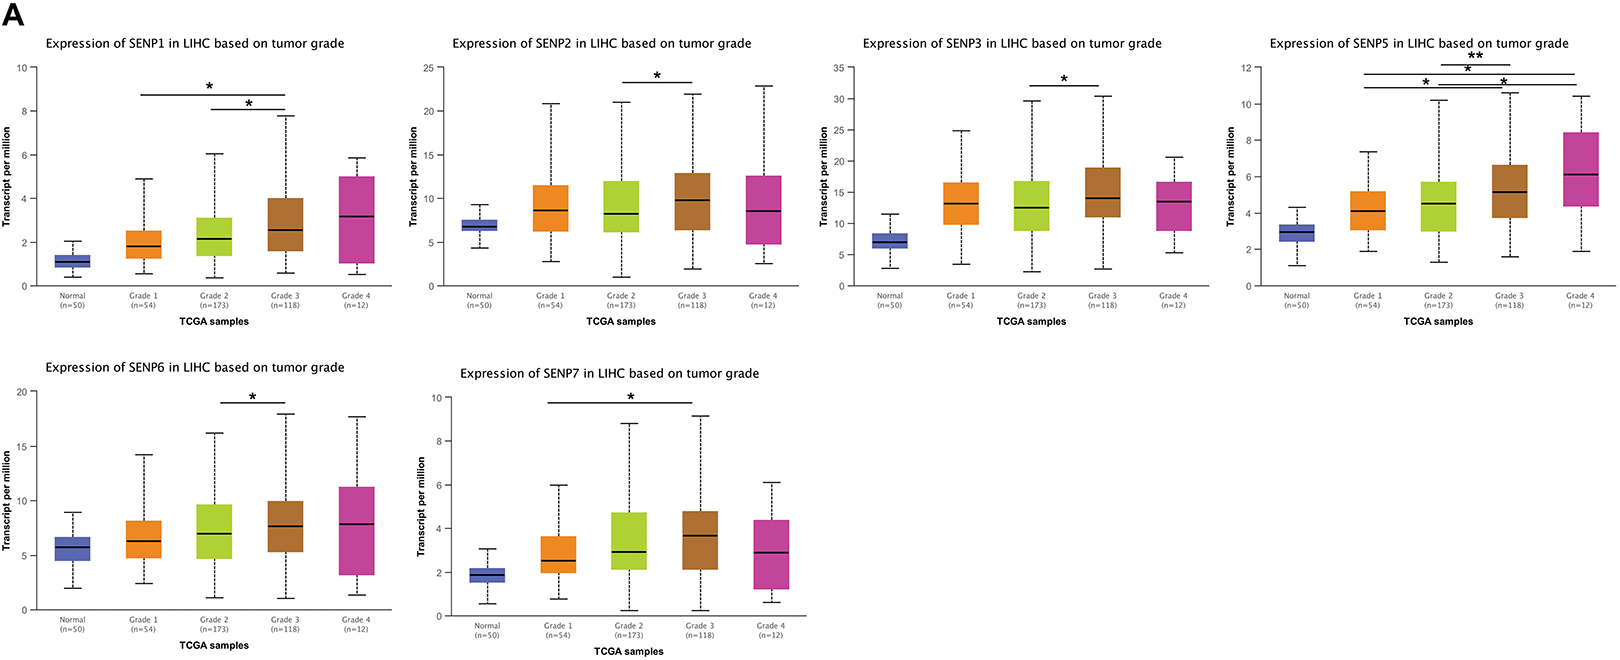
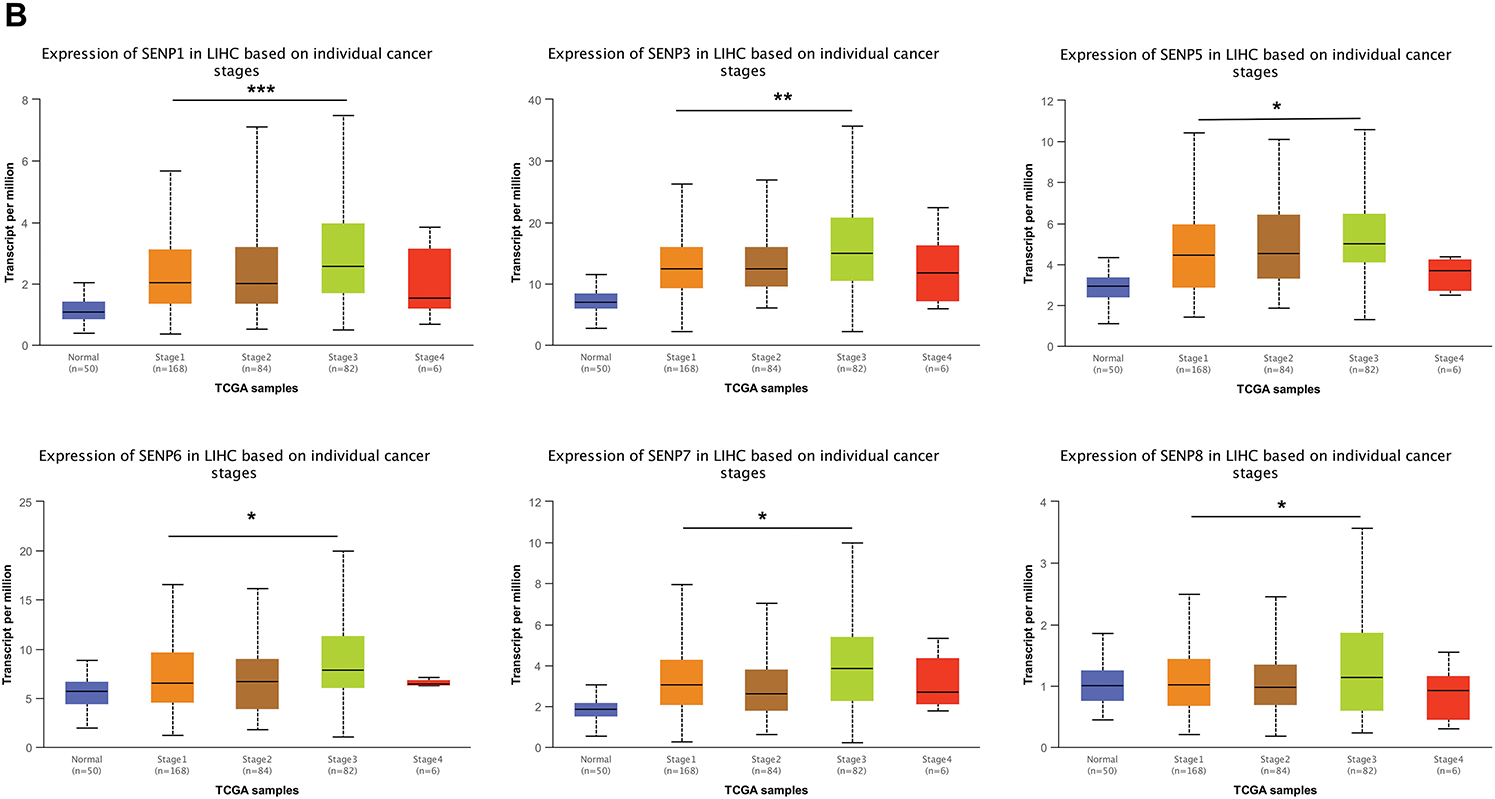
Figure 7: The box plots of expression of SENPs in liver cancer patients of different grades and stages. (A) The expression of SENPs in liver cancer patients of different grades. (B) The expression of SENPs in liver cancer patients of different stages. *p < 0.05; **p < 0.01; ***p < 0.001
TP53 mutations contribute to cancer malignancy and metastasis [35]. TP53 mutations in LIHC are related to worse clinicopathological characteristics [36]. Patients with liver cancer from the TCGA database were classified into TP53 non-mutation and mutation groups. The results showed that, except for SENP3 and 8, other members’ expression was higher in patients with TP53 mutations (Figs. 8A and S2C). The expression of SENPs was analyzed based on lymph node metastasis. Compared with N0 patients, patients with N1 liver cancer had significantly higher expression of SENP1, 5, and 6 (Figs. 8B and S2D). In summary, SENP1, but not SENP3 or SENP7, was positively correlated with TP53 mutations and metastasis in LIHC patients. SENP1 is a better biomarker and prognostic factor than SENP3 for predicting the degree of malignancy in LIHC.
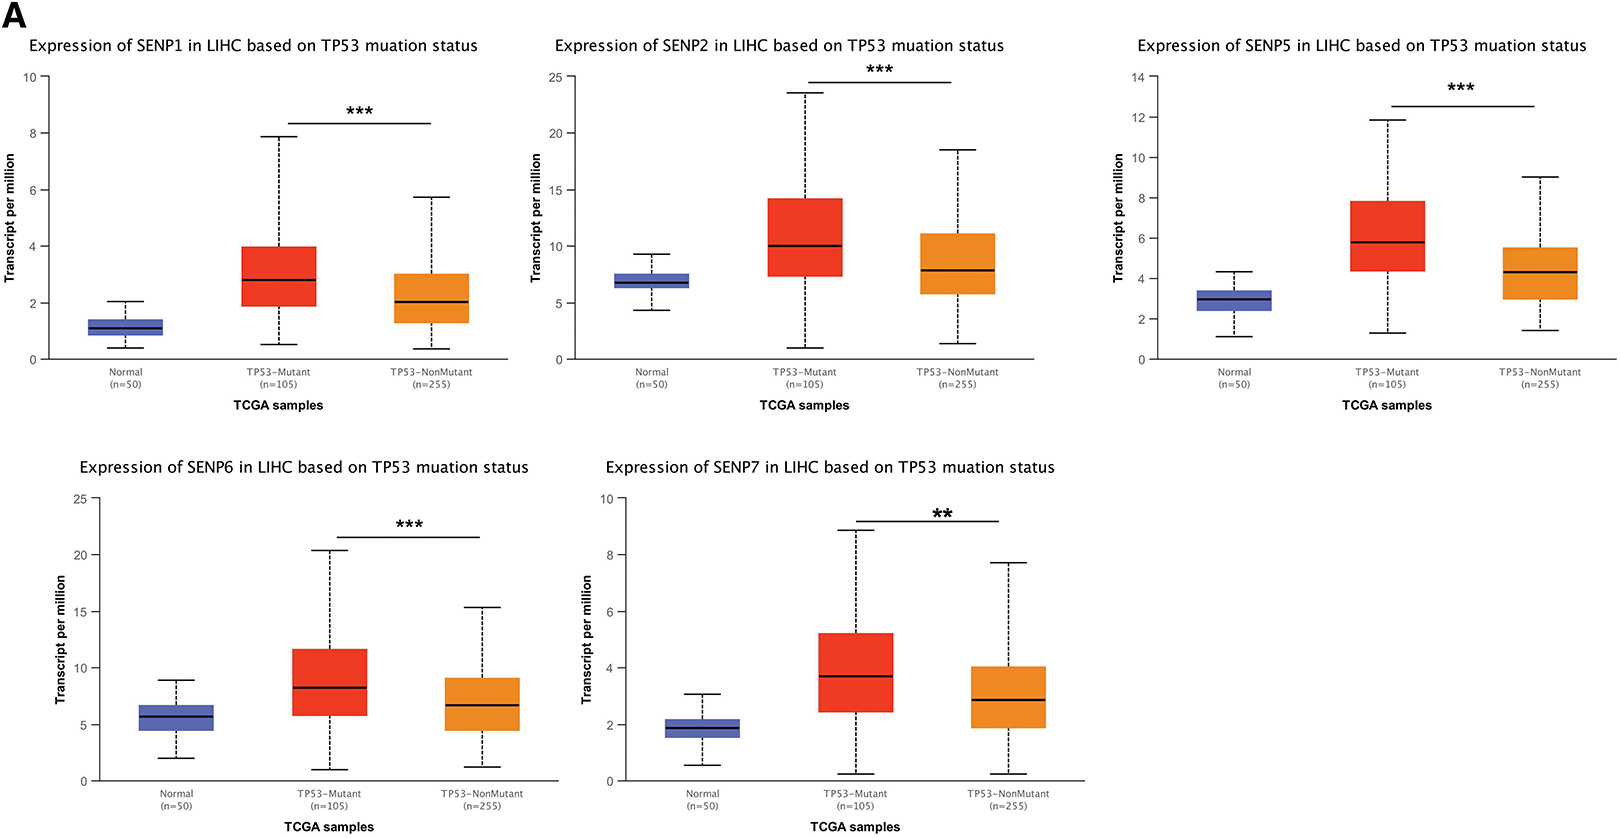
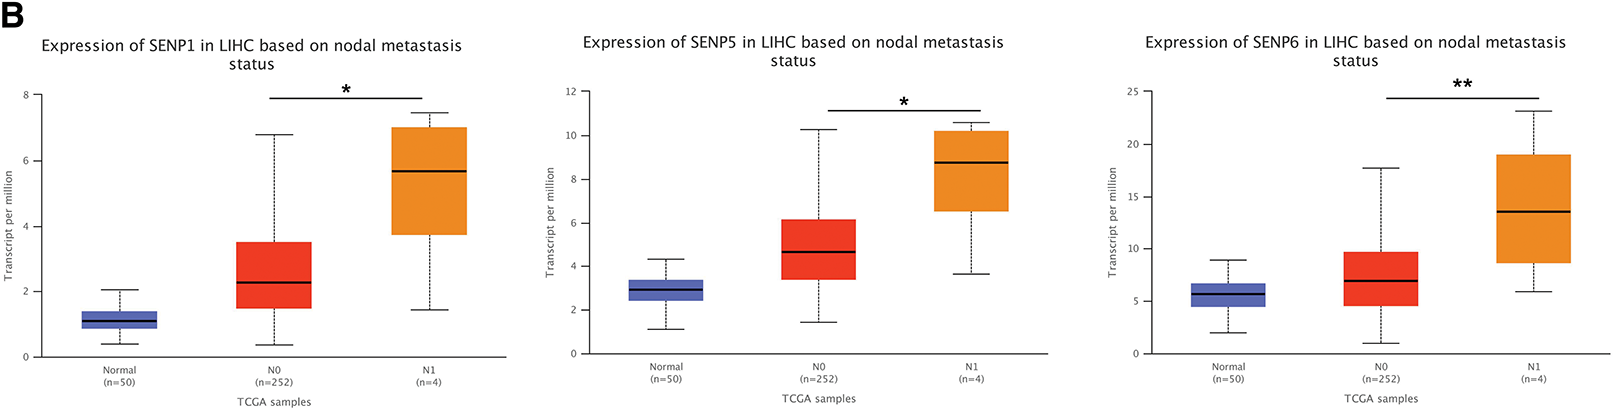
Figure 8: The box plots of expression of SENPs in liver cancer patients of different TP53 mutation status and lymph node metastasis. (A) The expression of SENPs in LIHC based on TP53 mutation status. (B) The expression of SENPs in LIHC based on nodal metastasis status. *p < 0.05; **p < 0.01; ***p < 0.001
3.4 Association of SENP Family Expression with Tumor-Infiltrating Immune Cells, Signaling Pathways, and Drug Sensitivity in LIHC Patients
The tumor consists of altered cells, stroma, and immune-infiltrating cells. Tumor infiltrating cells have anti-tumor or tumor-promoting properties. To determine whether the SENP family genes impact tumor immune infiltration and the microenvironment in LIHC, the correlation between SENP family expression and tumor-infiltrating immune cell populations was further examined. The results revealed that greater expression of SENP1, 2, 5, 6, 7 was mostly associated with the increased infiltration of TH2 cells, T helper cells, Central Memory T cell (Tcm), and eosinophils, and was negatively related to dendritic cells (DC) and cytotoxic cells. The upregulated expression of SENP3 was mainly positively related to the increased infiltration of T follicular helper (TFH) cells, NK CD56bright cells, and TH2 cells, and negatively related to Th17 and DC. SENP8 was positively linked to Tcm and negatively associated with plasmacytoid dendritic cells (pDC) and NK CD56 bright cells (Fig. 9A). SENP1–3 and SENP5–7 might be related to immunosuppression, while SENP8 is mainly related to the immune promotion of liver cancer, suggesting that SENP1, 3, and 7 are potential immune infiltration-related biomarkers in LIHC. In addition, we explored the involvement of SENP family members in immune checkpoint regulation. Expression profiles of nine key immune checkpoint-related genes—including CD274, CTLA4, HAVCR2, IDO1, LAG3, PDCD1, PDCD1LG2, SIGLEC15, and TIGIT—were obtained for correlation analysis. Notably, SENP1, SENP5, and SENP6 showed strong associations with the expression of these immune checkpoint genes. (Fig. 9B).
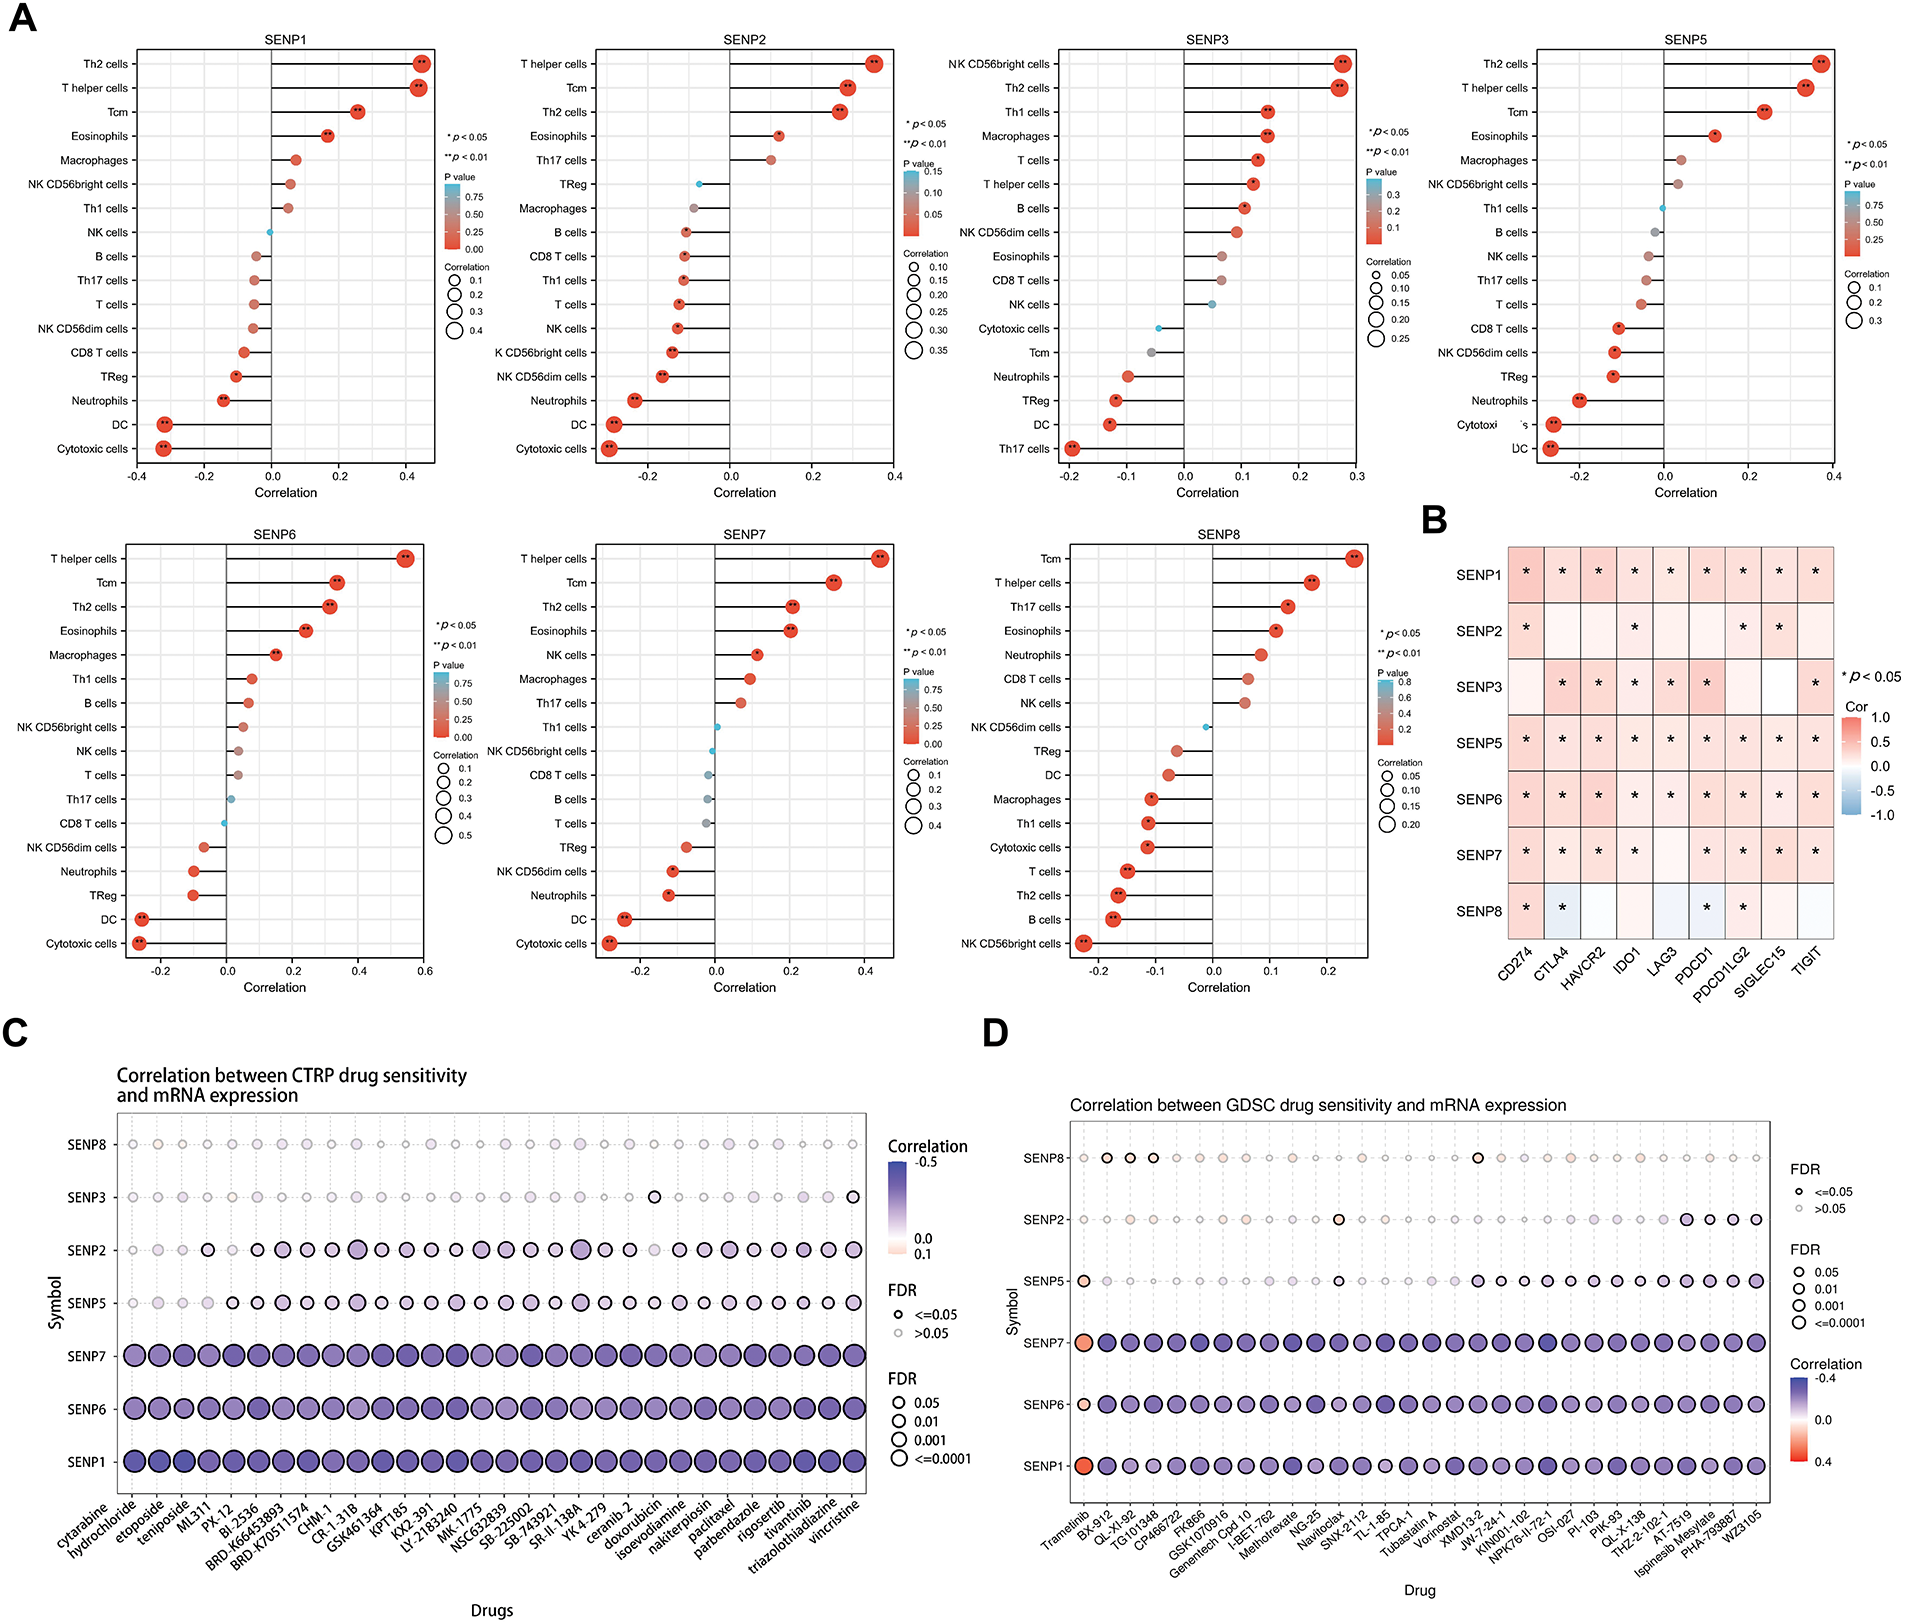
Figure 9: Associations between SENP gene expression and immune cell infiltration, immune checkpoint genes, signaling pathways, and drug sensitivity in liver cancer. (A) Lollipop plot illustrating the associations between SENP gene expression and the levels of tumor-infiltrating immune cells. (B) The correlation heatmap between SENP family expression and immune-checkpoint-associated gene expression. (C,D) Correlation between SENP gene expression and drugs sensitivity in CTRP (C) and GDSC (D) dataset. Blue bubbles indicate negative correlations, while red bubbles indicate positive correlations. Color intensity reflects the strength of the correlation, with darker shades representing higher values. Bubble size is proportional to FDR. The black outline frame indicates FDR ≤ 0.05
Next, we used the CTRP (Fig. 9C) and GDSC (Fig. 9D) databases to investigate the connection between SENP family gene expression and the sensitivity of current chemotherapeutic treatments for liver cancer. The results revealed that the expression levels of SENP1, 6, and 7 were negatively correlated with sensitivity to liver cancer chemotherapy (Fig. 9C,D). Collectively, these results show that SENP1, 3, and 7, especially SENP1, are helpful in predicting immune and chemical drug sensitivity in LIHC.
3.5 Enrichment Analysis of SENP1, 3 and 7 Co-Expressed Genes in Patients with LIHC
To explore the possible biological functions of SENP1, 3, and 7, the genes co-expressed with SENP 1, 3, and 7 in liver cancer were obtained from the LinkedOmics database (Fig. 10A). GO analysis was used to investigate the putative roles of SENP 1, 3, and 7 in the onset and progression of liver cancer. Regarding SENP1, the results showed that the biological process (BP) terms were mainly enriched for “covalent chromatin modification” and “histone modification”. The enriched cellular component (CC) keywords mostly included “Respiratory chain complex” and “Mitochondrial protein complex”. The enriched molecular keywords mostly included “DNA-dependent ATPase activity” and “histone binding”. KEGG pathway analysis was mainly related to the terms “Oxidative phosphorylation”. To gain a deeper understanding of the regulatory relationships of SENP1 on various pathways, we performed GSEA analysis. The results of GSEA showed that SENP1 activated DNA replication and downregulated the mitochondrial respiratory chain complex assembly (Fig. 10B). Similarly, SENP3 co-expressed genes predominantly enriched in “mRNA decay”, “ribosome”, and “translation initiation” (Fig. 10C). SENP7 co-expressed genes predominantly enriched in “Mitochondrial ATP synthesis coupled electron transport”, “Ribosome” and “beta-Catenin-TCF signaling” (Fig. 10D). Based on the above data, we determined that SENP1, 3, and 7 are involved in a variety of biological processes in liver cancer and participate in the development and progression of LIHC.
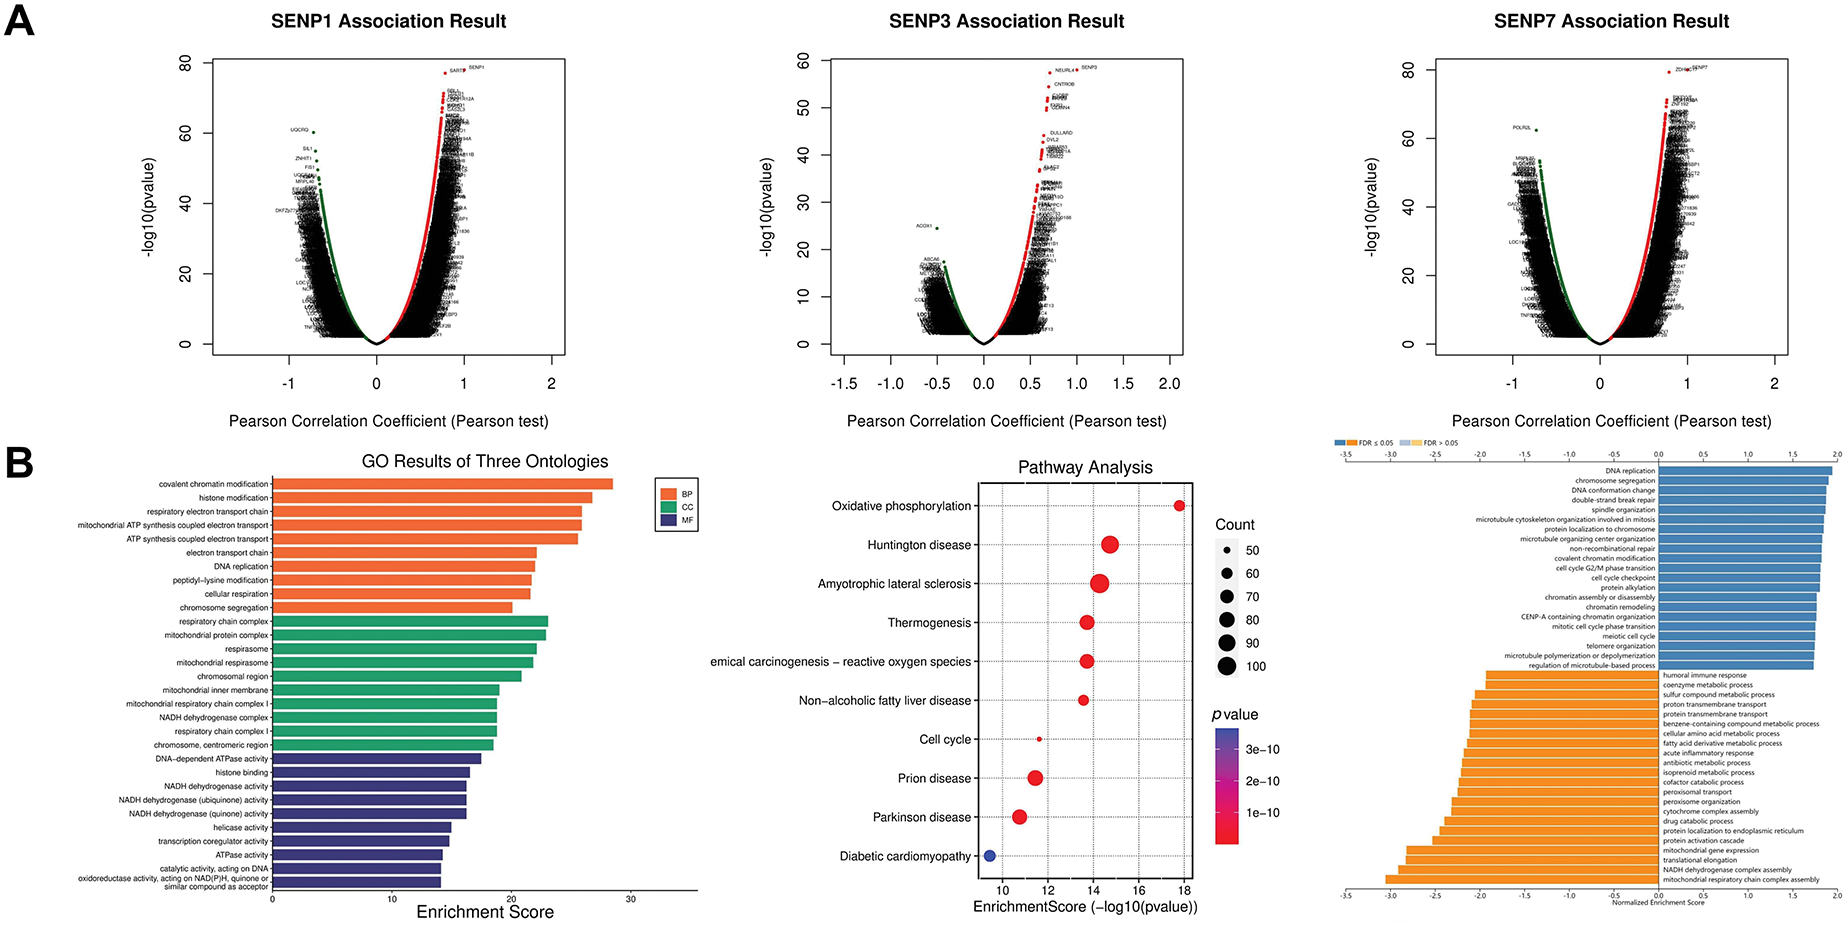
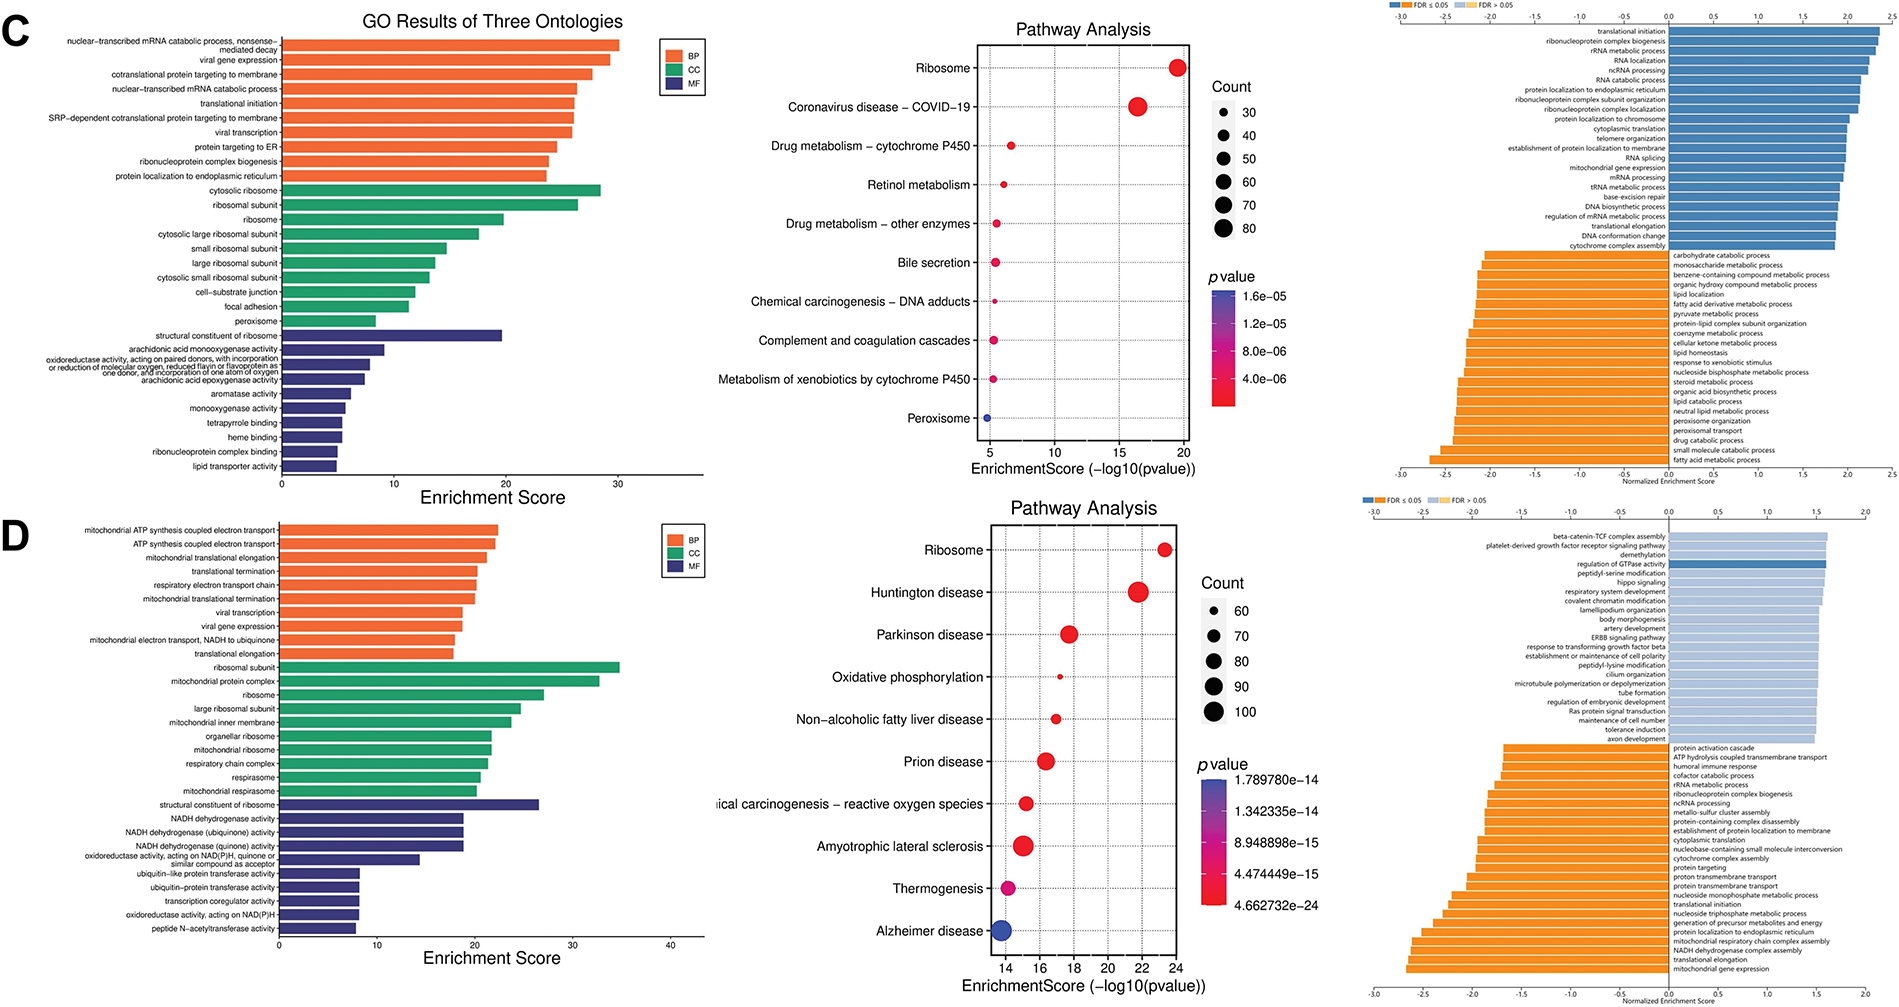
Figure 10: Functional enrichment analysis of the SENP1, 3 and 7 co-expressed genes in patients with LIHC. (A) Volcano plots of the SENP1, 3 and 7 differentially expressed genes (DEGs) in LIHC. (B) Annotation of SENP1’s co-expressed genes with GO enrichment (left), KEGG pathway enrichment (middle), and molecular function enrichment by GESA database (right). (C) Annotation of SENP3’s co-expressed genes with GO enrichment (left), KEGG pathway enrichment (middle), and molecular function enrichment by GESA (right). (D) Annotation of SENP7’s co-expressed genes with GO enrichment (left), KEGG pathway enrichment (middle), and molecular function enrichment by GESA (right)
3.6 SENP1 and SENP3 Knockdown Inhibit the Proliferation, Clonogenicity, and Migration of Hepatocellular Carcinoma Cells
Because in the aforementioned bioinformatics analysis, SENP1 and SENP3 had the best overall prediction indicators compared to SENP7, we focused on these two members in our further wet experiments. To explore the precise roles of SENP1 and SENP3 in hepatocellular carcinoma cell proliferation and migration, we designed and tested multiple shRNA sequences targeting SENP1 (sh-1, sh-2, sh-3) and SENP3 (sh-1, sh-2, sh-3). The knockdown efficiency of each construct was evaluated in Huh-7 and Hep-3B cells (Fig. 11A,C). Among them, shSENP1-2 and shSENP3-3 exhibited the highest silencing efficiency and were therefore selected for subsequent experiments. Lentivirus-mediated knockdown of SENP1 and SENP3 was successfully established in both Huh-7 and Hep-3B cell lines down efficiency and were therefore selected for all subsequent functional experiments. The MTT cell viability assay indicated that knockdown of SENP1 and SENP3 markedly reduced the proliferative capacity of Huh-7 and Hep-3B cells relative to the scramble control group (Fig. 11B,D). The colony formation assay revealed substantial inhibition of clonogenicity in hepatocellular carcinoma cells knocked down for both SENP1 and SENP3 (Fig. 12A,B). Specifically, the clonogenicity of SENP1 knockdown was inhibited by 87.65%, and that of SENP3 knockdown was inhibited by 61.39% in Huh-7 cells (Fig. 12A), whereas in Hep-3B cells, SENP1 and SENP3 knockdown decreased colony formation ability by 88.37% and 58.75%, respectively (Fig. 12B). Transwell migration assays were conducted to assess how SENP1 and SENP3 knockdown affected hepatocellular carcinoma cell motility. We discovered that the number of migrated cells with SENP1 and SENP3 shRNA mediated knockdown Huh-7 group was 4.5 ± 1.3 and 27.1± 1.2, respectively, which was much lower than that of Huh-7 shNC control cells (39.4 ± 3) (Fig. 12C). Similarly, SENP1 and SENP3 knockdown Hep-3B cells migrated at 24.1 ± 1.2 and 50.3 ± 1.6, respectively, substantially lower than the control group (205.0 ± 12.8) (Fig. 12D). The wound healing test was also used to evaluate the capacity of liver cancer cells to migrate, which showed that SENP1 and SENP3 knockdown in Huh-7 and Hep-3B cells inhibited the scratch healing rate of hepatocellular carcinoma cells (Fig. 13A,B). These results showed that knocking down SENP1 and SENP3 lowered hepatocellular carcinoma cell proliferation, clonogenicity, and migration.
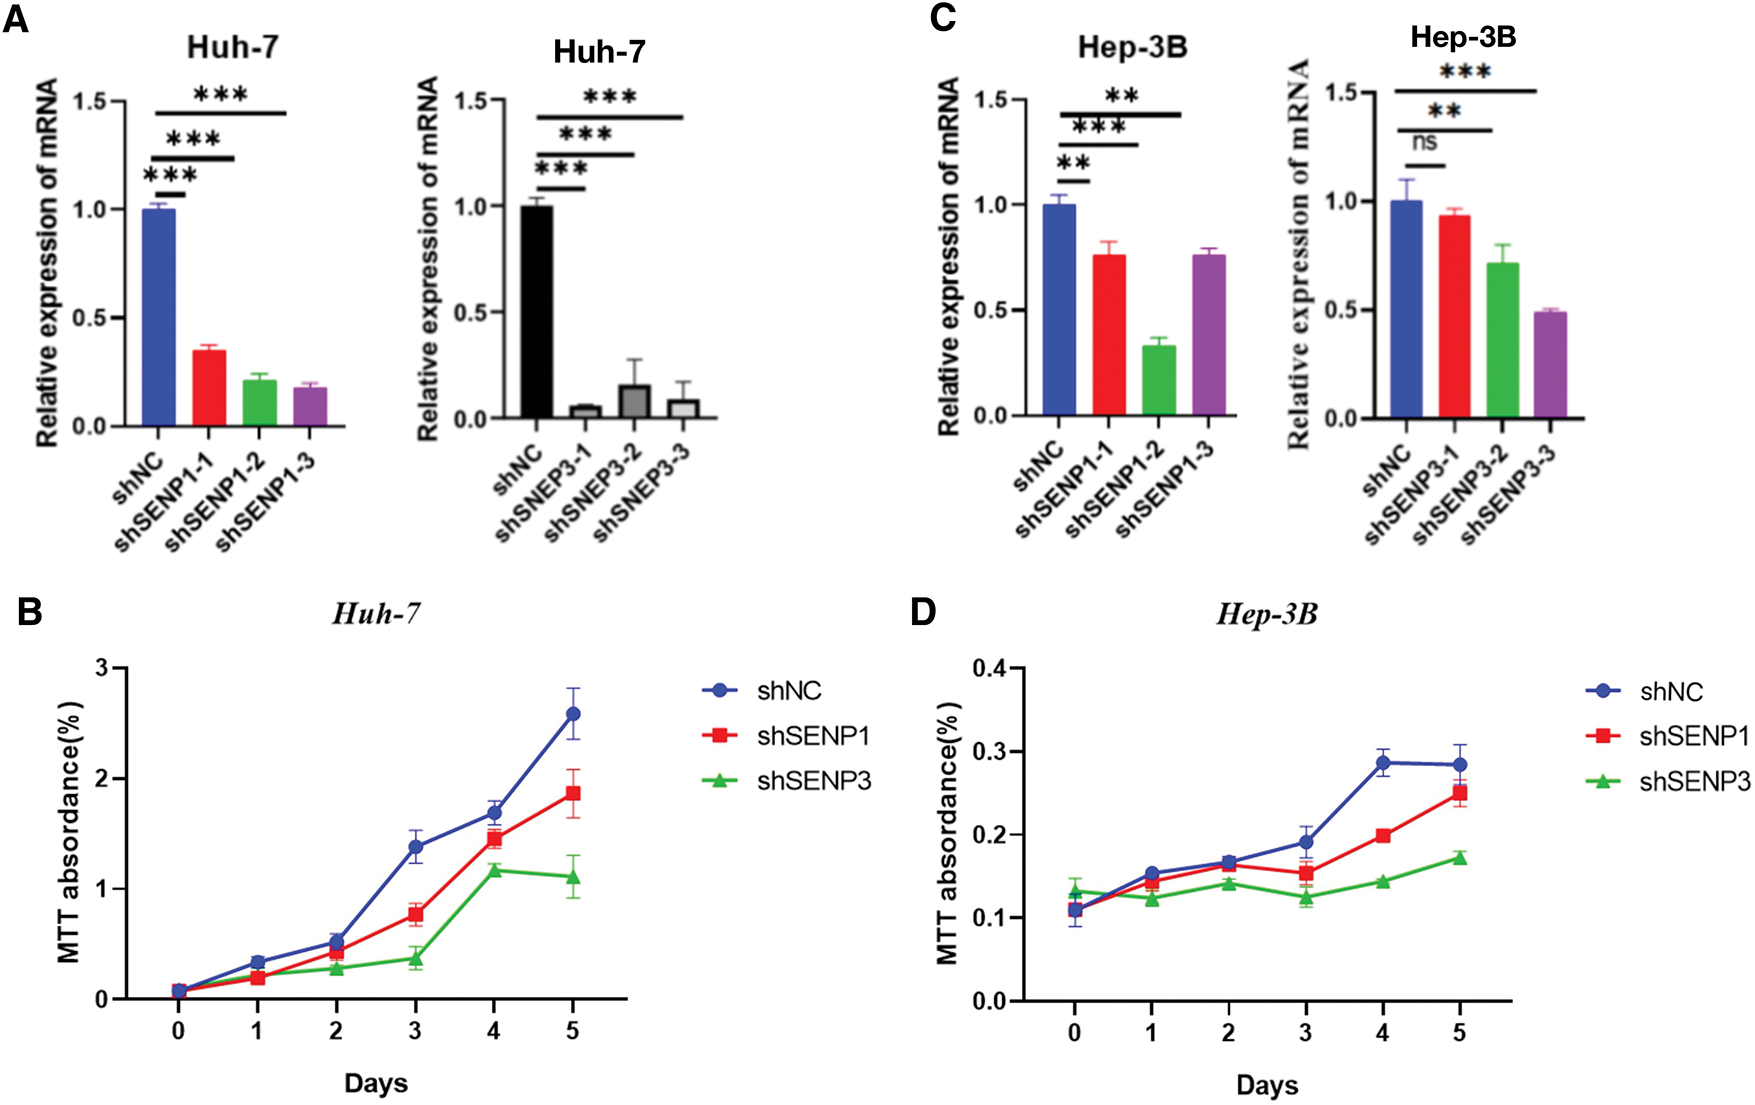
Figure 11: Knockdown of SENP1 and SENP3 inhibits the viability of hepatocellular carcinoma cells. (A) knockdown efficiency of SENP1 and SENP3 shRNA in Huh-7 cells. (B) MTT assay of SENP1 and SENP3 knockdown in Huh-7 cells. (C) knockdown efficiency of SENP1 and SENP3 shRNA in Hep-3B cells. (D) MTT assay of SENP1 and SENP3 knockdown in Hep-3B cells. **p < 0.01; ***p < 0.001; ns p > 0.05
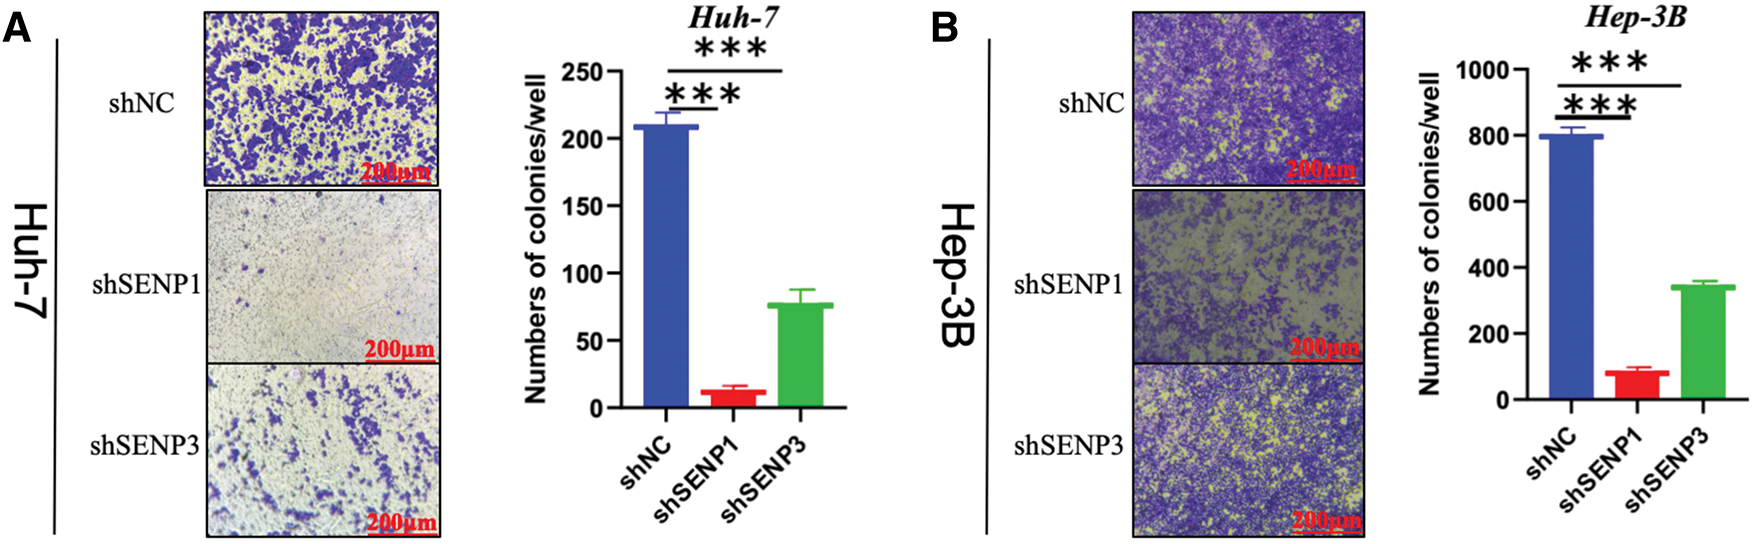
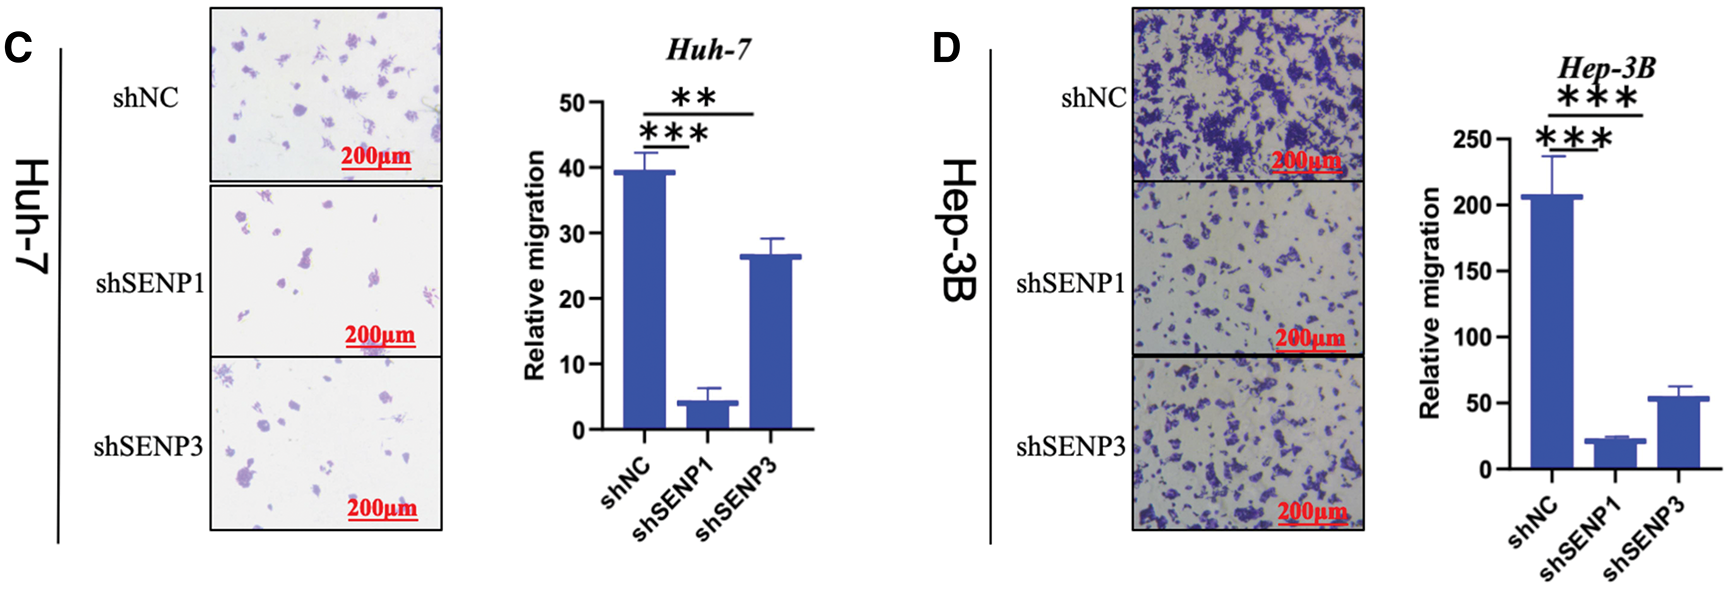
Figure 12: SENP1 and SENP3 knockdown suppress the clonogenicity and migration of hepatocellular carcinoma cells. (A, B) SENP1 and SENP3 knockdown inhibited colony formation in Huh-7 (A) and Hep-3B (B) cells. (C, D) SENP1 and SENP3 knockdown decreased migration in Huh-7 (C) and Hep-3B (D) cells by transwell assay. Scale bars: 200 μm. **p < 0.01; ***p < 0.001
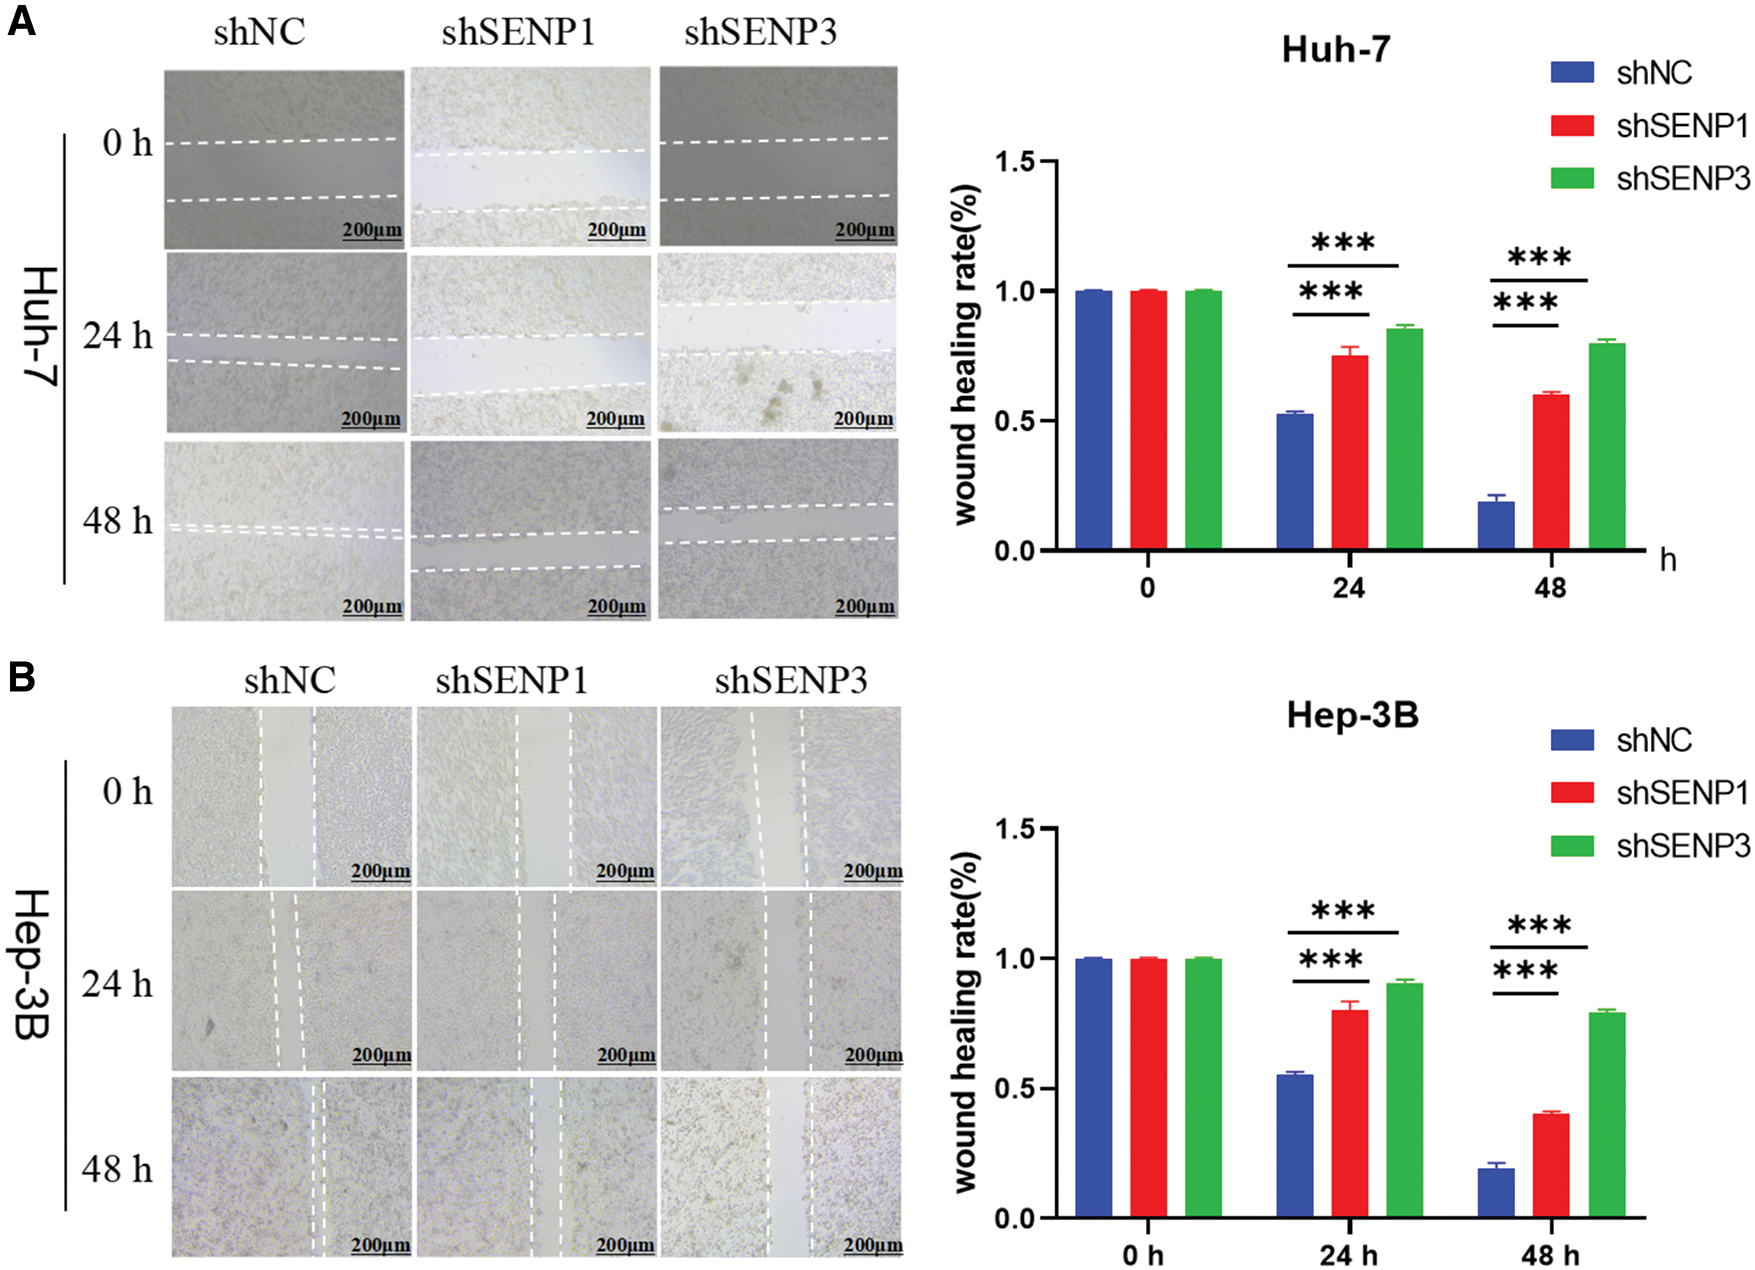
Figure 13: SENP1 and SENP3 inhibition reduce the migration of hepatocellular carcinoma cells in scratch-wound healing assay. (A, B) SENP1 and SENP3 knockdown repressed migration in Huh-7 (A) and Hep-3B (B) cells in wound healing assay. Scale bars: 200 μm. ***p < 0.001
PTMs are becoming more relevant in several areas of carcinogenesis. SENPs proteins are cysteine proteases with isopeptidase activity facilitating the maturation of the SUMO precursor and the de-conjugation of SUMO from SUMOylated substrate proteins, with the exception of SENP8, which is specific for de-Neddylation [9]. In recent years, a comprehensive understanding of the SENP family’s carcinogenic effects has been gained. Many studies have reported that abnormal SUMOylation or Neddylation is related to cancers, such as breast cancer [37] and colorectal cancer [38]. However, the role and underlying mechanisms of the SENP family in hepatocarcinogenesis and LIHC progression remain unexplored, and no comprehensive bioinformatics analysis has been conducted to date.
Previous research has indicated that SENP1 plays a crucial function in carcinogenesis. SENP1 promotes the epithelial-mesenchymal transition (EMT) of prostate cancer cells through de-SUMOylation of SMAD4 [39] and promotes cell cycle progression of nephroblastoma cells by upregulating the expression of CCNE1 [11]. In addition, SENP1 enhances CPT-11 resistance in colorectal cancer by regulating the SUMOylation levels of HIF1α [40]. SENP1 directly regulates the subcellular localization of JAK2 through de-SUMOylation in ovarian cancer, and SENP1/JAK2 signaling is activated in platinum-resistant ovarian cancer patients [14]. In liver cancer, SENP1 promotes tumorigenesis by regulating SUMOylation of important oncoproteins, including HIF1α [41,42], SHP2 [43], UBE2T [44], c-Myc [45], and β-catenin [46]. Despite emerging evidence, the link between SENP1 expression, immune infiltration, and drug sensitivity remains unclear. In contrast, SENP3 has been reported to participate in modulating the DNA damage response in acute myeloid leukemia [47]. SENP3 is also involved in regulating oxidative stress, the cell cycle [48] mitosis [49], and chromosome stability [50]. Senp3-knockout heterozygous mice have smaller livers [51]. SENP3 was previously identified as an effective prognostic biomarker for HCC [52,53]. SENP3 was recognized as a prognostic indicator for LIHC in our analysis. The biochemical function of SENP3 in liver development and LIHC progression should be studied in the future. From a mechanistic perspective, SENP1 and SENP3 may regulate the progression of HCC by modulating key oncoproteins and signaling pathways. For example, SENP1 is known to deSUMOylate HIF1α, stabilizing it under hypoxic conditions to promote cancer stemness and proliferation, a phenomenon observed in breast cancer and pancreatic cancer [15]. Similarly, SENP1-mediated deSUMOylation of c-Myc can prevent its degradation, enhancing cell cycle progression and tumor growth [10]. These mechanisms may underline the proliferation and migration effects observed in HCC following SENP1 knockdown. Additionally, SENP3 has been implicated in regulating oxidative stress and DNA damage response pathways [54], which are crucial for cancer cell survival and metastasis. In HCC, SENP3 might influence similar pathways, potentially via downstream targets such as p53 or NF-κB, as reported in other studies [12,19]. Beyond HCC, the SENP family plays a significant role in other cancers. For instance, in prostate cancer, SENP1 promotes EMT by deSUMOylating SMAD4 [55], a mechanism that may also contribute to HCC metastasis. Similarly, SENP3 enhances pancreatic carcinoma progression by regulating NFATc3 deSUMOylation under hypoxia [24], mirroring some of our findings in HCC. These parallels suggest that SENPs may exert conserved oncogenic functions across cancer types. However, the specific downstream targets and pathways are likely to differ by cancer context, highlighting the need to further explore HCC-specific regulatory networks. While this study identifies SENP1 and SENP3 as critical regulators of HCC progression, their precise molecular mechanisms remain to be elucidated. Future studies could employ chromatin immunoprecipitation sequencing (ChIP-seq) or RNA sequencing (RNA-seq) to identify direct downstream targets of SENP1 and SENP3 in HCC cells. Moreover, exploring the interplay between SENP-mediated deSUMOylation and other post-translational modifications, such as phosphorylation or ubiquitination, could provide deeper insights into the regulatory networks driving HCC development and metastasis. In LIHC, SENP7 may promote tumor cell migration and invasion by regulating c-Myc SUMOylation and degradation [29]. In the next step of mechanistic and clinical studies on LIHC, the suppression of SENP1 by inhibitors can be considered, noting that triptolide and hinokiflavone have been reported as natural SENP1 inhibitors with anticancer activity [56], while SENP3 and SENP7 inhibitors remain unexplored.
Our study comprehensively analyzed the SENP family in LIHC using TCGA and CPTAC databases, revealing the increased expression of SENP1, 3, and 7, their association with clinical factors (e.g., tumor stage, grade, TP53 mutations, and metastasis), and their negative correlation with overall survival, immune microenvironment, and chemotherapy sensitivity. Thus, SENP1, 3, and 7, particularly SENP1 and SENP3, can serve as prognostic biomarkers for LIHC
While this study provides valuable insights into the roles of SENP1, SENP3, and SENP7 in LIHC, several limitations should be acknowledged. First, our mechanistic exploration is limited, as we primarily focused on phenotypic observations of SENP1 and SENP3 in HCC cell proliferation and migration, without identifying specific downstream target genes or signaling pathways. Future studies employing techniques such as ChIP-seq or proteomics could address this gap. Second, experimental validation was restricted to SENP1 and SENP3 in two HCC cell lines (Huh-7 and Hep-3B), and lacked in vivo models to confirm these findings. Additionally, SENP7, despite its prognostic relevance in bioinformatics analyses, was not further explored through wet lab experiments, limiting our understanding of its functional role in HCC. Third, our bioinformatics analyses relied on TCGA and CPTAC databases, which may introduce biases due to sample representation, and validation in independent clinical cohorts is needed to confirm the generalizability of our findings. Finally, while we propose SENP1, SENP3, and SENP7 as potential prognostic biomarkers for LIHC, their clinical utility requires further validation through large-scale clinical studies.
This study investigated a comprehensive and systematic investigation of the expression patterns, genetic mutations, prognostic value, function enrichment, immune infiltration, and drug sensitivity of the SENP family genes in liver cancer. Additionally, we performed cell-based experiments to show that SENP1 and SENP3 regulate hepatocellular carcinoma cell proliferation and migration. Our results demonstrate that SENP1, 3, and 7 are diagnostic and prognostic indicators, as well as possible therapeutic targets, for individuals with liver cancer. Understanding the pathogenic mechanisms of SENP1, 3, and 7 involved in liver cancer progression will help in designing therapeutic strategies for LIHC treatment.
Acknowledgement: Not applicable.
Funding Statement: This work was supported by grants from the National Natural Science Foundation of China (Grant Nos. 32070616 and 82170794).
Author Contributions: The authors confirm contribution to the paper as follows: study conception and design: Shuyan Kong; data collection: Danting Li and Haonan Meng; analysis and interpretation of results: Xiaochun Jiang and Haoxiang Zhang; draft manuscript preparation: Shuyan Kong, Shoujun Huang and Peilin Zheng. All authors reviewed the results and approved the final version of the manuscript.
Availability of Data and Materials: The datasets analyzed in the current study are available from the UCSC Xena database (: http://xena.ucsc.edu/ (accessed on 01 July 2025)), TIMER 2.0 database (http://timer.cistrome.org/), UALCAN database (http://ualcan.path.uab.edu/ (accessed on 01 July 2025)), cBioPortal database (https://www.cbioportal.org/), GSCA database (http://bioinfo.life.hust.edu.cn/GSCA (accessed on 01 July 2025)), GEPIA2 database (http://gepia2.cancer-pku.cn/#index), GTRP database (https://portals.broadinstitute.org/ctrp.v2/ (accessed on 01 July 2025)), GDSC database (http://www.cancerrxgene.org/) and LinkedOmics (http://www.linkedomics.org/). The data supporting the findings of this study are available from the corresponding author, upon reasonable request.
Ethics Approval: Not applicable.
Conflicts of Interest: The authors declare no conflicts of interest to report regarding the present study.
Supplementary Materials: The supplementary material is available online at https://www.techscience.com/doi/10.32604/biocell.2025.066205/s1.
Abbreviations
| CNV | Copy Number Variation |
| TCGA | The Cancer Genome Atlas |
| CPTAC | Clinical Proteomic Tumor Analysis Consortium |
| LIHC | Liver hepatocellular carcinoma |
| OS | Overall survival |
| PTM | Post-translational modification |
| TIMER | Tumor Immune Estimation Resource |
| UALCAN | The University of Alabama at Birmingham cancer data analysis portal |
| GSCA | Gene Set Cancer Analysis |
| ROC | Receiver operating characteristic |
| GEPIA2 | Gene Expression Profiling Interactive Analysis, version 2 |
| FDR | False discovery rate |
| CTRP | Cancer Therapeutics Response Portal |
| GDSC | Genomics of Drug Sensitivity in Cancer |
| GSEA | Gene Set Enrichment Analysis |
| GO | Gene Ontology |
| KEGG | Kyoto Encyclopedia of Genes and Genomes |
| DMEM | Dulbecco’s Modified Eagle’s medium |
| PBS | Phosphate-buffered saline |
| CHOL | Cholangiocarcinoma |
| ESCA | Esophageal carcinoma |
| BLCA | Bladder urothelial carcinoma |
| BRCA | Breast invasive carcinoma |
| COAD | Colon adenocarcinoma |
| SD | Standard deviation |
| DFI | Disease-free interval |
| DSS | Disease-specific survival |
| PFS | Progression-free surviva |
| ACC | Adrenocortical carcinoma |
| KIRP | Kidney renal papillary cell carcinoma |
| THCA | Thyroid carcinoma |
| KIRC | Kidney renal clear cell carcinoma |
| MESO | Mesothelioma |
| SARC | Sarcoma |
| PAAD | Pancreatic adenocarcinoma |
| Tcm | Central Memory T cell |
| DC | Dendritic cells |
| TFH | T follicular helper |
| pDC | Plasmacytoid dendritic cells |
| BP | Biological process |
| CC | Cellular component |
| EMT | Epithelial-mesenchymal transition |
| HCC | Hepatocellular carcinoma |
| DEG | Differentially expressed genes |
References
1. Giraud J, Chalopin D, Blanc JF, Saleh M. Hepatocellular carcinoma immune landscape and the potential of immunotherapies. Front Immunol. 2021;12:655697. doi:10.3389/fimmu.2021.655697. [Google Scholar] [PubMed] [CrossRef]
2. Llovet JM, Kelley RK, Villanueva A, Singal AG, Pikarsky E, Roayaie S, et al. Hepatocellular carcinoma. Nat Rev Dis Primers. 2021;7(1):6. doi:10.1038/s41572-020-00240-3. [Google Scholar] [PubMed] [CrossRef]
3. Llovet JM, Montal R, Sia D, Finn RS. Molecular therapies and precision medicine for hepatocellular carcinoma. Nat Rev Clin Oncol. 2018;15(10):599–616. doi:10.1038/s41571-018-0073-4. [Google Scholar] [PubMed] [CrossRef]
4. Llovet JM, De Baere T, Kulik L, Haber PK, Greten TF, Meyer T, et al. Locoregional therapies in the era of molecular and immune treatments for hepatocellular carcinoma. Nat Rev Gastroenterol Hepatol. 2021;18(5):293–313. doi:10.1038/s41575-020-00395-0. [Google Scholar] [PubMed] [CrossRef]
5. Chan SL, Wong N, Lam WKJ, Kuang M. Personalized treatment for hepatocellular carcinoma: current status and future perspectives. J Gastroenterol Hepatol. 2022;37(7):1197–206. doi:10.1111/jgh.15889. [Google Scholar] [PubMed] [CrossRef]
6. Du L, Liu W, Rosen ST. Targeting SUMOylation in cancer. Curr Opin Oncol. 2021;33(5):520–5. doi:10.1097/CCO.0000000000000765. [Google Scholar] [PubMed] [CrossRef]
7. Kunz K, Piller T, Müller S. SUMO-specific proteases and isopeptidases of the SENP family at a glance. J Cell Sci. 2018;131(6):jcs211904. doi:10.1242/jcs.211904. [Google Scholar] [PubMed] [CrossRef]
8. Gillies J, Hochstrasser M. A new class of SUMO proteases. EMBO Rep. 2012;13(4):284–5. doi:10.1038/embor.2012.34. [Google Scholar] [PubMed] [CrossRef]
9. Lara-Ureña N, Jafari V, García-Domínguez M. Cancer-associated dysregulation of sumo regulators: proteases and ligases. Int J Mol Sci. 2022;23(14):8012. doi:10.3390/ijms23148012. [Google Scholar] [PubMed] [CrossRef]
10. Sun XX, Chen Y, Su Y, Wang X, Chauhan KM, Liang J et al. SUMO protease SENP1 deSUMOylates and stabilizes c-Myc. Proc Natl Acad Sci. 2018;115(43):10983–8. doi:10.1073/pnas.1802932115. [Google Scholar] [PubMed] [CrossRef]
11. Zhu S, Hu J, Cui Y, Liang S, Gao X, Zhang J, et al. Knockdown of SENP1 inhibits HIF-1α SUMOylation and suppresses oncogenic CCNE1 in Wilms tumor. Mol Ther Oncolytics. 2021;23:355–66. doi:10.1016/j.omto.2021.07.007. [Google Scholar] [PubMed] [CrossRef]
12. Chauhan KM, Chen Y, Chen Y, Liu AT, Sun XX, Dai MS. The SUMO-specific protease SENP1 deSUMOylates p53 and regulates its activity. J Cell Biochem. 2021;122(2):189–97. doi:10.1002/jcb.29838. [Google Scholar] [PubMed] [CrossRef]
13. Shangguan X, He J, Ma Z, Zhang W, Ji Y, Shen K, et al. SUMOylation controls the binding of hexokinase 2 to mitochondria and protects against prostate cancer tumorigenesis. Nat Commun. 2021;12(1):1812. doi:10.1038/s41467-021-22163-7. [Google Scholar] [PubMed] [CrossRef]
14. Li J, Wu R, Yung MMH, Sun J, Li Z, Yang H, et al. SENP1-mediated deSUMOylation of JAK2 regulates its kinase activity and platinum drug resistance. Cell Death Dis. 2021;12(4):341. doi:10.1038/s41419-021-03635-6. [Google Scholar] [PubMed] [CrossRef]
15. Gao Y, Wang R, Liu J, Zhao K, Qian X, He X, et al. SENP1 promotes triple-negative breast cancer invasion and metastasis via enhancing CSN5 transcription mediated by GATA1 deSUMOylation. Int J Biol Sci. 2022;18(5):2186–201. doi:10.7150/ijbs.605946. [Google Scholar] [CrossRef]
16. Zhang J, Tan GL, Jiang M, Wang TS, Liu GH, Xiong SS, et al. Effects of SENP1-induced deSUMOylation of STAT1 on proliferation and invasion in nasopharyngeal carcinoma. Cell Signal. 2023;101:110530. doi:10.1016/j.cellsig.2022.110530. [Google Scholar] [PubMed] [CrossRef]
17. Karatas OF, Capik O, Barlak N, Aydin Karatas E. Comprehensive in silico analysis for identification of novel candidate target genes, including DHX36, OPA1, and SENP2, located on chromosome 3q in head and neck cancers. Head Neck. 2021;43(1):288–302. doi:10.1002/hed.26493. [Google Scholar] [PubMed] [CrossRef]
18. Chang CC, Huang YS, Lin YM, Lin CJ, Jeng JC, Liu SM, et al. The role of sentrin-specific protease 2 substrate recognition in TGF-β-induced tumorigenesis. Sci Rep. 2018;8(1):9786. doi:10.1038/s41598-018-28103-8. [Google Scholar] [PubMed] [CrossRef]
19. Gao X, Wu Y, Qiao L, Feng X. SENP2 suppresses NF-κB activation and sensitizes breast cancer cells to doxorubicin. Eur J Pharmacol. 2019;854:179–86. doi:10.1016/j.ejphar.2019.03.051. [Google Scholar] [PubMed] [CrossRef]
20. Dobruch J, Oszczudłowski M. Bladder cancer: current challenges and future directions. Medicina. 2021;57(8):749. doi:10.3390/medicina57080749. [Google Scholar] [PubMed] [CrossRef]
21. Jaguścik AB, Ziółkowska EI, Wołowiec D, Zawlik I, Soin M, Jarych D, et al. Venetoclax used alone, or in combination with cladribine, changes the expression of apoptosis-regulating genes in chronic lymphocytic leukemia cells in vitro. Adv Clin Exp Med. 2025;34(6):973–85. doi:10.17219/acem/199382. [Google Scholar] [PubMed] [CrossRef]
22. Wang M, Sang J, Ren Y, Liu K, Liu X, Zhang J, et al. SENP3 regulates the global protein turnover and the Sp1 level via antagonizing SUMO2/3-targeted ubiquitination and degradation. Protein Cell. 2016;7(1):63–77. doi:10.1007/s13238-015-0216-7. [Google Scholar] [PubMed] [CrossRef]
23. Jadhav KB, Shah V, Mahajan A. Salivary and tumour tissue miR-21 for prediction of cervical lymph node metastasis in patients with oral squamous cell carcinoma: an observational study. Lancet Oncol. 2022;23:S26. doi:10.1016/s1470-2045(22)00425-9. [Google Scholar] [CrossRef]
24. Tong Y, Zhang Z, Cheng Y, Yang J, Fan C, Zhang X, et al. Hypoxia-induced NFATc3 deSUMOylation enhances pancreatic carcinoma progression. Cell Death Dis. 2022;13(4):413. doi:10.1038/s41419-022-04779-9. [Google Scholar] [PubMed] [CrossRef]
25. Ding X, Sun J, Wang L, Li G, Shen Y, Zhou X, et al. Overexpression of SENP5 in oral squamous cell carcinoma and its association with differentiation. Oncol Rep. 2008;20(5):1041–5. doi:10.3892/or_00000107. [Google Scholar] [CrossRef]
26. Jia C, Gong Z, Zhang L. Silencing of AEBP1 inhibits proliferation and promotes apoptosis via the AKT signaling pathway in osteosarcoma. Biomed Rep. 2025;23(2):1–10. doi:10.3892/br.2025.2006. [Google Scholar] [PubMed] [CrossRef]
27. Stefanska B, Cheishvili D, Suderman M, Arakelian A, Huang J, Hallett M, et al. Genome-wide study of hypomethylated and induced genes in patients with liver cancer unravels novel anticancer targets. Clin Cancer Res. 2014;20(12):3118–32. doi:10.1158/1078-0432.Ccr-13-0283. [Google Scholar] [PubMed] [CrossRef]
28. Schick M, Zhang L, Maurer S, Maurer HC, Isaakaidis K, Schneider L, et al. Genetic alterations of the SUMO isopeptidase SENP6 drive lymphomagenesis and genetic instability in diffuse large B-cell lymphoma. Nat Commun. 2022;13(1):281. doi:10.1038/s41467-021-27704-8. [Google Scholar] [PubMed] [CrossRef]
29. González-Prieto R, Cuijpers SA, Kumar R, Hendriks IA, Vertegaal AC. c-Myc is targeted to the proteasome for degradation in a SUMOylation-dependent manner, regulated by PIAS1, SENP7 and RNF4. Cell Cycle. 2015;14(12):1859–72. doi:10.1080/15384101.2015.1040965. [Google Scholar] [PubMed] [CrossRef]
30. Gallardo-Chamizo F, Lara-Ureña N, Correa-Vázquez JF, Reyes JC, Gauthier BR, García-Domínguez M. SENP7 overexpression protects cancer cells from oxygen and glucose deprivation and associates with poor prognosis in colon cancer. Genes Dis. 2022;9(6):1419–22. doi:10.1016/j.gendis.2022.02.019. [Google Scholar] [PubMed] [CrossRef]
31. Aoki I, Higuchi M, Gotoh Y. NEDDylation controls the target specificity of E2F1 and apoptosis induction. Oncogene. 2013;32(34):3954–64. doi:10.1038/onc.2012.428. [Google Scholar] [PubMed] [CrossRef]
32. Basu A, Bodycombe NE, Cheah JH, Price EV, Liu K, Schaefer GI, et al. An interactive resource to identify cancer genetic and lineage dependencies targeted by small molecules. Cell. 2013;154(5):1151–61. doi:10.1016/j.cell.2013.08.003. [Google Scholar] [PubMed] [CrossRef]
33. Rees MG, Seashore-Ludlow B, Cheah JH, Adams DJ, Price EV, Gill S, et al. Correlating chemical sensitivity and basal gene expression reveals mechanism of action. Nat Chem Biol. 2016;12(2):109–16. doi:10.1038/nchembio.1986. [Google Scholar] [PubMed] [CrossRef]
34. Seashore-Ludlow B, Rees MG, Cheah JH, Cokol M, Price EV, Coletti ME, et al. Harnessing connectivity in a large-scale small-molecule sensitivity dataset. Cancer Discov. 2015;5(11):1210–23. doi:10.1158/2159-8290.Cd-15-0235. [Google Scholar] [PubMed] [CrossRef]
35. Hu J, Cao J, Topatana W, Juengpanich S, Li S, Zhang B, et al. Targeting mutant p53 for cancer therapy: direct and indirect strategies. J Hematol Oncol. 2021;14(1):157. doi:10.1186/s13045-021-01169-0. [Google Scholar] [PubMed] [CrossRef]
36. Patra T, Meyer K, Ray RB, Kanda T, Ray R. Akt inhibitor augments anti-proliferative efficacy of a dual mTORC1/2 inhibitor by FOXO3a activation in p53 mutated hepatocarcinoma cells. Cell Death Dis. 2021;12(11):1073. doi:10.1038/s41419-021-04371-7. [Google Scholar] [PubMed] [CrossRef]
37. Xie P, Peng Z, Chen Y, Li H, Du M, Tan Y, et al. Neddylation of PTEN regulates its nuclear import and promotes tumor development. Cell Res. 2021;31(3):291–311. doi:10.1038/s41422-020-00443-z. [Google Scholar] [PubMed] [CrossRef]
38. Peng Z, Fang W, Wu B, He M, Li S, Wei J, et al. Targeting Smurf1 to block PDK1–Akt signaling in KRAS-mutated colorectal cancer. Nat Chem Biol. 2025;21(1):59–70. doi:10.1038/s41589-024-01683-5. [Google Scholar] [PubMed] [CrossRef]
39. Zhang X, Wang H, Wang H, Xiao F, Seth P, Xu W, et al. SUMO-Specific cysteine protease 1 promotes epithelial mesenchymal transition of prostate cancer cells via regulating SMAD4 deSUMOylation. Int J Mol Sci. 2017;18(4):808. doi:10.3390/ijms18040808. [Google Scholar] [PubMed] [CrossRef]
40. Chen MC, Nhan DC, Hsu CH, Wang TF, Li CC, Ho TJ, et al. SENP1 participates in Irinotecan resistance in human colon cancer cells. J Cell Biochem. 2021;122(10):1277–94. doi:10.1002/jcb.29946. [Google Scholar] [PubMed] [CrossRef]
41. Cheng J, Kang X, Zhang S, Yeh ET. SUMO-specific protease 1 is essential for stabilization of HIF1α during hypoxia. Cell. 2007;131(3):584–95. doi:10.1016/j.cell.2007.08.045. [Google Scholar] [PubMed] [CrossRef]
42. Cui CP, Wong CC, Kai AK, Ho DW, Lau EY, Tsui YM, et al. SENP1 promotes hypoxia-induced cancer stemness by HIF-1α deSUMOylation and SENP1/HIF-1α positive feedback loop. Gut. 2017;66(12):2149–59. doi:10.1136/gutjnl-2016-313264. [Google Scholar] [PubMed] [CrossRef]
43. Niu Z, Zhao Q, Cao H. Hypoxia-activated oxidative stress mediates SHP2/PI3K signaling pathway to promote hepatocellular carcinoma growth and metastasis. Sci Rep. 2025;15(1):4847. doi:10.1038/s41598-025-89137-3. [Google Scholar] [PubMed] [CrossRef]
44. Tao Y, Li R, Shen C, Li J, Zhang Q, Ma Z, et al. SENP1 is a crucial promotor for hepatocellular carcinoma through deSUMOylation of UBE2T. Aging. 2020;12(2):1563–76. doi:10.18632/aging.102700. [Google Scholar] [PubMed] [CrossRef]
45. Fang XJ, Xian XR, Tang J, Mu HW, Zheng SJ, Ling QY, et al. Momordin Ic induces G0/1 phase arrest and apoptosis in colon cancer cells by suppressing SENP1/c-MYC signaling pathway. J Pharmacol Sci. 2021;146(4):249–58. doi:10.1016/j.jphs.2021.04.007. [Google Scholar] [PubMed] [CrossRef]
46. Dai J, Hao Y, Chen X. miR-122/SENP1 axis confers stemness and chemoresistance to liver cancer through Wnt/β-catenin signaling. Oncol Lett. 2023;26(3):390. [Google Scholar] [PubMed]
47. Xu R, Yu S, Zhu D, Huang X, Xu Y, Lao Y, et al. hCINAP regulates the DNA-damage response and mediates the resistance of acute myelocytic leukemia cells to therapy. Nat Commun. 2019;10(1):3812. doi:10.1038/s41467-019-11795-5. [Google Scholar] [PubMed] [CrossRef]
48. Graves JD, Lee YJ, Liu K, Li G, Lin FT, Lin WC. E2F1 sumoylation as a protective cellular mechanism in oxidative stress response. Proc Natl Acad Sci U S A. 2020;117(26):14958–69. doi:10.1073/pnas.1921554117. [Google Scholar] [PubMed] [CrossRef]
49. Hu G, Chen Y, Yang X, Wang Y, He J, Wang T, et al. Mitotic SENP3 activation couples with cGAS signaling in tumor cells to stimulate anti-tumor immunity. Cell Death Dis. 2022;13(7):640. doi:10.1038/s41419-022-05063-6. [Google Scholar] [PubMed] [CrossRef]
50. Ren B, Zhong Y, Yang Y, Chang S, Li Y, You M, et al. Chromatin-associated α-satellite RNA maintains chromosome stability by reestablishing SAF-A in the mitotic cell cycle. Nucleic Acids Res. 2025;53(7):gkaf294. doi:10.1093/nar/gkaf294. [Google Scholar] [PubMed] [CrossRef]
51. Wei B, Huang C, Liu B, Wang Y, Xia N, Fan Q, et al. Mitotic phosphorylation of SENP3 regulates DeSUMOylation of chromosome-associated proteins and chromosome stability. Cancer Res. 2018;78(9):2171–8. doi:10.1158/0008-5472.Can-17-2288. [Google Scholar] [PubMed] [CrossRef]
52. Zhao Y, Yang B, Chen D, Zhou X, Wang M, Jiang J, et al. Combined identification of ARID1A, CSMD1, and SENP3 as effective prognostic biomarkers for hepatocellular carcinoma. Aging. 2021;13(3):4696–712. doi:10.18632/aging.202586. [Google Scholar] [PubMed] [CrossRef]
53. Chen Y, Peng W, Tao Q, Li S, Wu Z, Zhou Y, et al. Increased small ubiquitin-like modifier-activating enzyme SAE1 promotes hepatocellular carcinoma by enhancing mTOR SUMOylation. Lab Investig. 2023;103(1):100011. doi:10.1016/j.labinv.2022.100011. [Google Scholar] [PubMed] [CrossRef]
54. Han Y, Huang X, Cao X, Li Y, Gao L, Jia J, et al. SENP3-mediated TIP60 deSUMOylation is required for DNA-PKcs activity and DNA damage repair. MedComm. 2022;3(2):e123. doi:10.1002/mco2.123. [Google Scholar] [PubMed] [CrossRef]
55. Wang Z, Ding Y, Wang P, Yu J, Huang S, Yang L, et al. SMAD4 promotes EMT in COPD airway remodeling induced by cigarette smoke through interaction with O-GlcNAc transferase. Ecotoxicol Environ Saf. 2024;284:116931. doi:10.1016/j.ecoenv.2024.116931. [Google Scholar] [PubMed] [CrossRef]
56. Kukkula A, Ojala VK, Mendez LM, Sistonen L, Elenius K, Sundvall M. Therapeutic potential of targeting the SUMO pathway in cancer. Cancers. 2021;13(17):4402. doi:10.3390/cancers13174402. [Google Scholar] [PubMed] [CrossRef]
Cite This Article
 Copyright © 2025 The Author(s). Published by Tech Science Press.
This work is licensed under a Creative Commons Attribution 4.0 International License , which permits unrestricted use, distribution, and reproduction in any medium, provided the original work is properly cited.
 Downloads
 Citation Tools