
 Submit a Paper
 Propose a Special lssue
 Open Access
ARTICLE

AdipoRon Promotes Mitochondrial Ca2+ Overload and Apoptosis in Hepatocellular Carcinoma Cells by Activating the PLC-IP3-IP3R Signaling Pathway
1 College of Traditional Chinese Medicine, Bozhou University, Bozhou, 236800, China
2 The School of Biomedical and Pharmaceutical Sciences, Guangdong University of Technology, Guangzhou, 510006, China
3 Department of General Surgery, The Second Affiliated Hospital of Anhui Medical University, Hefei, 230601, China
* Corresponding Authors: Jiong Gu. Email: ; Liang He. Email:
# These authors contributed equally to this work
BIOCELL 2026, 50(1), 9 https://doi.org/10.32604/biocell.2025.073085
Received 10 September 2025; Accepted 07 November 2025; Issue published 23 January 2026
 View Full Text
 Download PDF
Abstract
Objective: Hepatocellular carcinoma (HCC) ranks among the most prevalent malignant tumors globally. Metabolically associated fatty liver disease is a significant risk factor for HCC. Adiponectin, a key regulatory protein in glucolipid metabolism, presents potential as an anti-tumor target in HCC cells. The study focused on evaluating the anti-HCC properties of AdipoRon, an agonist of the adiponectin receptor. Method: Cell viability and proliferation were assessed using the cell counting kit-8 and colony formation assays, respectively. AdipoRon’s effect on HCC cell damage was evaluated via flow cytometry, apoptosis, and (lactate dehydrogenase) LDH assays. Mitochondrial function was evaluated by measuring mitochondrial membrane potential (MMP), ATP levels, and Complex I activity. Additionally, mitochondrial reactive oxygen species (ROS) and calcium (Ca2+) levels were analyzed using MitoSOX Red and Rhod-2 AM probes, respectively. Results: Our findings indicated that AdipoRon suppressed the proliferation of HCC cells and triggered apoptosis, with both effects being dose-dependent. Furthermore, AdipoRon caused a decrease in mitochondrial membrane potential, ATP levels, and Complex I activity, alongside the generation of mitochondrial ROS. Notably, AdipoRon disrupted intracellular Ca2+ homeostasis by causing mitochondrial Ca2+ overload due to release from the endoplasmic reticulum (ER). Additionally, AdipoRon promoted Ca2+ release from the ER by activating the PLC-IP3-IP3R pathway. The resulting mitochondrial Ca2+ overload enhances the anti-HCC effect when combined with chemotherapeutic drugs. Conclusions: Therefore, our study demonstrates that AdipoRon promotes mitochondrial Ca2+ overload and apoptosis in HCC cells by activating the PLC-IP3-IP3R signaling pathway. AdipoRon has the potential to become an effective anti-HCC drug.Keywords
Hepatocellular carcinoma (HCC) is one of the major malignancies worldwide, being the sixth most common diagnosed cancer and the third most common cause of cancer-associated fatalities [1]. China carries the greatest global burden of liver cancer, representing 42.4% of all cases worldwide [1]. The pathogenesis of HCC is multifactorial, involving liver cirrhosis, exposure to aflatoxins, prolonged alcohol consumption, viral hepatitis, metabolic disorders, and genetic predispositions [2]. Furthermore, epidemiological evidence indicates that individuals with obesity exhibit an elevated risk of developing HCC relative to the general population, particularly in cases associated with non-alcoholic cirrhosis and non-alcoholic fatty liver disease (NAFLD) [3,4]. Obesity may also induce insulin resistance and provoke inflammatory processes, both of which contribute to aberrant hepatocyte proliferation and malignant transformation [5].
Adiponectin, a hormone secreted by adipocytes, exhibits a significant inverse correlation with obesity [6]. In individuals with obesity, reduced adiponectin concentrations further aggravate metabolic dysfunctions, thereby perpetuating a deleterious feedback loop [7]. This association is predominantly mediated through mechanisms involving the regulation of insulin sensitivity, suppression of inflammatory processes, and modulation of lipid metabolism [7,8]. Emerging evidence indicates that the relationship between adiponectin and hepatic diseases depends on the underlying cause, whether metabolic or viral [9]. In metabolic disorders like NAFLD and non-alcoholic steatohepatitis (NASH), adiponectin levels are usually reduced [10]. Conversely, viral hepatitis and autoimmune liver diseases are characterized by elevated adiponectin concentrations [11–14]. Notably, elevated adiponectin in hepatitis virus-infected patients is consistently linked to a higher risk of primary HCC [9,15,16]. Among HCC patients, higher serum adiponectin is associated with poorer prognosis [17,18]. However, some studies reported that lower adiponectin correlates with more advanced tumor stages and higher histopathological grades [19,20].
Laboratory studies have revealed that full-length adiponectin counteracts the proliferation, migration, and invasion of HCC cells triggered by leptin [21]. Furthermore, Leptin-stimulated HepG2 cell proliferation is notably suppressed by the globular form of adiponectin via modulation of cell cycle progression and apoptosis [22]. At the mechanistic level, full-length adiponectin substantially inhibits HCC growth, angiogenesis, and metastasis via downregulation of the ROCK/IP10/MMP9 signaling pathway [23]. Importantly, virus-mediated overexpression of adiponectin has been shown to effectively impede HCC tumor growth [23].
AdipoRon serves as an orally available small-molecule agonist targeting adiponectin receptors, specifically binding to AdipoR1 and AdipoR2 [24]. It also acts as an activator of key signaling pathways, including AMP-activated protein kinase (AMPK) and peroxisome proliferator-activated receptor alpha (PPARα) [24]. Previous research has demonstrated that AdipoRon exerts anti-obesity [24], anti-diabetic [25], and cardioprotective properties [26]. Additionally, several studies have reported its efficacy in mitigating ionizing radiation-induced hepatic injury [27], metabolic dysfunction-associated fatty liver disease (MAFLD) [28], and NASH [29]. Moreover, AdipoRon has shown promising antineoplastic effects across a range of malignancies, including ovarian [30], pancreatic [31,32], endometrial [33], and colorectal cancers [34]. Nonetheless, its impact on HCC cells remains unexplored.
Consequently, the present study aims to elucidate the potential effects and underlying molecular mechanisms of AdipoRon in HCC cells.
AdipoRon was purchased from Adooq Bioscience (Cat No. A13768; Irvine, CA, USA). The Ca2+ chelator 1,2-bis-(o-aminophenoxy)ethane-N,N,N′,N′-tetraacetic acid tetrakis (acetoxymethyl) ester (BAPTA-AM, Cat No. HY-100545), nifedipine (Cat No. HY-B0284), mibefradil dihydrochloride (Cat No. HY-15553A), dantrolene (Cat No. HY-12542), oxaliplatin (Cat No. HY-17371), Ruthenium red (Cat No. HY-103311), U-73122 (Cat No. HY-13419), 2-Aminoethyl diphenylborinate (2-APB, Cat No. HY-W009724), and 5-Fluorouracil (5-FU, Cat No. HY-90006) were obtained from MCE (Monmouth Junction, NJ, USA).
The human HCC cell lines HepG2 (CL-0103) and Huh-7 (CL-0120) were procured from Procell (Wuhan, China). Cell lines were tested to be free of mycoplasma contamination. Dulbecco’s Modified Eagle Medium (DMEM, Cat No. 12800017) and Minimum Essential Medium (MEM, Cat No. 41500034) powders were obtained from Gibco (Grand Island, NY, USA), and the culture media were prepared and sterilized through vacuum filtration (FPE204000, JET Biofil, Guangzhou, China) before use. The complete media containing 10% fetal bovine serum (CTCC-002-001, Zhejiang Meisen CTCC, Hangzhou, China) and 1% penicillin-streptomycin (PB180120, Procell). For experimental assays, cells were utilized during the exponential growth phase, at approximately 70% to 80% confluence. Cells were maintained at 37°C in a humidified incubator with an atmosphere of 5% CO2 and 95% air.
3000 log-phase cells were seeded into 96-well plates (CCP06-096, Bioland, Hangzhou, China) at a volume of 100 μL per well. Following cell adhesion, treatments with AdipoRon were administered at concentrations of 0, 10, 20, 40, 80, and 160 μmol/L. Each concentration was tested in quintuplicate wells. To mitigate edge effects, 100 μL of PBS was placed in the edge wells of each plate. Following a 72-h incubation, 10 μL of CCK-8 solution (C6005, NCM Biotech, Suzhou, China) was added to each well, followed by an additional incubation of 1 to 2 h. A microplate reader (Epoch 2, BioTek, Winooski, VT, USA) was used to measure absorbance at 450 nm. Cell viability was determined according to the formula: Cell viability (%) = (experiment value − blank value)/average (control value − blank value) × 100%. The entire procedure was conducted in triplicate to ensure reproducibility.
A density of 1000 viable cells per well was seeded into 12-well plates (CCP06-012, Bioland). Experimental groups were exposed to varying concentrations (10, 20, and 40 μM) of AdipoRon, whereas the control group was given equal culture medium. Following a 24-h incubation, the cells were maintained in complete medium for an additional 10 days after the culture medium was removed. Then, cell colonies were stained using crystal violet for 10 min after washing twice with PBS and fixing with 4% paraformaldehyde for 10 min. The culture dishes were washed twice with PBS and then air-dried. A transparent sheet with a grid was placed over the dishes, and the number of clones containing more than 50 cells was counted under a low-power microscope (Leica DMi1, Lecia, Weztlar, Germany). The resulting data were analyzed by comparing treated groups to untreated controls.
2.5 Lactate Dehydrogenase (LDH) Assay
LDH is an intracellular enzyme ubiquitously present in cells, and its extracellular release serves as an indicator of cell membrane integrity and the degree of cellular damage. In this study, LDH activity in the culture medium was quantified utilizing an LDH cytotoxicity detection kit (E-BC-K771-M, Elabscience, Wuhan, China) employing the WST-8 assay method. 1 × 10⁴ log-phase cells were seeded into 24-well plates (CCP06-024, Bioland). Following the manufacturer’s protocol, four experimental groups were established: an AdipoRon treatment group (cells treated with 20, 40, and 80 μM), a total LDH group (cells treated with LDH release reagent), a negative control group (cells cultured with medium only), and a blank group (medium without cells). Post-treatment, the culture medium supernatant was mixed with the LDH detection working solution at a 1:1 volume ratio. After incubating for 20 min and adding the stop solution, the absorbance was measured at 450 nm in a microplate reader (Epoch 2, BioTek). The cytotoxicity calculation formula: Cytotoxicity (%) = [(sample OD − untreated control OD)/(total LDH OD − untreated control OD)] × 100%.
Log-phase cells were harvested and prepared as a single-cell suspension, and then 1 × 10⁵ cells were added to 6-well plates (CCP06-006, Bioland). Following cell adhesion, the cultures were treated with 40 μM and 80 μM AdipoRon, alongside a blank control group. Upon completion of the 72-h incubation at 37°C, the cells were washed twice with cold PBS, enzymatically detached using trypsin without EDTA, and centrifuged at 300× g for 5 min at 4°C to pellet the cells, and subsequently resuspended in 200 μL of binding buffer. Apoptosis was examined according to the protocol provided with the Annexin V-PE/7-AAD detection kit (E-CK-A216, Elabscience). 5 μL of Annexin V-PE reagent and 5 μL of 7-AAD reagent (100 μg/mL) were added to the 100 μL cell suspension. After gentle vortex mixing, the mixture was incubated at room temperature in the dark for 15 to 20 min. Apoptotic cells were finally assessed via DxP Athena flow cytometry (Cytek Biosciences, Fremont, CA, USA). Approximately 10,000 cells were collected for analysis, and the apoptosis rate was calculated using FlowJo software version 10.8.1 (FlowJo, Ashland, OR, USA).
2.7 Measurement of Mitochondrial Membrane Potential (MMP) and ROS
Cells were plated in black 96-well plates (CCP06N-096S, Bioland) at a density of 10,000 cells per well, with each well containing 100 μL of medium. Following treatment with AdipoRon, MMP was evaluated utilizing the JC-1 fluorescent dye (C2006, Beyotime, Shanghai, China). The cells were incubated in 10 μg/mL JC-1 staining working solution at 37°C for 20 min. After washing twice with staining buffer, fluorescence measurements were conducted and analyzed using a multifunctional fluorescence microplate reader (Synergy H1, BioTek). Specifically, JC-1 monomers were detected at 488 nm excitation and 530 nm emission, while JC-1 aggregates were identified at 529 nm excitation and 590 nm emission. MMP was assessed and calculated as the fluorescence ratio of red (JC-1 aggregates) to green (JC-1 monomers).
The MitoSOX Red probe (C1049B, Beyotime) is used to detect mitochondrial ROS levels. Briefly, cells are seeded in glass-bottom culture dishes at a concentration of 1 × 10⁵ cells in 2 mL of medium and, after treatment with AdipoRon, incubated with the 100 nM MitoSOX Red staining solution at 37°C for 20 min. After washing twice with PBS, the cells are examined and imaged using a fluorescence microscope (Axio Observer 7, Zeiss, Oberkochen, Germany). Mito-Tracker Red CMXRos exhibits red fluorescence, with an excitation wavelength of 510 nm and an emission wavelength of 580 nm.
2.8 Measurement of ATP Level and Mitochondrial Complex I Activity
The ATP Assay Kit (S0026, Beyotime) and Mitochondrial Complex I Activity Assay Kit (E-BC-K834-M, Elabscience) were used to quantify intracellular ATP levels and mitochondrial Complex I enzymatic activity, respectively. 1 × 10⁵ cells per well were cultured in 6-well plates (CCP06-006, Bioland) and subsequently treated with various concentrations (20, 40, and 80 μM) of AdipoRon for 12 h. Following treatment, cells were lysed by adding 200 μL of lysis buffer per well in a 6-well plate. Cells are lysed on ice by repeatedly pipetting up and down. The lysed sample was centrifuged at 12,000× g and 4°C for 5 min to obtain the supernatant, which was used to assess ATP concentration and Complex I activity in accordance with the manufacturer’s protocols. After mixing 20 μL of supernatant with 100 μL of ATP detection working solution in an all-white 96-well plate (CCP06N-096W, Bioland), luminescence signals were detected via a chemiluminescence multifunctional microplate reader (Synergy H1, BioTek). The ATP content was calculated using the standard curve. Absorbance at 340 nm was measured using a microplate reader (Epoch 2, BioTek) to determine Complex I activity. Using a BCA assay kit (Cat No. KGP902, KeyGEN BioTECH, Nanjing, China), protein levels were measured, and all experimental results were normalized to the total protein level.
2.9 Detection of Mitochondrial Calcium
Mitochondrial calcium (Ca2+) levels in Huh-7 and HepG2 cells treated with AdipoRon were assessed utilizing the Rhod-2 AM probe (S1062S, Beyotime) labeling method. Cells were seeded into all-white 96-well plates (CCP06N-096W, Bioland) at a density of 2 × 10⁴ cells per well. Following incubation, the cells were exposed to various concentrations (20, 40 and 80 μM) of AdipoRon for one hour. Subsequently, a pre-prepared staining solution was added, gently mixed, and incubated at 37°C for 20 to 30 min. After staining, the cells were washed once with PBS, and fluorescence signals were quantified using a microplate reader (Epoch 2, BioTek). Furthermore, cells were cultured on a confocal culture dish (H805041, BaiDi Biotechnology Co., Ltd., Hangzhou, China), co-stained with 100 nM Mito-Tracker Green (C1048, Beyotime) and 5 μM Rhod-2 AM probes in the dark, and then directly visualized and imaged using fluorescence microscopy (Lecia DMi8, Lecia, Weztlar, Germany).
2.10 Detection of Inositol Trisphosphate (IP3) and Phospholipase C (PLC)
Following the protocols provided by the manufacturers of the PLC activity detection kit (BC2425, Solarbio, Beijing, China) and the IP3 assay kit (CSB-E12636h, CUSABIO, Wuhan, China), cell homogenate was centrifuged at 8000× g for 10 min at 4°C after homogenizing 1 × 10⁶ cells in 1 mL of assay buffer on ice. For the quantification of IP3, 50 μL of supernatants were incubated with 50 μL of assay reagents for 1 h at 37°C. There is no need to protect the reaction from light. Absorbance was recorded at 450 nm using a microplate reader (Epoch 2, BioTek). In the case of PLC activity measurement, 20 μL of supernatants were incubated with 100 μL of assay reagents for 30 min at 37°C. There is no need to protect the reaction from light. Absorbance was measured at 410 nm using a microplate reader (Epoch 2, BioTek). Protein concentrations were assessed using a BCA assay kit (Cat No. KGP902, KeyGEN BioTECH), and all results were normalized to the total protein level.
After lysing the cells with RIPA lysis buffer (P0013B, Beyotime), protein concentration was determined and normalized using the BCA Protein Assay Kit (P0012, Beyotime). Following protein denaturation, 20 μg of protein was loaded, subjected to electrophoresis, and transferred onto a PVDF membrane (FFP24, Beyotime). The membrane was blocked at room temperature with 5% bovine serum albumin (ST023, Beyotime) for one hour. Total PLCγ1 (28362-1-AP, ProteinTech, Wuhan, China) and phosphorylated PLCγ1 (Tyr783) (29566-1-AP, ProteinTech) antibodies were diluted 1:1000. The membrane was incubated overnight at 4°C with the primary antibody, then washed and incubated with HRP-conjugated goat anti-rabbit secondary antibody (A0208, Beyotime) at a 1:1000 dilution on a shaker at room temperature for one hour. After washing, the membrane was developed using ECL chemiluminescence (P0018AS, Beyotime) with a GelDoc XR+ system (Bio-Rad, Hercules, CA, USA), and band intensities were analyzed using ImageJ 1.53a software (NIH, Bethesda, MD, USA). The protein levels of p-PLCγ1 were analyzed by calculating the ratio of p-PLCγ1 to total PLCγ1.
Data analysis was conducted utilizing GraphPad Prism version 9 (GraphPad Software, Inc., San Diego, CA, USA). Results are expressed as mean values accompanied by their respective standard deviations (SD). For comparisons between two groups, the Student’s t-test was employed. In cases involving multiple group comparisons, one-way analysis of variance was applied, followed by Tukey’s post hoc multiple comparison test. Statistical significance was defined as a p-value less than 0.05.
3.1 AdipoRon Suppresses the Proliferation of HCC Cells and Promotes Cell Death
To investigate the effects of AdipoRon on HCC cells, we used the CCK-8 assay to assess changes in cell viability after treatment with different concentrations of AdipoRon (0, 10, 20, 40, 80, and 160 μM). As shown in Fig. 1A, treatment for 72 h resulted in a concentration-dependent inhibition of proliferation in both HepG2 and Huh7 cell lines. Nonlinear regression analysis of the dose-response data yielded half maximal inhibitory concentration (IC50) values of 43.47 μM for HepG2 cells and 35.51 μM for Huh7 cells (Fig. 1A). Furthermore, the influence of AdipoRon on the proliferative capacity of HCC cells was assessed via colony formation assays. Cells treated with 0, 10, 20, and 40 μM AdipoRon exhibited a significant, dose-dependent decrease in colony-forming ability (Fig. 1B,C). LDH release assays demonstrated a marked increase in LDH levels in the culture supernatant after 72 h of treatment (Fig. 1D), correlating positively with AdipoRon concentration, indicative of cytotoxic effects and plasma membrane damage in HCC cells. Flow cytometric analysis further revealed that AdipoRon induces apoptosis in these cells; specifically, after 72 h of treatment with 40 and 80 μM AdipoRon, apoptosis rates in HepG2 cells were 8.04% and 14.41%, respectively, with comparable rates observed in Huh7 cells (11.46% and 16.58%) (Fig. 1E). Collectively, these results indicate that AdipoRon exerts inhibitory effects on HCC cell proliferation and promotes apoptotic cell death.
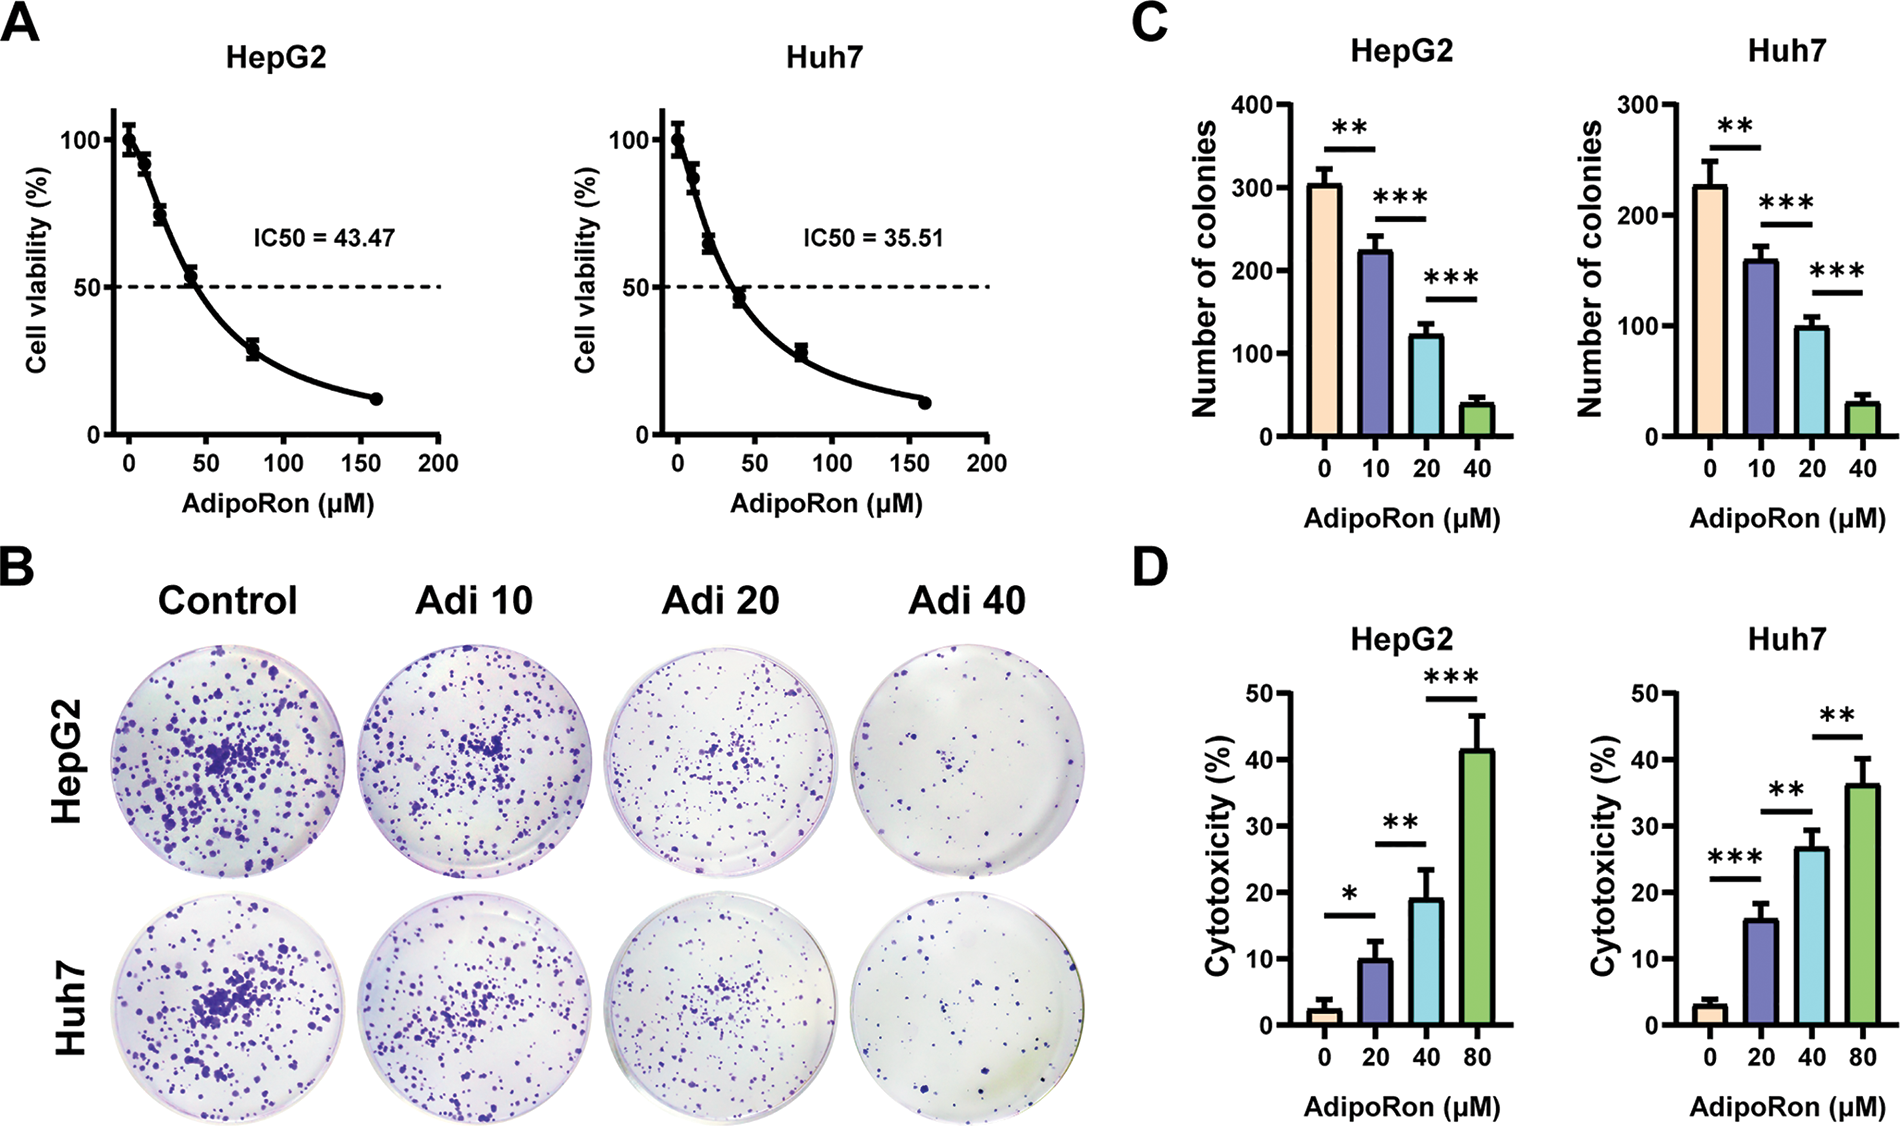
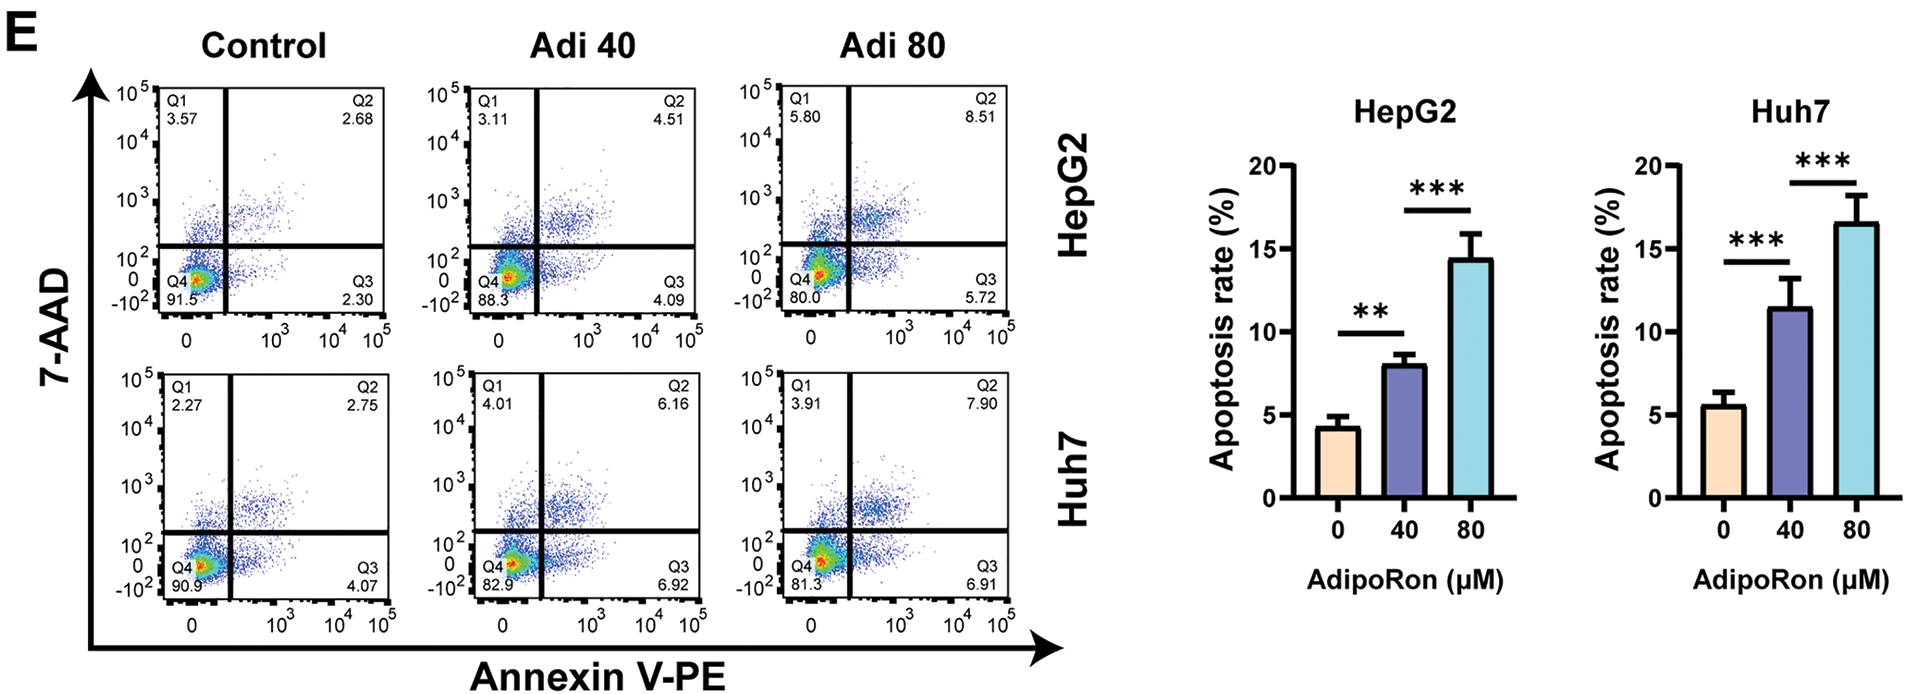
Figure 1: AdipoRon suppresses the proliferation of hepatocellular carcinoma (HCC) cells and promotes cell death. (A) HCC cell viability assay and AdipoRon half maximal inhibitory concentration (IC50) analysis. (B,C) HCC cell colony formation and statistical analysis. (D) Detection of AdipoRon-induced HCC cytotoxicity by lactate dehydrogenase (LDH) assay. (E) Flow cytometry analysis of AdipoRon-induced apoptosis in HCC cells. Data represent the mean ± SD (n = 6). *p < 0.05, **p < 0.01, ***p < 0.001
3.2 AdipoRon Induces Mitochondrial Dysfunction in HCC Cells
Mitochondria, known as the “powerhouses” of the cell, are integral not only to energy metabolism but also to the regulation of apoptosis [35]. Therefore, we analyzed the effects of AdipoRon at gradient concentrations (20, 40, and 80 μM) on mitochondrial function in HCC cells. Firstly, we monitored changes in the MMP of HCC cells using the JC-1 probe. Our observations demonstrated a progressive decline in MMP in HepG2 and Huh7 cell lines, correlating with increasing concentrations of AdipoRon (Fig. 2A). Furthermore, we quantified intracellular ATP levels and mitochondrial complex I enzymatic activity in HCC cells post-AdipoRon exposure using specific assay kits. The data revealed a significant, dose-dependent reduction in ATP content alongside a concomitant decrease in complex I activity (Fig. 2B,C). Additionally, labeling with a mitochondrial ROS fluorescent probe indicated that AdipoRon substantially elevated mitochondrial ROS production within HCC cells (Fig. 2D). Collectively, these results suggest that AdipoRon induces mitochondrial dysfunction in HCC cells.
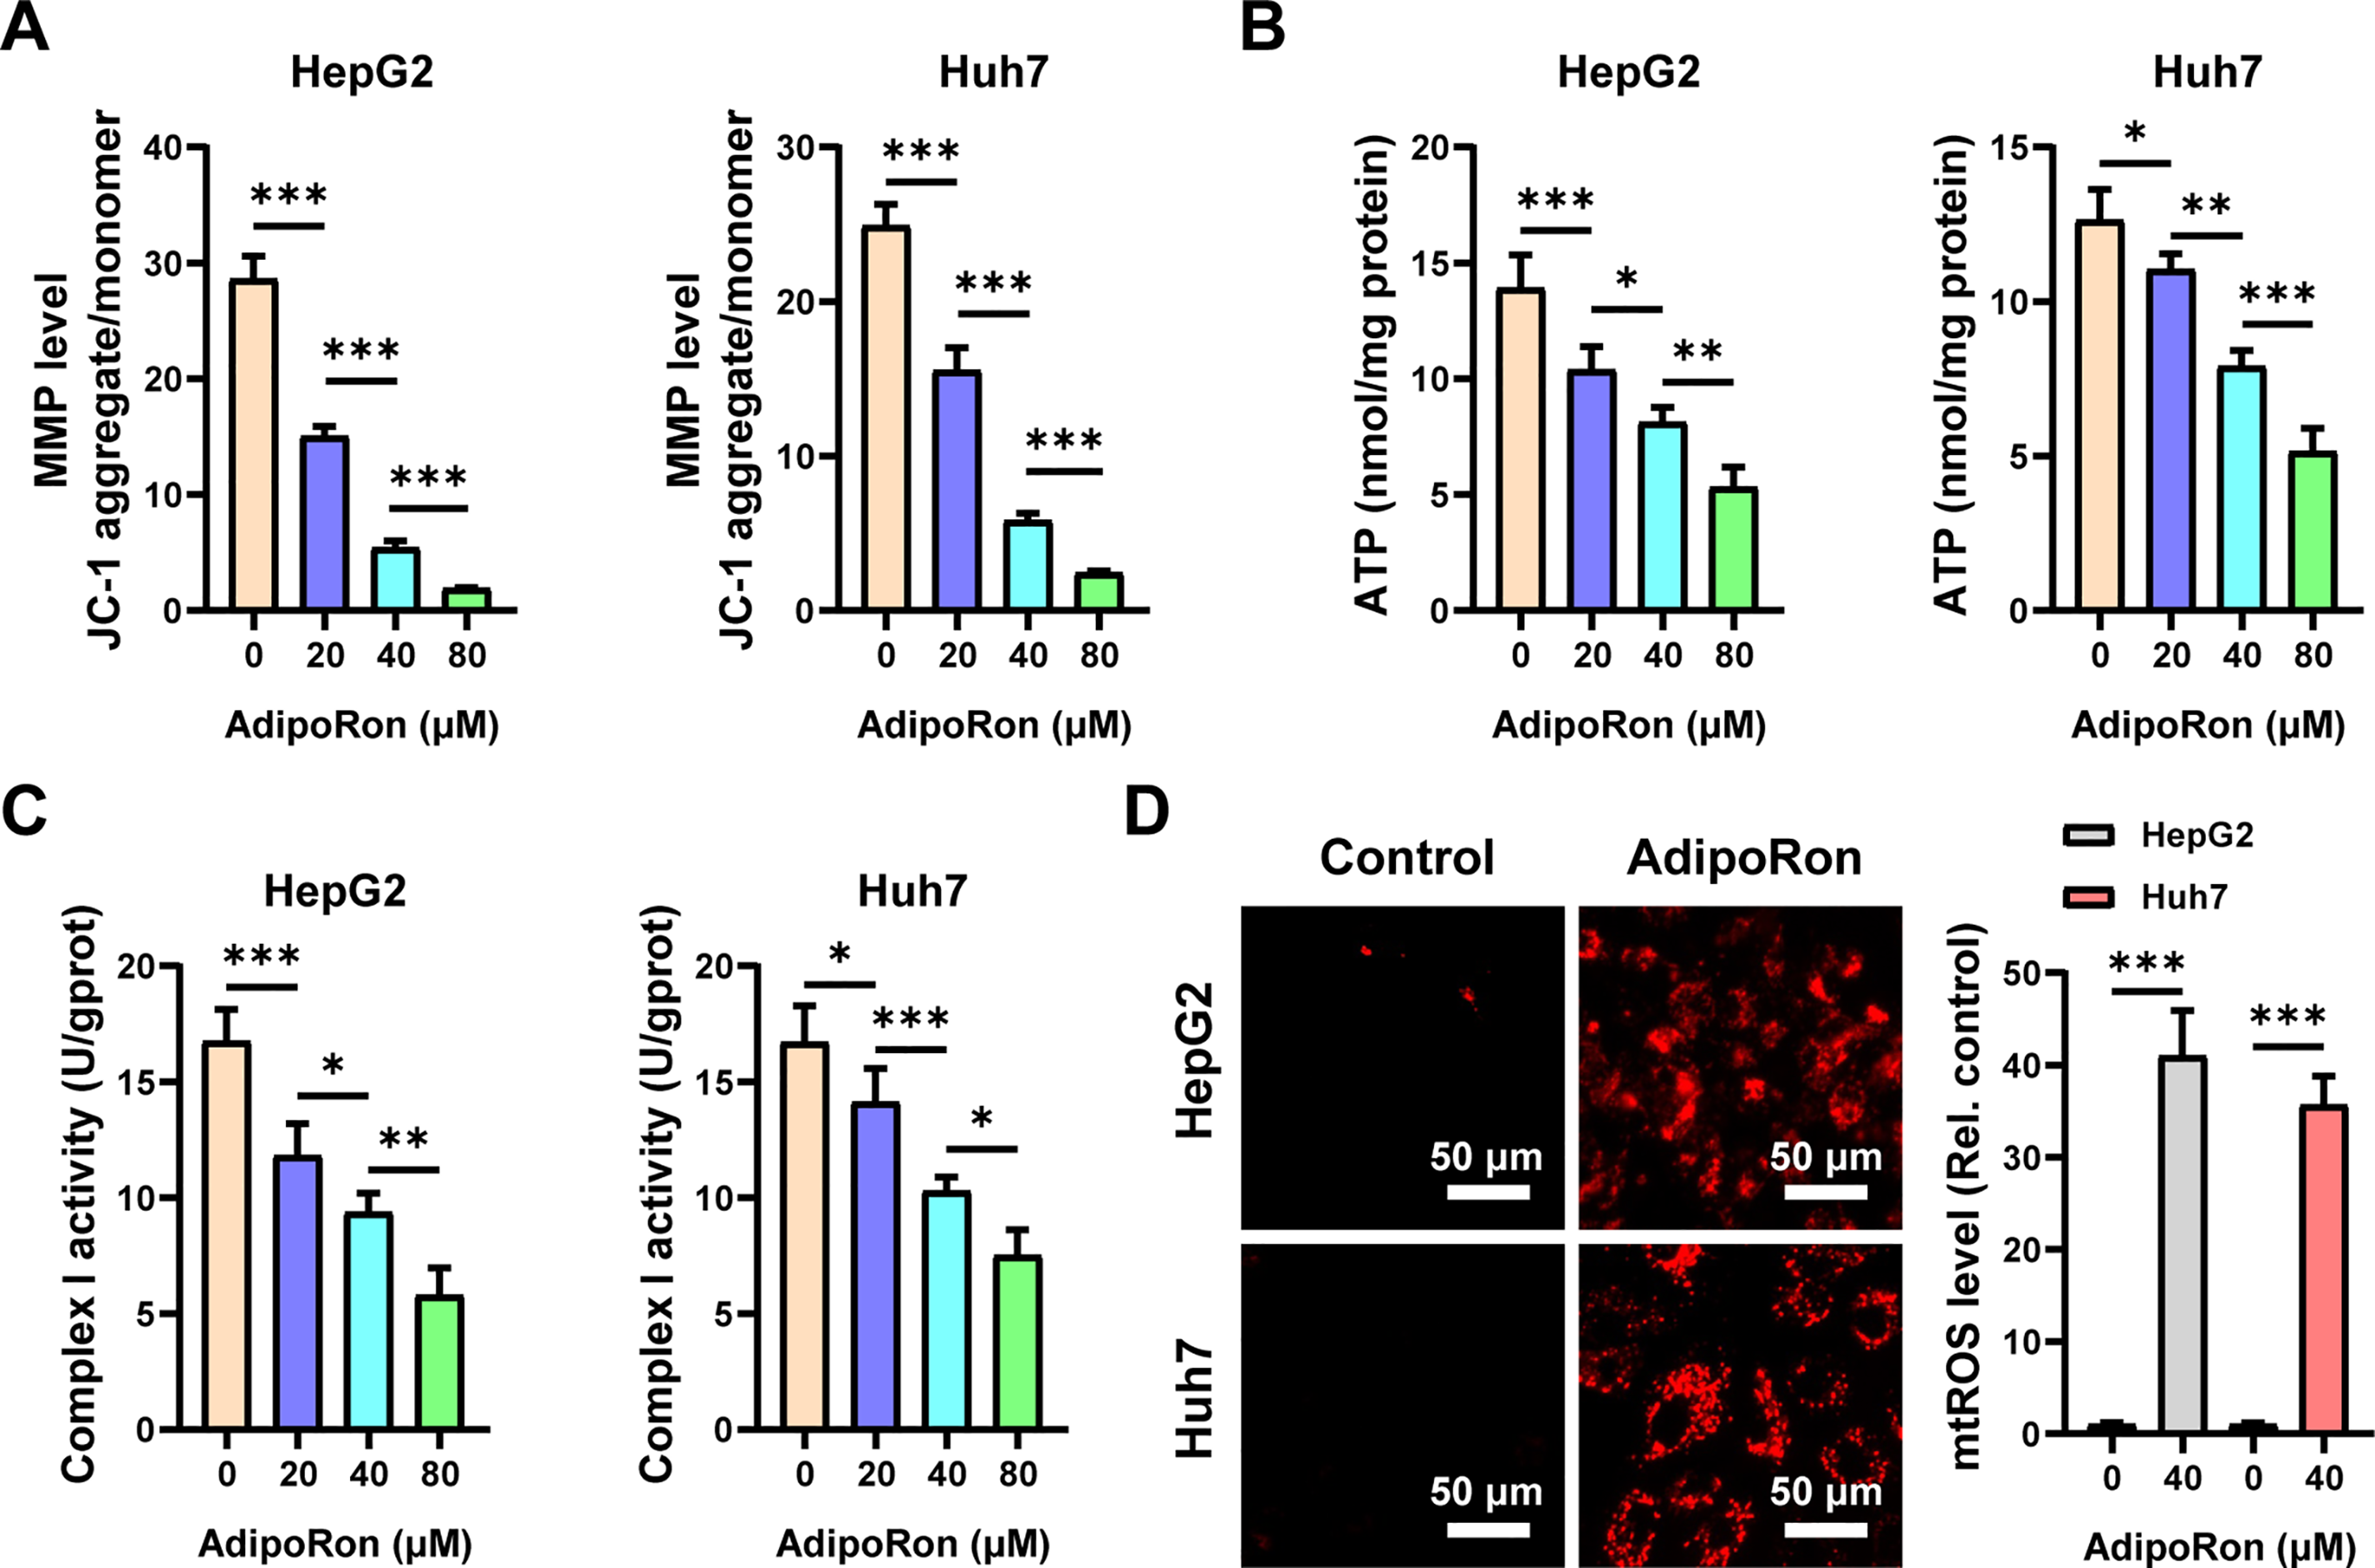
Figure 2: AdipoRon induces mitochondrial dysfunction and mitochondrial reactive oxygen species (ROS) in HCC cells. Analysis of (A) mitochondrial membrane potential (MMP), (B) ATP, and (C) Complex I activities in HCC cells exposed to 20, 40, and 80 μM AdipoRon for 12 h. (D) Detection of mitochondrial ROS in HCC cells exposed to 40 μM AdipoRon for 6 h. Scale bar: 50 μm. Data represent the mean ± SD (n = 6). *p < 0.05, **p < 0.01, ***p < 0.001
3.3 Mitochondrial Ca2+ Overload Is Involved in AdipoRon-Induced Mitochondrial Dysfunction in HCC Cells
Previous studies have shown that mitochondria regulate energy metabolism through Ca2+; however, an abnormal elevation in intracellular Ca2+ concentration prompts excessive mitochondrial Ca2+ uptake, resulting in the collapse of MMP and subsequent functional impairment [36]. We used the mitochondrial probe Mito-Tracker Green and the mitochondrial Ca2+-specific probe Rhod-2 AM to label the mitochondria and mitochondrial Ca2+ in HCC cells, respectively. Under the fluorescence microscope, mitochondria and mitochondrial Ca2+ were labeled green and red (Fig. 3A), respectively. Changes in mitochondrial Ca2+ levels were analyzed by calculating the ratio of the two fluorescence signal intensities. The results showed that mitochondrial Ca2+ levels in HCC cells increased significantly after treatment with AdipoRon (Fig. 3A). Further quantification using a fluorescence microplate reader revealed that AdipoRon induced a dose-dependent elevation of mitochondrial Ca2+ concentrations in HCC cells (Fig. 3B). Moreover, pre-treatment with the Ca2+ chelator BAPTA-AM significantly attenuated the AdipoRon-induced reductions in HCC cell viability and MMP (Fig. 3C,D), as well as mitigated AdipoRon-associated cytotoxicity (Fig. 3E). Collectively, these findings suggest that AdipoRon-induced mitochondrial Ca2+ overload contributes to mitochondrial dysfunction in HCC cells.
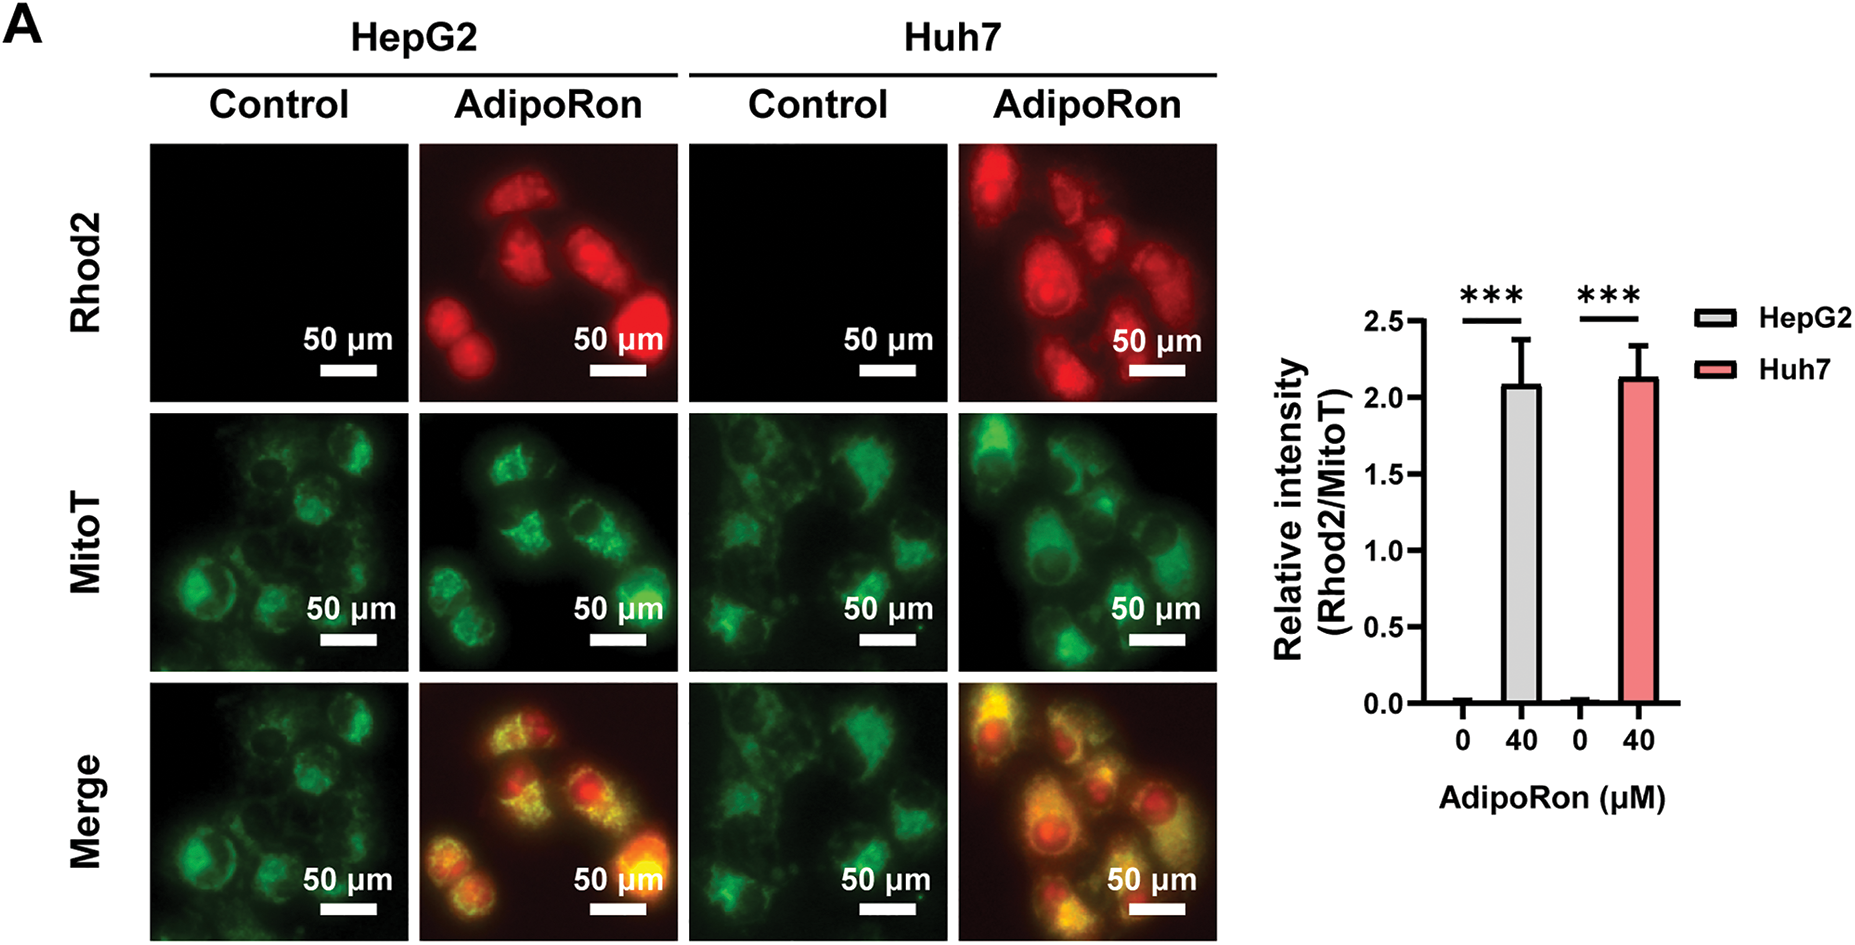
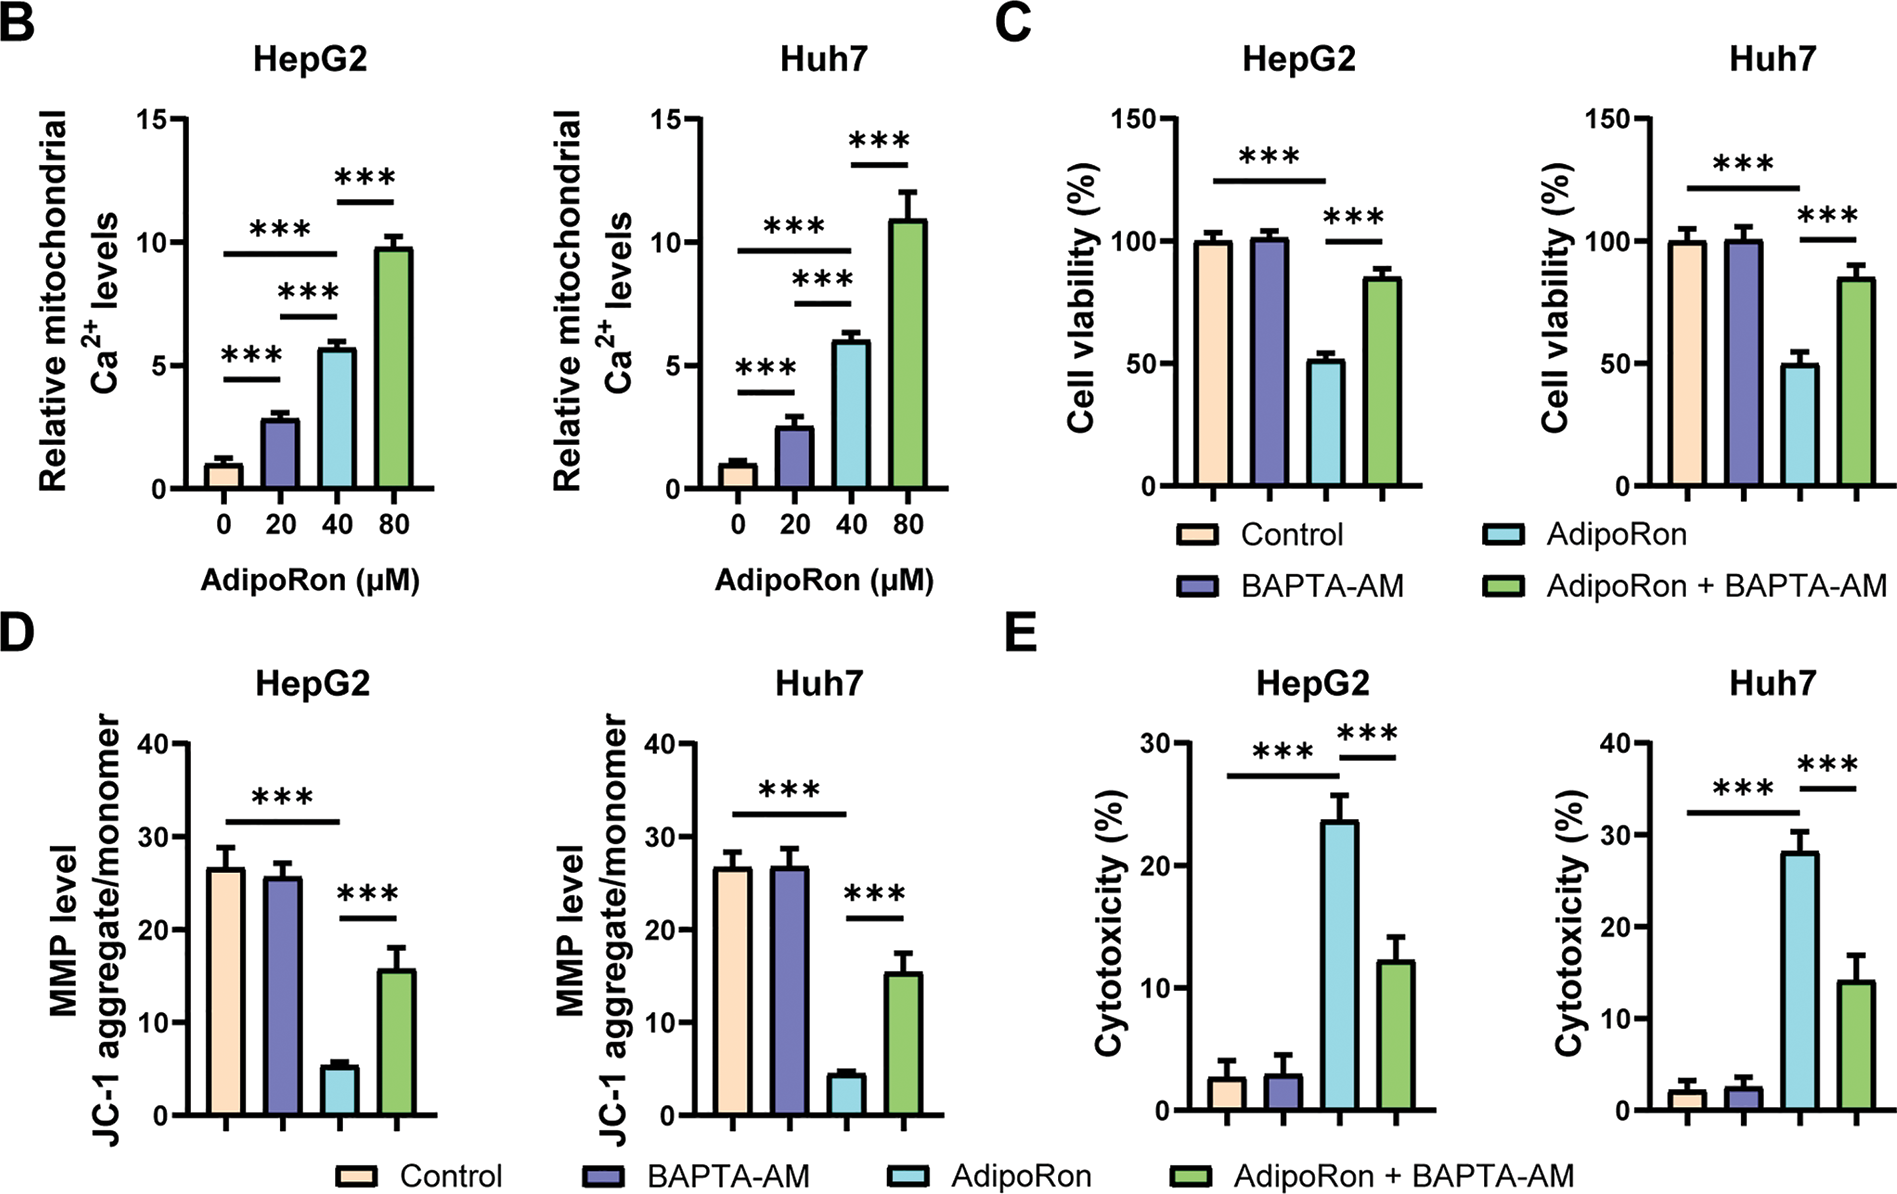
Figure 3: AdipoRon induces mitochondrial Ca2+ overload in HCC cells. (A) IF analysis of mitochondrial Ca2+ in HCC cells exposed to 40 μM AdipoRon for 1 h. Scale bar: 50 μm. (B) Detection of mitochondrial Ca2+ in HCC cells exposed to 20, 40, and 80 μM AdipoRon for 1 h using fluorescence microplate. Assessment of (C) cell viability, (D) MMP levels, and (E) cytotoxicity in HCC cells exposed to 40 μM AdipoRon, treated with or out BAPTA-AM. Data represent the mean ± SD (n = 6). ***p < 0.001
3.4 The Ca2+ Entering the Mitochondria Induced by AdipoRon Originates from Intracellular Sources
The cytosol serves as the principal reservoir of mitochondrial Ca2+, with cytosolic Ca2+ derived either from release by the endoplasmic reticulum (ER) or influx from the extracellular milieu [37]. To investigate the source of Ca2+ contributing to AdipoRon-induced mitochondrial Ca2+ elevation in HCC cells, we employed a Ca2+-free culture medium; this intervention did not alter the AdipoRon-mediated increase in mitochondrial Ca2+ levels (Fig. 4A). Furthermore, pretreatment with the T-type and L-type Ca2+ channel antagonists, Nifedipine and Mibefradil, respectively, similarly failed to modulate the AdipoRon-induced mitochondrial Ca2+ augmentation (Fig. 4B). Corresponding cell viability assessments via CCK-8 assays demonstrated that these treatments did not mitigate the reduction in HCC cell viability elicited by AdipoRon (Fig. 4C,D). In contrast, pretreatment with Ruthenium Red, a non-selective Ca2+ channel inhibitor, effectively abrogated both the AdipoRon-induced mitochondrial Ca2+ influx and the associated decline in HCC cell viability (Fig. 4E,F). Collectively, these findings suggest that the AdipoRon-stimulated mitochondrial Ca2+ influx originates predominantly from intracellular stores.
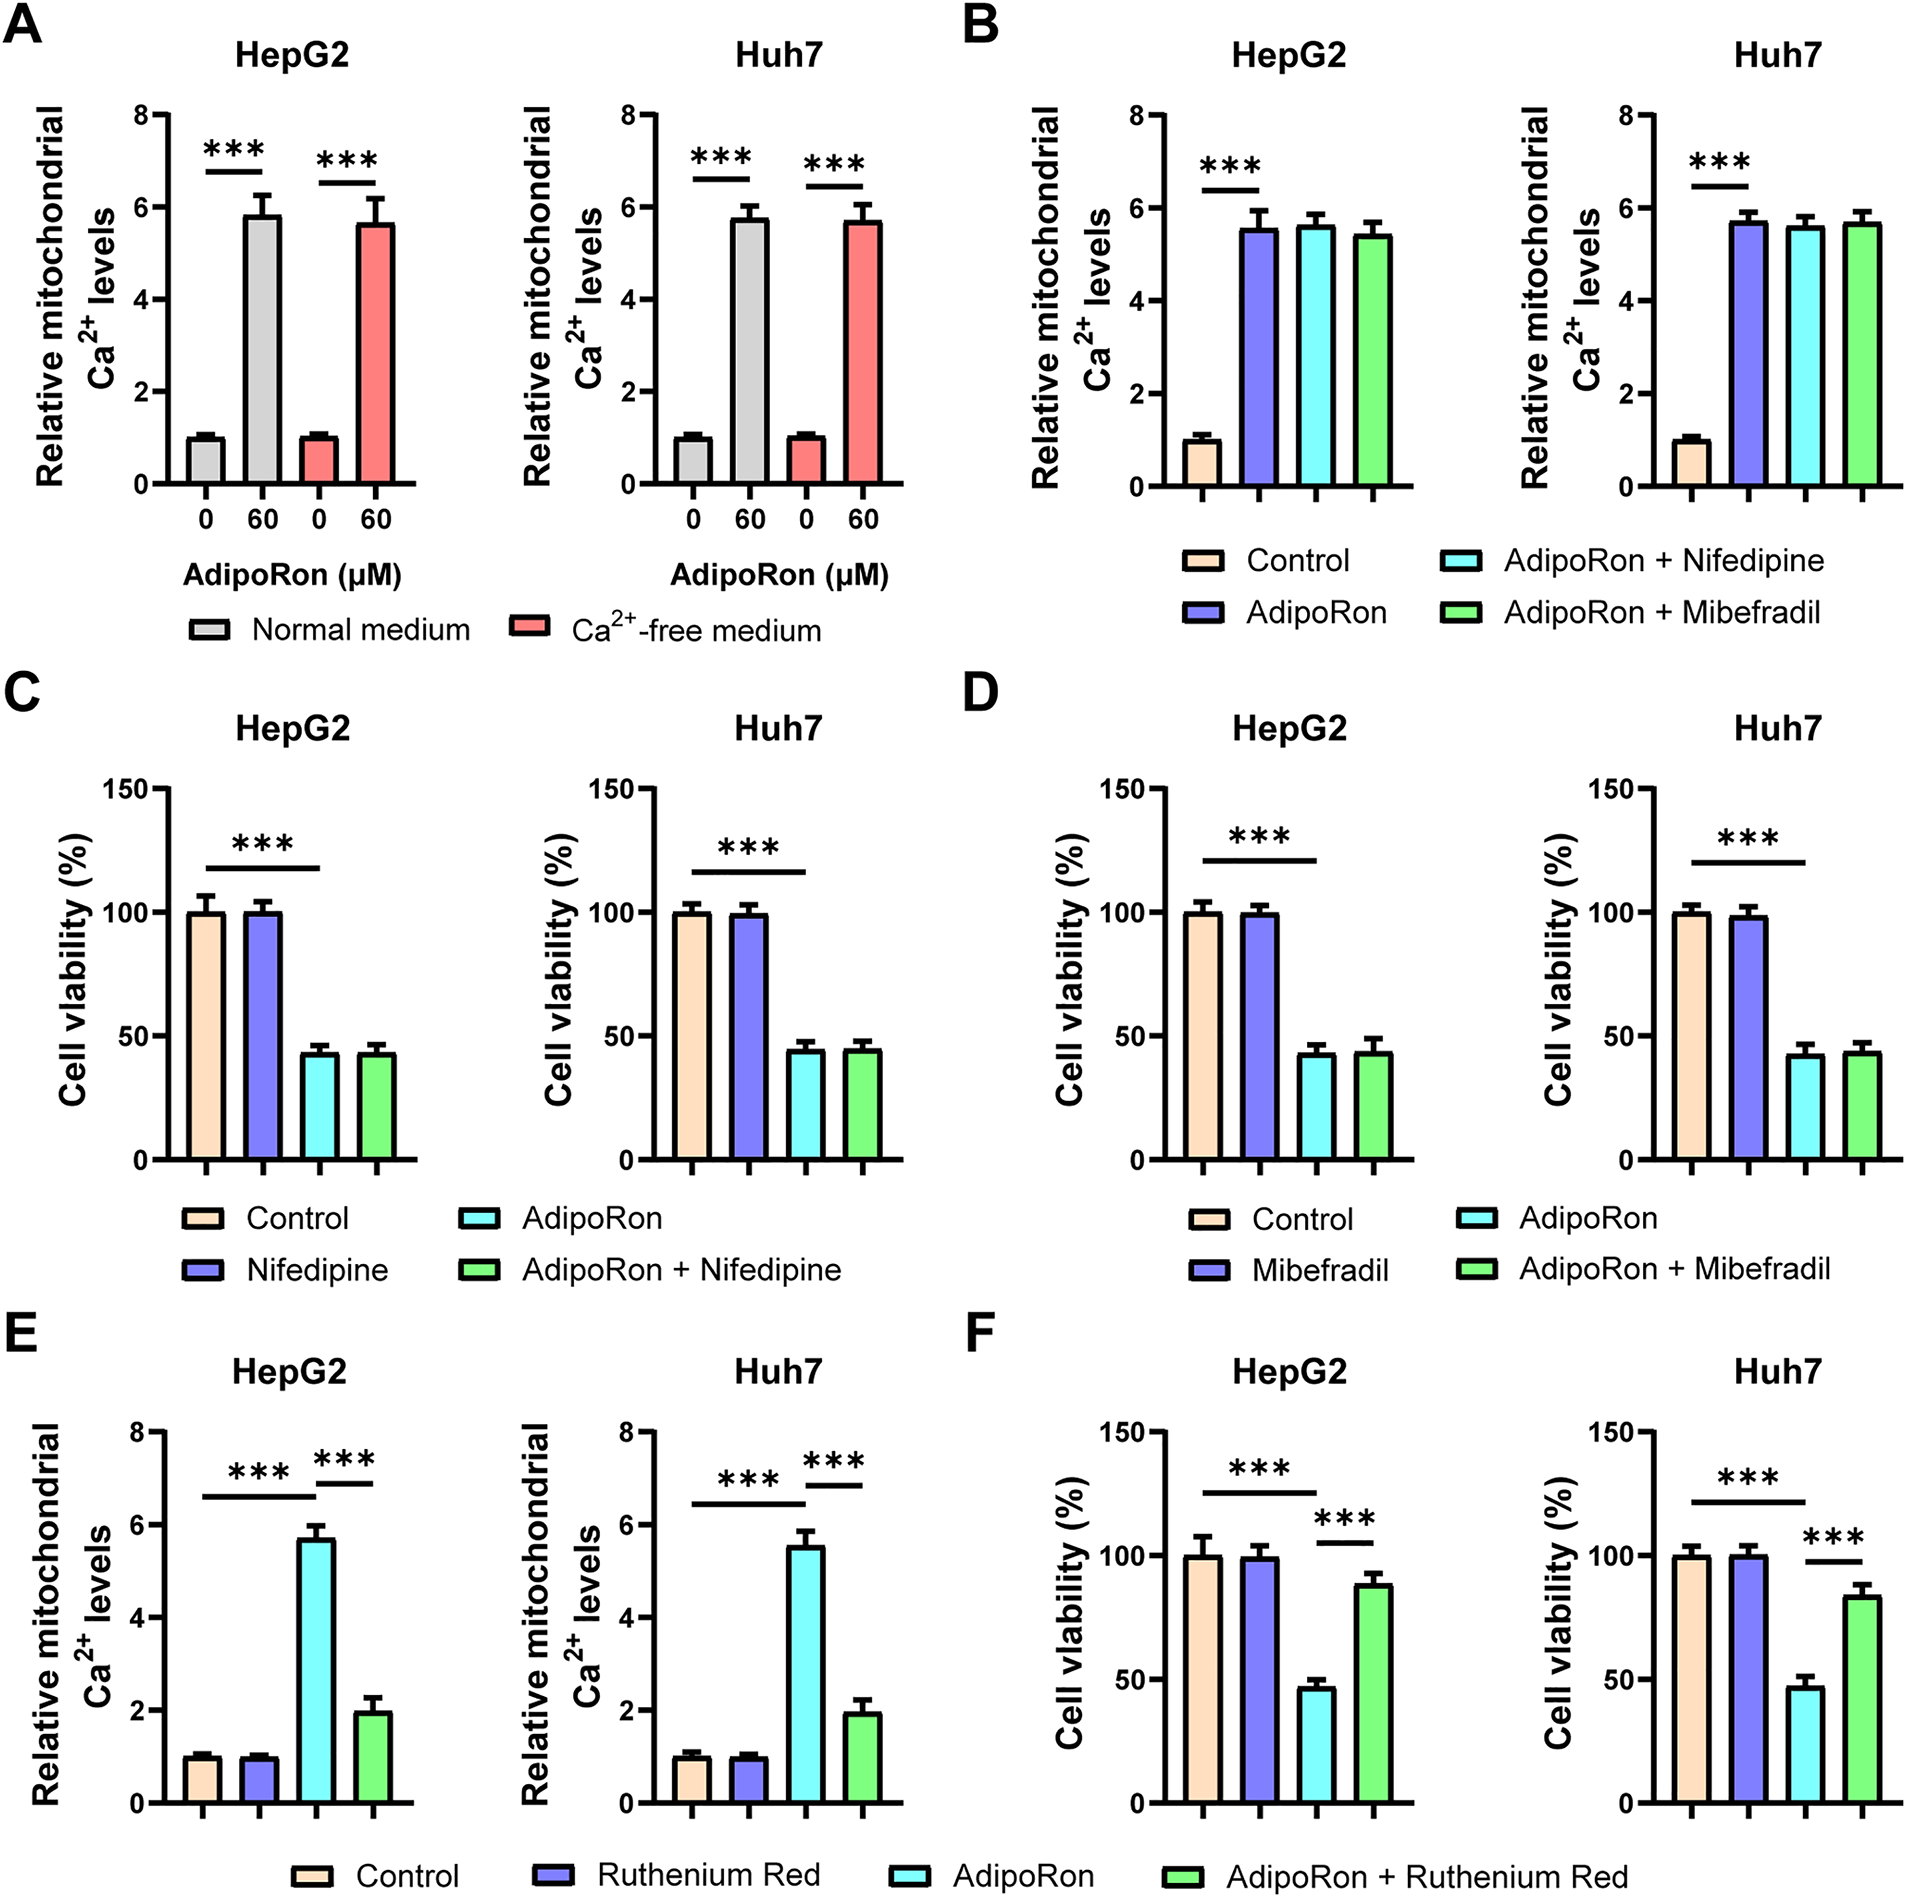
Figure 4: The Ca2+ entering the mitochondria induced by AdipoRon originates from intracellular sources. (A) Detection of mitochondrial Ca2+ in HCC cells cultured in normal or Ca2+-free medium. (B) Detection of mitochondrial Ca2+ in AdipoRon-treated HCC cells exposed to 10 μM Nifedipine or Miberfradill. (C,D) Detection of viability in AdipoRon-treated HCC cells exposed to 10 μM Nifedipine or Miberfradill. (E,F) Detection of mitochondrial Ca2+ and viability in AdipoRon-treated HCC cells exposed to 1 μM Ruthenium Red. Data represent the mean ± SD (n = 6). ***p < 0.001
3.5 AdipoRon Induces ER Ca2+ Release through the PLC-IP3-IP3R Signaling Pathway
In addition to mitochondria, the ER serves as a critical intracellular reservoir for Ca2+ [37]. Under physiological conditions, the ER predominantly facilitates the release of Ca2+ from its lumen into the cytoplasm through RyR and IP3R. To investigate the specific channels involved, cells were pretreated with RyR channel inhibitors, specifically dantrolene, as well as IP3R channel inhibitors, 2-APB. The experimental results demonstrated that 2-APB effectively inhibited the AdipoRon-induced elevation of mitochondrial Ca2+ levels, whereas dantrolene exhibited no such effect (Fig. 5A,B). Moreover, pretreatment with 2-APB attenuated the AdipoRon-mediated decrease in viability of HCC cells (Fig. 5C). These findings suggest that IP3R functions as a key receptor mediating AdipoRon-triggered Ca2+ release from the ER. Consistently, levels of IP3, the ligand responsible for IP3R activation, were significantly increased following AdipoRon treatment (Fig. 5D). Additionally, the activity of PLC, an upstream kinase in the IP3 signaling cascade, was markedly enhanced by AdipoRon (Fig. 5E). Notably, pretreatment with the PLC inhibitor U-73122 effectively abrogated the AdipoRon-induced mitochondrial Ca2+ increase (Fig. 5F). The Western blot results showed a significant increase in p-PLCγ1 protein levels following AdipoRon treatment (Fig. 5G), indicating that AdipoRon induces PLC activation. Collectively, these data indicate that AdipoRon promotes Ca2+ mobilization from the ER through the PLC-IP3-IP3R signaling pathway.
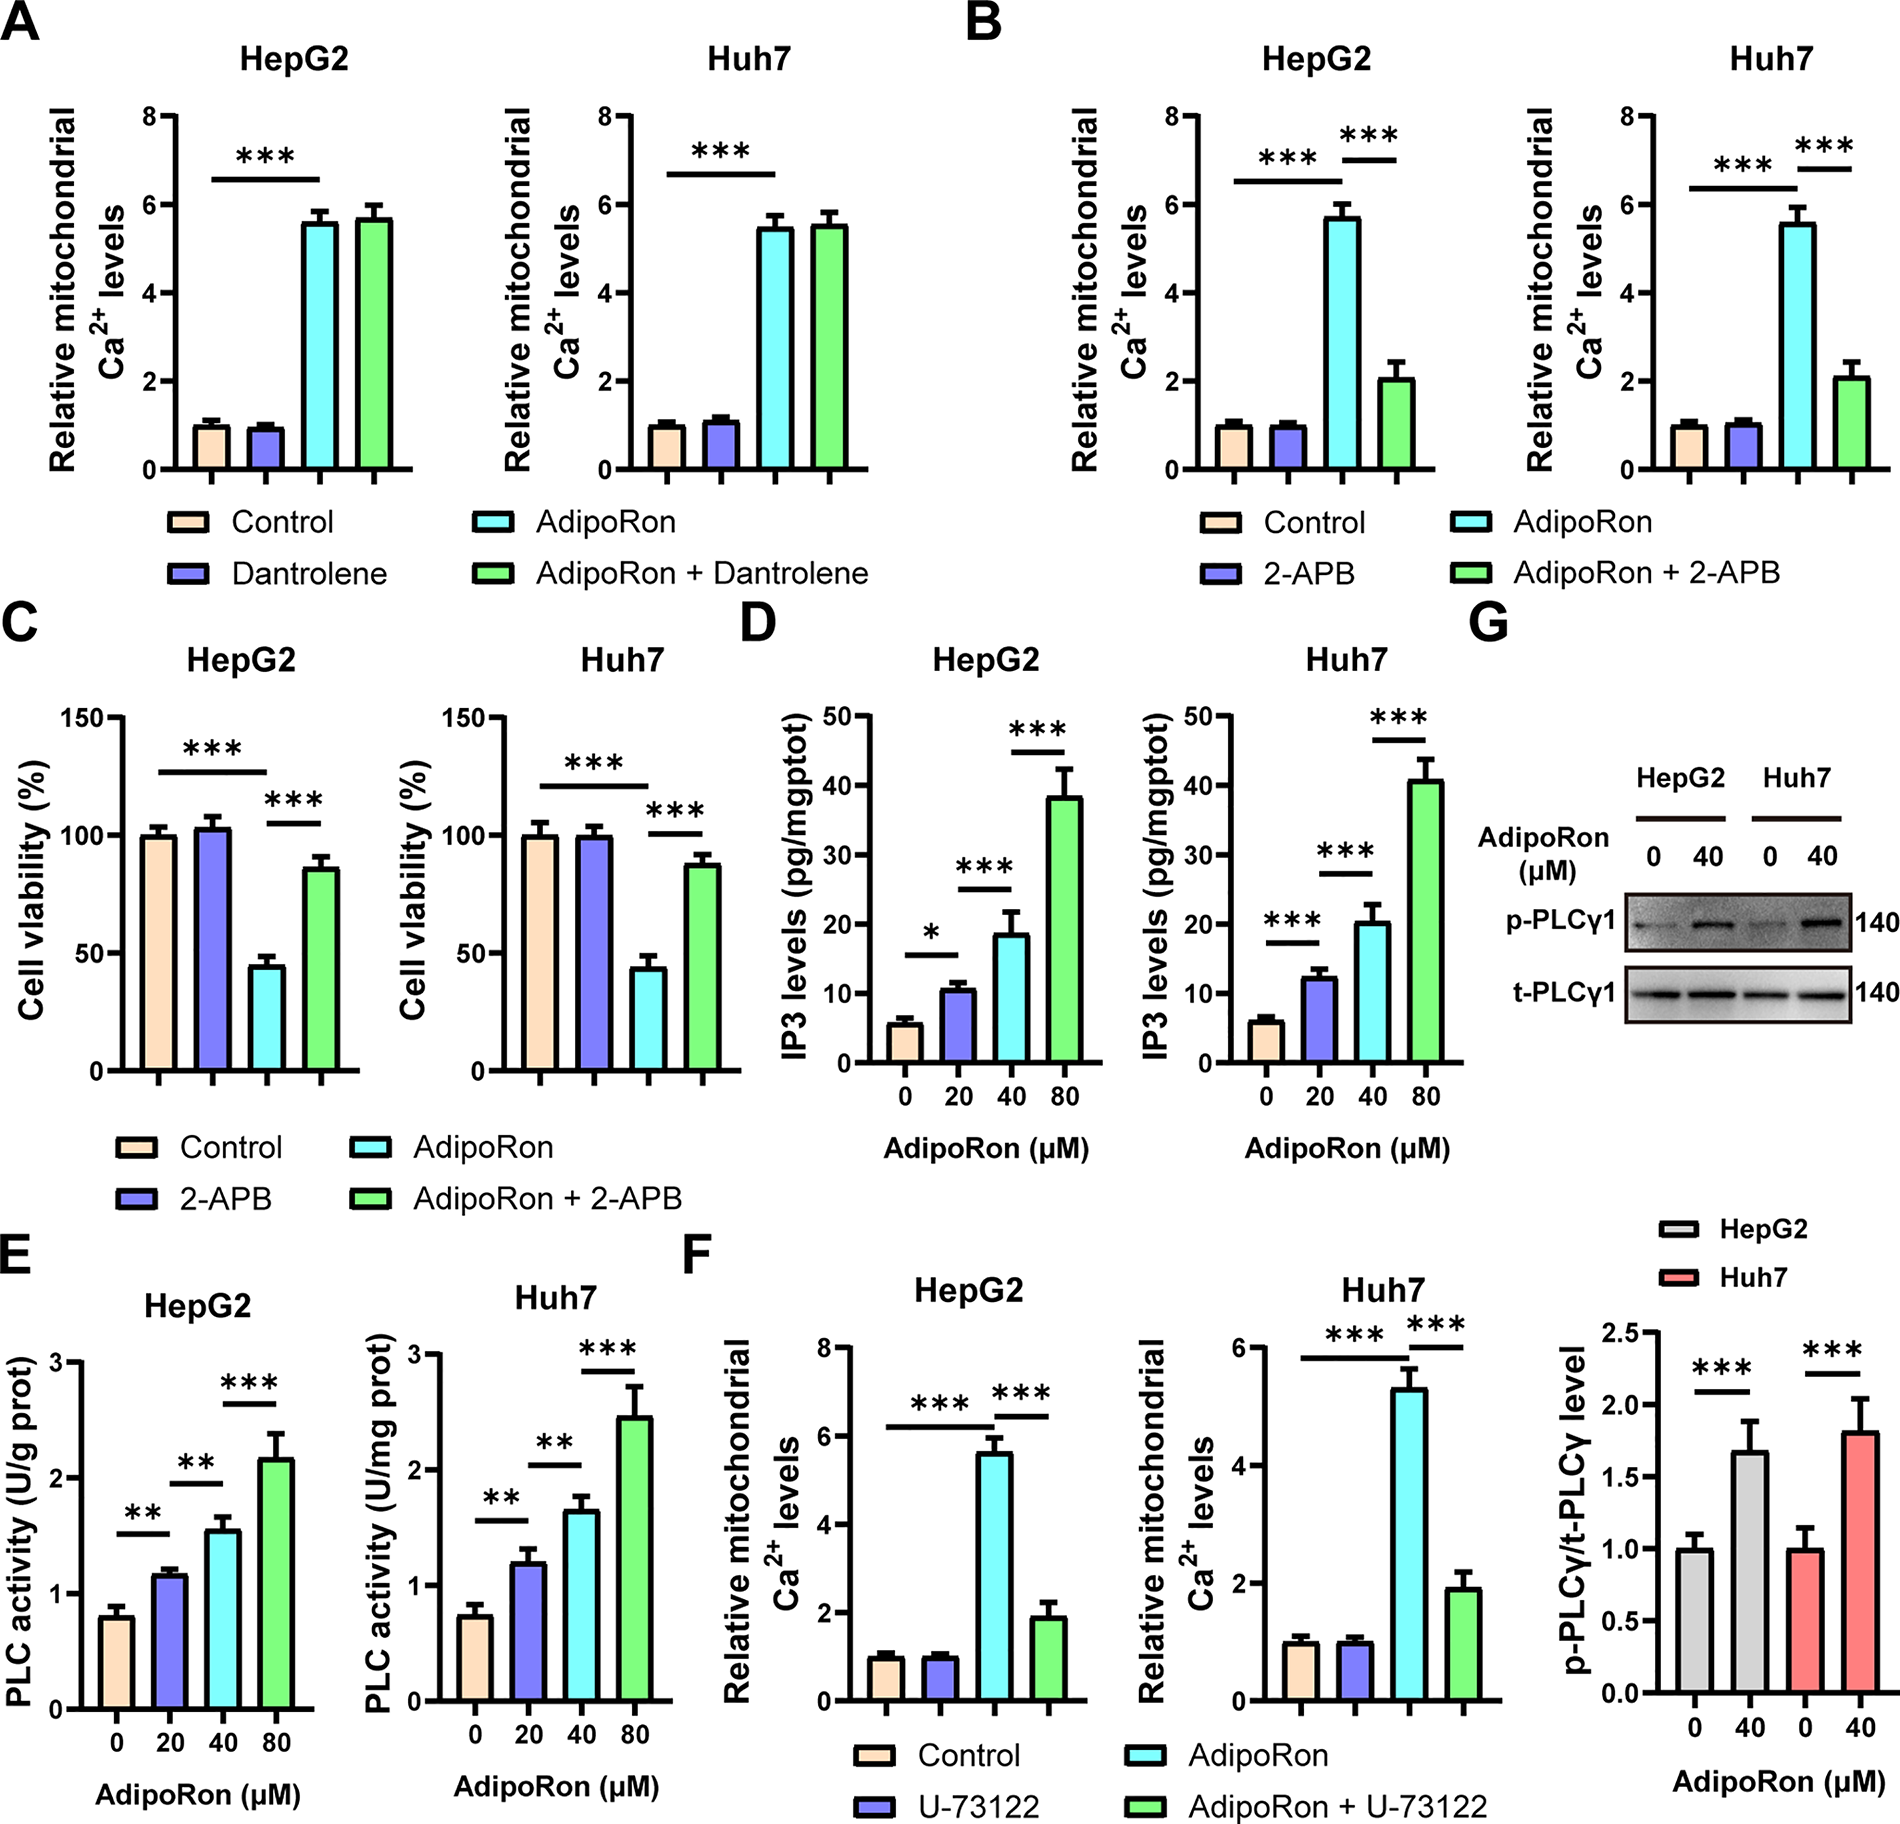
Figure 5: AdipoRon induces ER Ca2+ release through the PLC-IP3-IP3R signaling pathway. (A) Detection of mitochondrial Ca2+ in AdipoRon-treated HCC cells exposed to 10 μM Dantrolene. (B,C) Detection of mitochondrial Ca2+ and viability in AdipoRon-treated HCC cells exposed to 10 μM 2-APB. (D,E) Detection of PLC activities and IP3 levels in AdipoRon-treated HCC cells. (F) Detection of mitochondrial Ca2+ in AdipoRon-treated HCC cells exposed to 10 μM U-73122. (G) Detection the protein level of p-PLCγ1 in HCC cells treated with AdipoRon. Data represent the mean ± SD. *p < 0.05, **p < 0.01, ***p < 0.001
3.6 AdipoRon Exerts Its Anti-HCC Effects by Activating the PLC-IP3-IP3R Signaling Pathway in Synergy with Chemotherapeutic Drugs
Next, we examined the pharmacodynamic interactions between AdipoRon and the clinically prevalent chemotherapeutic agents for liver cancer, oxaliplatin and 5-FU. Initially, the IC50 values of these two drugs were determined in HepG2 and Huh7 cell lines. The findings revealed that the IC50 of oxaliplatin was 7.804 μM for HepG2 cells and 10.18 μM for Huh7 cells (Fig. 6A), while the IC50 of 5-FU was 2.657 μM and 4.359 μM for HepG2 and Huh7 cells (Fig. 6B), respectively. Following this, HCC cells were treated with combinations of AdipoRon and the chemotherapeutic agents. The results indicated that AdipoRon synergistically enhanced the reduction of HCC cell viability when administered alongside oxaliplatin and 5-FU (Fig. 6C,D). Additionally, colony formation assays demonstrated that AdipoRon, in combination with these drugs, synergistically inhibited HCC cell proliferation (Fig. 6E). Collectively, these data indicate that AdipoRon enhances the cytotoxic and antiproliferative effects of oxaliplatin and 5-FU in HCC cells.
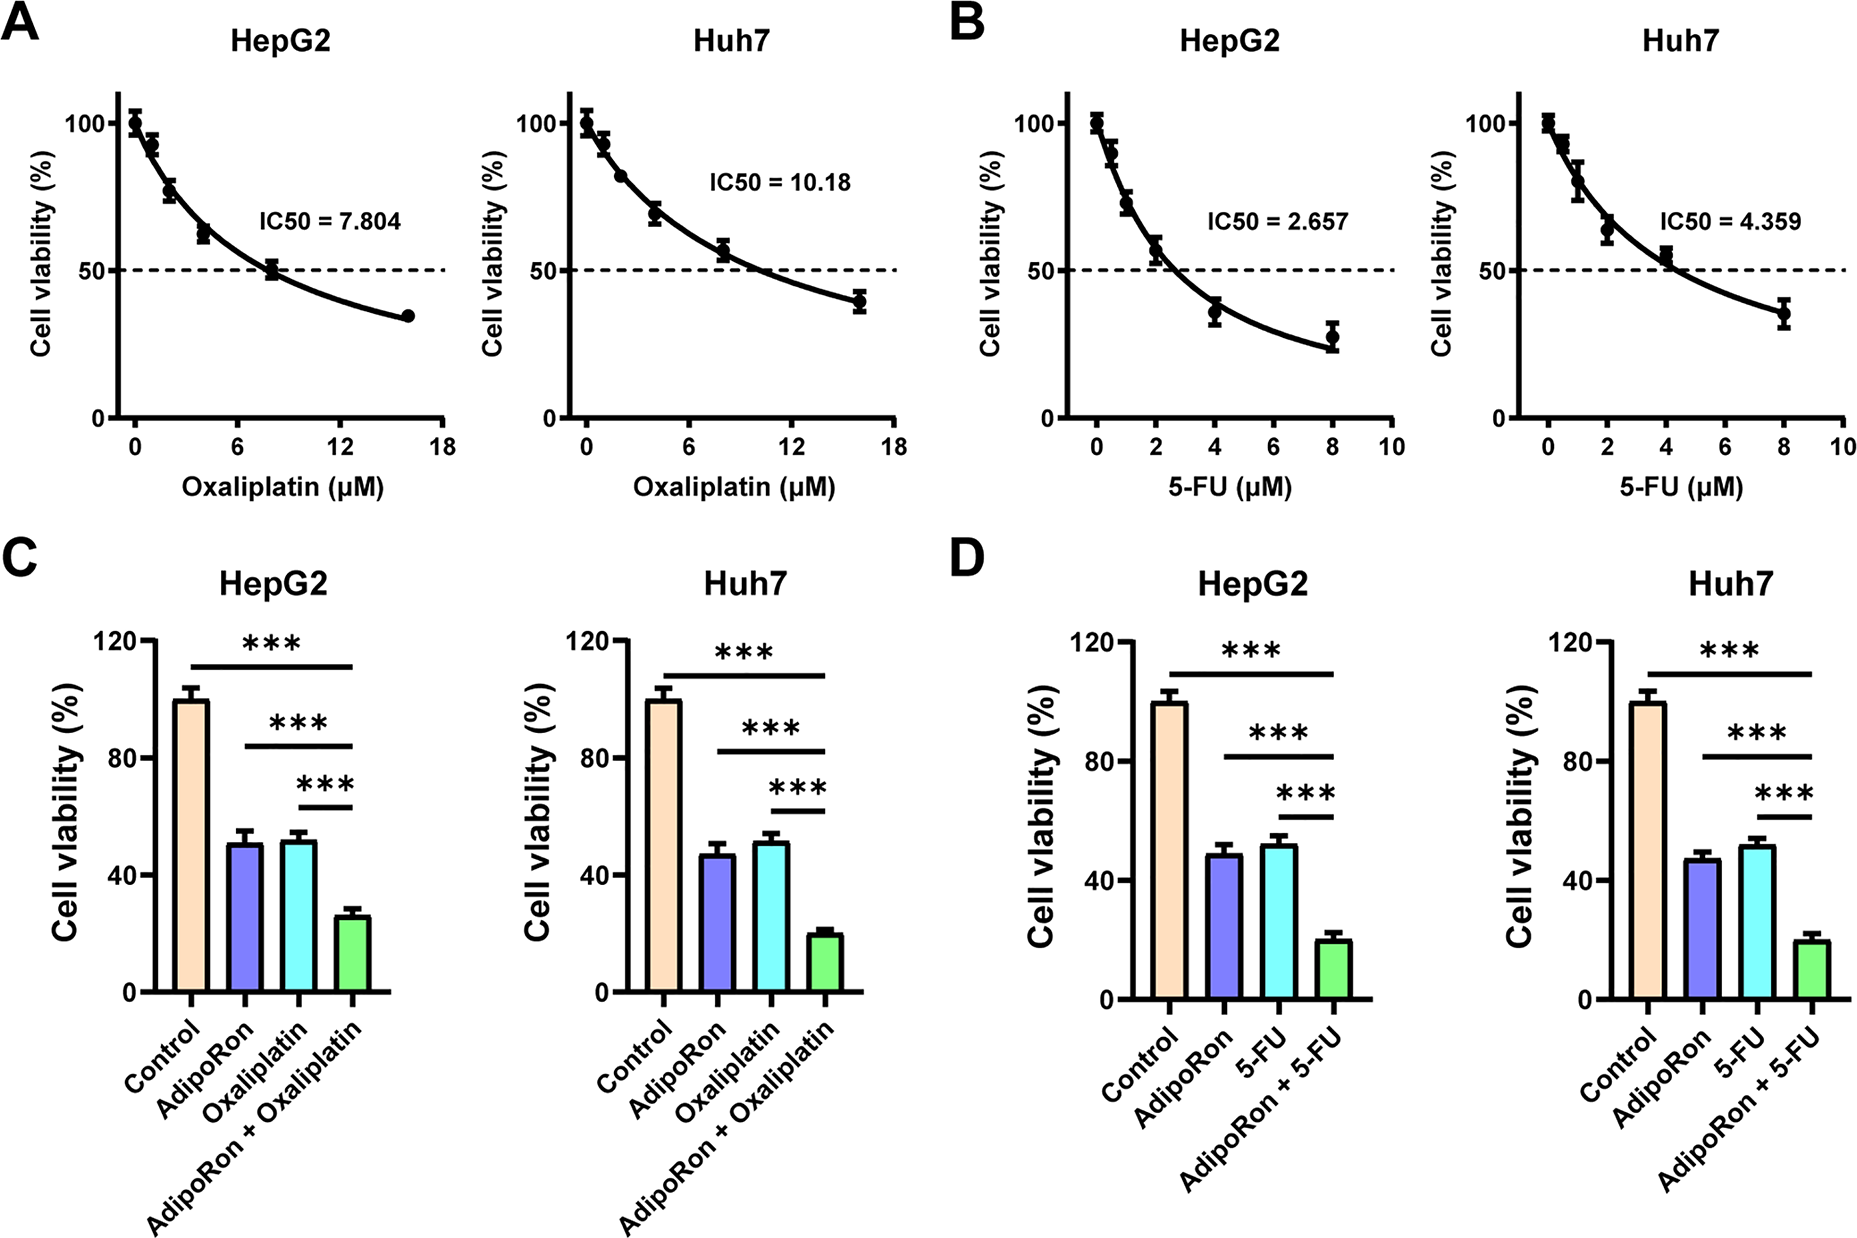
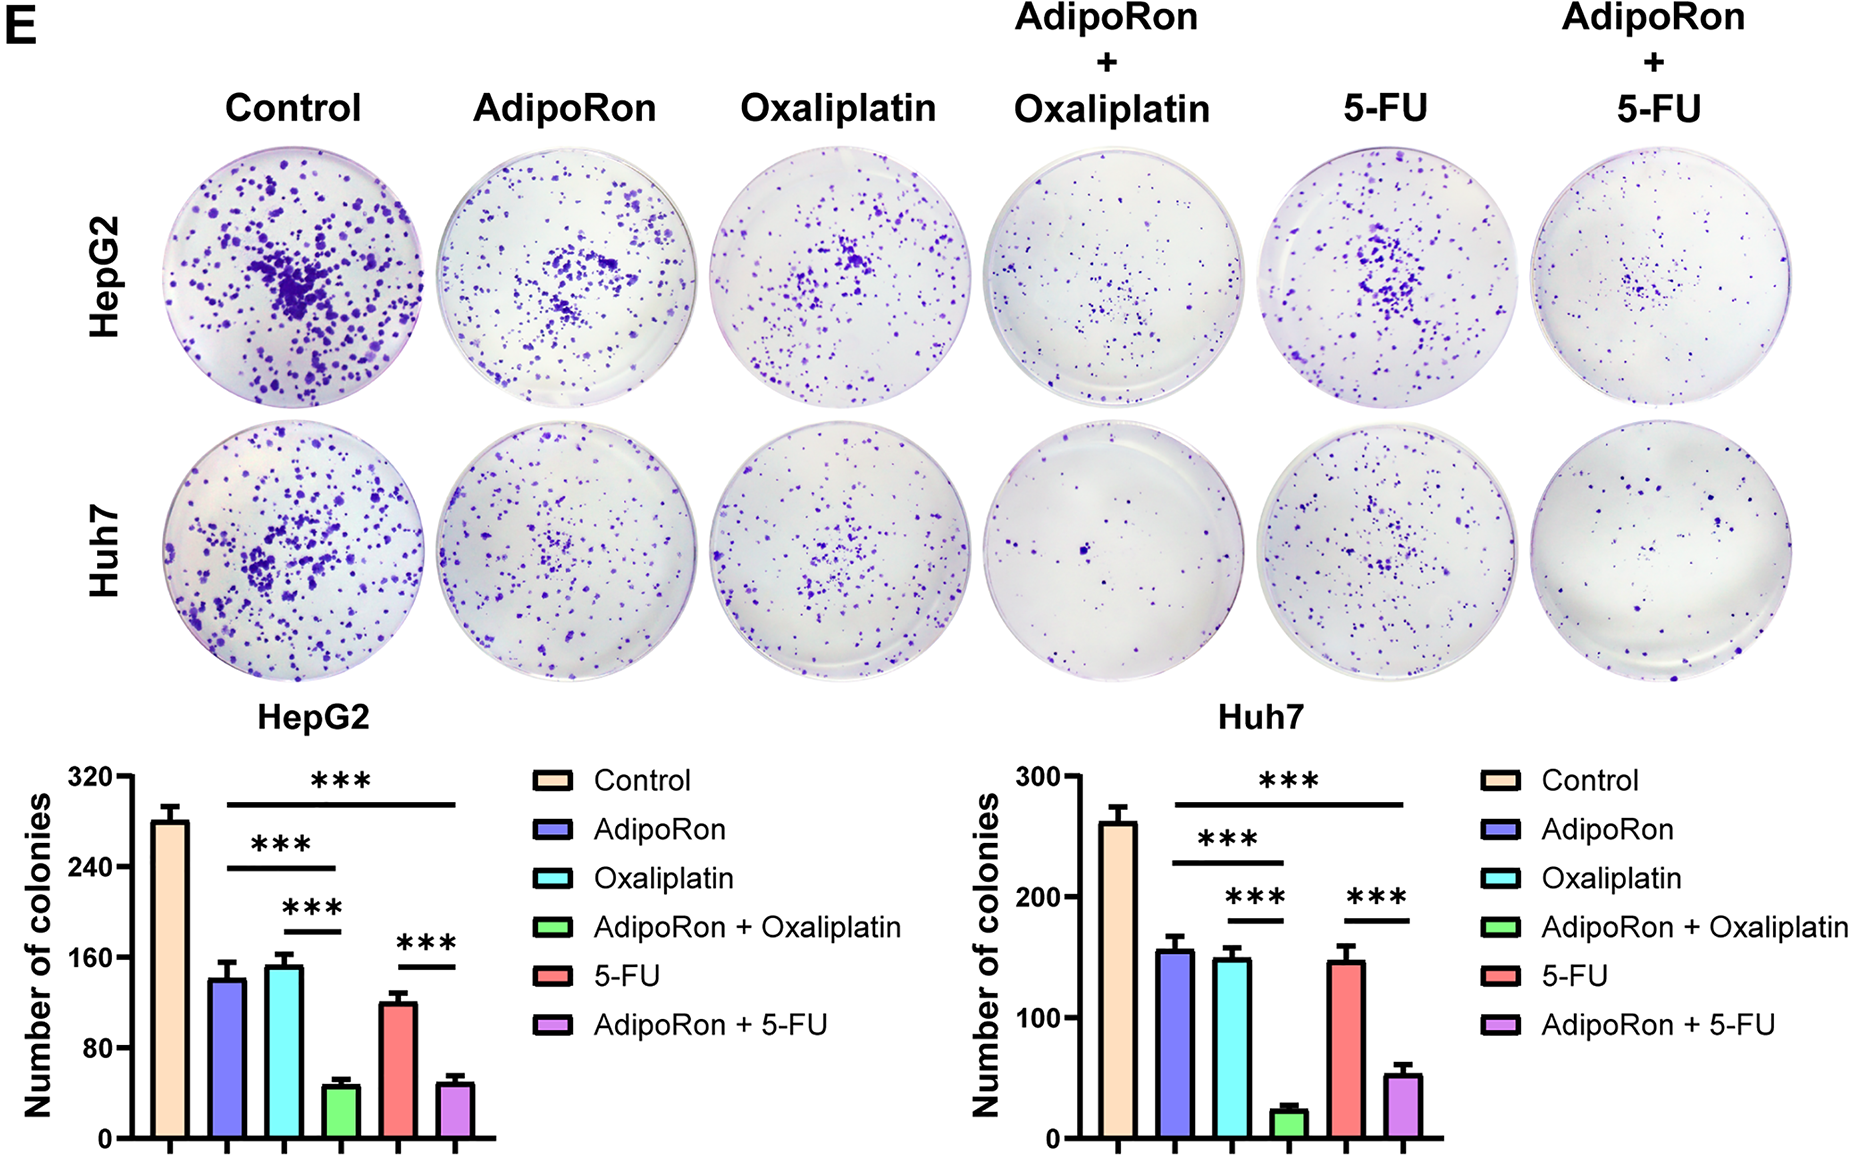
Figure 6: AdipoRon has a synergistic effect with chemotherapeutic drugs in anti-HCC cells. (A) IC50 analysis of oxaliplatin in HepG2 and Huh7 cells. (B) IC50 analysis of 5-FU in HepG2 and Huh7 cells. (C) Detection of cell viability in HCC cells exposed to AdipoRon (40 μM), oxaliplatin (10 μM), and their combinations. (D) Detection of cell viability in HCC cells exposed to AdipoRon (40 μM), 5-FU (4 μM), and their combinations. (E) Detection of colony formation in HCC cells exposed to AdipoRon (20 μM), oxaliplatin (5 μM), 5-FU (2 μM), and their combinations. Data represent the mean ± SD (n = 6). ***p < 0.001
Moreover, we investigated whether the synergistic effect of AdipoRon is mediated through the induction of mitochondrial Ca2+ overload. Cells were pretreated with 2-PAB and U-73122, and the results demonstrated that inhibition of the PLC-IP3-IP3R signaling pathway abrogated the synergistic decrease in HCC cell viability observed with the combination of AdipoRon and chemotherapeutic agents (Oxaliplatin and 5-FU) (Fig. 7A,B). Correspondingly, this blockade also prevented the combined suppression of HCC cell proliferation (Fig. 7C). These findings suggest that AdipoRon enhances the anti-cancer efficacy of chemotherapeutic drugs against liver cancer by activating the PLC-IP3-IP3R signaling pathway.
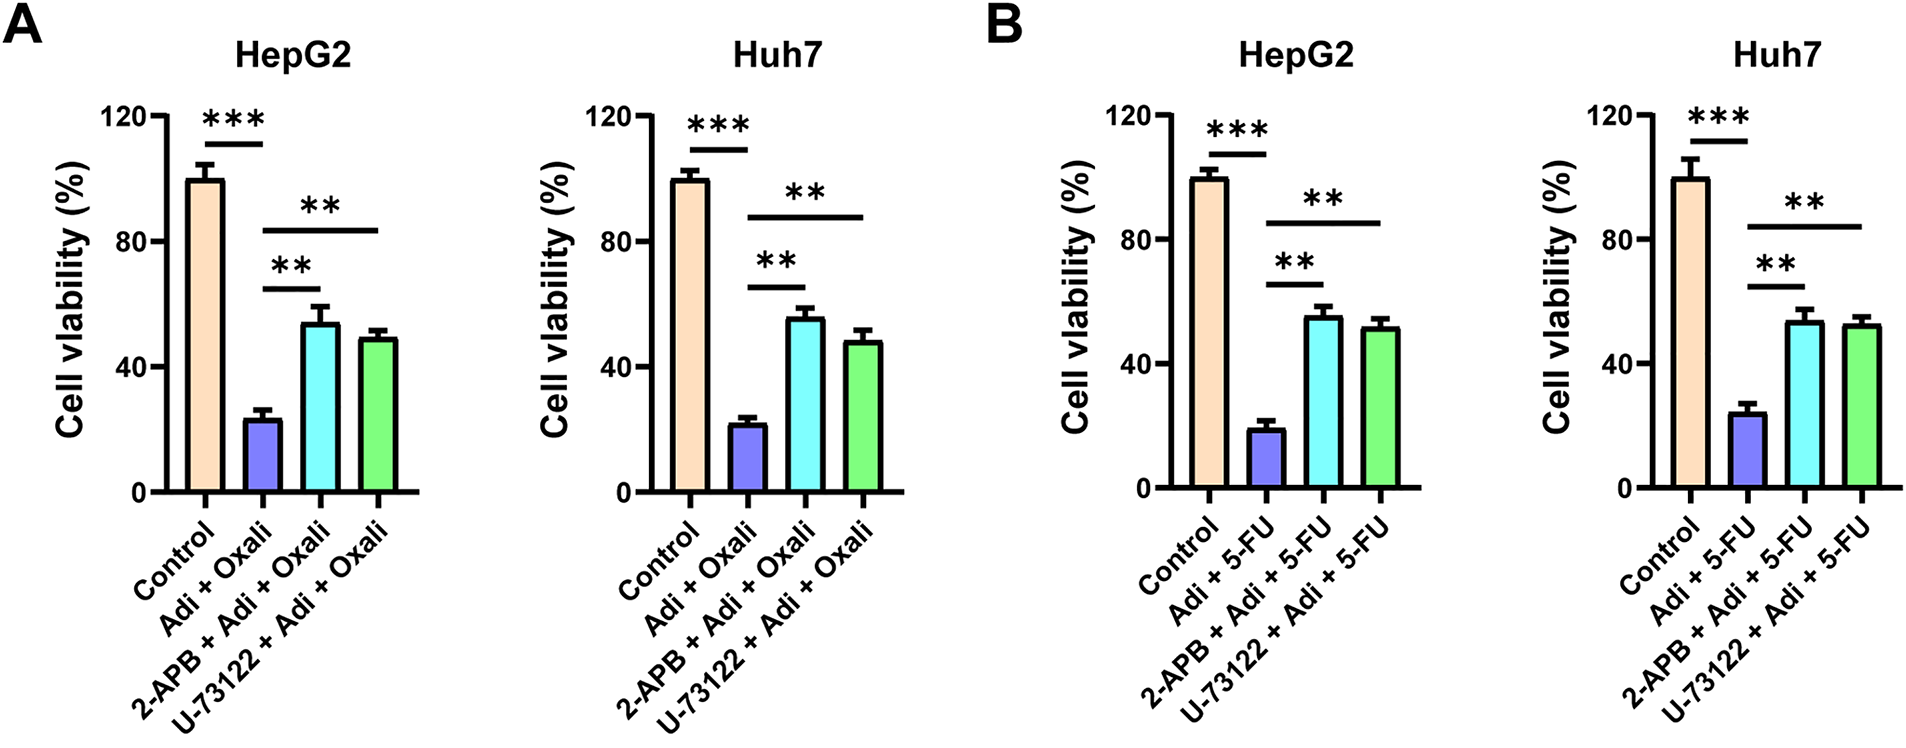
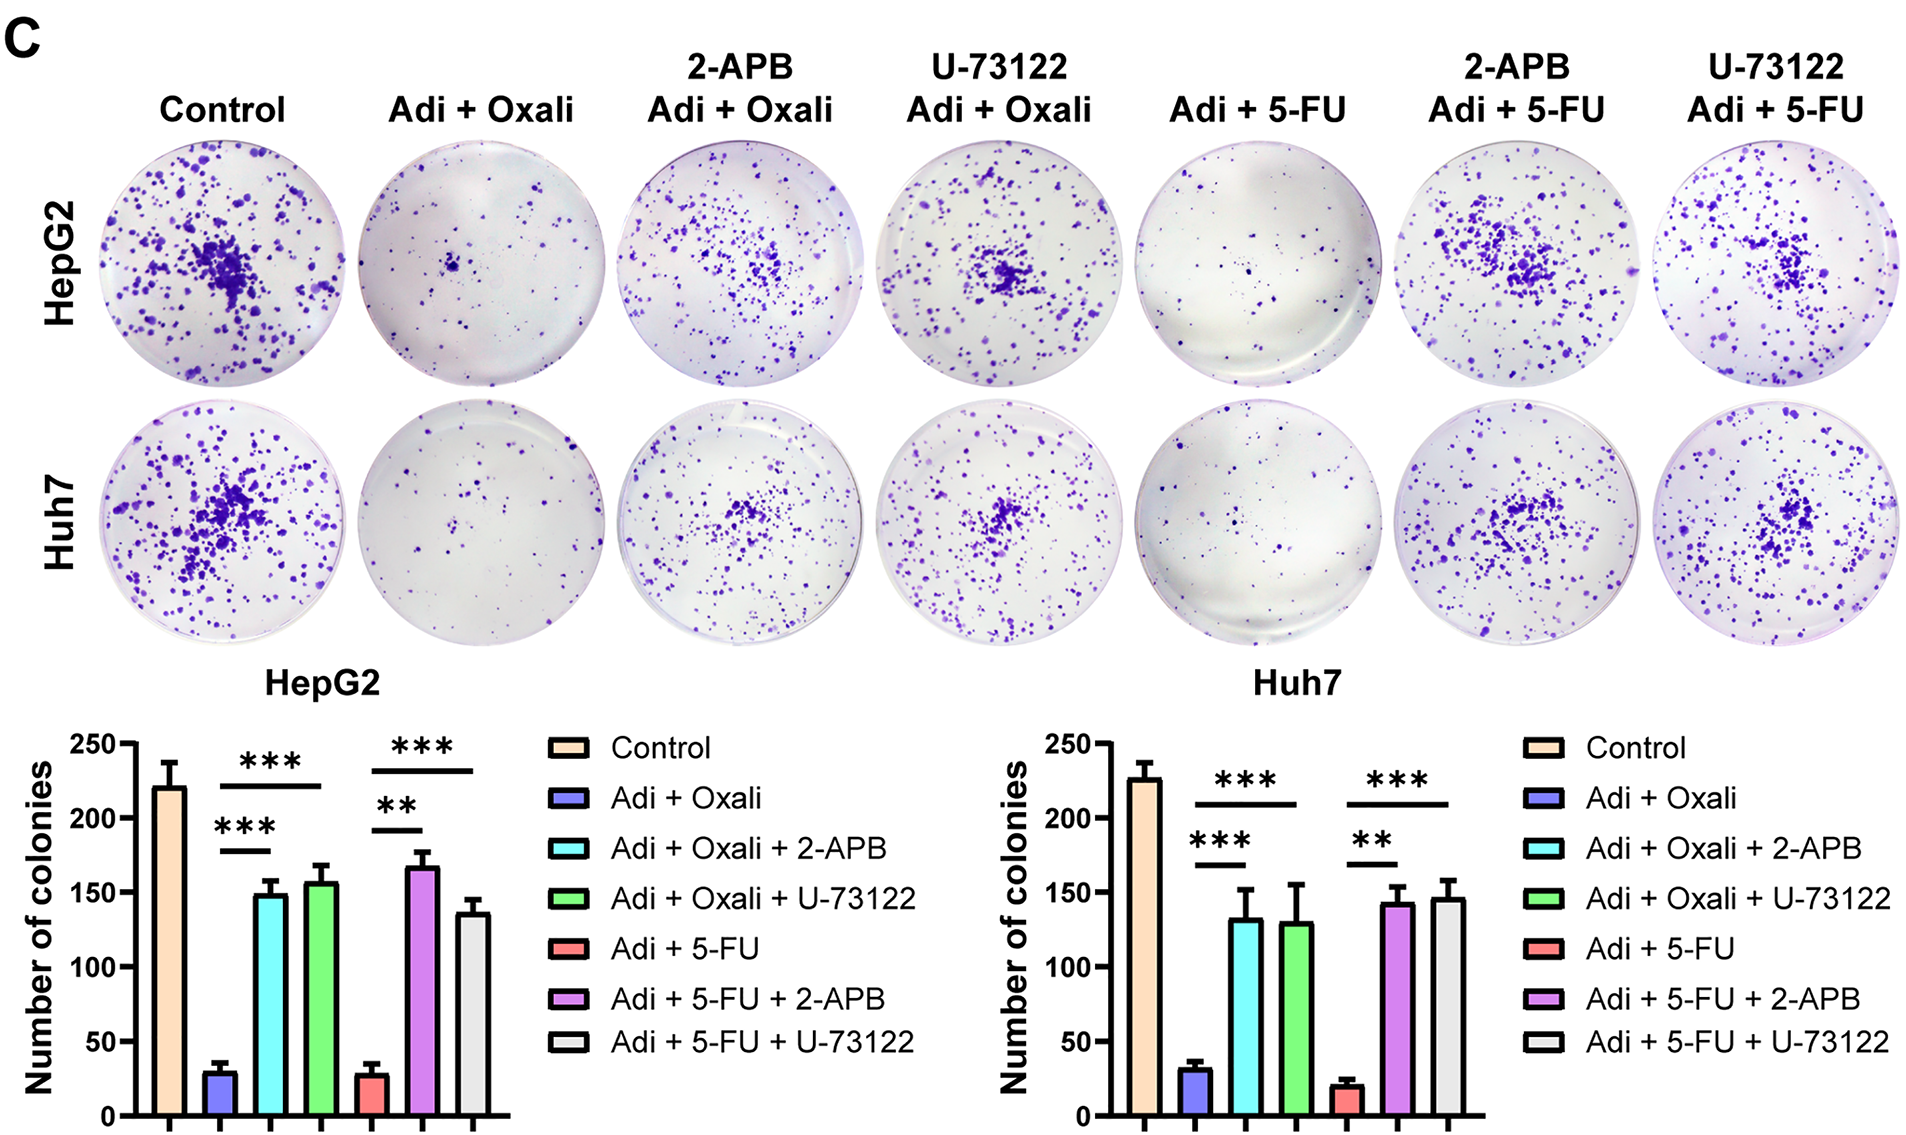
Figure 7: Mitochondrial Ca2+ overload induced by AdipoRon is involved in its synergistic anti-HCC effect with chemotherapeutic drugs. (A) Detection of cell viability in HCC cells exposed to AdipoRon + oxaliplatin pretreatment with 10 μM 2-APB or U-73122. (B) Detection of cell viability in HCC cells exposed to AdipoRon + 5-FU pretreatment with 10 μM 2-APB or U-73122. (C) Detection of colony formation in HCC cells exposed to AdipoRon + oxaliplatin or 5-FU pretreatment with 10 μM 2-APB or U-73122. Data represent the mean ± SD (n = 6). **p < 0.01, ***p < 0.001
This study examined the anti-tumor properties and mechanistic actions of AdipoRon in HCC cells. The findings indicated that AdipoRon significantly suppressed HCC cell proliferation while concurrently inducing apoptosis. Further investigation revealed that AdipoRon elicited mitochondrial dysfunction and Ca2+ overload in HCC cells. Mechanistically, AdipoRon facilitates mitochondrial Ca2+ influx by activating the PLC-IP3-IP3R signaling pathway, thereby promoting Ca2+ release from the ER.
Adiponectin is widely recognized as an anti-tumor target across various cancer types. Recently, researchers have developed adiponectin receptor agonists, including adiponectin-derived peptides such as ADP355 [38], ALY688 [39], and ADP399 [40], as well as small molecule compounds like AdipoRon [24] and AdipoAI [41]. AdipoRon, a small-molecule that mimics adiponectin’s biological activity, has demonstrated promising anti-tumor properties [42]. Previous studies have shown that AdipoRon effectively inhibited the proliferation, migration, and metastasis of nasopharyngeal carcinoma cells [43,44]. This study, our findings indicated that AdipoRon suppressed HCC cell proliferation in a dose-dependent manner and induces apoptosis in these cells. The anti-tumor effects of AdipoRon are mediated through multiple molecular pathways, including activation of the AMPK signaling cascade [45,46], modulation of the cell cycle [30], inhibition of the epithelial-mesenchymal transition (EMT) [44,47], alteration of tumor cell metabolic processes [48], and regulation of inflammatory responses [44]. Furthermore, our data demonstrated that AdipoRon decreased MMP, promoted mitochondrial ROS production and dysfunction.
Our further study indicates that AdipoRon regulates intracellular Ca2+ homeostasis and induces mitochondrial Ca2+ overload, thereby damaging mitochondrial function. Ca2+, serving as pivotal second messengers in intracellular signal transduction, play a crucial role in processes such as cell proliferation, metabolism, migration, and cell death [37]. Ca2+ overload, characterized by an abnormally elevated intracellular Ca2+ concentration, has been identified as a critical determinant in the induction of various forms of tumor cell death, such as apoptosis, proptosis, immunogenic cell death (ICD), and autophagy [37]. Notably, intracellular Ca2+ overload can prompt mitochondrial Ca2+ accumulation, inducing mitochondrial dysfunction and subsequent cell death [36]. Our findings reveal that AdipoRon facilitates the translocation of Ca2+ from the cytosol into mitochondria. Furthermore, AdipoRon promotes mitochondrial Ca2+ overload by triggering the release of Ca2+ from the ER.
Furthermore, the PLC-IP3-IP3R signaling pathway was identified as being involved in the AdipoRon-induced release of ER Ca2+ (Fig. 8) The PLC-IP3-IP3R pathway is a classic intracellular Ca2+ homeostasis regulatory signaling pathway [49]. Serval studies have reported that activation of adiponectin receptor signaling leads to an upregulation of PLC activity [50–52]. Although adiponectin receptor signaling does not directly trigger PLC activation, evidence suggests that in hepatocytes, adiponectin-induced PLC activation is dependent on the adaptor protein APPL1 [52]. Additionally, adiponectin receptors have been shown to enhance sphingosine-1-phosphate (S1P) receptor signaling, which subsequently activates downstream heterotrimeric G protein Gαq, thereby mediating PLC activation [51]. Consequently, the precise molecular mechanism by which AdipoRon induces PLC activation warrants further elucidation in future studies. Furthermore, our findings indicate that AdipoRon-induced mitochondrial Ca2+ overload potentiates its antitumor efficacy when combined with chemotherapeutic agents oxaliplatin and 5-FU in HCC cells.
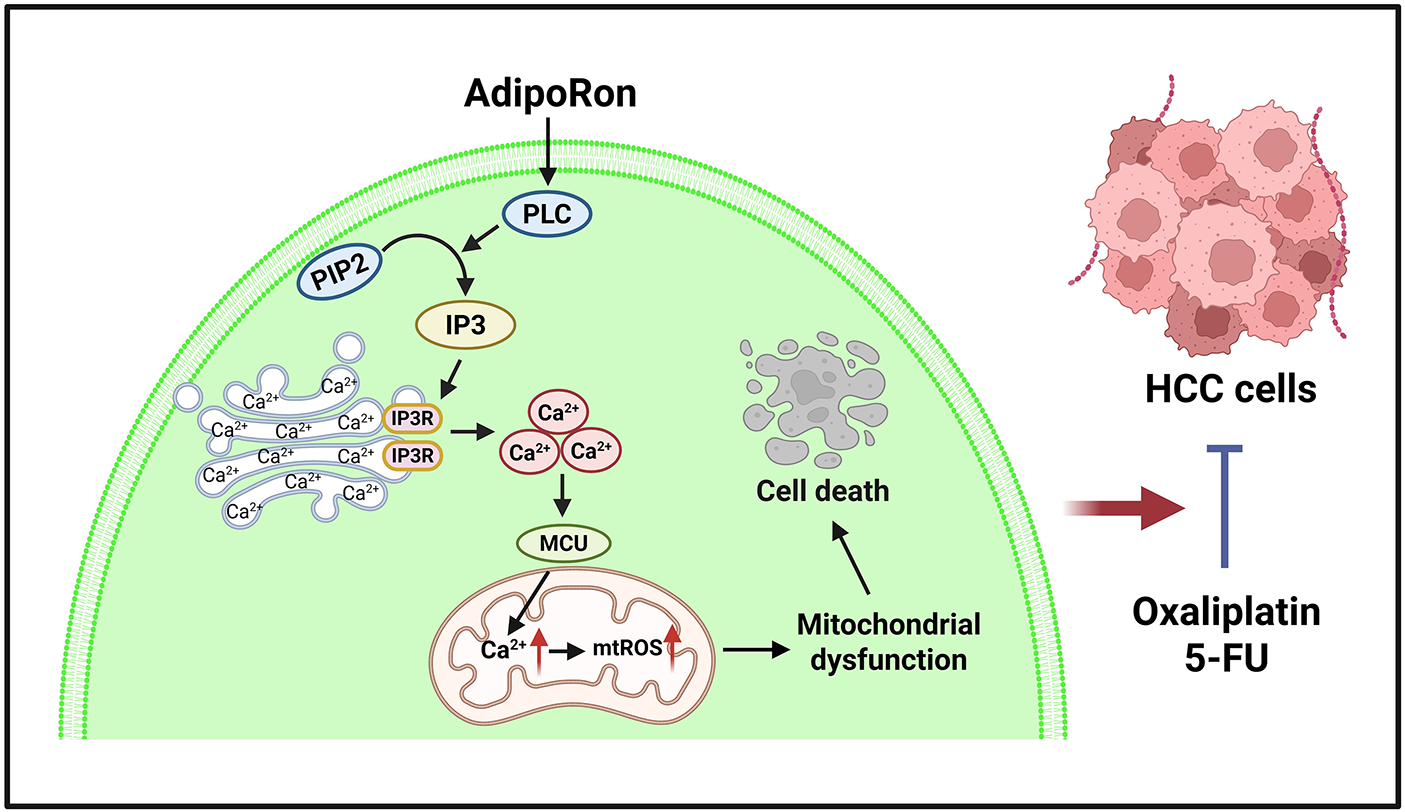
Figure 8: Schematic diagram of the mechanism of AdipoRon induced apoptosis in HCC cells. The image was created with BioRender.com. HCC: hepatocellular carcinoma, 5-FU: 5-Fluorouracil, mtROS: mitochondrial reactive oxygen species, MCU: mitochondrial calcium uniporter, IP3: inositol trisphosphate 3, IP3R: inositol trisphosphate 3 receptor, PIP2: phosphatidylinositol-4,5-bisphosphate, PLC: phospholipase C
Existing studies have demonstrated that AdipoRon primarily induces tumor cell apoptosis by activating the AMPK signaling pathway and inhibiting key pro-survival signals such as STAT3 and the mechanistic target of rapamycin (mTOR) [30,42,53]. In human ovarian cancer cell lines, AdipoRon suppresses proliferation and induces apoptotic cell death, which is associated with AMPK activation and mTOR inhibition [30]. Additionally, AdipoRon promotes apoptosis in thyroid cancer through autophagy activation mediated by the AdipoR2-ULK/p-ULK1 signaling pathway [54]. Other research has shown that AdipoRon-induced pancreatic cancer cell death occurs independently of adiponectin receptor signaling, instead proceeding via activation of RIPK1/ERK-dependent necroptosis signaling [32]. Consistent with our findings, AdipoRon induces mitochondrial calcium overload in pancreatic cancer cells.
Our study has several limitations. While we elucidated the mechanism by which AdipoRon induces ER Ca2+ release, we did not investigate whether AdipoRon affects mitochondrial Ca2+ uptake. There is also a lack of data on calcium ion dynamics monitoring. Additionally, future in vivo experiments are necessary to confirm the anti-liver cancer effects of AdipoRon. In addition to its direct anti-proliferative and pro-apoptotic actions, its potential impact on the tumor microenvironment also warrants attention. Given its well-established regulatory effects on glucolipid metabolism, as well as its anti-inflammatory properties, it is essential to clarify its potential effects on animal metabolism and immune function in in vivo studies.
In summary, our findings indicate that AdipoRon exhibits anti-tumor effects in HCC cells. AdipoRon can induce the release of Ca2+ from the ER via the PLC-IP3-IP3 signaling pathway, facilitating Ca2+ influx into the mitochondria, thereby triggering mitochondrial Ca2+ overload that leads to mitochondrial dysfunction and apoptosis. This effect allows it to be used in combination with existing chemotherapeutic drugs to enhance therapeutic outcomes against HCC. Consequently, AdipoRon holds promise as a novel therapeutic agent for the treatment of HCC.
Acknowledgement: None.
Funding Statement: This work was supported by the Research Fund of Anhui Institute of Translational Medicine (2023zhyx-C84), Natural Science Research Project of Anhui Higher Education Institutions (2024AH050804).
Author Contributions: Study conception and design: Liang He and Jiong Gu; data collection: Zongmeng Zhang and Cai Chen; analysis and interpretation of results: Zongmeng Zhang and Cai Chen; draft manuscript preparation: Zongmeng Zhang, Cai Chen, Shaorui Rui, Conghan Li, Jiong Gu and Liang He. All authors reviewed the results and approved the final version of the manuscript.
Availability of Data and Materials: All data generated or analyzed during this study are included in this published article.
Ethics Approval: Not applicable.
Conflicts of Interest: The authors declare no conflicts of interest to report regarding the present study.
References
1. Chan SL, Sun H, Xu Y, Zeng H, El-Serag HB, Lee JM, et al. The lancet commission on addressing the global hepatocellular carcinoma burden: comprehensive strategies from prevention to treatment. Lancet. 2025;406(10504):731–78. doi:10.1016/S0140-6736(25)01042-6. [Google Scholar] [PubMed] [CrossRef]
2. Moris D, Martinino A, Schiltz S, Allen PJ, Barbas A, Sudan D, et al. Advances in the treatment of hepatocellular carcinoma: an overview of the current and evolving therapeutic landscape for clinicians. CA Cancer J Clin. 2025;75(6):498–527. doi:10.3322/caac.70018. [Google Scholar] [PubMed] [CrossRef]
3. Gan L, Liu Z, Sun C. Obesity linking to hepatocellular carcinoma: a global view. Biochim Biophys Acta Rev Cancer. 2018;1869(2):97–102. doi:10.1016/j.bbcan.2017.12.006. [Google Scholar] [PubMed] [CrossRef]
4. Gupta A, Das A, Majumder K, Arora N, Mayo HG, Singh PP, et al. Obesity is independently associated with increased risk of hepatocellular cancer-related mortality: a systematic review and meta-analysis. Am J Clin Oncol. 2018;41(9):874–81. doi:10.1097/COC.0000000000000388. [Google Scholar] [PubMed] [CrossRef]
5. Chen Z, Ding C, Chen K, Gu Y, Qiu X, Li Q. Investigating the causal association between obesity and risk of hepatocellular carcinoma and underlying mechanisms. Sci Rep. 2024;14(1):15717. doi:10.1038/s41598-024-66414-1. [Google Scholar] [PubMed] [CrossRef]
6. Achari AE, Jain SK. Adiponectin, a therapeutic target for obesity, diabetes, and endothelial dysfunction. Int J Mol Sci. 2017;18(6):1321. doi:10.3390/ijms18061321. [Google Scholar] [PubMed] [CrossRef]
7. Blazejewska W, Dabrowska J, Joanna M, Bogdanski P. The role of adiponectin and ADIPOQ variation in metabolic syndrome: a narrative review. Genes. 2025;16(6):699. doi:10.3390/genes16060699. [Google Scholar] [CrossRef]
8. Han Y, Sun Q, Chen W, Gao Y, Ye J, Chen Y, et al. New advances of adiponectin in regulating obesity and related metabolic syndromes. J Pharm Anal. 2024;14(5):100913. doi:10.1016/j.jpha.2023.12.003. [Google Scholar] [PubMed] [CrossRef]
9. Chen CL, Yang WS, Yang HI, Chen CF, Wang LY, Lu SN, et al. Plasma adiponectin levels in relation to chronic hepatitis B infection progression to liver cancer milestones: a prospective study. Liver Cancer. 2025;14(1):19–35. doi:10.1159/000539909. [Google Scholar] [CrossRef]
10. Hui C, Zhang H, Lee N, Chan W, Yueng Y, Leung K, et al. Serum adiponectin is increased in advancing liver fibrosis and declines with reduction in fibrosis in chronic hepatitis B. J Hepatol. 2007;47(2):191–202. doi:10.1016/j.jhep.2007.02.023. [Google Scholar] [PubMed] [CrossRef]
11. Balmer ML, Joneli J, Schoepfer A, Stickel F, Thormann W, Dufour JF. Significance of serum adiponectin levels in patients with chronic liver disease. Clin Sci. 2010;119(10):431–6. doi:10.1042/CS20100008. [Google Scholar] [PubMed] [CrossRef]
12. Kaser S, Moschen A, Kaser A, Ludwiczek O, Ebenbichler CF, Vogel W, et al. Circulating adiponectin reflects severity of liver disease but not insulin sensitivity in liver cirrhosis. J Intern Med. 2005;258(3):274–80. doi:10.1111/j.1365-2796.2005.01543.x. [Google Scholar] [PubMed] [CrossRef]
13. Liu C, Chen P, Lai M, Liu C, Chen C, Kao J, et al. High serum adiponectin correlates with advanced liver disease in patients with chronic hepatitis B virus infection. Hepatol Int. 2009;3(2):364–70. doi:10.1007/s12072-008-9111-0. [Google Scholar] [PubMed] [CrossRef]
14. Tietge UJ, Boker KH, Manns MP, Bahr MJ. Elevated circulating adiponectin levels in liver cirrhosis are associated with reduced liver function and altered hepatic hemodynamics. Am J Physiol Endocrinol Metab. 2004;287(1):E82–9. doi:10.1152/ajpendo.00494.2003. [Google Scholar] [PubMed] [CrossRef]
15. Michikawa T, Inoue M, Sawada N, Sasazuki S, Tanaka Y, Iwasaki M, et al. Plasma levels of adiponectin and primary liver cancer risk in middle-aged Japanese adults with hepatitis virus infection: a nested case-control study. Cancer Epidemiol Biomark Prev. 2013;22(12):2250–7. doi:10.1158/1055-9965.EPI-13-0363. [Google Scholar] [PubMed] [CrossRef]
16. Arano T, Nakagawa H, Tateishi R, Ikeda H, Uchino K, Enooku K, et al. Serum level of adiponectin and the risk of liver cancer development in chronic hepatitis C patients. Int J Cancer. 2011;129(9):2226–35. doi:10.1002/ijc.25861. [Google Scholar] [PubMed] [CrossRef]
17. Siegel AB, Goyal A, Salomao M, Wang S, Lee V, Hsu C, et al. Serum adiponectin is associated with worsened overall survival in a prospective cohort of hepatocellular carcinoma patients. Oncology. 2015;88(1):57–68. doi:10.1159/000367971. [Google Scholar] [PubMed] [CrossRef]
18. Zhang L, Yuan Q, Li M, Chai D, Deng W, Wang W. The association of leptin and adiponectin with hepatocellular carcinoma risk and prognosis: a combination of traditional, survival, and dose-response meta-analysis. BMC Cancer. 2020;20(1):1167. doi:10.1186/s12885-020-07651-1. [Google Scholar] [PubMed] [CrossRef]
19. Song R, Gu X. Serum adiponectin levels may be associated with the pathogenesis of hepatocellular carcinoma. Tumour Biol. 2015;36(4):2983–92. doi:10.1007/s13277-014-2931-8. [Google Scholar] [PubMed] [CrossRef]
20. Sumie S, Kawaguchi T, Kuromatsu R, Takata A, Nakano M, Satani M, et al. Total and high molecular weight adiponectin and hepatocellular carcinoma with HCV infection. PLoS One. 2011;6(11):e26840. doi:10.1371/journal.pone.0026840. [Google Scholar] [PubMed] [CrossRef]
21. Sharma D, Wang J, Fu PP, Sharma S, Nagalingam A, Mells J, et al. Adiponectin antagonizes the oncogenic actions of leptin in hepatocellular carcinogenesis. Hepatology. 2010;52(5):1713–22. doi:10.1002/hep.23892. [Google Scholar] [PubMed] [CrossRef]
22. Raut PK, Park PH. Globular adiponectin antagonizes leptin-induced growth of cancer cells by modulating inflammasomes activation: critical role of HO-1 signaling. Biochem Pharmacol. 2020;180(2):114186. doi:10.1016/j.bcp.2020.114186. [Google Scholar] [PubMed] [CrossRef]
23. Man K, Ng KT, Xu A, Cheng Q, Lo CM, Xiao JW, et al. Suppression of liver tumor growth and metastasis by adiponectin in nude mice through inhibition of tumor angiogenesis and downregulation of Rho kinase/IFN-inducible protein 10/matrix metalloproteinase 9 signaling. Clin Cancer Res. 2010;16(3):967–77. doi:10.1158/1078-0432.CCR-09-1487. [Google Scholar] [PubMed] [CrossRef]
24. Okada-Iwabu M, Yamauchi T, Iwabu M, Honma T, Hamagami K, Matsuda K, et al. A small-molecule AdipoR agonist for type 2 diabetes and short life in obesity. Nature. 2013;503(7477):493–9. doi:10.1038/nature12656. [Google Scholar] [PubMed] [CrossRef]
25. Bhat IA, Kabeer SW, Reza MI, Mir RH, Dar MO. AdipoRon: a novel insulin sensitizer in various complications and the underlying mechanisms: a review. Curr Mol Pharmacol. 2020;13(2):94–107. doi:10.2174/1874467212666191022102800. [Google Scholar] [PubMed] [CrossRef]
26. Abou-Samra M, Dubuisson N, Marino A, Selvais CM, Romain V, Carrizosa MAD, et al. Striking cardioprotective effects of an adiponectin receptor agonist in an aged mouse model of duchenne muscular dystrophy. Antioxidants. 2024;13(12):1551. doi:10.3390/antiox13121551. [Google Scholar] [PubMed] [CrossRef]
27. Liu Y, Xu Y, Ji H, Gao F, Ge R, Zhou D, et al. AdipoRon alleviates liver injury by protecting hepatocytes from mitochondrial damage caused by ionizing radiation. Int J Mol Sci. 2024;25(20):11277. doi:10.3390/ijms252011277. [Google Scholar] [PubMed] [CrossRef]
28. Barbalho SM, Mendez-Sanchez N, Fornari Laurindo L. AdipoRon and ADP355, adiponectin receptor agonists, in metabolic-associated fatty liver disease (MAFLD) and nonalcoholic steatohepatitis (NASHa systematic review. Biochem Pharmacol. 2023;218(4):115871. doi:10.1016/j.bcp.2023.115871. [Google Scholar] [PubMed] [CrossRef]
29. Nie L, He K, Wu W, Zhang H, Gao C, Xiong B, et al. AdipoRon attenuates steatosis, inflammation and fibrosis in murine diet-induced NASH via inhibiting ER stress. Diabetes Obes Metab. 2025;27(9):4950–67. doi:10.1111/dom.16542. [Google Scholar] [PubMed] [CrossRef]
30. Ramzan AA, Bitler BG, Hicks D, Barner K, Qamar L, Behbakht K, et al. Adiponectin receptor agonist AdipoRon induces apoptotic cell death and suppresses proliferation in human ovarian cancer cells. Mol Cell Biochem. 2019;461(1–2):37–46. doi:10.1007/s11010-019-03586-9. [Google Scholar] [PubMed] [CrossRef]
31. Manley SJ, Olou AA, Jack JL, Ruckert MT, Walsh RM, Eades AE, et al. Synthetic adiponectin-receptor agonist, AdipoRon, induces glycolytic dependence in pancreatic cancer cells. Cell Death Dis. 2022;13(2):114. doi:10.1038/s41419-022-04572-8. [Google Scholar] [PubMed] [CrossRef]
32. Akimoto M, Maruyama R, Kawabata Y, Tajima Y, Takenaga K. Antidiabetic adiponectin receptor agonist AdipoRon suppresses tumour growth of pancreatic cancer by inducing RIPK1/ERK-dependent necroptosis. Cell Death Dis. 2018;9(8):804. doi:10.1038/s41419-018-0851-z. [Google Scholar] [PubMed] [CrossRef]
33. Yan Y, Shi H, Zhao Z, Wang S, Zhou S, Mu Y, et al. Adiponectin deficiency promotes endometrial carcinoma pathogenesis and development via activation of mitogen-activated protein kinase. J Pathol. 2022;257(2):146–57. doi:10.1002/path.5874. [Google Scholar] [PubMed] [CrossRef]
34. Szymaszkiewicz A, Mierzejewski M, Januszkiewicz E, Machelak W, Talar M, Wlodarczyk J, et al. The role of bidirectional communication between the adipokines and the endogenous opioid system in an experimental mouse model of colitis-associated colorectal cancer. Pharmacol Rep. 2024;76(1):112–26. doi:10.1007/s43440-023-00566-1. [Google Scholar] [PubMed] [CrossRef]
35. Tarasov AI, Griffiths EJ, Rutter GA. Regulation of ATP production by mitochondrial Ca2+. Cell Calcium. 2012;52(1):28–35. doi:10.1016/j.ceca.2012.03.003. [Google Scholar] [PubMed] [CrossRef]
36. Giorgi C, Marchi S, Pinton P. The machineries, regulation and cellular functions of mitochondrial calcium. Nat Rev Mol Cell Biol. 2018;19(11):713–30. doi:10.1038/s41580-018-0052-8. [Google Scholar] [PubMed] [CrossRef]
37. Dhaouadi N, Vitto VAM, Pinton P, Galluzzi L, Marchi S. Ca2+ signaling and cell death. Cell Calcium. 2023;113:102759. doi:10.1016/j.ceca.2023.102759. [Google Scholar] [PubMed] [CrossRef]
38. Otvos L, Haspinger E, La Russa F, Maspero F, Graziano P, Kovalszky I, et al. Design and development of a peptide-based adiponectin receptor agonist for cancer treatment. BMC Biotechnol. 2011;11(1):90. doi:10.1186/1472-6750-11-90. [Google Scholar] [PubMed] [CrossRef]
39. Dubuisson N, Versele R, Carrizosa MAD, Selvais CM, Noel L, Planchon C, et al. The adiponectin receptor agonist, ALY688: a promising therapeutic for fibrosis in the dystrophic muscle. Cells. 2023;12(16):2101. doi:10.3390/cells12162101. [Google Scholar] [PubMed] [CrossRef]
40. Otvos L, Knappe D, Hoffmann R, Kovalszky I, Olah J, Hewitson TD, et al. Development of second generation peptides modulating cellular adiponectin receptor responses. Front Chem. 2014;2(62):93. doi:10.3389/fchem.2014.00093. [Google Scholar] [PubMed] [CrossRef]
41. Qiu W, Wu H, Hu Z, Wu X, Tu M, Fang F, et al. Identification and characterization of a novel adiponectin receptor agonist adipo anti-inflammation agonist and its anti-inflammatory effects in vitro and in vivo. Br J Pharmacol. 2021;178(2):280–97. doi:10.1111/bph.15277. [Google Scholar] [PubMed] [CrossRef]
42. Nigro E, Daniele A, Salzillo A, Ragone A, Naviglio S, Sapio L. AdipoRon and other adiponectin receptor agonists as potential candidates in cancer treatments. Int J Mol Sci. 2021;22(11):5569. doi:10.3390/ijms22115569. [Google Scholar] [PubMed] [CrossRef]
43. Zhang Z, Du J, Shi H, Wang S, Yan Y, Xu Q, et al. Adiponectin suppresses tumor growth of nasopharyngeal carcinoma through activating AMPK signaling pathway. J Transl Med. 2022;20(1):89. doi:10.1186/s12967-022-03283-0. [Google Scholar] [PubMed] [CrossRef]
44. Zhang Z, Du J, Xu Q, Xing C, Li Y, Zhou S, et al. Adiponectin suppresses metastasis of nasopharyngeal carcinoma through blocking the activation of NF-kappaB and STAT3 signaling. Int J Mol Sci. 2022;23(21):12729. doi:10.3390/ijms232112729. [Google Scholar] [PubMed] [CrossRef]
45. Kafeel S, Ragone A, Salzillo A, Palmiero G, Naviglio S, Sapio L. Adiponectin receptor agonist adiporon inhibits proliferation and drives glycolytic dependence in non-small-cell lung cancer cells. Cancers. 2024;16(15):2633. doi:10.3390/cancers16152633. [Google Scholar] [PubMed] [CrossRef]
46. Kafeel S, Palmiero G, Salzillo A, Ragone A, Naviglio S, Sapio L. Combining adiporon with paclitaxel unveils synergistic potential in non-small cell lung cancer cells via AMPK-ERK1/2 signaling. Cells. 2025;14(8):602. doi:10.3390/cells14080602. [Google Scholar] [PubMed] [CrossRef]
47. Mallardo M, Scalia G, Raia M, Daniele A, Nigro E. The effects of adiponectin on the behavior of B-Cell leukemia cells: insights from an in vitro study. Biomedicines. 2023;11(9):2585. doi:10.3390/biomedicines11092585. [Google Scholar] [PubMed] [CrossRef]
48. Kafeel S, Palmiero G, Salzillo A, Ragone A, Naviglio S, Sapio L. Unravelling the adiponectin hallmark and exploring the therapeutic potential of its receptor agonists in cancer metabolic reprogramming. Biomolecules. 2025;15(6):820. doi:10.3390/biom15060820. [Google Scholar] [PubMed] [CrossRef]
49. Yang J, Zhao Z, Gu M, Feng X, Xu H. Release and uptake mechanisms of vesicular Ca2+ stores. Protein Cell. 2019;10(1):8–19. doi:10.1007/s13238-018-0523-x. [Google Scholar] [PubMed] [CrossRef]
50. Jung MY, Kim HS, Hong HJ, Youn BS, Kim TS. Adiponectin induces dendritic cell activation via PLCgamma/JNK/NF-kappaB pathways, leading to Th1 and Th17 polarization. J Immunol. 2012;188(6):2592–601. doi:10.4049/jimmunol.1102588. [Google Scholar] [PubMed] [CrossRef]
51. Straub LG, Scherer PE. Metabolic messengers: adiponectin. Nat Metab. 2019;1(3):334–9. doi:10.1038/s42255-019-0041-z. [Google Scholar] [PubMed] [CrossRef]
52. Zhou L, Deepa SS, Etzler JC, Ryu J, Mao X, Fang Q, et al. Adiponectin activates AMP-activated protein kinase in muscle cells via APPL1/LKB1-dependent and phospholipase C/Ca2+/Ca2+/calmodulin-dependent protein kinase kinase-dependent pathways. J Biol Chem. 2009;284(33):22426–35. doi:10.1074/jbc.M109.028357. [Google Scholar] [PubMed] [CrossRef]
53. Sapio L, Nigro E, Ragone A, Salzillo A, Illiano M, Spina A, et al. AdipoRon affects cell cycle progression and inhibits proliferation in human osteosarcoma cells. J Oncol. 2020;2020(2):7262479. doi:10.1155/2020/7262479. [Google Scholar] [PubMed] [CrossRef]
54. Li C, Zhang J, Dionigi G, Liang N, Guan H, Sun H. Uncovering the connection between obesity and thyroid cancer: the therapeutic potential of adiponectin receptor agonist in the AdipoR2-ULK axis. Cell Death Dis. 2024;15(9):708. doi:10.1038/s41419-024-07084-9. [Google Scholar] [PubMed] [CrossRef]
Cite This Article
 Copyright © 2026 The Author(s). Published by Tech Science Press.
This work is licensed under a Creative Commons Attribution 4.0 International License , which permits unrestricted use, distribution, and reproduction in any medium, provided the original work is properly cited.
 Downloads
 Citation Tools