
 Submit a Paper
 Propose a Special lssue
 Open Access
ARTICLE

sIL-2RA Exacerbates Multiple Sclerosis by Activating Microglia and Upregulating Fc Receptors on Microglia
Department of Neurology and China-America Institute of Neuroscience, Xuanwu Hospital, Capital Medical University, Beijing, China
* Corresponding Author: Hui Lu. Email:
# These authors contributed equally to this work
(This article belongs to the Special Issue: Autoantibodies and Emerging Biomarkers in Immune-Mediated Neurological Disorders)
BIOCELL 2026, 50(3), 7 https://doi.org/10.32604/biocell.2026.073956
Received 29 September 2025; Accepted 12 January 2026; Issue published 23 March 2026
 View Full Text
 Download PDF
Abstract
Objective: Multiple sclerosis (MS) is a chronic inflammatory demyelinating disease of the central nervous system (CNS). Soluble interleukin-2 receptor alpha (sIL-2Rα) has been implicated in MS pathogenesis, but its mechanisms remain unclear. This study investigates how sIL-2Rα exacerbates MS by modulating microglial activation and antibody-dependent cellular cytotoxicity (ADCC) in an experimental autoimmune encephalomyelitis (EAE) mouse model. Methods: Female C57BL/6J mice were induced with EAE and treated with sIL-2Rα. Clinical symptoms, histopathology, and molecular changes were analyzed. Microglial activation was assessed via immunohistochemistry, Western blot, and RNA sequencing. In vitro, ADCC-mediated oligodendrocyte injury was evaluated using Fc receptor inhibition and PI3K-Akt pathway blockade. Results: sIL-2Rα accelerated EAE onset and severity, increasing microglial M1 polarization and CNS inflammation. RNA-seq revealed PI3K-Akt pathway activation, upregulating Fc receptors (FcγR) on microglia, which enhanced ADCC against oligodendrocytes (p < 0.001). Inhibiting FcγR or PI3K-Akt reduced oligodendrocyte damage. Conclusion: sIL-2Rα exacerbates MS by activating microglia via the PI3K-Aktaxis, promoting ADCC and demyelination. Targeting this pathway may offer novel therapeutic strategies for MS.Keywords
Supplementary Material
Supplementary Material FileMultiple sclerosis (MS) is the most prevalent chronic inflammatory demyelinating condition of the central nervous system (CNS), marked by recurring episodes [1]. More than 2 million individuals across the globe are impacted, and in numerous nations, MS stands as the primary cause of non-traumatic neurological disabilities in young adults [2].
Most cases initially present as relapsing-remitting MS (RRMS), which may progress to progressive forms. Core symptoms stem from CNS myelin and axonal damage, including motor dysfunction, sensory abnormalities, visual disturbances (e.g., optic neuritis), autonomic dysfunction, cognitive impairment, neurogenic fatigue (exacerbated by heat), and psychiatric comorbidities [3]. The development of MS is intricate, and its causes are not fully understood. Based on the latest large-scale human genome-wide association studies (GWAS), our previous research used Mendelian randomization (MR) to identify a potential causal relationship between plasma soluble interleukin-2 receptor α subunit (sIL-2Rα) and MS. High levels of sIL-2Rα have been identified as a potential contributing factor to the development of MS [4–6].
sIL-2Rα is a secreted immune modulator produced via two key pathways: proteolytic cleavage of membrane-bound IL-2Rα on activated immune cells (e.g., T cells, microglia) or alternative splicing of IL-2Rα mRNA [7]. Functionally, it acts as a pivotal inflammatory biomarker (elevated in autoimmune/neuroinflammatory diseases) and regulates immune responses by high-affinity binding to IL-2, competing with membrane IL-2R to modulate pro-inflammatory cell activation (e.g., microglia) and pathological processes such as neuroinflammation [8,9].
Microglia are the resident innate immune cells of the CNS, derived from myeloid progenitor cells in the yolk sac during embryonic development. In the steady state, they maintain CNS homeostasis by surveying the microenvironment, clearing cellular debris, and regulating synaptic plasticity [10]. Upon activation by pathological stimuli (e.g., neuroinflammation, trauma, neurodegeneration), microglia undergo morphological and functional changes: they polarize into pro-inflammatory (M1) or anti-inflammatory (M2) phenotypes, secrete cytokines/chemokines, express immune receptors (e.g., Fcγ receptors), and participate in phagocytosis or antibody-dependent cellular cytotoxicity (ADCC), thereby influencing neuroinflammation and tissue repair processes [11,12].
In order to confirm these findings and investigate the mechanisms at play, this research employed both animal and cell models. We hypothesized that sIL-2Rα exacerbates MS by activating the PI3K-Akt pathway in microglia, leading to increased FcγR expression and enhanced antibody-dependent cellular cytotoxicity (ADCC) against oligodendrocytes.
All animal experiments were carried out in accordance with institutional Policies and Guidelines for the Care and Use of Laboratory Animals, and all efforts were made to minimize animal suffering.
Seventy-five female C57BL/6J mice (9 to 13 weeks old) (Sibef Biotechnology Co., Ltd., B204, Beijing, China) were used in this study. Mice were housed in pathogen-free facilities under 12-h light/dark cycles. Mice were provided with ad libitum access to standard laboratory chow and water throughout the experimental period, ensuring unrestricted nutrient and fluid intake. All experiments were approved by the Animal Care and Use Committee of the Institute of Laboratory Animal Science, Capital Medical University (AEEI-2023-1069), and conducted in compliance with the NIH Guide for the Care and Use of Laboratory Animals. Humane endpoints were established, and animals showing severe disease or moribund states were euthanized.
Sample sizes were determined based on power analyses using GPower 3.1 (Heinrich-Heine-Universität Düsseldorf, Düsseldorf, Nordrhein-Westfalen, Germany) to ensure sufficient statistical power. A total of 75 mice were used throughout the study.
After EVE induction, all animals were randomly allocated into two groups: (1) the sIL-2Ra group (n = 38), which received 400 ng sIL-2Ra in 0.1 mL per mouse, i.v.; and (2) the PBS group (n = 37), which received 0.1 mL PBS per mouse, i.v. Randomization was performed using a random number generator. Experimenters were blinded to group allocation during behavioral scoring (Kono’s score) and data analysis.
EAE was induced using the Hooke Kit™ MOG35-55/CFA Emulsion PTX (Hooke Laboratories, Inc., EK-2110, Lawrence, MA, USA), following the manufacturer’s instructions (https://hookelabs.com/protocols/eaeAI_C57BL6.html). Mice were monitored daily for Kono’s score (0–5 scale) and clinical features, including weight loss, limb weakness, and posture abnormalities. The Kono’s score criteria for mice are as follows: A score of 0 indicates no abnormalities, with normal activity, posture, tail tension, and feeding behavior. A score of 0.5 is assigned for mild tip tail weakness without other functional impairments. A score of 1 means complete tail flaccidity (loss of tension) while limb movement remains unaffected. A score of 1.5 represents tail weakness combined with mild weakness in one hindlimb, manifested as an unsteady gait or dragging. A score of 2 indicates obvious weakness in one hindlimb, where the limb cannot support body weight during movement. A score of 2.5 is given for paralysis of one hindlimb plus mild weakness in the contralateral hindlimb. A score of 3 denotes complete paralysis of both hindlimbs, with the mouse unable to stand on its hindquarters but still able to move by crawling with the forelimbs. A score of 3.5 means paralysis of both hindlimbs accompanied by mild weakness in one forelimb. A score of 4 indicates quadriplegia, with the mouse unable to move independently and relying on external assistance for feeding and drinking. A score of 4.5 is assigned when quadriplegia is combined with respiratory distress or severe consciousness disturbance. A score of 5 represents a moribund state or death.
Animals with a score ≥4.5 were immediately euthanized according to humane endpoints. Animals were euthanized by overdose of isoflurane followed by cervical dislocation, in accordance with institutional ethical guidelines. sIL-2Rα (400 ng/mouse) (R&D Systems, 2438-RM-050, Minneapolis, MN, USA) was intraperitoneally injected every 48 h, starting on day 0 post-immunization.
Total proteins were extracted from spinal cord tissues or cell lysates. Using a radioimmunoprecipitation assay (RIPA) lysis buffer (Thermo Fisher Scientific, 89900, Rochester, NY, USA) supplemented with 1% protease inhibitor cocktail (Thermo Fisher Scientific, 87786) and 1% phosphatase inhibitor cocktail (Thermo Fisher Scientific, 78420) (to prevent protein degradation and dephosphorylation). For spinal cord tissues: (1) Fresh tissues were rinsed with pre-cooled phosphate-buffered saline (PBS) to remove blood contaminants, then homogenized in ice-cold RIPA buffer (100 mg tissue/1 mL buffer) using a tissue homogenizer. (2) The homogenate was incubated on ice for 30 min with occasional vortexing to ensure complete lysis. For cell lysates: (1) Cultured cells were washed twice with pre-cooled PBS, then 200–500 μL of ice-cold RIPA buffer was added to each well (6-well plate) or flask. (2) Cells were scraped gently on ice and transferred to a pre-cooled microcentrifuge tube, followed by incubation on ice for 20 min. After lysis, both tissue and cell samples were centrifuged at 12,000× g for 15 min at 4°C to pellet insoluble debris. The supernatant (total protein extract) was collected, and protein concentration was quantified using the bicinchoninic acid (BCA) assay (MilliporeSigma, BCA1, Burlington, MA, USA). Aliquots of protein extracts were stored at −80°C until subsequent experiments.
A total of 30 μg of protein per lane was loaded for all Western blot analyses. Protein were separated on 4%–20% Tris-glycine gels and transferred onto nitrocellulose (NC) membranes. Membranes were blocked with 5% nonfat dry milk at room temperature for 90 min, followed by overnight incubation at 4°C with primary antibodies (see Supplementary Table S1 for details). After three washes with Tris-buffered saline with Tween 20 (TBST), membranes were incubated with HRP-conjugated secondary antibodies (NA934, GE Healthcare, Chicago, IL, USA) diluted at 1:5000 in blocking buffer at room temperature for 1 h. Signals were detected using enhanced chemiluminescence detection reagent (Amersham ECL Prime Western Blotting Detection Reagent, GE Healthcare, RPN2232, Chicago, IL, USA) with an Amersham Imager 600 (GE Healthcare, Chicago, IL, USA) and analyzed with ImageJ (1.54p, Wayne Rasband and contributors, National Institutes of Health, MD, USA). Quantification methods: Each picture was background subtracted with a set of rolling-ball-radius at 50 pixels, then each lane was normalized by its control. In the Western blot experiments, 3 biological replicates were set up for each group.
2.4 Quantitative Reverse Transcription Polymerase Chain Reaction (qRT-PCR)
Total RNA was extracted using QIAzol lysis reagent (QIAGEN, 79306, Hilden, North Rhine-Westphalia, Germany). One microgram (1 μg) of total RNA per sample was used as the template for reverse transcription to cDNA using the High-Capacity RNA-to-cDNA kit with a total reaction volume of 20 μL (Thermo Fisher Scientific, 4387406). Gene expression was quantified using SYBR Green-based qRT-PCR on a StepOnePlus™ Real-Time PCR System (Thermo Fisher Scientific). The 20 μL reaction system consisted of 10 μL of Power SYBR™ Green PCR Master Mix (Thermo Fisher Scientific, 4367659), 0.4 μL of each forward and reverse primer (10 μM), 2 μL of cDNA template (50 ng/μL), and 7.2 μL of nuclease-free water. The amplification protocol was as follows: initial denaturation at 95°C for 10 min; 40 cycles of denaturation at 95°C for 15 s, annealing at 60°C for 30 s, and extension at 72°C for 30 s; followed by a melting curve analysis (95°C for 15 s, 60°C for 1 min, and gradual heating to 95°C at 0.3°C/s) to verify primer specificity. Relative gene expression levels were calculated using the 2−ΔΔCt (cycle threshold) method and normalized to the housekeeping gene Gapdh to correct for variations in cDNA input and PCR efficiency. Primer sequences are provided in Supplementary Table S2. 6 biological replicates were included per group.
Microglia were isolated from lumbar spinal cord tissues using enzymatic dissociation (papain-based) followed by CD11b magnetic-activated cell sorting (Miltenyi Biotec, 130-049-601, USA). Purified microglia were processed for RNA extraction. Total RNA integrity was confirmed using the RNA Nano 6000 Assay Kit (Agilent Technologies, 5067-1511, Santa Clara, CA, USA) and Bioanalyzer 2100 system (Agilent Technologies, G2938C, Santa Clara). Poly-A mRNA was isolated, fragmented, and reverse transcribed into cDNA. For Poly-A mRNA enrichment, the Lexogen Poly(A) RNA Selection Kit V1.5 (Lexogen GmbH, Catalog No. 157.96, Vienna, Austria) was utilized; RNA fragmentation was performed with the NEBNext® Magnesium RNA Fragmentation Module (New England Biolabs, Inc., Catalog No. E6150S, Ipswich); First-strand cDNA synthesis was carried out using the First-Strand cDNA Synthesis Kit (Thermo Fisher Scientific, Inc., Catalog No. K1612); And library construction was accomplished with the DNA Library Prep Kit with Fragmentation (Watchmaker Genomics, Catalog No. WM-90048, Livermore, CA, USA). Libraries were prepared and validated for insert size and concentration using Qubit 2.0 (Thermo Fisher Scientific (formerly Life Technologies), Catalog No. Q32866, Waltham, MA, USA), Agilent 2100 (Agilent Technologies, Catalog No. G2938C, Santa Clara, CA, USA), and qPCR. Sequencing was performed on the Illumina NovaSeq 6000 platform (Illumina, San Diego, CA, USA) to generate150 bp paired-end reads. Clean reads were aligned to the reference genome (GRCm38) using Hisat2 v2.0.5. Transcript abundance was estimated using featureCounts (2.22.1), and differential expression analysis was performed using DESeq2 (v1.34.0). Differentially expressed genes (DEGs) were defined with the following thresholds: adjusted p-value (Padj) ≤ 0.05 and|log2 fold change (FC)| ≥ 1. The adjusted p-value was calculated using the Benjamini-Hochberg (BH) method to control the false discovery rate (FDR) of multiple hypothesis testing. Genes with Padj > 0.05 or |log2FC| < 1 were considered non-significant. Gene Ontology (GO) and Kyoto Encyclopedia of Genes and Genomes (KEGG) pathway analyses were conducted using clusterProfiler (v4.2.2). We used Gene Set Enrichment Analysis (GSEA) 4.3.3 analysis tool (http://www.broadinstitute.org/gsea/index.jsp) and performed the analysis using predefined datasets from the MSigDB 2023.2 database (species limited to human and mouse), single nucleotide polymorphism (SNP), and alternative splicing (AS) analyses were performed using GSEA tools, GATK2 v2.8.1, SnpEff v4.3t, and rMATS v3.2.5, respectively.
Three independent biological replicates per group (EAE + sIL-2Rα and EAE control) were used for RNA-seq analyses.
2.6 Immunocytochemistry and Immunohistochemistry (ICH)
Samples were fixed in 4% paraformaldehyde for 24 h, for 15 min at room temperature, paraffin-embedded, and sectioned at 5 μm. After antigen retrieval with 0.01 M citrate buffer (pH 6.0), the sections were immersed in 3% H2O2 and permeabilized with 1% Triton X-100 for 5 min and blocked with 3% bovine serum albumin (BSA) (Sigma-Aldrich, A9647, Burlington, MA) for 1 h at room temperature. Primary antibodies (diluted in 3% BSA) (see Supplementary Table S3 for details) were incubated overnight at 4°C. After washing with Phosphate-Buffered Saline with Tween-20 (PBST) three times (5 min each), Alexa Fluor® 488-conjugated goat anti-rabbit IgG (H+L) (Thermo Fisher Scientific, Catalog No. A-11008) was diluted 1:1000 in 3% BSA and incubated for 1 h at room temperature in the dark. The fluorescent label used was Alexa Fluor® 488 (excitation/emission: ~495/519 nm, green fluorescence). Nuclei were counterstained with 4′,6-diamidino-2-phenylindole (DAPI) (Thermo Fisher Scientific, Catalog No. D1306) at a final concentration of 5 μg/mL (diluted 1:5000 in PBS) for 10 min at room temperature in the dark. Images were captured using a fluorescence microscope (Nikon ECLIPSE Ti-S, Japan).
Immunofluorescence images were captured under identical microscope settings across groups. For each mouse, three nonadjacent spinal cord sections were analyzed, and four randomly selected fields within the white matter were quantified.
Quantification was performed using Fiji (ImageJ, 1.54p, NIH). For DAB staining, color deconvolution (“H-DAB”) was applied; the DAB channel was thresholded using the Otsu method. “Analyze Particles” (size 10–200 µm2, circularity 0.2–1.0) was used to count positive cells. For fluorescence, channels were separated, and positive cells were counted based on signal intensity and colocalization with DAPI. Analyses were performed by an investigator blinded to group identity.
Microglial BV2 cells (Cell Bank of Chinese Academy of Sciences, Catalog No. SCSP-213, Shanghai, China) and oligodendrocytes (MBC, Catalog No. PCLM0142, Shanghai, China) were co-cultured in vitro. All cells were tested for mycoplasma contamination using the MycoAlert™ Mycoplasma Detection Kit (Lonza, Catalog No. LT07-318, Basel, Switzerland), and only mycoplasma-negative cells were used for experiments. Four conditions were tested: (1) untreated microglia + MOG antibody, (2) sIL-2Rα-activated microglia + MOG antibody, (3) sIL-2Rα-activated microglia + Fcgr1 siRNA + MOG antibody, and (4) sIL-2Rα-activated microglia without MOG antibody. sIL-2Rα (20 μg/mL) (Mouse Soluble Interleukin—2 Receptor, Biomatik Corporation, EKC40333—96T, Wilmington, DE, USA) was added 24 h before co-culture.
Fcgr1 siRNA (sense strand 5′–3′: CCUGAACUGUGAGACGAAUTT; antisense strand 5′–3′: AUUCGUCUCACAGUUCAGGTT) transfection was conducted 48 h in advance. In brief, BV2 cells in the logarithmic growth phase were seeded in a 6-well plate at a density of 5 × 10⁵ cells per well and cultured overnight at 37°C with 5% CO2. Two hours before transfection, the culture medium was replaced with serum-free MEM (Thermo Fisher Scientific, 12360038). For transfection complex preparation, 10 μL of Fcgr1 siRNA (20 μM) was diluted in 100 μL of Opti-MEM (Thermo Fisher Scientific, 31985070) and incubated for 5 min. Separately, 5 μL of Lipofectamine™ 2000 (Thermo Fisher Scientific, 11668030) was diluted in 100 μL of Opti-MEM and incubated for 5 min. The two solutions were then combined, gently mixed, and incubated for 20 min at room temperature. A total of 200 μL of the resulting mixture was added to each well. After 6 h of incubation, the transfection medium was replaced with normal growth medium, consisting of 89% RPMI-1640 (Thermo Fisher Scientific, 11875093), 10% fetal bovine serum, 1% penicillin-streptomycin, and 1% L-glutamine. Cells were subsequently cultured under standard conditions until analysis.
After pretreated, microglia and oligodendrocytes were simultaneously seeded into 24-well plates at a ratio of 1:2. Cells were co-cultured in a final volume of 1 mL per well, with final concentrations of 5 × 10⁵ cells/mL for microglia and 1 × 10⁶ cells/mL for oligodendrocytes, respectively. After 24 h of co-culture, cytotoxicity was assessed using a lactate dehydrogenase (LDH) release assay, which measures membrane integrity–associated cell damage. LDH activity in the culture supernatant was quantified using a commercial LDH Cytotoxicity Detection Kit (Beyotime, C0016, Shanghai, China), according to the manufacturer’s instructions. Briefly, culture supernatants were collected and incubated with the LDH reaction mixture at room temperature in the dark for 30 min. The enzymatic reaction was stopped using the provided stop solution, and absorbance was measured at 490 nm with a reference wavelength of 630 nm using a microplate reader (Bio-Rad Laboratories, Model 680, Hercules, California, United States). Maximum LDH release was determined by lysing cells with the lysis buffer supplied in the kit. Cytotoxicity was calculated as:
To examine the effect of sIL-2Rα on microglia, BV2 cells were stimulated in vitro under four conditions: (1) PBS, serving as the blank control; (2) sIL-2Rα (20 μg/mL); (3) M1-polarizing stimulation, using LPS (100 ng/mL) (Thermo Fisher Scientific, L2880)and IFN-γ (10 ng/mL) (PeproTech, 315-05, Rocky Hill, NJ, USA); and (4) M2-polarizing stimulation, using IL-4 (20 ng/mL) (PeproTech, 214-14, Rocky Hill, NJ, USA). The expression of four representative molecules was subsequently assessed by qRT-PCR: Fcgr1, an Fc receptor involved in antibody-dependent cellular cytotoxicity (ADCC); CCL2 and TNF-α, markers of M1-like microglial activation; and CD206, a marker associated with M2-like microglial polarization.
The data are represented as mean values accompanied by the standard error of the mean (SEM). Statistical analyses were conducted utilizing GraphPad Prism version 9 (GraphPad Software, Inc., San Diego, CA, USA). When comparing two distinct groups, the unpaired two-tailed Student’s t-test was employed. For situations involving comparisons among multiple groups, a one-way analysis of variance (ANOVA) was performed, followed by either Dunnett’s or Tukey’s post hoc test as deemed appropriate. A p-value of less than 0.05 was regarded as statistically significant.
3.1 sIL-2Rα Exacerbates the Condition in the EAE Mouse Model
3.1.1 Worsening of Physical Symptoms
In the EAE control group, the initial symptoms began to manifest as early as day 13, which included a noticeable reduction in tail tension, weakness observed in both the forelimbs and hindlimbs, difficulties with mobility, and issues related to feeding. By day 21, the disease had escalated to its most severe stage within the control group, characterized by the most pronounced symptoms, which encompassed varying degrees of limb weakness, instances of paralysis, incontinence, and ultimately led to conditions of death or near-death. Conversely, in the sIL-2Rα treatment group, the onset of symptoms began even earlier, starting from day 11, with the peak of the disease occurring by day 20. This indicates that both the onset and peak of symptoms occurred sooner compared to the control group. Furthermore, the Kono’s behavioral score for the sIL-2Rα treatment group was significantly elevated in comparison to that of the control group (Fig. 1A).
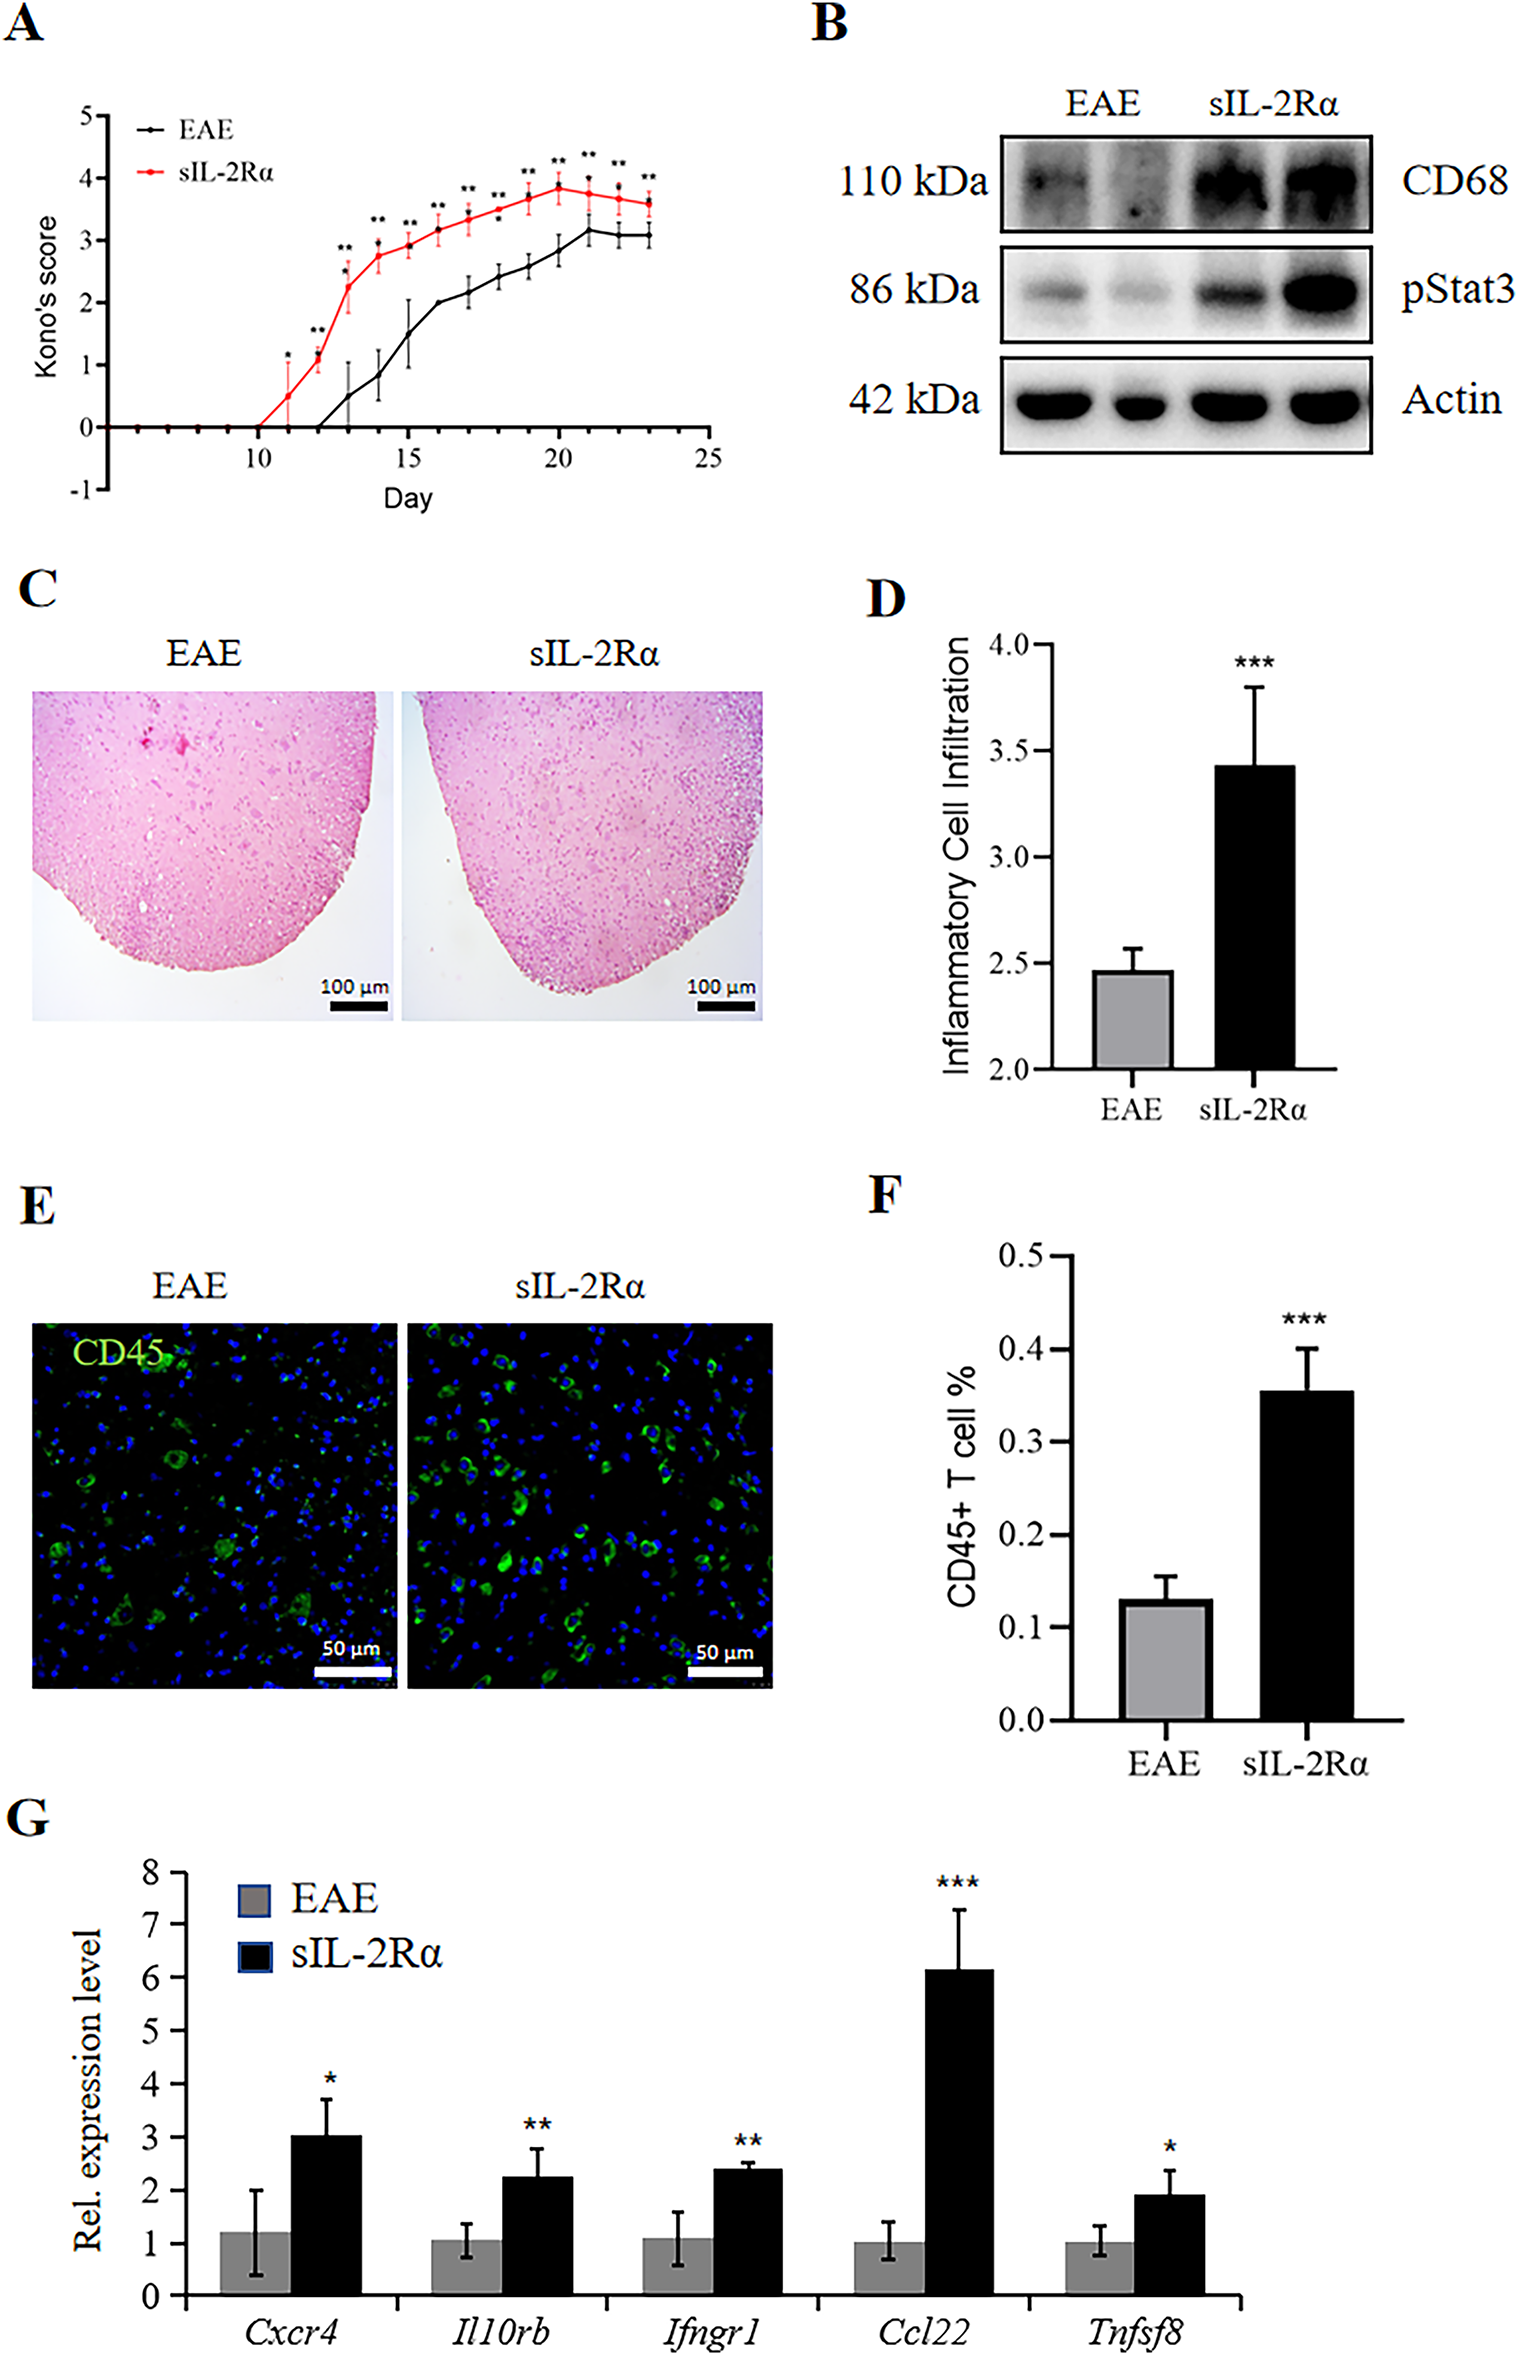
Figure 1: sIL-2Rα administration exacerbates inflammation in the lumbar spinal cord of experimental autoimmune encephalomyelitis (EAE) mice. (A) Kono’s score of mice in the sIL-2Rα treatment group and the EAE control group. (B) Western blot analysis showing the expression levels of the inflammatory proteins CD68 and pStat3 in lumbar spinal cord tissues from both groups. Actin was used as the loading control. (C) Hematoxylin and Eosin (H&E) staining of lumbar spinal cord sections from both groups. Scale bar: 100 μm. (D) A semi-quantitative 5-point histological scoring system for lumbar spinal cord sections from both groups. (E) Immunofluorescence staining for CD45 in lumbar spinal cord sections. Scale bar: 50 μm. (F) Proportion of CD45+ T cells in the lumbar spinal cord lesions of both groups. (G) Quantitative reverse transcription polymerase chain reaction (qRT-PCR) analysis of the expression levels of inflammatory genes (Cxcr4, Il10rb, Ifngr1, Ccl22, and Tnfsf8) in lumbar spinal cord tissues. n = 8 for the sIL-2Rα treatment group; n = 7 for the EAE control group. *p < 0.05; **p < 0.01; ***p < 0.001
3.1.2 Intensification of Local Inflammation
The Western blotting analysis conducted on lumbar spinal cord tissue samples from both experimental groups demonstrated a notable increase in the expression levels of proteins associated with inflammation. Specifically, proteins such as CD68, a marker of microglial activation, and pStat3 showed a higher trend in the sIL-2Rα–treated group compared with the EAE control group, although the difference did not reach statistical significance (Fig. 1B). Furthermore, histological examination through H&E staining of lumbar spinal cord sections revealed that within the white matter region, there was a marked increase in the infiltration of inflammatory cells in the sIL-2Rα treatment group relative to the control group, with these differences being statistically significant, as depicted in Fig. 1C,D. A semi-quantitative 5-point histological scoring system was used to assess inflammatory cell infiltration in H&E-stained spinal cord sections. This system was adapted from previously published inflammation scoring approaches [13] and modified for our experimental conditions. Additionally, immunostaining for CD45, a specific marker for T-lymphocytes, indicated a greater accumulation of these immune cells within the lesion area of the sIL-2Rα group compared to the control group, again showing statistically significant differences, as shown in Fig. 1E,F. Lastly, quantitative real-time PCR (qRT-PCR) analysis of gene expression related to inflammation revealed elevated levels of Cxcr4, Il10rb, Ifngr1, Ccl22, and Tnfsf8 in the sIL-2Rα treatment group, with these differences also being statistically significant, as evidenced in Fig. 1G. The findings from this study suggest that the treatment involving sIL-2Rα leads to an increase in inflammation within the central nervous system of EAE mice.
3.2 sIL-2Rα Promotes a Pro-Inflammatory Microglial Transcriptional Profile
Given the evolving understanding that microglial activation exists along a functional spectrum rather than discrete M1/M2 states, we use these terms descriptively and cautiously to indicate relative expression of commonly associated markers.
Immunohistochemical analysis for IBA1 in the lumbar spinal cord lesions revealed that the sIL-2Rα treatment group exhibited a greater buildup of microglia in the lesions than the EAE control group (Fig. 2A). qRT-PCR analysis of lumbar spinal cord tissue revealed that the expression levels of Cd68 (a microglial marker) and Cd86 (an M1-type microglial marker) were significantly higher in the sIL-2Rα treatment group compared to the control group (Fig. 2B). Additionally, immunohistochemical staining confirmed that the expression of CD68 and CD86 was elevated in the sIL-2Rα group compared to the control group (Fig. 2C,D). Administration of sIL-2Rαappears to trigger M1-type microglial activation in EAE mice.
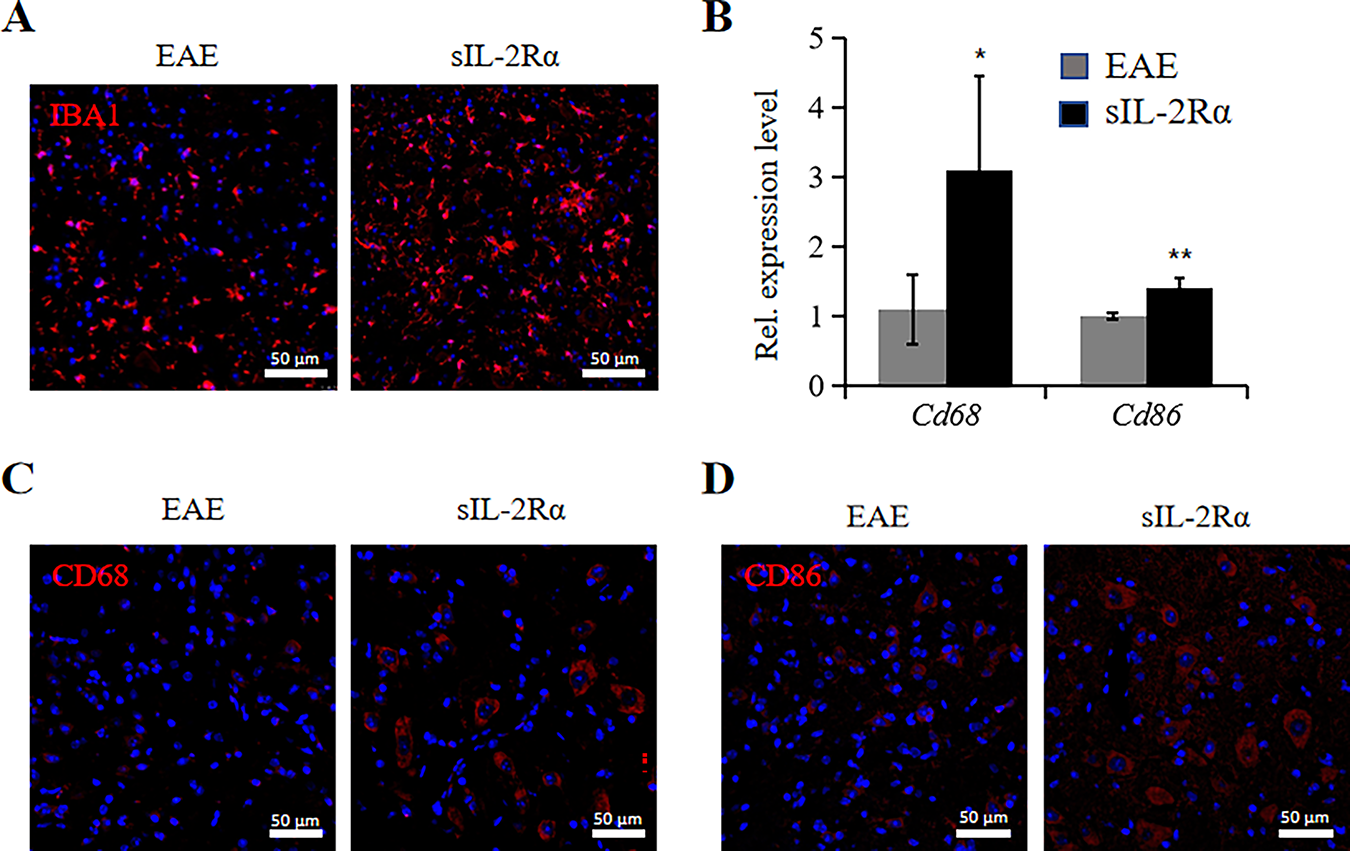
Figure 2: sIL-2Rα treatment induces M1-type activation of microglia. (A) Immunofluorescence staining for IBA1 to detect microglia in lumbar spinal cord lesions of both sIL-2Rα-treated and EAE control mice. Scale bar: 50 μm. (B) qRT-PCR analysis of Cd68 and Cd86 expression levels in lumbar spinal cord tissues from both groups. (C) Immunofluorescence staining for CD68 in lumbar spinal cord sections from both groups. Scale bar: 50 μm. (D) Immunofluorescence staining for CD86 in lumbar spinal cord sections from both groups. Scale bar: 50 μm. n = 10 for each group. *p < 0.05; **p < 0.01
3.3 Mechanisms of SIL-2RΑ Activation of Microglia
3.3.1 RNA-Seq Data Indicate AKT Pathway Activation
We collected spinal cord tissue from both the sIL-2Rα treatment group and the EAE control group mice, isolated microglia, and performed RNA sequencing (RNA-Seq) to analyze the transcriptomic differences. Clustering analysis of the differentially expressed genes showed significant alterations between the two groups (Fig. 3A). KEGG pathway enrichment analysis of the differentially expressed genes revealed that sIL-2Rα primarily regulates the activity of the PI3K-Akt pathway, along with various inflammatory pathways (Fig. 3B). Previous studies have shown that the PI3K-Akt signaling pathway plays a critical regulatory role in microglial activation. Clustering analysis of PI3K-Akt-related genes further demonstrated a significant increase in the expression of these genes in the sIL-2Rα treatment group (Fig. 3C). These results suggest that sIL-2Rα may induce M1-type microglial activation and contribute to the development of MS through the PI3K-Akt signaling pathway.
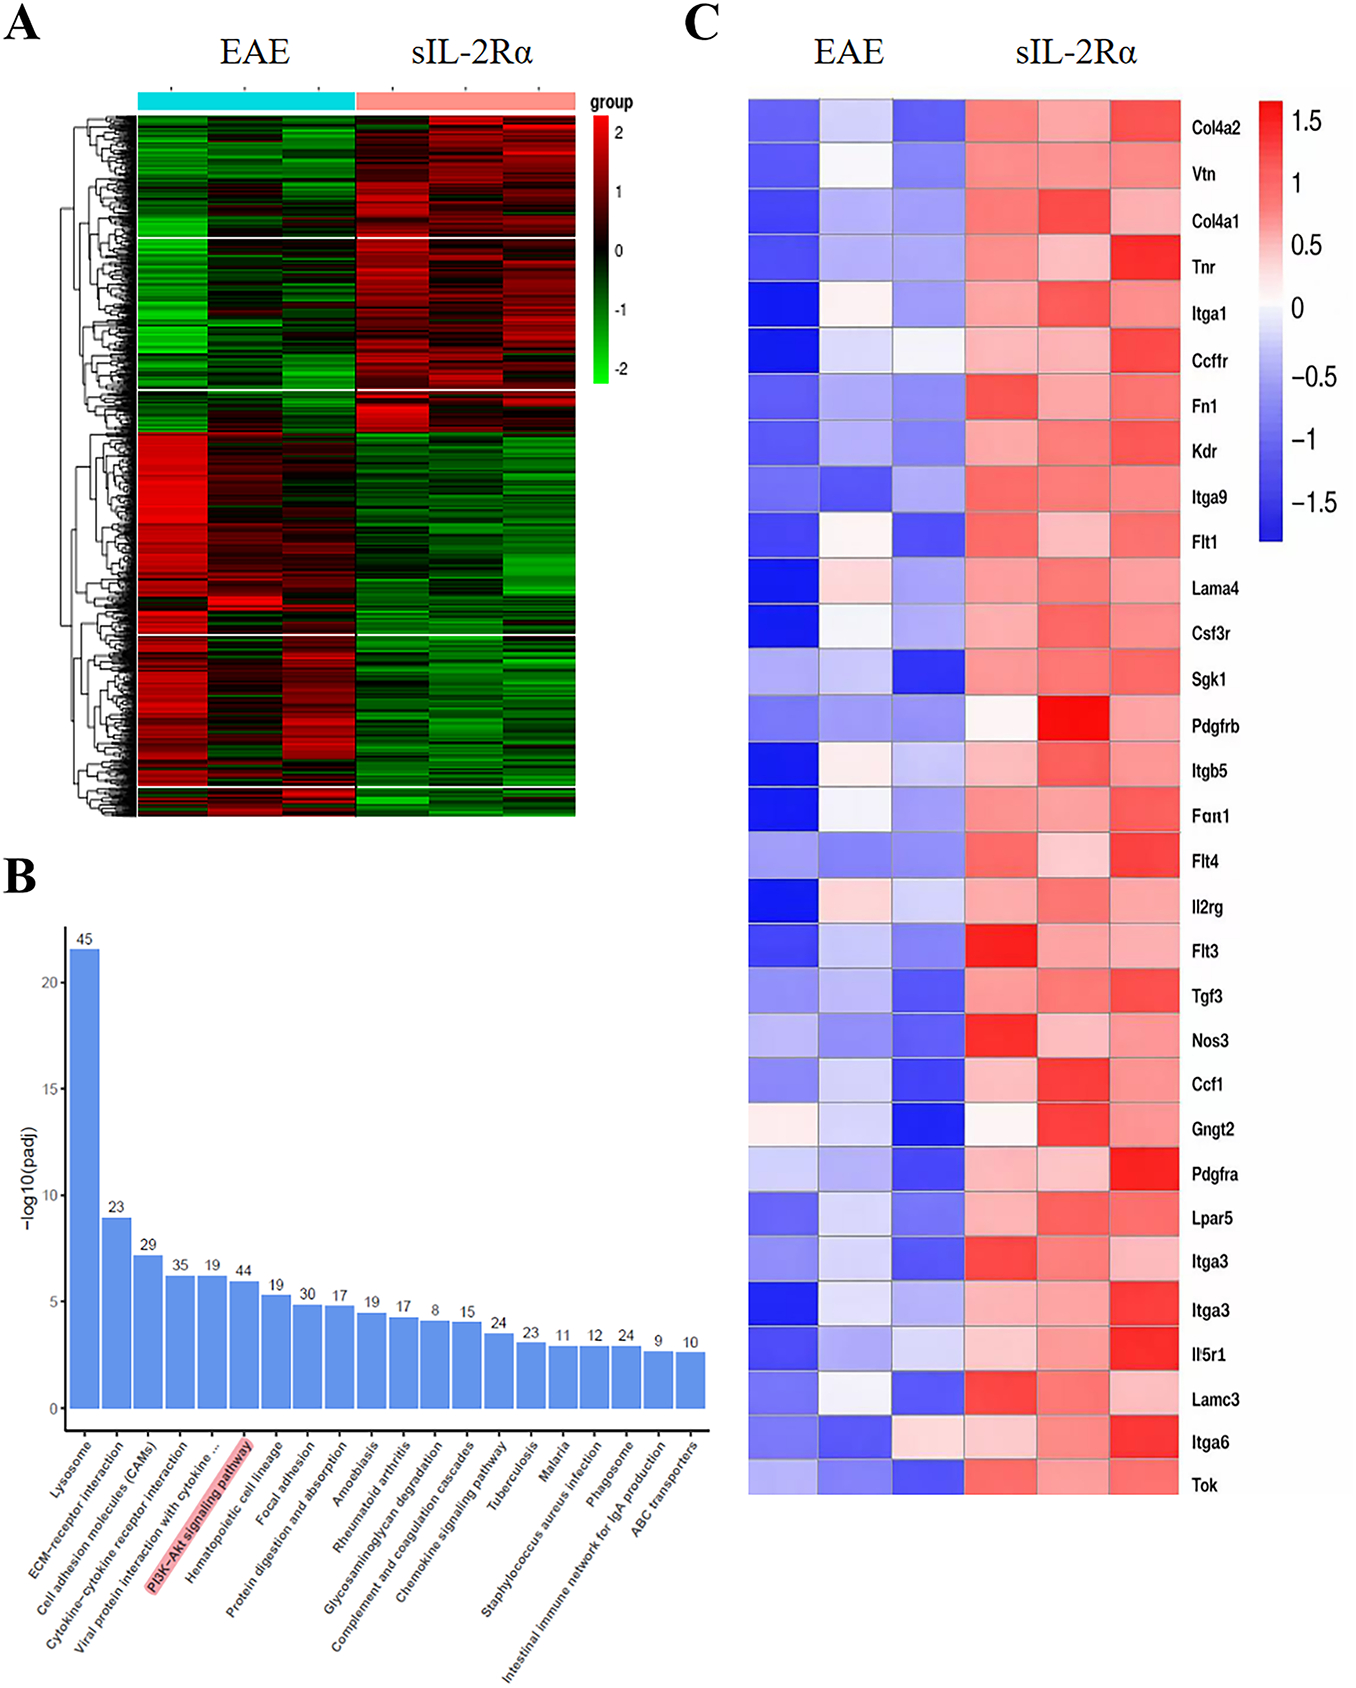
Figure 3: Transcriptional profiling of microglia from sIL-2Rα-treated and EAE control mice. (A) Heatmap analysis of differentially expressed genes in microglia from the spinal cord of both groups. p < 0.05. (B) Kyoto Encyclopedia of Genes and Genomes (KEGG) pathway enrichment analysis of significantly differentially expressed genes in microglia from the sIL-2Rα-treated mice. (C) Heatmap of differential genes related to the PI3K-Akt signaling pathway in microglia from both groups. n = 10 for each group, 3–4 animals’ tissues was pooled into one sample. p < 0.05
3.3.2 Additional Methods for Verification
The above results indicate that sIL-2Rα activates M1-type microglia through the PI3K-Akt signaling pathway. To further verify this, we used qRT-PCR to examine the expression of PI3K-Akt-related genes in microglia isolated from the spinal cord of both groups. The results showed that in the sIL-2Rα treatment group, the expression levels of genes associated with the PI3K-Akt pathway, including Itga1, Itga3, Itgb1, Itgb5, Il6ra, Igf1, Pdgfra, Csf1r, Kdr, Tek, Flt4, Bcl2l11, and Spp1, were significantly elevated compared to the control group (Fig. 4A). Additionally, Gene Set Enrichment Analysis (GSEA) confirmed that the PI3K-Akt pathway gene set was significantly upregulated in the microglia of the sIL-2Rα treatment group (Fig. 4B).
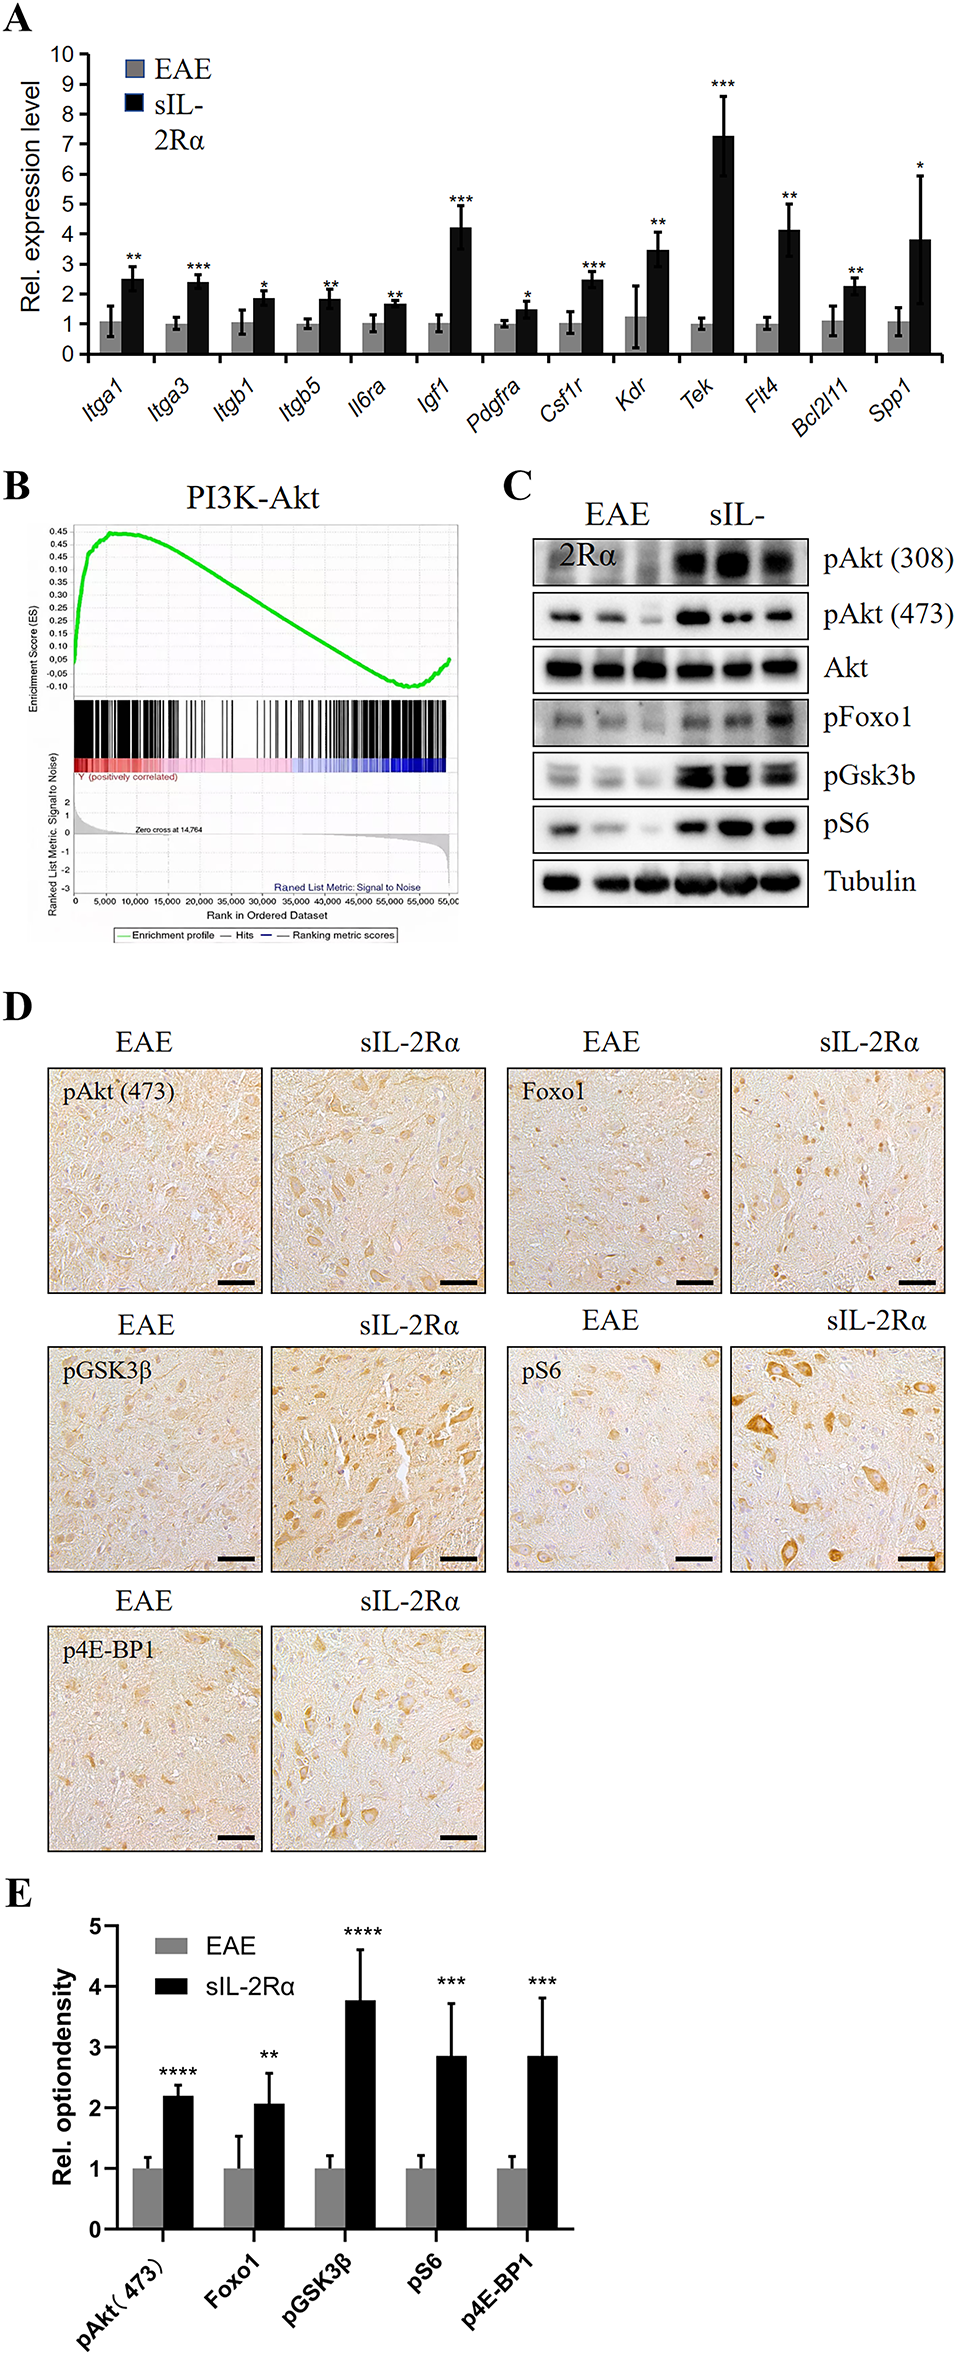
Figure 4: Validation of PI3K-Akt pathway activation in microglia by sIL-2Rα. (A) qRT-PCR analysis of PI3K-Akt pathway-related gene expression in microglia isolated from the lumbar spinal cord of sIL-2Rα-treated and EAE control mice. (B) Gene set enrichment analysis (GSEA) enrichment analysis of the PI3K-Akt pathway in microglia from both groups. (C) Western blot analysis of PI3K-Akt pathway-related proteins (pAkt [308 and 473], Akt, pFoxo1, pGSK3b, pS6) in microglia from both groups. Tubulin was used as the loading control. (D) Immunohistochemical staining of key downstream PI3K-Akt signaling proteins (pAkt [473], Foxo1, pGSK3b, pS6, and p4E-BP1) in lumbar spinal cord tissues. Scale bar: 50 μm. (E) Quantitative analysis of immunostaining results for phosphorylated protein kinase B (pAkt), forkhead box protein O1 (Foxo1), phosphorylated glycogen synthase kinase 3β (pGSK3β), phosphorylated ribosomal protein S6 (pS6), and phosphorylated eukaryotic translation initiation factor 4E-binding protein 1 (p4E-BP1). n = 10 for each group. *p < 0.05; **p < 0.01; ***p < 0.001; ****p < 0.0001
Western blot analysis of PI3K-Akt pathway-related proteins revealed that in the sIL-2Rα treatment group, the expression levels of key proteins, including pAKT (Ser473 and Thr308), pFoxo1, pGSK3b, and pS6, showed an upward trend in microglia (Fig. 4C). Furthermore, immunostaining showed increased expression of pAKT (Ser473), Foxo1, pGSK3b, pS6, and p4E-BP1 in lumbar spinal cord tissue of the sIL-2Rα group (Fig. 4D), with statistically significant differences (Fig. 4E). These results further confirm that sIL-2Rα activates the PI3K-Akt signaling pathway in microglia of EAE mice.
3.4 The Mechanisms of Activated Microglia Exaggerating MS
3.4.1 Activated Microglia Upregulate Fc Receptors
The experimental findings presented above indicate that sIL-2Rα has the capability to activate microglia. This raises an important question: in what way does the activation of microglia play a role in worsening the condition of EAE. We propose the hypothesis that the activation of microglia leads to an intensification of EAE symptoms by targeting oligodendrocytes through a mechanism known as ADCC. Given that ADCC is facilitated by Fc receptors, we initiated our investigation by assessing the expression of these Fc receptors on microglia activated by sIL-2Rα. The results from qRT-PCR demonstrated that, in vitro, microglia activated by sIL-2Rα exhibited elevated levels of Fc receptors when compared to their non-activated counterparts. Furthermore, our findings revealed that the expression profile of microglia activated by sIL-2Rα closely resembles that of M1 microglia, in contrast to M2 microglia (Fig. 5A).
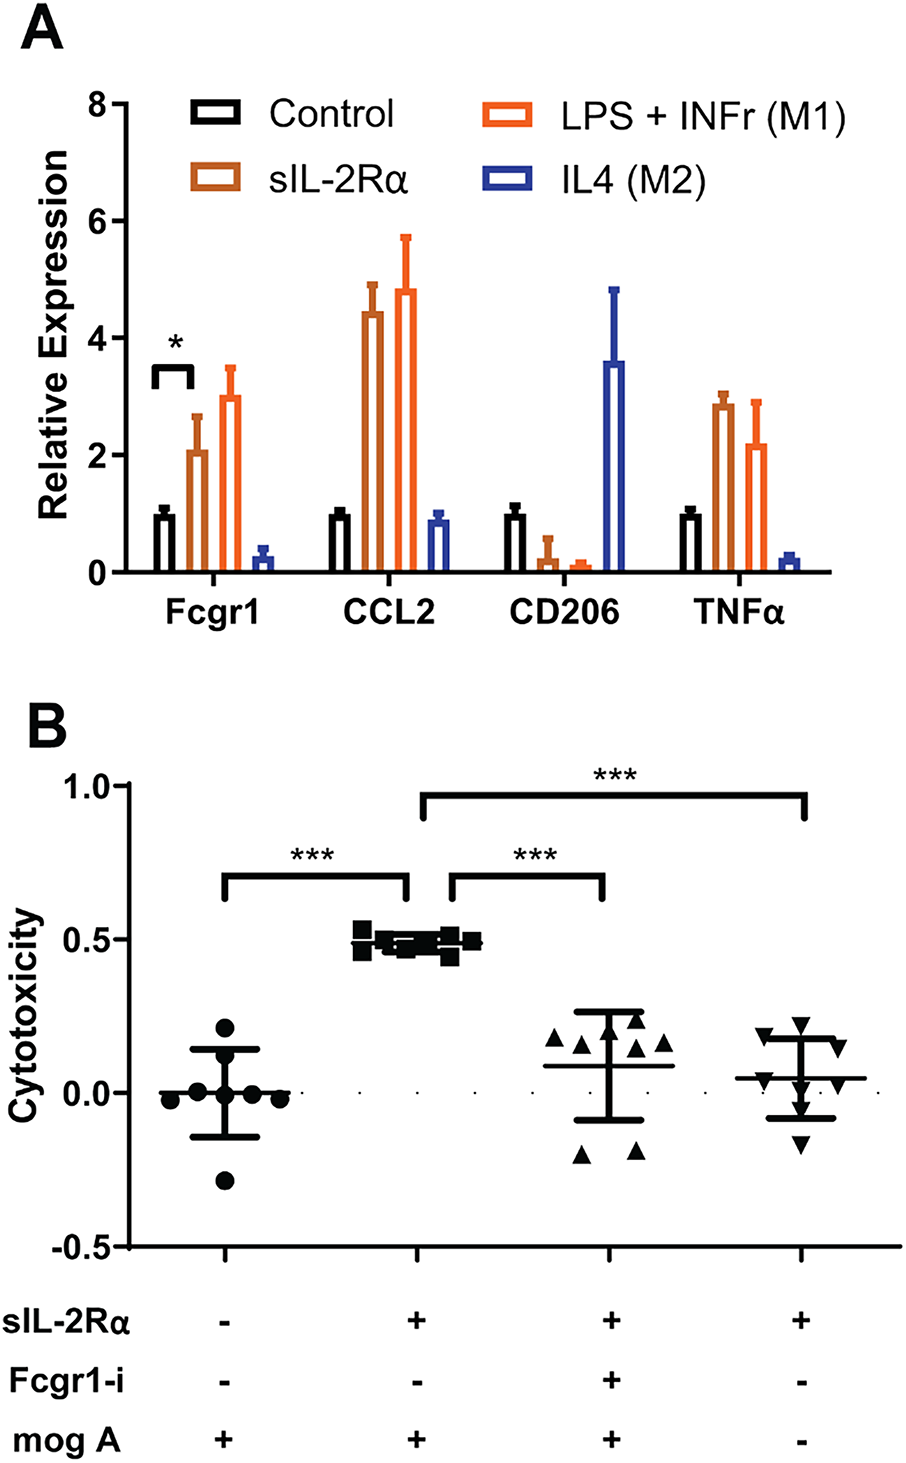
Figure 5: Activated microglia exacerbate MS by facilitating antibody-dependent cellular cytotoxicity (ADCC). (A) sIL-2Rα treatment upregulates Fc receptors on microglia. qRT-PCR results show the expression of Fcgr1, C-C motif chemokine ligand 2 (CCL2), CD206, and Tumor Necrosis Factorα (TNFα) in microglia under various conditions: Phosphate-Buffered Saline (PBS) (control), sIL-2Rα, LPS + IFNγ (M1 microglia), and IL4 (M2 microglia). (B) Cytotoxicity assessment in the microglia–oligodendrocyte co-culture system under different experimental conditions. Cytotoxicity was evaluated by measuring LDH release in the culture supernatant, reflecting overall cell damage in the co-culture. sIL-2Rα–activated microglia in the presence of MOG antibodies significantly increased LDH release, while Fcgr1 knockdown in microglia or omission of MOG antibodies markedly reduced cytotoxicity. Fcgr1-si refers to Fcgr1 siRNA; mogA refers to MOG antibodies. Data are presented as mean ± SEM. One-way ANOVA followed by Dunnett’s multiple comparisons test. n = 8 per group. *p < 0.05; ***p < 0.001
3.4.2 Fc Receptors Facilitating ADCC
In order to explore the potential involvement of Fc receptors present on microglia in the ADCC effect, we carried out a specific cytotoxicity experiment. Our findings revealed that microglia activated by sIL-2Rα inflicted significantly more damage on the oligodendrocytes that were co-cultured with them, in comparison to those microglia that remained untreated. Nonetheless, the application of Fcgr1 siRNA, along with the absence of MOG antibodies, successfully protected the oligodendrocytes from undergoing cell death (Fig. 5B).
In this comprehensive study, we explored the significant role of sIL-2Rα in the underlying mechanisms of MS. Our investigation placed particular emphasis on how sIL-2Rα influences microglial activation and the subsequent aggravation of the disease. The results of our research indicate that sIL-2Rα not only initiates the activation of microglia but also contributes to the worsening of EAE, which serves as a prominent animal model for studying MS. We propose that sIL-2Rα enhances the inflammatory response in the central nervous system (CNS) through the activation of the PI3K-Akt signaling pathway, leading to increased microglial cytotoxicity and exacerbation of oligodendrocyte injury.
sIL-2RαsIL-2Rα arises from the proteolytic cleavage of activated T cells, with its shedding levels linked to T cell proliferation rates. In steady state, systemic sIL-2RαsIL-2Rα remains remarkably stable, making it a widely used biomarker for inflammatory diseases [14]. MS patients show increased sIL-2RαsIL-2Rα levels [15]. Although CD25 has a lower affinity for IL-2 than other IL-2R complexes, sIL-2RαsIL-2Rα binds IL-2 effectively and exhibits immunomodulatory effects in vitro [16]. In previous studies, sIL-2RαsIL-2Rα was demonstrated to exacerbate EAE, which was related to increased Th17 responses in the periphery and greater CD4+ Th1 and Th17 infiltration into the CNS [17]. Like IL-2 neutralization via monoclonal antibodies, sIL-2RαsIL-2Rα boosts Th17 responses in vitro by blocking IL-2R signaling through local IL-2 sequestration [17]. The IL-2R signaling pattern in Tregs is related to the expression of PTEN (phosphatase and tensin homolog deleted on chromosome 10) and negative regulation of PI3K-dependent signaling [18].
Our findings revealed that the administration of sIL-2Rα resulted in an earlier appearance of disease symptoms and more severe clinical manifestations in the EAE model. This conclusion is supported by both Kono’s score and thorough histological examinations. Specifically, mice treated with sIL-2Rα exhibited significantly more pronounced limb weakness, greater levels of paralysis, and increased mortality rates when compared to the control group. These observations align with earlier studies that indicate higher levels of sIL-2Rα correlate with poorer outcomes in MS patients, suggesting its potential role as a marker for disease severity [15,19].
At the mechanistic level, our research demonstrated that sIL-2Rα has the capacity to activate microglia, which results in their polarization toward the M1 phenotype. This M1 phenotype represents a pro-inflammatory state that is well-documented for its role in contributing to neuroinflammation associated with MS [20–22]. Utilizing RNA sequencing techniques, we were able to identify a significant activation of the PI3K-Akt signaling pathway in microglia following treatment with sIL-2Rα. This pathway has been previously linked to microglial activation and the inflammatory response observed in various neurodegenerative diseases, including MS [23–25]. Furthermore, by inhibiting this pathway through the use of siRNA that targets Fcgr1, which is a crucial mediator of ADCC [21,26,27], we found that this intervention partially reversed the cytotoxic effects that microglia exert on oligodendrocytes. This suggests that both the PI3K-Akt pathway and Fc receptor-mediated ADCC are integral to the pathology underlying the exacerbation of MS. However, recent data support that the links between PI3K-Akt signaling and Fc receptor upregulation are correlative, not causative. Future studies should include specific PI3K-Akt pathway inhibitors to confirm causality.
ADCC plays a crucial and significant role in the injury inflicted upon oligodendrocytes, which ultimately leads to the demyelination that is characteristically observed in MS [28,29]. In the course of our research, we observed a noteworthy increase in the expression levels of Fc receptors on microglia following the activation of sIL-2Rα. This finding supports the notion that the Fc receptors located on microglia are vital in facilitating the process of ADCC, which subsequently contributes to the damaging effects on oligodendrocytes. The elevated expression of these Fc receptors likely enhances the capacity of microglia to engage in ADCC, thereby intensifying the immune-mediated destruction of oligodendrocytes and exacerbating the damage to myelin. This important discovery further reinforces the link between the activation of microglia triggered by sIL-2Rα and the essential pathological features associated with MS.
The findings of this study provide certain experimental evidence for the role of sIL-2Rα in MS progression, suggesting that it may be involved in disease pathogenesis by regulating microglial activation and influencing inflammatory responses in the central nervous system (CNS). The research indicates that targeting sIL-2Rα or its associated signaling pathways (such as the PI3K-Akt pathway) holds promise for offering new directions in the exploration of MS treatment.
Specifically, intervention strategies aimed at inhibiting the abnormal activation of microglia or moderately attenuating the ADCC effect may have potential positive implications for slowing disease progression and protecting the neurological function of patients with MS. Recent experimental evidence supported that miR-151-5p could alleviate corneal allograft rejection via targeting IL-2Rα and activating PI3K/AKT signaling pathway, which indicates IL-2Rα/PI3K/AKT axis as a potential novel clinical intervention for clinical intervention of immune inflammation [30]. The downregulation of miR-151-5p suppressed corneal endothelium cells proliferation and migration while enhancing immune rejection by inhibiting the PI3K/AKT signaling pathway through the upregulation of IL-2Rα in rats [30].
Nonetheless, it is important to acknowledge several limitations associated with our study that should be taken into account. To begin with, only female mice were selected due to their higher susceptibility to experimental autoimmune encephalomyelitis (EAE) induction, which reflects the greater prevalence of MS in females clinically. While including both sexes could provide broader applicability, our choice focused on consistency and reducing biological variability. Future studies should incorporate both genders to validate the universality of the observed results. Secondly, although the EAE model is extensively utilized in research concerning MS, it fails to fully capture every aspect of the human condition, particularly the chronic and relapsing-remitting characteristics inherent to MS. Future research endeavors that employ chronic models of MS may yield deeper insights into the long-term implications of sIL-2Rα on the progression of the disease. Thirdly, we note that naïve animals were not included as a baseline control. Thus, interpretations of inflammatory levels rely on comparisons between treated and untreated EAE groups and do not represent baseline physiological expression. Fourthly, microglia are highly dynamic and plastic cells [31], and using M1/M2 classification is not accurate. However, it may be more confusing if markers were used to name them, like CD206-positive microglia.
In addition, a methodological limitation of the present study should be acknowledged regarding the in vitro cytotoxicity assay. In the microglia–oligodendrocyte co-culture system, cytotoxicity was evaluated using LDH release in the culture supernatant, which reflects overall membrane damage within the mixed cell population. Because microglia and oligodendrocytes were seeded together in the same wells, this approach does not allow direct discrimination of the specific cell type undergoing cell death. Although the experimental design and controls support a role for microglial Fc receptor–mediated mechanisms in promoting oligodendrocyte injury, cell-type–specific viability or death was not directly visualized. Future studies incorporating cell-specific labeling or live/dead imaging approaches will be required to more precisely define the cellular source of cytotoxicity in this co-culture system. Furthermore, while our findings indicate that microglial activation significantly contributes to the worsening of the disease, the role of other immune cell types, including T cells and macrophages, in the observed effects remains ambiguous and requires further examination.
In conclusion, our research highlights the significant and pivotal role that sIL-2Rα plays in the activation of microglia and the progression of MS. It appears that the activation of the PI3K-Akt signaling pathway, along with Fc receptor-mediated ADCC in microglia, are crucial mechanisms that contribute to the worsening of EAE. These insightful findings pave the way for the development of targeted therapies that aim to modulate microglial activity and the associated inflammatory signaling pathways, thereby potentially providing innovative strategies for the treatment of MS and other neuroinflammatory conditions.
Acknowledgement: We sincerely thank all members of our research group for their continuous support and assistance throughout this study. We are grateful for the excellent research platform and experimental conditions provided by our laboratory, as well as the professional technical support from the core facility.
Funding Statement: This work was supported by the National Natural Science Foundation of China [82201489, 2022]. The funding source had no involvement in the conduct of the research or the preparation of the article.
Author Contributions: The authors confirm contribution to the paper as follows: study conception and design: Jingfei Shi, Hui Lu; data collection: Jingfei Shi, Hui Lu; analysis and interpretation of results: Hui Lu, Yi Ding; draft manuscript preparation: Jingfei Shi, Yi Ding. All authors reviewed and approved the final version of the manuscript.
Availability of Data and Materials: The datasets generated during and/or analyzed during the current study are available from the corresponding author [Hui Lu] on reasonable request.
Ethics Approval: All experiments were approved by the Animal Care and Use Committee of the Institute of Laboratory Animal Science, Capital Medical University (AEEI-2023-1069), and conducted in compliance with the NIH Guide for the Care and Use of Laboratory Animals.
Conflicts of Interest: The authors declare no conflicts of interest.
Supplementary Materials: The supplementary material is available online at https://www.techscience.com/doi/10.32604/journal.2025.0xxxxx/s1. Table S1. Detailed information regarding the primary antibodies used for western blot experiments. Table S2. Detailed information regarding the primer sequences of the genes for qRT-PCR experiments Table S3. Detailed information regarding the antibodies for immunocytochemistry and immunohistochemistry experiments.
References
1. Reich DS, Lucchinetti CF, Calabresi PA. Multiple sclerosis. N Engl J Med. 2018;378(2):169–80. doi:10.1056/nejmra1401483. [Google Scholar] [PubMed] [CrossRef]
2. Karikari TK, Charway-Felli A, Höglund K, Blennow K, Zetterberg H. Commentary: global, regional, and national burden of neurological disorders during 1990–2015: a systematic analysis for the global burden of disease study 2015. Lancet Neurol. 2017;16(11):877–97. doi:10.3389/fneur.2018.00201. [Google Scholar] [PubMed] [CrossRef]
3. Silveira SL, Cederberg KLJ, Jeng B, Sikes EM, Sandroff BM, Jones CD, et al. Symptom clusters and quality of life in persons with multiple sclerosis across the lifespan. Qual Life Res. 2021;30(4):1061–71. doi:10.1007/s11136-020-02689-x. [Google Scholar] [PubMed] [CrossRef]
4. Lu H, Wu PF, Zhang W, Liao X. Circulating interleukins and risk of multiple sclerosis: a Mendelian randomization study. Front Immunol. 2021;12:647588. doi:10.3389/fimmu.2021.647588. [Google Scholar] [PubMed] [CrossRef]
5. Peerlings D, Mimpen M, Damoiseaux J. The IL-2–IL-2 receptor pathway: key to understanding multiple sclerosis. J Transl Autoimmun. 2021;4(6):100123. doi:10.1016/j.jtauto.2021.100123. [Google Scholar] [PubMed] [CrossRef]
6. Rangani F, Rakhshi N, Kadkhoda Mezerji Z, Alikhah A, Dehghanzad R, Abbasi B, et al. Association of IL2RA and multiple sclerosis risk: a case control, systematic review, and meta-analysis study. J Neurol Sci. 2025;472(3):123461. doi:10.1016/j.jns.2025.123461. [Google Scholar] [PubMed] [CrossRef]
7. Li Y, Li X, Geng X, Zhao H. The IL-2A receptor pathway and its role in lymphocyte differentiation and function. Cytokine Growth Factor Rev. 2022;67(4):66–79. doi:10.1016/j.cytogfr.2022.06.004. [Google Scholar] [PubMed] [CrossRef]
8. Lokau J, Petasch LM, Garbers C. The soluble IL-2 receptor α/CD25 as a modulator of IL-2 function. Immunology. 2024;171(3):377–87. doi:10.1111/imm.13723. [Google Scholar] [PubMed] [CrossRef]
9. Long D, Yu S, Zhang L, Guo Y, Xu S, Rao Y, et al. Increased sIL-2Rα leads to obstruction of IL-2 biological function and Treg cells differentiation in SLE patients via binding to IL-2. Front Immunol. 2022;13:938556. doi:10.3389/fimmu.2022.938556. [Google Scholar] [PubMed] [CrossRef]
10. Zhang L, Wang Y, Liu T, Mao Y, Peng B. Novel microglia-based therapeutic approaches to neurodegenerative disorders. Neurosci Bull. 2023;39(3):491–502. doi:10.1007/s12264-022-01013-6. [Google Scholar] [PubMed] [CrossRef]
11. Casali BT, Reed-Geaghan EG. Microglial function and regulation during development, homeostasis and Alzheimer’s disease. Cells. 2021;10(4):957. doi:10.3390/cells10040957. [Google Scholar] [PubMed] [CrossRef]
12. Lu Q, Kim JY. Microglial clock dysfunction during neuroinflammation impairs oligodendrocyte progenitor cell recruitment and disrupts neuroimmune homeostasis. Front Immunol. 2025;16:1620343. doi:10.3389/fimmu.2025.1620343. [Google Scholar] [PubMed] [CrossRef]
13. Matsuda R, Miyasaka Y, Yamada Y, Kawata J, Sakihama K, Yamamoto T, et al. Chronic inflammatory changes and oxidative stress in the background of “pancreatic ductal adenocarcinoma concomitant with intraductal papillary mucinous neoplasm”. Virchows Arch. 2020;477(6):799–806. doi:10.1007/s00428-020-02844-2. [Google Scholar] [PubMed] [CrossRef]
14. Rubin LA, Nelson DL. The soluble interleukin-2 receptor: biology, function, and clinical application. Ann Intern Med. 1990;113(8):619–27. doi:10.7326/0003-4819-113-8-619. [Google Scholar] [PubMed] [CrossRef]
15. Maier LM, Anderson DE, Severson CA, Baecher-Allan C, Healy B, Liu DV, et al. Soluble IL-2RA levels in multiple sclerosis subjects and the effect of soluble IL-2RA on immune responses. J Immunol. 2009;182(3):1541–7. doi:10.4049/jimmunol.182.3.1541. [Google Scholar] [PubMed] [CrossRef]
16. Rubin LA, Jay G, Nelson DL. The released interleukin 2 receptor binds interleukin 2 efficiently. J Immunol. 1986;137(12):3841–4. doi:10.4049/jimmunol.137.12.3841. [Google Scholar] [CrossRef]
17. Russell SE, Moore AC, Fallon PG, Walsh PT. Soluble IL-2Rα (sCD25) exacerbates autoimmunity and enhances the development of Th17 responses in mice. PLoS One. 2012;7(10):e47748. doi:10.1371/journal.pone.0047748. [Google Scholar] [PubMed] [CrossRef]
18. Bensinger SJ, Walsh PT, Zhang J, Carroll M, Parsons R, Rathmell JC, et al. Distinct IL-2 receptor signaling pattern in CD4+CD25+ regulatory T cells. J Immunol. 2004;172(9):5287–96. doi:10.4049/jimmunol.172.9.5287. [Google Scholar] [PubMed] [CrossRef]
19. Buhelt S, Søndergaard HB, Mahler MR, Cobanovic S, Börnsen L, Ammitzbøll C, et al. Biomarkers of systemic inflammation, soluble IL-2Rα and the multiple sclerosis-associated IL2RA SNP rs2104286 in healthy subjects and multiple sclerosis patients. Mult Scler Relat Disord. 2021;54:103140. doi:10.1016/j.msard.2021.103140. [Google Scholar] [PubMed] [CrossRef]
20. Miron VE, Boyd A, Zhao JW, Yuen TJ, Ruckh JM, Shadrach JL, et al. M2 microglia and macrophages drive oligodendrocyte differentiation during CNS remyelination. Nat Neurosci. 2013;16(9):1211–8. doi:10.1038/nn.3469. [Google Scholar] [PubMed] [CrossRef]
21. Bournazos S, Gupta A, Ravetch JV. The role of IgG Fc receptors in antibody-dependent enhancement. Nat Rev Immunol. 2020;20(10):633–43. doi:10.1038/s41577-020-00410-0. [Google Scholar] [PubMed] [CrossRef]
22. Guo S, Wang H, Yin Y. Microglia polarization from M1 to M2 in neurodegenerative diseases. Front Aging Neurosci. 2022;14:815347. doi:10.3389/fnagi.2022.815347. [Google Scholar] [PubMed] [CrossRef]
23. Sun M, Gong P, Yuan B, Liu N, Li X, Zhang W, et al. AXL-Induced Autophagy mitigates experimental autoimmune encephalomyelitis by suppressing microglial inflammation via the PI3K/AKT/mTOR signaling pathway. Mol Immunol. 2023;159(11):15–27. doi:10.1016/j.molimm.2023.05.005. [Google Scholar] [PubMed] [CrossRef]
24. Tonev D, Momchilova A. Oxidative stress and the nuclear factor erythroid 2-related factor 2 (Nrf2) pathway in multiple sclerosis: focus on certain exogenous and endogenous Nrf2 activators and therapeutic plasma exchange modulation. Int J Mol Sci. 2023;24(24):17223. doi:10.3390/ijms242417223. [Google Scholar] [PubMed] [CrossRef]
25. Chu E, Mychasiuk R, Hibbs ML, Semple BD. Dysregulated phosphoinositide 3-kinase signaling in microglia: shaping chronic neuroinflammation. J Neuroinflammation. 2021;18(1):276. doi:10.1186/s12974-021-02325-6. [Google Scholar] [PubMed] [CrossRef]
26. Nimmerjahn F, Ravetch JV. Fcgamma receptors as regulators of immune responses. Nat Rev Immunol. 2008;8(1):34–47. doi:10.1038/nri2206. [Google Scholar] [PubMed] [CrossRef]
27. Kiyoshi M, Caaveiro JM, Kawai T, Tashiro S, Ide T, Asaoka Y, et al. Structural basis for binding of human IgG1 to its high-affinity human receptor FcγRI. Nat Commun. 2015;6(1):6866. doi:10.1038/ncomms7866. [Google Scholar] [PubMed] [CrossRef]
28. Mar P. Antibody-dependent cellular cytotoxicity in multiple sclerosis. J Neurol Sci. 1980;47(2):285–303. doi:10.1016/0022-510x(80)90012-x. [Google Scholar] [PubMed] [CrossRef]
29. Corbali O, Chitnis T. Pathophysiology of myelin oligodendrocyte glycoprotein antibody disease. Front Neurol. 2023;14:1137998. doi:10.3389/fneur.2023.1137998. [Google Scholar] [PubMed] [CrossRef]
30. Cao Q, Li Y, Li Y, Li L. miR-151-5p alleviates corneal allograft rejection by activating PI3K/AKT signaling pathway and balancing Th17/Treg after corneal transplantation via targeting IL-2Rα. Ann Transl Med. 2021;9(18):1410. doi:10.21037/atm-21-2054. [Google Scholar] [PubMed] [CrossRef]
31. Paolicelli RC, Sierra A, Stevens B, Tremblay ME, Aguzzi A, Ajami B, et al. Microglia states and nomenclature: a field at its crossroads. Neuron. 2022;110(21):3458–83. doi:10.1016/j.neuron.2022.10.020. [Google Scholar] [PubMed] [CrossRef]
Cite This Article
 Copyright © 2026 The Author(s). Published by Tech Science Press.
This work is licensed under a Creative Commons Attribution 4.0 International License , which permits unrestricted use, distribution, and reproduction in any medium, provided the original work is properly cited.
 Downloads
 Citation Tools