
 Submit a Paper
 Propose a Special lssue
 Open Access
ARTICLE

BORIS/CTCFL Reprograms Glioblastoma Transcriptional Networks through the Regulation of Tumor-Associated Genes such as CD36 and FBN2
1 Departamento de Ciencias Naturales, Universidad Autónoma Metropolitana-Cuajimalpa (UAM-C), Mexico City, Mexico
2 Escuela de Medicina y Ciencias de la Salud, Tecnológico de Monterrey, Monterrey, Mexico
3 Servicio de Neurocirugía, Hospital General Xoco, Mexico City, Mexico
* Corresponding Author: Ernesto Soto-Reyes. Email:
# These authors contributed equally to this work as the first author
(This article belongs to the Special Issue: Cellular Mechanisms in Neurodegeneration, Injury, and Regeneration)
BIOCELL 2026, 50(3), 9 https://doi.org/10.32604/biocell.2026.075061
Received 24 October 2025; Accepted 14 January 2026; Issue published 23 March 2026
 View Full Text
 Download PDF
Abstract
Objectives: Glioblastoma multiforme (GBM) is a highly aggressive brain tumor characterized by extensive transcriptional and epigenetic dysregulation. Brother of the Regulator of Imprinted Sites (BORIS/CTCFL) has been implicated in oncogenic transcriptional programs in several cancers, but its role in GBM remains poorly defined. This study aimed to characterize BORIS-associated transcriptional programs in GBM and to assess their functional relevance using integrative computational and experimental approaches. Methods: Transcriptomic data from The Cancer Genome Atlas (TCGA)-GBM and Genotype-Tissue Expression (GTex) brain cortex were analyzed following batch correction, differential expression analysis, and gene ontology enrichment. TCGA-GBM samples were stratified into BORIS-high and BORIS-low expression quartiles to identify BORIS-associated gene signatures. BORIS chromatin occupancy was examined by Chromatin immunoprecipitation combined with sequencing (ChIP-seq) in U87MG cells, followed by functional annotation of BORIS-bound genes. Experimental validation included BORIS overexpression, RT-qPCR, immunoblotting, ChIP-qPCR, and functional assays assessing proliferation, clonogenic survival, and migration. Results: BORIS was significantly upregulated in GBM compared with normal brain tissue and was associated with transcriptional programs related to development, metabolism, and cell signaling. Quartile-based analysis identified BORIS-associated differentially expressed genes, including CD36 and FBN2. ChIP-seq revealed BORIS binding at promoter-proximal regions, with ChIP-qPCR confirming occupancy at CD36 and FBN2 regulatory regions. BORIS overexpression increased CD36 and FBN2 expression and was associated with reduced proliferation, enhanced clonogenic survival, and increased migratory capacity. Conclusion: These findings indicate that BORIS is associated with transcriptional and phenotypic programs linked to GBM aggressiveness and may represent a candidate for further investigation as a biomarker or therapeutic target in GBM.Keywords
Supplementary Material
Supplementary Material FileGlioblastoma multiforme (GBM) is classified as a grade 4 glioma by the World Health Organization (WHO) and represents the most aggressive and most common primary tumor of the central nervous system [1]. Despite advances in treatment strategies [2], its challenging location and a high local recurrent rate—reported in 80%–90% of patients [3–5]—make GBM particularly difficult to treat. Consequently, the mean 5-year survival rate remains dismal, at approximately 6.6% [1]. A comprehensive understanding of the molecular mechanisms underlying GBM initiation and progression is therefore essential for the development of improved therapeutic strategies.
The molecular landscape of GBM is characterized by extensive genetic and epigenetic alterations that disrupt key regulatory networks controlling proliferation, apoptosis, survival, immune evasion, and angiogenesis, which are key hallmarks of tumor biology [6,7]. Within these networks, transcription factors play pivotal roles in orchestrating oncogenic programs and have attracted considerable attention as potential therapeutic targets [8,9]. Among these regulators, the Brother of the Regulator of Imprinted sites (BORIS) has gained increasing interest. BORIS functions as a cancer-testis antigen and has been proposed as a promising target for cancer immunotherapy [10]. The BORIS gene (CTCFL) is a paralog and potential functional competitor of the CCCTC-binding factor (CTCF), and its overexpression may disrupt genome architecture and contribute to tumorigenesis [11]. For clarity, both gene (CTCFL) and protein are hereafter referred to as BORIS.
BORIS overexpression has been reported in multiple malignancies, including epithelial [12], neuroblastoma [13,14], melanoma [15], ovarian [16], colorectal [17], and esophageal cancer [18]. In these contexts, BORIS has been linked to stemness [12,14,19], drug resistance [13], enhanced proliferation through apoptosis inhibition [17], invasiveness [15], and epithelial-mesenchymal transition [14], and its expression frequently correlates with poor prognosis [16,18]. In central nervous system (CNS) tumors, BORIS expression has been detected in GBM-derived cell lines and patient samples [20,21], and higher BORIS levels have been associated with increased glioma grade and reduced survival [21]. However, the molecular mechanisms by which BORIS contributes to gene regulation and tumor-associated phenotypes in GBM remain largely undefined.
Therefore, the objective of this study was to systematically characterize the transcriptional programs and genomic binding landscape associated with BORIS in GBM. To achieve this, we integrated transcriptomic analyses of patient-derived datasets with chromatin immunoprecipitation sequencing and functional assays in GBM cell models. Integrative bioinformatics approaches that combine large-scale transcriptomic and epigenomic datasets-often leveraging resources such as TCGA and GTEx- have proven valuable for dissecting regulatory networks, contextualizing transcription factor activity within disease-specific molecular landscapes and even identify potential biomarkers of disease [22–25]. By combining computational and experimental approaches, this study aimed to define BORIS-associated gene networks and assess their potential relevance to GBM biology.
Clinical data were obtained using the TCGABiolinks (v2.36.0) through BiocManager (v1.30.25) in RStudio (v2025.05.0 + 496); curated RNA-seq counts and transcripts per million (TPM) data from primary glioblastoma multiforme (GBM) tumors were retrieved from the TCGA-GBM project using the cBio Cancer Genomics Portal (annotated as “Glioblastoma Multiforme (TCGA GDC, 2025)” in the portal) [26] on 03/06/2025. Based on available clinical annotations, samples were filtered to include only samples meeting the following criteria: primary tumors, IDH wild-type status (annotated as “WT” in the “paper_IDH.status” field), and classification into mesenchymal, classical, or proneural transcriptomic subtype (annotated as “ME”, “CL”, and “PN” respectively in the “paper_Transcriptome.Subtype” field) resulting in a final cohort of 192 samples. The neural subtype was excluded from the analysis, as previous studies have suggested that this subtype is not tumor-specific and likely represents contamination by normal brain tissue [27,28]. RNA-seq and TPM data from brain cortex tissue (control group, n = 270) were downloaded from the GTEx Portal (v10) on the same date (03/06/2025).
Principal Component Analysis (PCA) (prcomp function) was conducted based on the log2(count + 1) before and after ComBat-seq correction (ComBat_seq function of the sva v3.58.0) from GBM and brain cortex samples, and the first two principal components (PC1 and PC2) were used for visualization using ggplot (v3.5.2).
To focus the analysis on relevant transcripts, only protein-coding genes were retained using biomart (v2.66.0). Given the stringency of the ComBat-seq batch correction, GBM samples with zero BORIS expression were excluded from the corrected raw counts. The resulting filtered count matrices were then used for differential expression analysis with DESeq2. Since the data had already undergone ComBat-seq correction, differential expression was defined using a relaxed threshold of |log2fold change| > 0.5 and adjusted p-value < 0.05.
For the high- vs. low-BORIS analysis, GBM samples (n = 192) were stratified into quartiles based on TPMs values for BORIS. The lowest quartile (n = 48) was defined as the low-BORIS group (Q1), and the highest quartile (n = 48) as the high-BORIS group (Q4). DESeq2 analysis was performed using the raw counts for samples in Q1 and Q4 quartiles. The thresholds were |log2fold change| > 1.0 and adjusted p < 0.05. These analyses were performed in RStudio.
Functional enrichment analysis was performed using the g:Profiler web server (version e112_eg59_p19_25aa4782) with the Benjamini-Hochberg false discovery rate (FDR) correction method and a significance threshold of adjusted p < 0.05. The analysis was restricted to Homo sapiens annotations; Reactome pathway and Gene Ontology (GO) Biological Process terms were used as the data source [29]. Term size was restricted to a minimum of 10 and a maximum of 1000 annotated genes. The resulting generic enrichment map (GEM) file and combined-name gene matrix transposed (GMT) files were downloaded from g: Profiler. To visualize the enrichment results, both files were imported into Cytoscape (v3.10.3, Cytoscape consortium, San Diego, CA, USA) [30] using the EnrichmentMap app (v3.5.0, Bader Lab, University of Toronto, Canada) [31], with an FDR q-value cutoff of 0.001, for network-based integration and visualization of functional terms.
The human GBM cell lines T98G (CRL-1690) and U87MG (HTB-14) were obtained from the American Type Culture Collection (ATCC, Manassas, VA, USA). According to ATCC quality control data, both cell lines tested negative for mycoplasma contamination. Cells were cultured in D-MEM/F-12 medium (2500-096, Gibco, Thermo Fisher Scientific, Waltham, MA, USA) supplemented with 29 mM sodium bicarbonate (NaHCO3; S5761, Sigma-Aldrich, Merck KGaA, Darmstadt, Germany), adjusted to pH 7.4, and sterilized using a 0.2 μm pore size filter unit (566-0020, ThermoFisher Scientific, Waltham, MA, USA). The medium was further supplemented with 10% heat inactivated fetal bovine serum (FBS) (Gibco, 26140-079). Cells were maintained at 37°C in a humidified incubator with 5% CO2 (MCO-19AIC UV, Sanyo, Osaka, Japan). Cells were passaged every 3–4 days at ~70%–80% using TrypLETM Express (12604013, Gibco, Thermo Fisher Scientific, Waltham, MA, USA) and 10%–20% were reseeded. For experiments, cells were seeded at a density of ~2–3 × 10⁴ cells/cm2, unless otherwise indicated.
2.3 Cell Stable Transfection and Clone Selection
A total of 7.5 µg of the BORIS-GFP plasmid (HG15751-ACG, Sino Biological US, Inc., Wayne, PA, USA) was linearized using the ClaI restriction enzyme (R0197S, New England Biolabs, Ipswich, MA, USA) according to the manufacturer’s instructions (37°C, 15 min), followed by enzyme inactivation (65°C, 20 min). The linearized plasmid was subsequently purified using the QIAEX II ® gel extraction kit (20021, QIAGEN, Hilden, Germany). U87MG cells (2 × 10⁴ cells/cm2) were transfected with the linearized plasmid using the XfectTM Transfection Reagent (631318, Takara Bio Inc., Kusatsu, Shiga, Japan) following the manufacturer’s instructions. Control U87MG cells (wild-type) were subjected to an identical transfection protocol using XfectTM reagent in the absence of plasmid DNA (mock-transfected). After transfection, U87MG cells stably expressing BORIS-GFP (U87MG BORIS-GFP) were selected by limiting dilution in 96 well plates using the previously described culture medium supplemented with hygromycin B (Gibco, 10687010) at a final concentration of 200 µg/mL.
2.4 Duplication Time, Colony Formation, and Wound Healing Assays
Duplication time. Cells were seeded at a density of 3 × 10⁴ cells/cm2 in 24-well plates. After 24 h, a subset of wells was trypsinized using TrypLETM Express (12604013, Gibco, Thermo Fisher Scientific, Waltham, MA, USA), and cells were counted in duplicate using a Neubauer hemocytometer. This time point was designated as t0, and the exact time of trypsinization was recorded (h:min). After additional 24 h, the remaining wells were trypsinized and counted using the same procedure, with the time of trypsinization again recorded (t1). The elapsed time between counts (Δt) was calculated in minutes. Assuming first-order exponential cell growth, the growth rate (gr) was calculated using the next equation gr = (In(Nt/N0))/Δt, where N0 represents the cell number at t0 and Nt represents the cell number at t1. Population doubling time was then calculated as doubling time = In(2)/gr, and expressed in hours.
Colony formation assay. For clonogenic assays, 100 cells were seeded per well in 6-well plates and cultured under standard growth conditions. After three weeks, cells were fixed with 4% paraformaldehyde for 10 min at room temperature and stained with 1% crystal violet for 10 min at room temperature. Excess stain was removed by rinsing with phosphate buffered saline (PBS). Visible colonies were counted manually and colony formation was expressed as percentage relative to the number of seeded cells.
Wound healing assay. Prior to the assay, cytosine arabinoside (AraC) (C1768, Sigma-Aldrich, Merck KGaA, Darmstadt, Germany) was used for a concentration-response curve to inhibit cell proliferation and ensure that the observed effects were attributable to migration (data not shown). When cells reached 80%–90% of confluence, a vertical scratch was done using a sterile pipette tip. Wells were washed with PBS to remove detached cells, and fresh culture medium supplemented with 10 μM AraC was added to inhibit proliferation. Cell migration was monitored at the same wound field at 0, 2, 4, 6, 8 and 24 h post-scratch. Images were analyzed on ImageJ using the wound healing size tool [32]. The migration velocity was calculated as µm2/h, and BORIS-overexpressing cells (U87MG BORIS-GFP) were compared with control cells (U87MG).
2.5 RNA Extraction and Reverse Transcription-Quantitative Polymerase Chain Reaction (RT-qPCR)
Total RNA was obtained from the cell culture (n = 5 per group) using the TRIzolTM reagent (15596026, Invitrogen, Thermo Fisher Scientific, Waltham, MA, USA) according to manufacturer’s instructions. RNA integrity was evaluated by electrophoresis on a 1% agarose gel, with the presence of distinct 28S and 18S rRNA bands indicating good RNA quality. The RNA concentration was measured using a NanoDropTM spectrophotometer (NanoDrop Lite, ThermoFisher Scientific, Waltham, MA, USA). Subsequently, 1 µg of total RNA from each sample was reverse transcribed in a single batch into complementary DNA (cDNA) using the GeneAmp® RNA PCR core kit (N8080143, Applied Biosystems, ThermoFisher Scientific, Waltham, MA, USA) in a total reaction volume of 20 µL according to manufacturer’s instructions, using oligo (dT)16 primers (Step 1: RNA with oligo (dT)16: 65°C, 5 min; Step 2: 4°C, 2 min; Full reaction Step 3: 37°C, 30 min; Step 4: 95°C, 5 min; Step 4: 4°C, 2 min). Following reverse transcription, 40 µL of DNAse-free water was added, and the resulting cDNA was stored at −20°C until further use. Gene expression was quantified by real-time PCR using the SYBRTM green Master Mix (4309155, Applied Biosystems, ThermoFisher Scientific, Waltham, MA, USA) on a 7500 Real-Time PCR System (4351105, Applied Biosystems, Thermo Fisher Scientific, Waltham, MA, USA) under standard cycling conditions: 95°C for 10 min, followed by 40 cycles of 95°C for 15 s and 60°C for 1 min. All samples were analyzed in technical triplicates, and the mean value was calculated for each biological replicate. GAPDH was used as internal control. Relative expression levels were calculated using the 2−∆∆Ct method. Only biological replicates were considered as independent observations for statistical analysis. The primers used for the qPCR were as follows (5′-3′): BORIS-F (GGA GCA TTT GTA AAC AGT CGG G), BORIS-R (ATG ACC GCT CAC ATT CGT ACC), GAPDH-F (TGC ACC ACC AAC TGC TTA GC), GAPDH-R (GGC TGG ACT GTG GTC ATG AG), CD36-F (GGC TTA ATG AGA CTG GGA CC), CD36-R (TGT TTT CGA TCT GCA TGC AC), FBN2-F (ACC GGA CTG AAC TGT GAA GA), FBN2-R (GGC ATT GGG ATT GGA GCA TT). All primers were purchased from Integrated DNA technologies (IDT), Coralville, IA, USA.
Cells at 80%–90% confluence (~2–3 × 10⁶ cells per 9 cm dish) were lysed in a buffer containing protease inhibitors (150 mM NaCl, 50 mM NaF, 12 mM sodium deoxycholate, 3.5 mM sodium dodecyl sulfate, 1.6 mM EDTA, 1 mM EGTA, 50 mM Tris-HCl, 16.5 mM Triton X-100, 1 mM sodium orthovanadate [all purchased from Sigma-Aldrich, Merck KGaA, St. Louis, MO, USA], cOmplete™ protease inhibitor Cocktail [11836153001, Roche Diagnostics, Mannheim, Germany), and protein concentration was determined by the Bradford assay (5000006, Bio-Rad Laboratories, Hercules, CA, USA). Equal amounts of protein (80 µg) were separated by 10% SDS-PAGE, transferred to PVDF membranes (1620177, Immun-Blot®, Bio-Rad Laboratories, Hercules, CA, USA), blocked at room temperature, 1 h, with 5% bovine serum albumin (BSA), and probed with primary antibodies against BORIS (1:200, rabbit polyclonal, Sigma-Aldrich, HPA001472) and GAPDH (1:1000, rabbit polyclonal, Sigma-Aldrich, G9545) at 4°C, overnight; followed by HRP-conjugated secondary antibody (1:5000, Invitrogen, 65-6120) at room temperature, 1 h. The antibodies were diluted in 3% BSA in TBST buffer (150 mM NaCl, 100 mM trizma base, 0.1% triton X-100; all purchased from Sigma-Aldrich, Merck KGaA, St. Louis, MO, USA. Signals were detected by chemiluminescence (WBKLS, Millipore, Merck KGaA, St. Louis, MO, USA) and imaged with a C-Digit® blot scanner (LICOR). Densitometric analysis was performed using ImageJ (v1.54g, National Institutes of Health, Bethesda, MD, USA), normalizing BORIS to GAPDH relative to T98G cells. For BORIS overexpression experiments, a total of 10 µg of protein was loaded into the immunoblot; normalization of BORIS to GAPDH relative to U87MG wild type cells.
2.7 Chromatin Immunoprecipitation (ChIP) Assays
U87MG cells were cultured until approximately 70% confluence was reached. Cells were cross-linked with 1% formaldehyde (stock buffer: 11% formaldehyde, 100 mM NaCl, 0.5 mM EGTA, 50 mM HEPES, all from Sigma-Aldrich) for 10 min at room temperature, quenched with glycine (final 125 mM) for 5 min at room temperature, lysed (50 mM Tris-HCl, 150 mM NaCl, 1% NP-40; Sigma-Aldrich, supplemented with cOmplete™ protease inhibitor Cocktail [11836153001, Roche Diagnostics, Mannheim, Germany]), and sonicated to yield chromatin fragments of ~200–500 bp. A total of 5 µL of anti-BORIS antibody (39851, Active Motif, Carlsbad, CA, USA) were preincubated with magnetic beads (S1430S, New England Biolabs, Ipswich, MA, USA) at 4°C during 2 h, then washed with diluted in ChIP buffer (kch-501-700, Diagenode SA, Liege, Belgium) to obtain the antibody-beads complex. A total of 200 µg of chromatin (diluted in ChIP buffer supplemented with protease inhibitors) was incubated with the antibody-beads complex. Input chromatin (20 µg) and beads-only (no antibody) controls were processed in parallel. Immunoselected DNA was purified using MinElute columns (28204, Qiagen, Germantown, MD, USA).
From the obtained DNA from Chromatin Immunoprecipitation (ChIP), sequencing libraries were prepared following Illumina protocols and sequenced on a NovaSeq 6000 platform with 150 bp paired-end reads, yielding approximately 30 million reads per sample (library preparation and sequencing were performed by CD Genomics Shirley, NY, USA). Raw reads were quality checked and timed using Trimmomatic to remove adapters and low-quality bases. Clean reads were aligned to the human reference genome (GRCh38) using BWA-MEM. Aligned files were processed with Picard to mark and remove PCR duplicates, and SAMtools was used for sorting and indexing. Peak calling was performed using MACS2 with default parameters, including a q-value cutoff of 0.05 and an estimated fragment shift size determined automatically by the model. BigWig coverage tracks were generated with deepTools for visualization. Peak annotation and genomic feature enrichment analyses were conducted using the ChIPseeker R package.
ChIP enrichment was validated using the SYBRTM green Master Mix (4309155, Applied Biosystems, ThermoFisher Scientific, Waltham, MA, USA) on a CFX Opus 96 Real Time PCR system (BioRad Laboratories, Hercules, CA, USA). An aliquot of input chromatin and beads-only (no antibody) were included as references. Primers used were as follows (5′-3′): AR-F (TGG CTT GCT CCT CAG TTT GT), AR-(GCC AGG GGT TCT TTT CAG GA), CD36-F (CAT GTG CCA CCA AGC CCG), CD36-R (ACC ATG CCC AGC CAT AGT AT), FBN2-F (AAG CAC TTT CTT TCT TGT TCA CA), and FBN2-R (CCT CAA ATG ATC CAC TCG CC). All primers were purchased from Integrated DNA technologies (IDT), Coralville, IA, USA. For each target locus, amplification efficiency (AE) was determined from a serial dilution of input DNA (20%, 10%, 5%, and 1%). Cq values were plotted against the logarithm of the input percentage, and AE was calculated using the formula AE = 10−1/m, where m is the slope. An AE value close to 2.0 was considered acceptable. To quantify the ChIP signal for either the antibody or the beads-only control, the percentage of the input was calculated as %Input = (AECqinput-Cqsample) × (dilution factor) × (100), where the dilution factor accounts for the fraction of the input DNA used in the qPCR. Enrichment of the specific antibody relative to the beads-only control was then calculated as Enrichment = %InputChIP/%InputBeads.
The qPCR and immunoblot analysis were analyzed using GraphPad Prism software version 8.0 (GraphPad Software, San Diego, CA, USA). Data were plotted as mean ± SEM. Two-tailed unpaired t-test was performed when indicating, and p < 0.05 threshold was considered statistically significant.
3.1 Glioblastoma Multiforme Samples Exhibit a Distinct Gene Expression Profile Compared to Normal Brain Cortex
Given the clinical aggressiveness and molecular complexity of GBM, we first sought to characterize its global transcriptional landscape relative to normal brain tissue. For this purpose, we analyzed RNA-seq data from primary TCGA-GBM samples (n = 192) and normal GTex brain cortex (n = 270) (Fig. 1a).
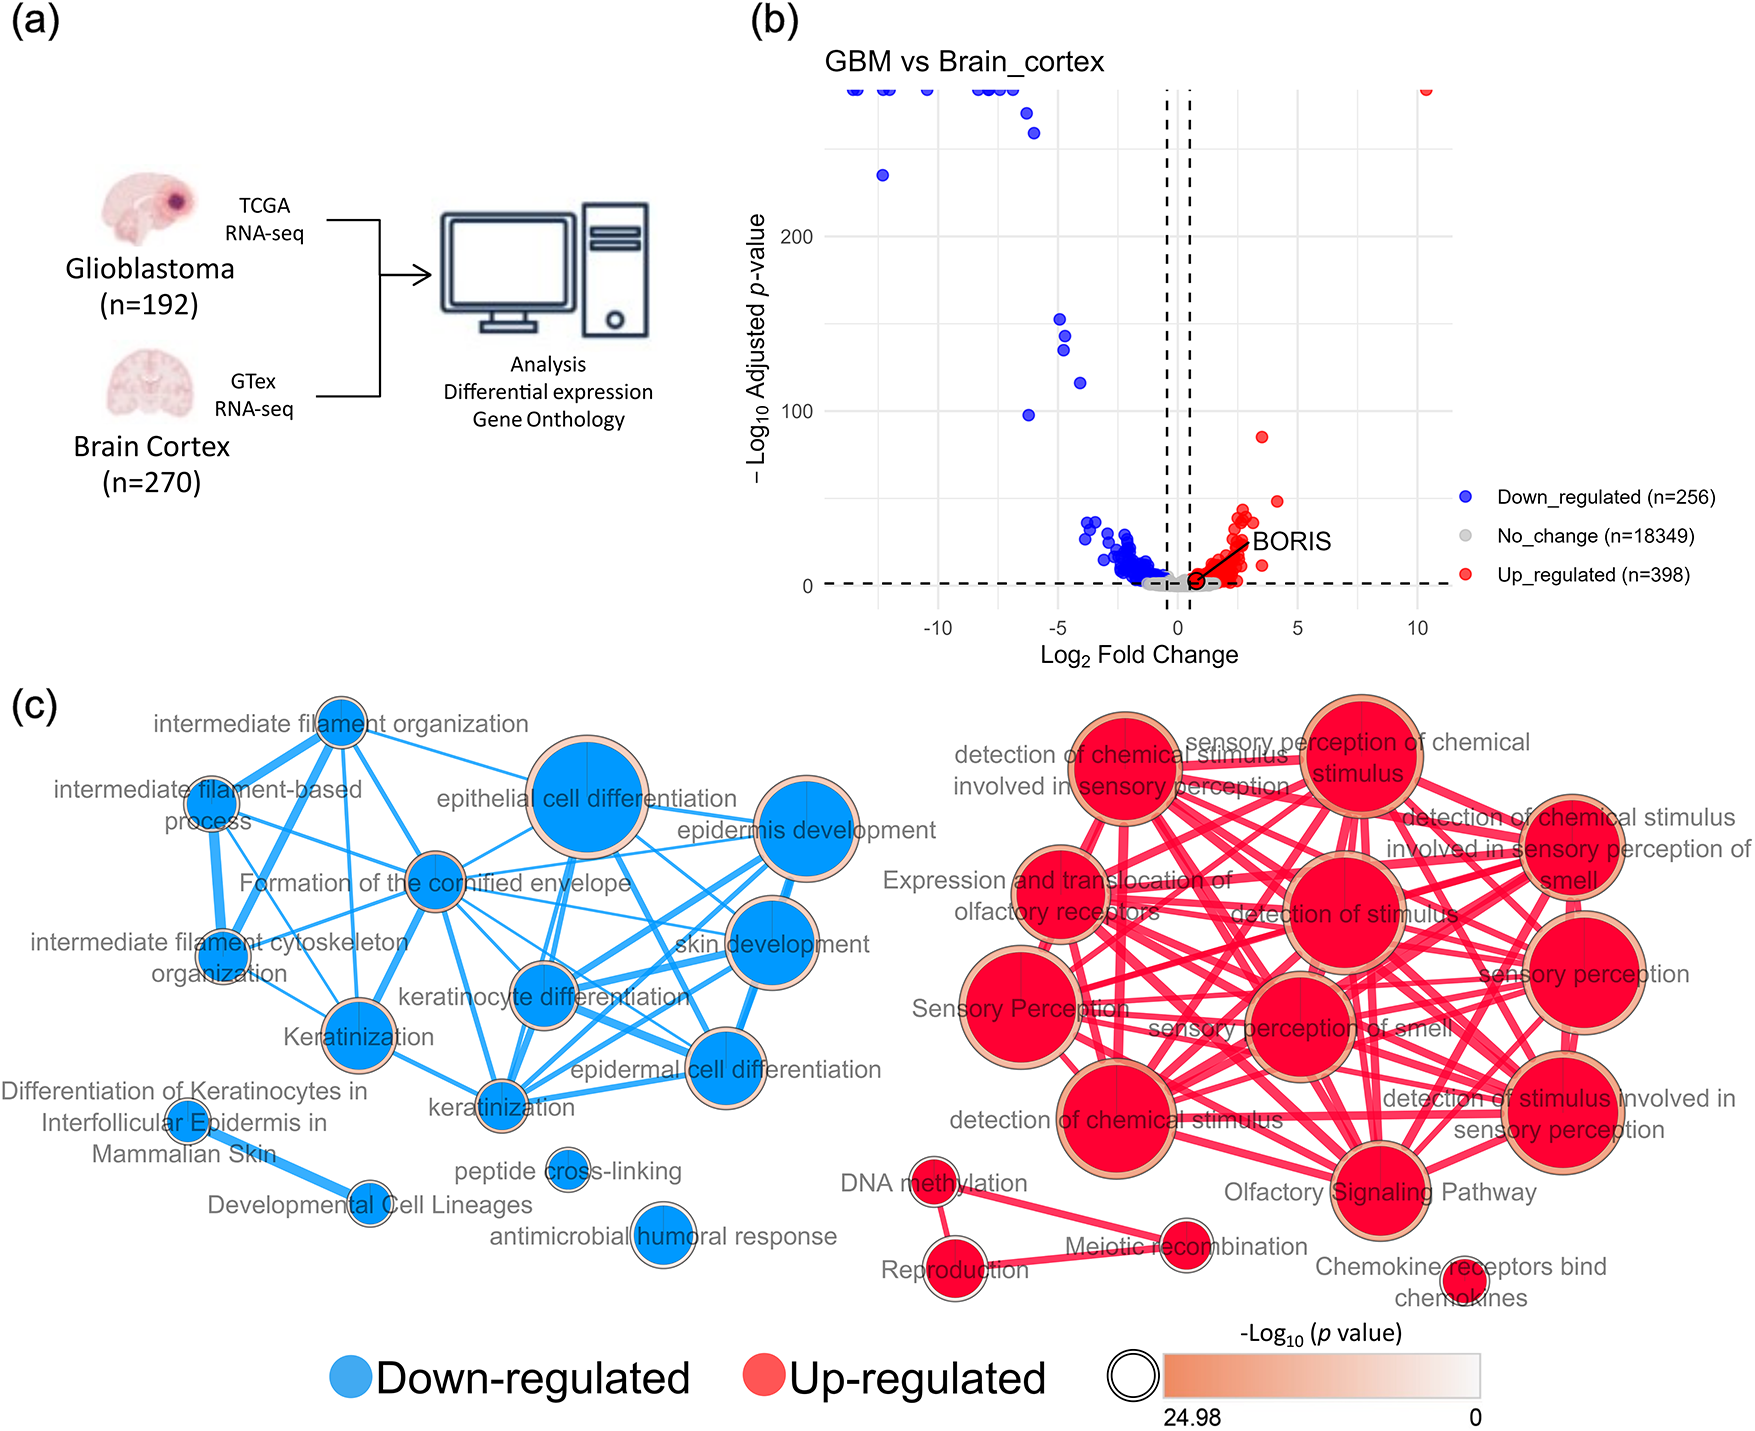
Figure 1: Transcriptomic differences between glioblastoma multiforme (GBM) and brain cortex samples reveal distinct molecular signatures. (a) Overview of the bioinformatics workflow used for the data analysis, created using Inkscape (1.4.3). GTex brain cortex (n = 270), and TCGA-GBM (n = 192) RNA-seq after Combat-seq were filtered to consider only protein-coding genes prior to differential expression analysis. (b) Volcano plot of differentially expressed genes identified by DESeq2, generated using R (RStudio): significantly downregulated genes (blue, n = 256), upregulated genes (red, n = 398), and non-significant genes (gray, n = 18,349) are shown. Genes were considered differentially expressed at |log2Fold Change (FC)| > 0.5 and adjusted p-value (padj) < 0.05. Notably, BORIS was upregulated (log2FC = 0.77, padj = 0.0020) in GBM samples compared with brain cortex samples. (c) Gene Ontology (GO) Biological Processes (BP) and Reactome pathway enrichment analysis associated for the top 15 downregulated (blue) and top 15 upregulated (red) genes in GBM. Only terms passing Benjamini-Hochberg correction (adjusted p < 0.05) are shown. Enrichment maps were visualized in Cytoscape using an FDR q-value cutoff of 0.001. Upregulated genes were enriched in processes related to sensory perception, chemokine receptor signaling, DNA methylation, meiosis, and reproduction (full list in Table S1). Downregulated genes were associated with cell differentiation processes, including epithelial development, lineage specification, and cytoskeletal organization (full list in Table S2).
Principal component analysis (PCA) revealed distinct clustering between GBM and cortex samples, primarily influenced by batch effects. The first two principal components (PC1 and PC2) explained 93.4% and 3.4% of the total variance, respectively (Fig. S1a). To minimize batch-associated bias, we applied ComBat-seq batch correction. After correction, PCA showed reduced inter-batch separation, with clustering reflecting biological rather than technical variation. PC1 and PC2 explained 96.2% and 0.3% of the total variance, respectively (Fig. S1b).
Subsequently, differential gene expression analysis using DESeq2 on ComBat-seq-corrected counts identified 7982 significantly upregulated and 663 downregulated genes in GBM compared with brain cortex samples (data not shown). To simplify the analysis, only protein-coding genes were retained, resulting in 398 upregulated and 256 downregulated genes (adjusted p-value < 0.05, |log2FC| > 0.5) (Fig. 1b). Notably, BORIS was upregulated (log2FC = 0.77, padj = 0.0020) in GBM samples compared with brain cortex samples.
Gene Ontology (GO) and Reactome pathway enrichment analyses revealed that downregulated differentially expressed genes (DEGs) were mainly linked to cell differentiation processes, including epithelial development, lineage specification, and cytoskeletal organization (Fig. 1c). Other enriched terms highlighted key biological processes related to immune pathways, morphogenesis, cell development, glucose metabolism, and post-translational modifications (Table S1). In contrast, upregulated DEGs were predominantly associated with processes related to protein receptor location, chemokine receptors, DNA methylation, meiosis and reproduction (Fig. 1c). Additional enriched processes included those relevant to tumorigenesis, such as chromatin modification, evasion of programmed cell death, transcription regulation, immune response, cell cycle control, and DNA repair mechanisms (Table S2). Collectively, the transcriptional landscape of GBM revealed by this analysis underscores a coordinated activation of oncogenic and epigenetic programs concomitant with the loss of differentiation-associated gene expression.
3.2 The Expression Level of BORIS is Associated with Differential Gene Expression Potentially Linked to Tumorigenic Processes in GBM
To investigate whether variability in BORIS expression is associated with transcriptional changes contributing to GBM pathogenesis, we stratified TCGA-GBM samples into quartiles based on normalized BORIS expression (transcripts per million, TPM) (Figs. 2a and S2). Raw counts from the highest (Q4) and lowest (Q1) quartiles were retained for differential expression analysis, considering only the protein-coding genes to simplify interpretation. Normality test (Anderson-Darling, D’Agostino & Pearson, Shapiro-Wilk, and Kolmogorov-Smirnov test) all indicated that BORIS mRNA TPM values in Q1 (A2 = 8.750, p < 0.0001; K2 = 13.71, p = 0.0011; W = 0.6353, p < 0.0001; KS distance = 0.4322, p < 0.0001) and Q4 (A2 = 3.473, p < 0.0001; K2 = 30.39, p < 0.0001; W = 0.7634, p < 0.0001; KS distance = 0.2055, p < 0.0001) were not normally distributed. Analysis comparing the high (Q4, n = 48) vs. low (Q1, n = 48) BORIS mRNA expression groups revealed significant increase in BORIS transcript levels in Q4 samples (Mann-Whitney test, median 0.07285 vs. 0.000; U = 0, p < 0.0001, two tailed) with a very large size effect (Cohen’s d = 2.28) reflecting a substantial increase in BORIS mRNA expression in Q4 compared with Q1 (Fig. 2b).
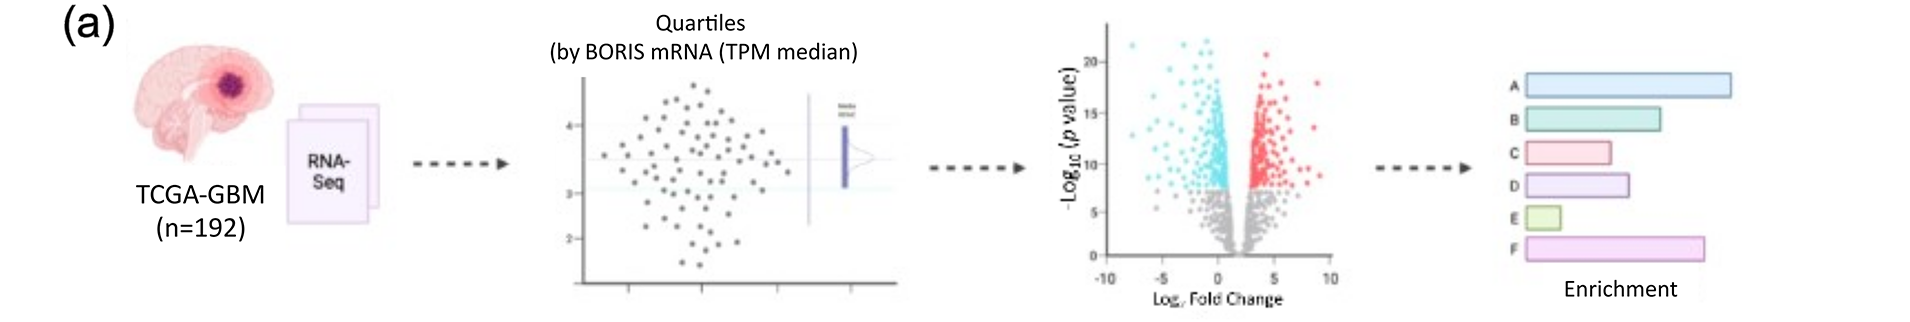
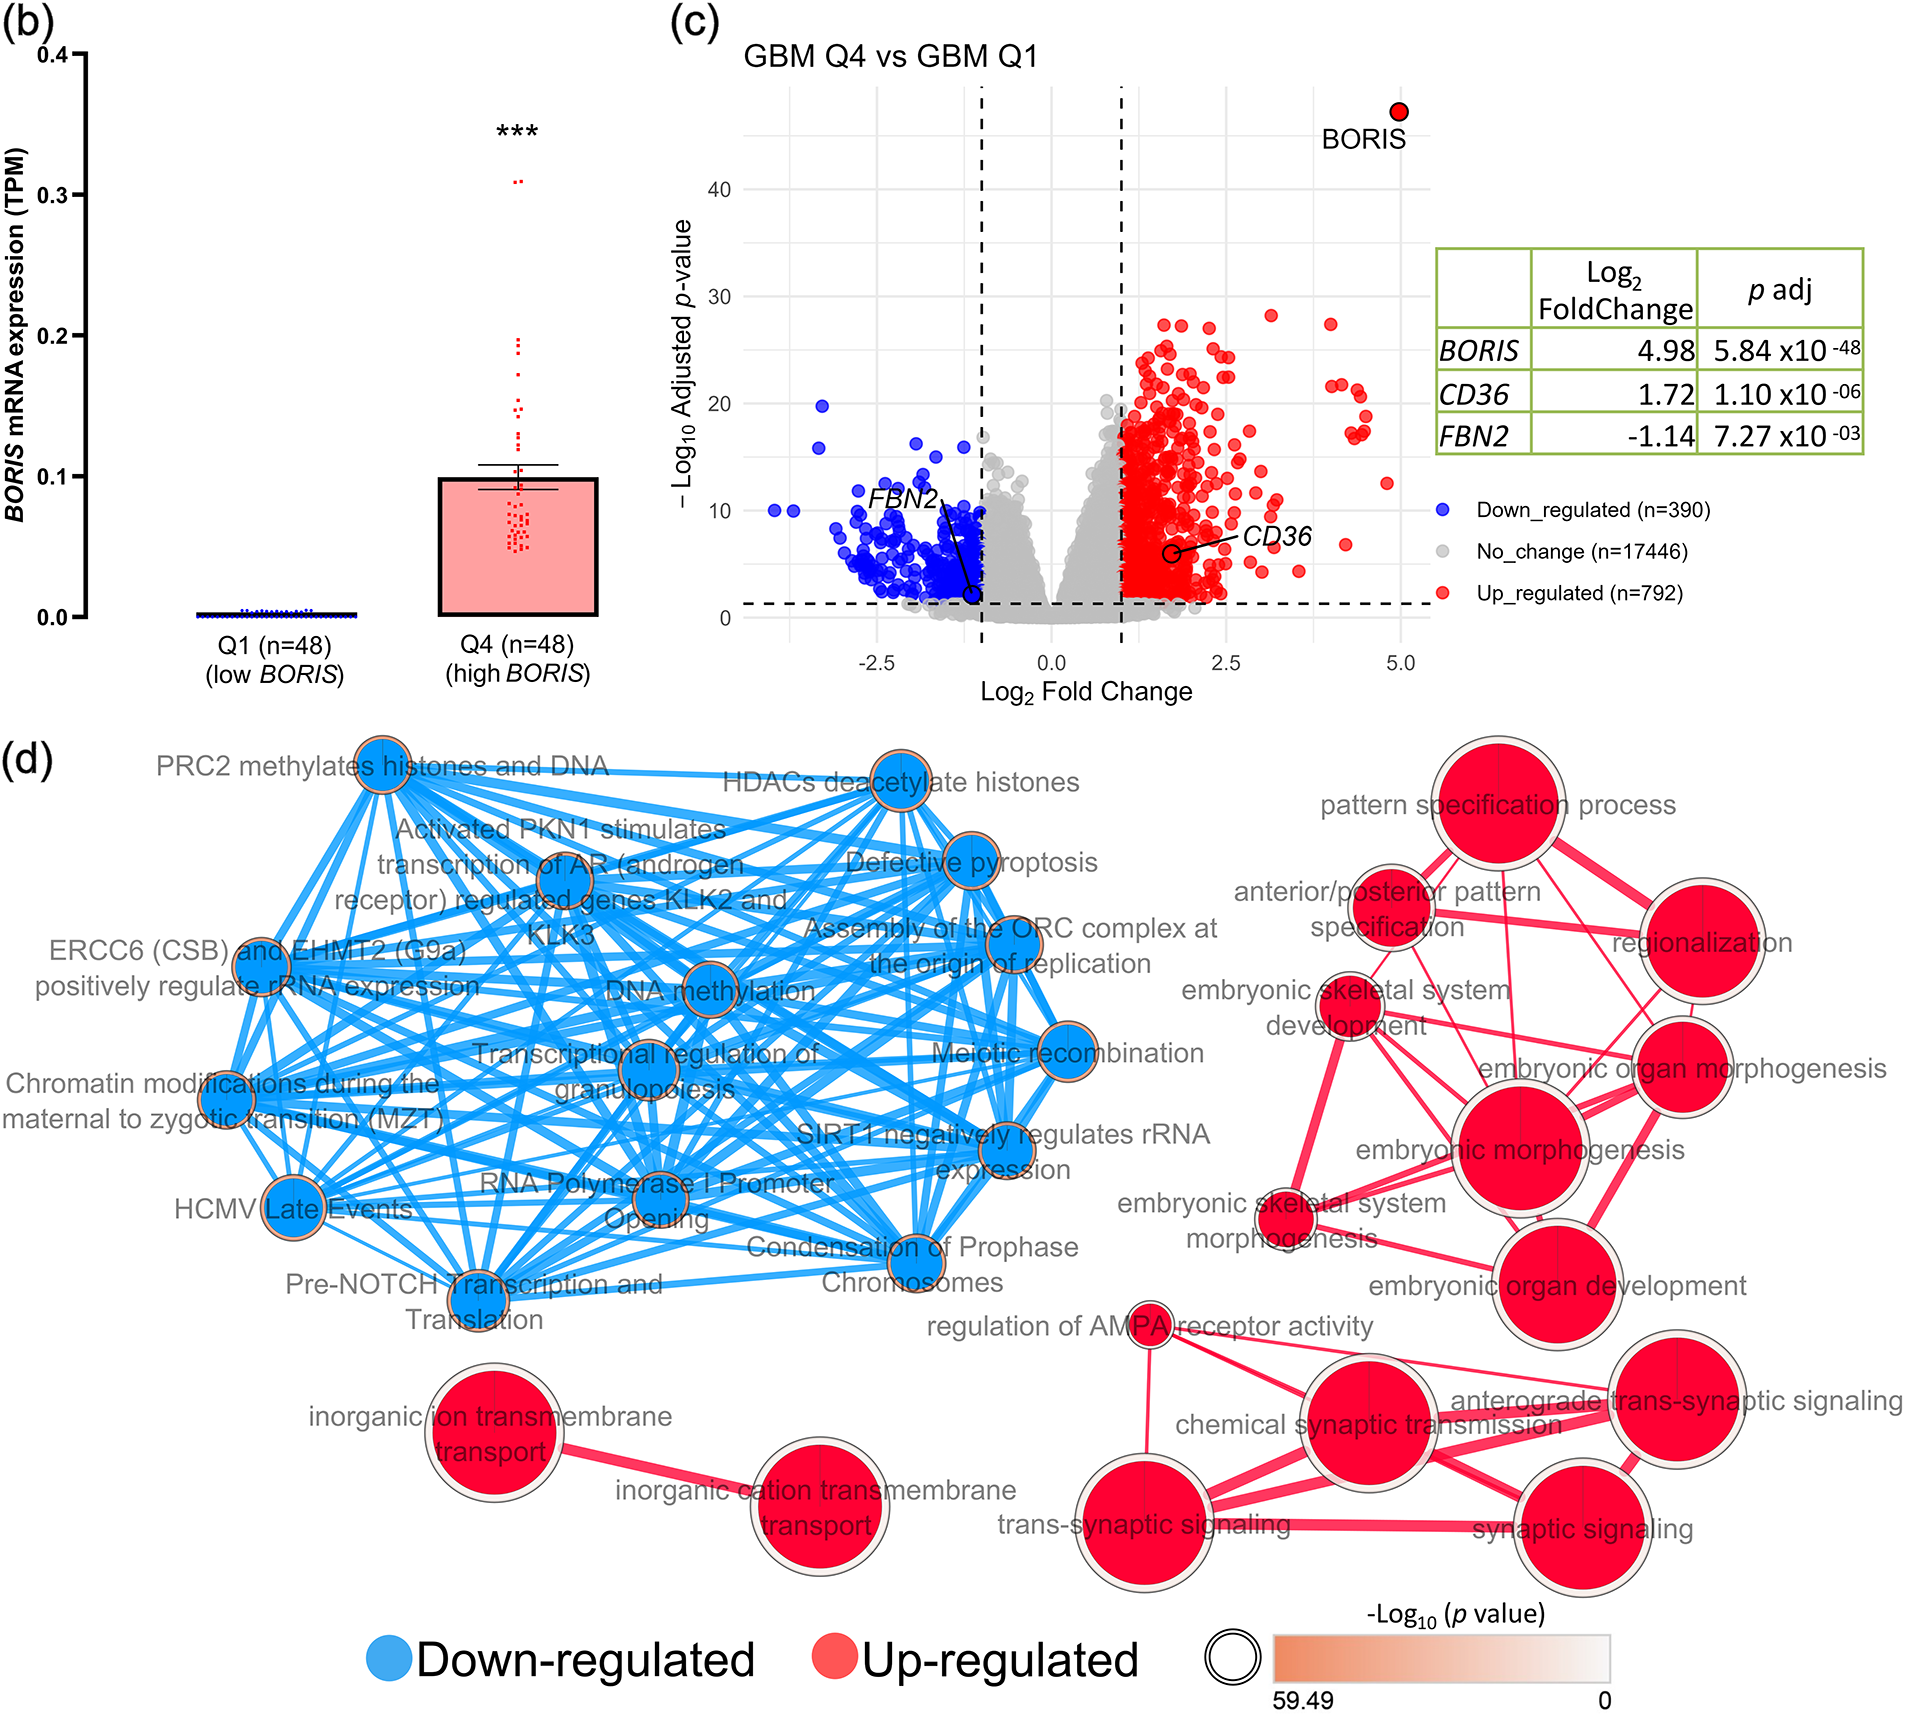
Figure 2: BORIS expression is associated with changes in gene expression related to key cellular processes in GBM. (a) Overview of the bioinformatics workflow, created using Inkscape (1.4.3). TCGA-GBM samples (n = 192) were ranked by their BORIS transcripts per million (TPM) values. Samples in the top (Q4, high BORIS) and bottom (Q1, low BORIS) quartiles were selected, and raw counts from these groups were analyzed using DESeq2 for protein-coding genes. Differentially expressed genes were subjected to gene set enrichment analysis. (b) Box plot showing a significant difference in BORIS expression between the low- (n = 48) and high-expression (n = 48) GBM groups, generated using GraphPad Prism 8.0. Mann-Whitney test, median 0.07285 vs. 0.000; U = 0, p < 0.0001, two tailed; the difference showed a very large size effect (Cohen’s d = 2.28), reflecting a substantial increase in BORIS mRNA TPM expression in Q4 compared with Q1. (c) Volcano plot of differentially expressed genes comparing high vs. low BORIS expression groups, generated using R (RStudio). Downregulated genes (blue, n = 390), upregulated genes (red, n = 792), and non-significant genes (gray, n = 17,446) are shown. Differential expression was defined as |log2FC| > 1.0 and adjusted p-value (padj) < 0.05. Notably, BORIS (log2FC = 4.98, padj = 5.84 × 10−48), CD36 (log2FC = 1.72, padj = 1.10 × 10⁻⁶), and FBN2 (log2FC = −1.14, padj = 7.27 × 10⁻³) were differentially expressed. (d) GO Biological Process and Reactome pathway enrichment analyses showing the top 15 downregulated (blue) and top 15 upregulated (red) terms in the high-BORIS group compared with the low-BORIS group. Only terms passing Benjamini-Hochberg correction (adjusted p < 0.05) are shown. Enrichment maps were visualized in Cytoscape using an FDR q-value cutoff of 0.001. Upregulated genes were enriched in processes related to cell-cell communication, synaptic receptor signaling, morphogenesis, and developmental pathways (full list in Table S3). Downregulated genes were enriched in chromatin-related processes, including DNA and histone methylation, recombination, chromatin condensation, and histone acetylation (full list in Table S4). ***p < 0.001.
The volcano plot (adjusted p-value < 0.05, |log2FC| > 1.0) identified 792 upregulated and 390 downregulated genes in the high-BORIS group compared to the low-BORIS group (Fig. 2c). Gene Ontology enrichment analysis of these downregulated genes indicated that high BORIS expression is associated with reduced activity of chromatin-related processes, including DNA and histone methylation, recombination, chromatin condensation, and histone acetylation (Fig. 2d). Other enriched downregulated terms included genome stability-related processes such as telomere organization, DNA repair, regulation of mitosis, and protein location to chromosomes, as well as immune regulatory pathways (Table S3). Conversely, upregulated DEGs showed that elevated BORIS expression is associated with altered biological processes, including cell-cell signaling, particularly those involving receptors-mediated neuronal communication, additionally genes associated with morphogenesis, and anterior/posterior pattern specification (Fig. 2d). Additional enriched terms were related to metabolic activity (e.g., electron transport chain, ATP synthesis), anabolic pathways such as DNA synthesis, membrane transport, and RNA synthesis and processing (Table S4).
Together, these findings suggest that BORIS may act as a regulatory factor influencing multiple transcriptional programs in GBM, potentially contributing to tumorigenic processes through modulation of chromatin dynamics, cellular metabolism, and cell-cell signaling.
3.3 BORIS Expression Differs between GBM Cell Lines and may Contribute to Transcriptional Deregulation
Building upon the transcriptomic analysis that identified BORIS as differentially expressed in GBM samples and associated with changes in genes linked to key cellular processes (Fig. 2), we next evaluated BORIS expression in two widely used GBM cell lines, T98G and U87MG. We quantified BORIS mRNA levels and BORIS protein abundance in T98G and U87MG cells.
Normality tests (Shapiro-Wilk, and Kolmogorov-Smirnov test) for the RT-qPCR analysis showed that BORIS mRNA expression in U87MG (W = 0.8855, p = 0.3350; KS distance = 0.2986, p > 0.1) and T98G (W = 0.9426, p = 0.6845; KS distance = 0.1799, p > 0.1) were normally distributed. RT-qPCR analysis revealed that U87MG (n = 5) cells expressed significantly higher levels of BORIS mRNA compared to T98G (n = 5) (two-tailed unpaired t-test, t(8) = 2.418, p = 0.0420) with a large size effect (Hedges’ g = 1.5289) (Fig. 3a). Consistently, normality test for immunoblots (Shapiro-Wilk test) showed that both U87MG (n = 3, W = 0.9614, p = 0.6224) and U87MG BORIS-GFP (n = 3, W = 1.000, p > 0.9999) groups were normally distributed. Immunoblot densitometric analysis showed increased BORIS protein abundance in U87MG relative to T98G (two-tailed unpaired t-test, t(4) = 2.928, p = 0.0429) with a large size effect (Hedges’ g = 2.3905) reflecting a substantial increase in BORIS abundance in U87MG compared with T98G (Fig. 3b).
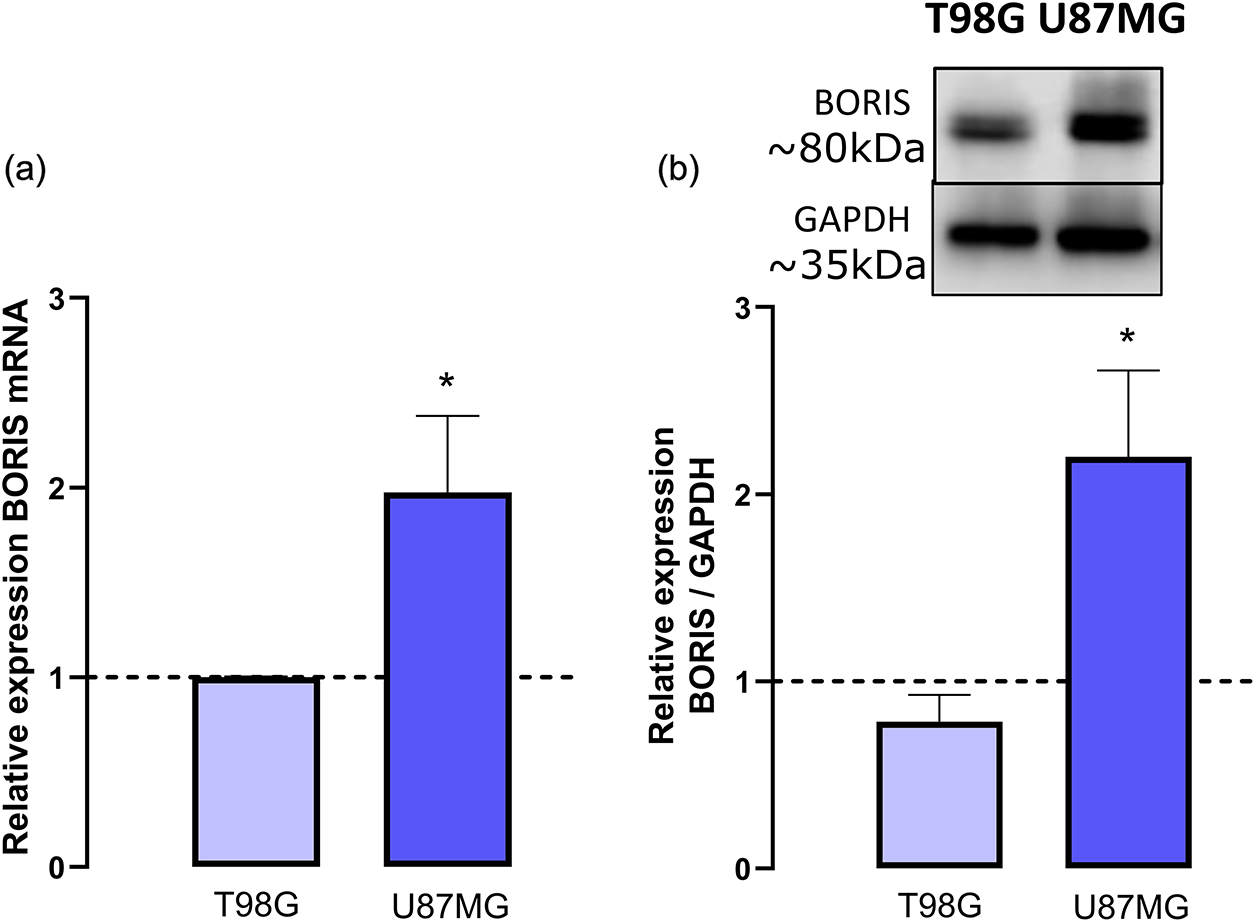
Figure 3: The selected GBM cell lines expressed different levels of BORIS. (a) Relative BORIS mRNA expression shows that U87MG cells (n = 5) express significantly higher levels compared to T98G (n = 5). Two-tailed unpaired t-test, t(8) = 2.418, p = 0.0420 with a large size effect (Hedges’ g = 1.5289). (b) Densitometric analysis of immunoblots indicates that U87MG cells (n = 3) have greater BORIS protein abundance than T98G (n = 3). Two-tailed unpaired t-test, t(4) = 2.928, p = 0.0429 with a large size effect (Hedges’ g = 2.3905). *p < 0.05.
Together, these findings demonstrate that BORIS is differentially expressed between GBM models, with U87MG exhibiting higher expression at both the transcript and protein levels.
This observation underlies the selection of U87MG cells for downstream analysis, such as ChIP-seq, to map BORIS genomic binding sites and explore its potential regulatory role in gene networks contributing to GBM pathogenesis.
3.4 BORIS Binds Predominantly to Promoter Regions and may Regulate Genes Linked to Tumor-Related Processes
Given the elevated expression of BORIS in U87MG cells (Fig. 3), we performed chromatin immunoprecipitation followed by sequencing (ChIP-seq) to identify its genome-wide binding sites and explore its potential regulatory function in GBM. After sequencing, alignment, and peak calling, peak distribution analysis within ±3000 bp around transcription start sites (TSS) revealed that BORIS binding sites were predominantly concentrated around promoter regions (Fig. 4a).
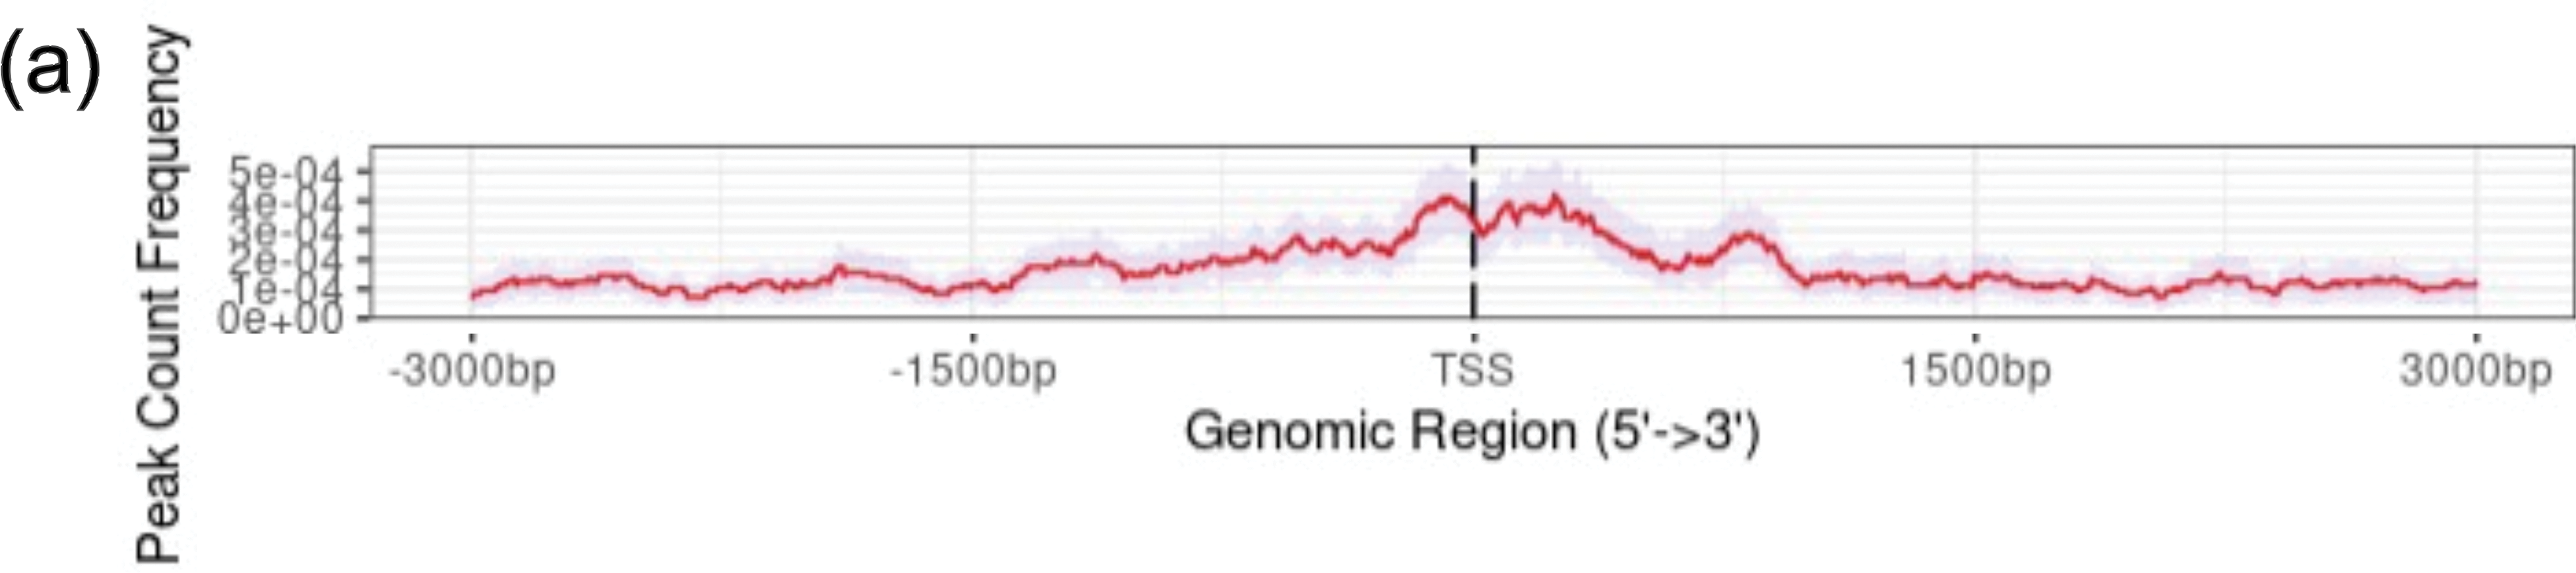
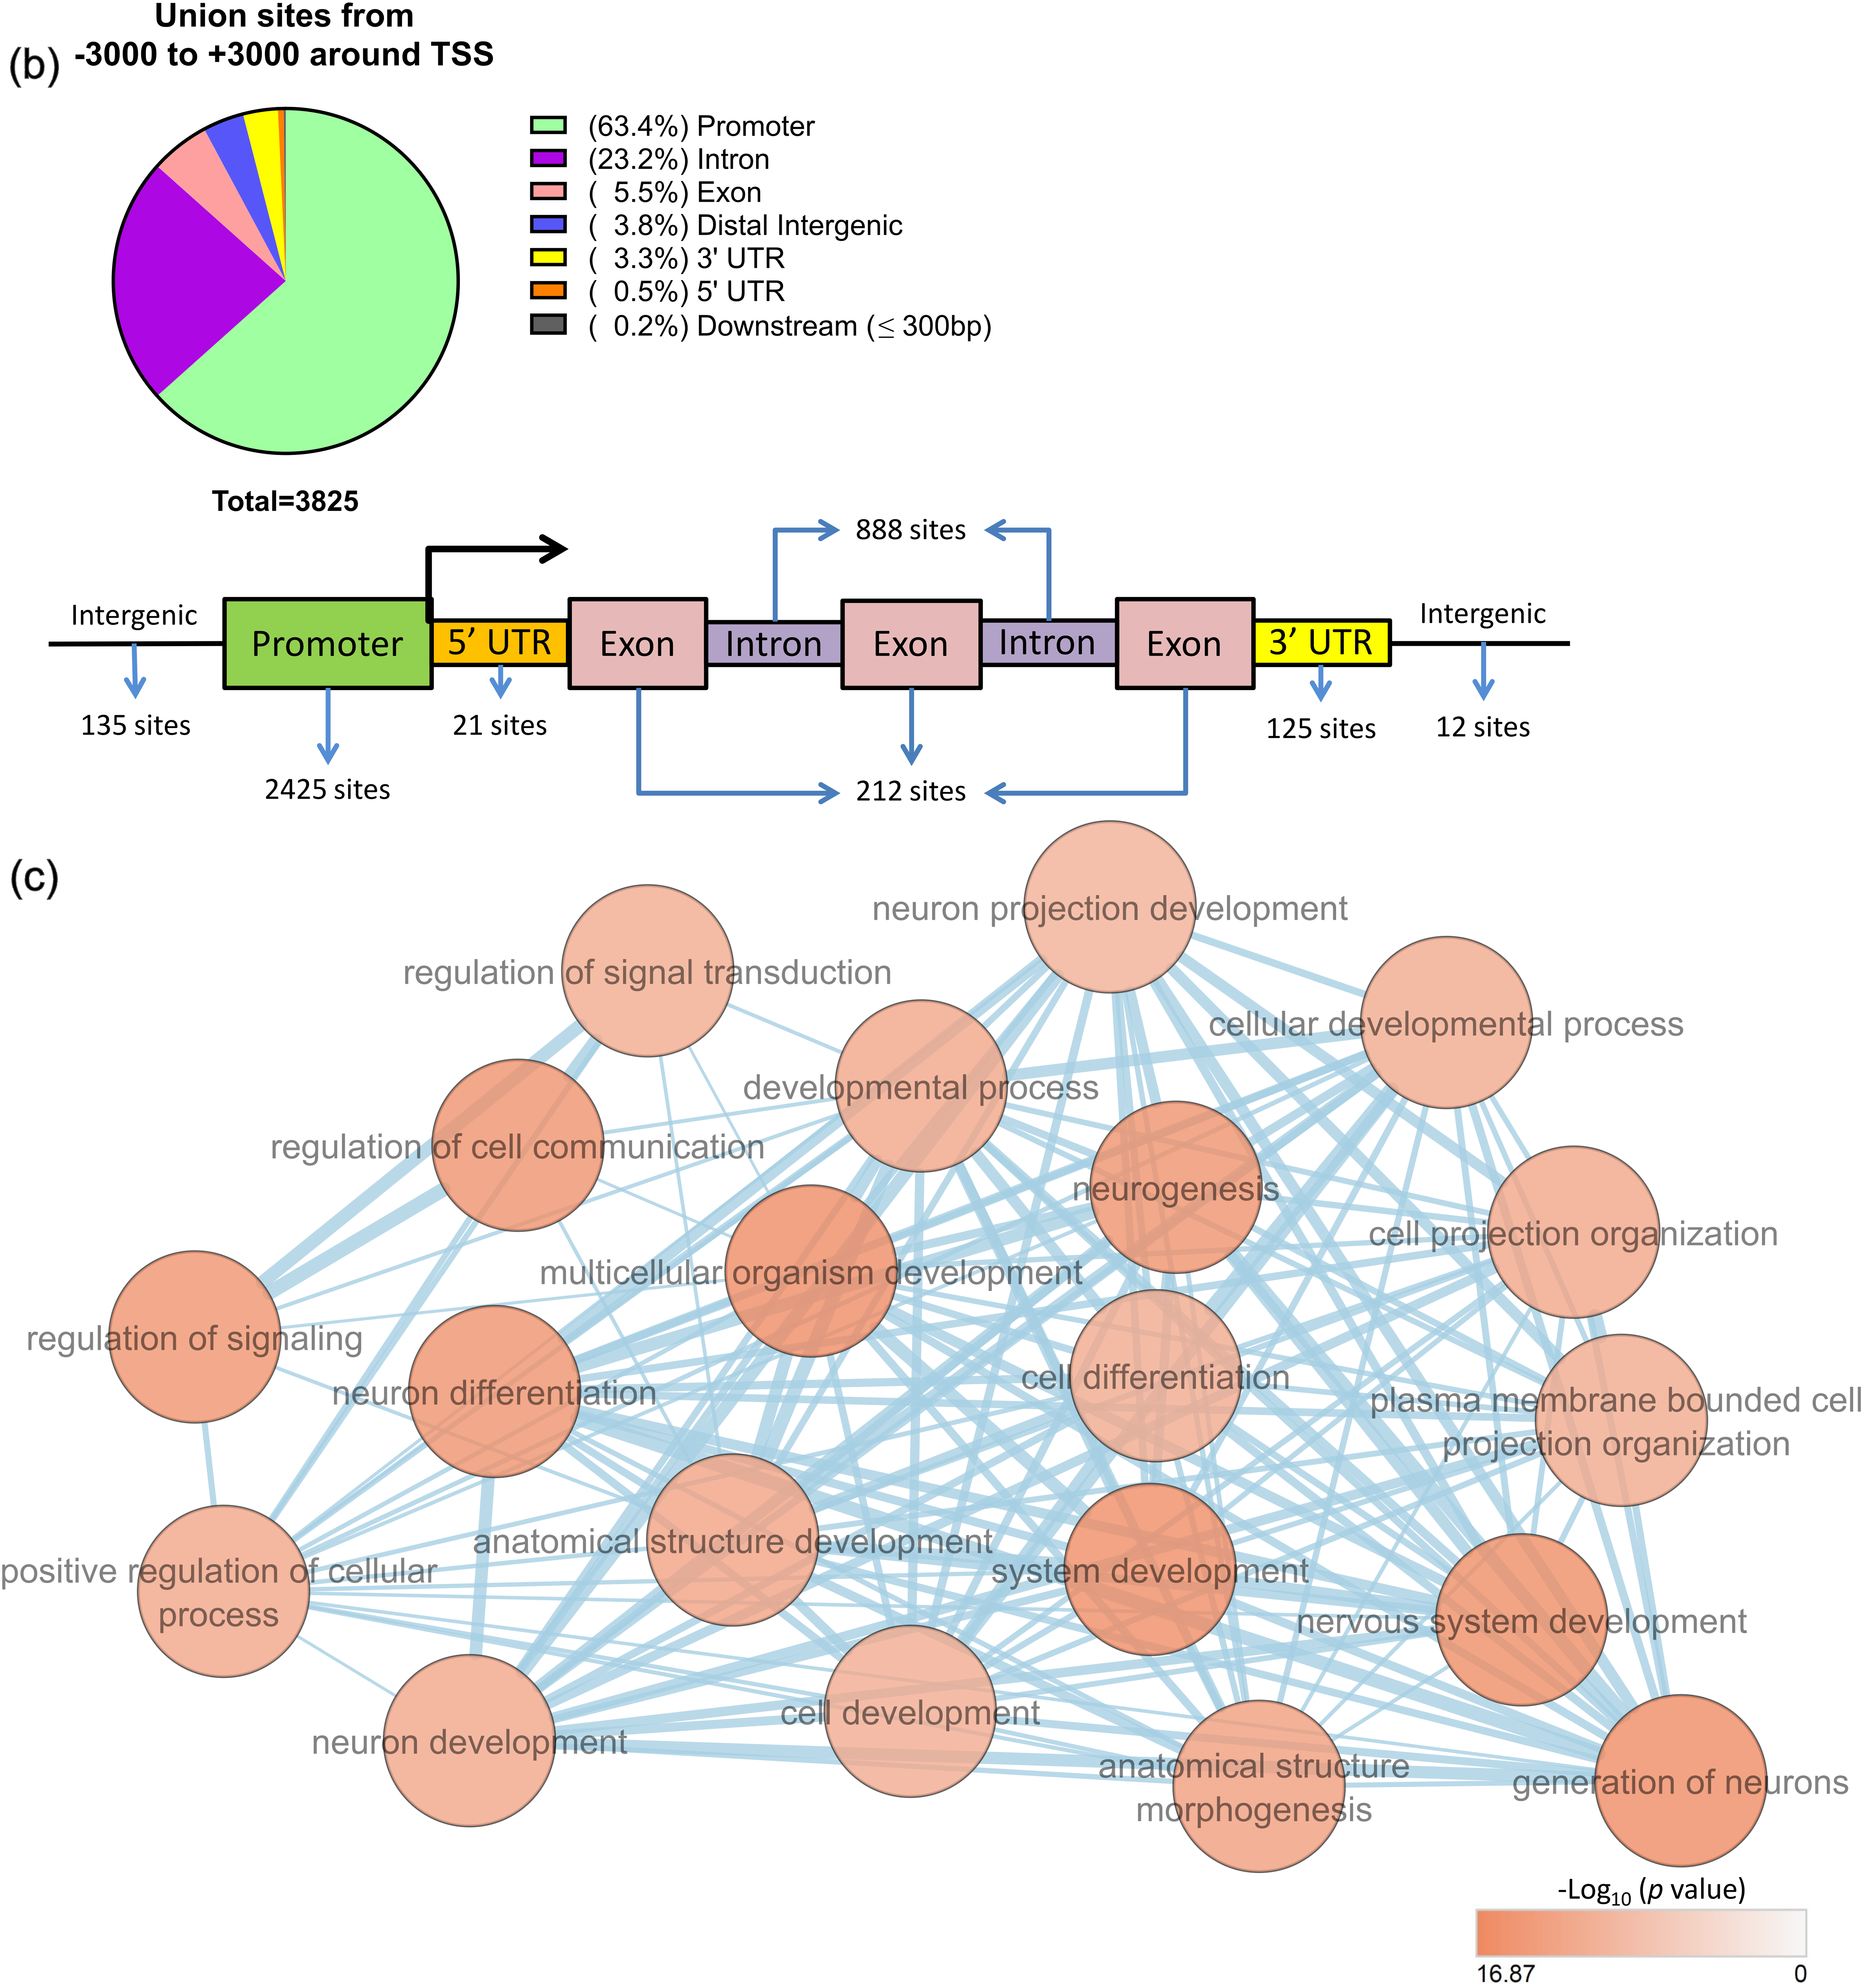
Figure 4: BORIS is predominantly localized at promoter regions and potentially regulates genes involved in tumor-related processes. (a) Distribution of BORIS ChIP-seq peak counts relative to transcription start sites (TSS, ±3000 bp). (b) Pie chart and schematic representation showing the genomic distribution of BORIS binding sites within ±3000 bp of TSS. BORIS predominantly binds to promoter regions (63.4%), followed by intronic regions (23.2%). (c) Top 20 enriched GO BP and Reactome pathways associated with genes bound by BORIS. Only terms passing Benjamini-Hochberg correction (adjusted p < 0.05) are shown. Enrichment maps were visualized in Cytoscape using an FDR q-value cutoff of 0.001. Enriched terms include processes related to development, differentiation, morphogenesis, cell communication, and organization (complete list provided in Table S5).
Genomic annotation of BORIS peaks showed that the majority of binding events occurred in promoter regions (63.4%), followed by intronic regions (23.2%) (Fig. 4b), consistent with its role as a transcriptional regulator.
Gene Ontology and Reactome pathway enrichment analyses of genes with BORIS peaks (within ± 3000 bp of the TSS) revealed significant enrichment of biological processes related to development, morphogenesis, and cell differentiation (Fig. 4c). Additional enriched categories included cell communication, homeostasis, adhesion, migration, transcriptional regulation, and pathways associated with proliferation and cell survival (Table S5).
Taken together, our data supports the previous evidence that BORIS preferentially binds at promoter regions [33] and may modulate the expression of genes critical for GBM development and progression.
3.5 BORIS Overexpression is Associated with Altered Proliferative, Survival, and Migratory Properties in U87MG Cells
Following the identification of potential BORIS target genes, we sought to determine whether its overexpression leads to functional changes in tumorigenic properties, including proliferation, survival, and migration. To address this, U87MG cells stably overexpressing BORIS-GFP were generated, and BORIS expression was validated at both the mRNA and protein levels by RT-qPCR (Fig. 5a) and immunoblotting (Fig. 5b), respectively.
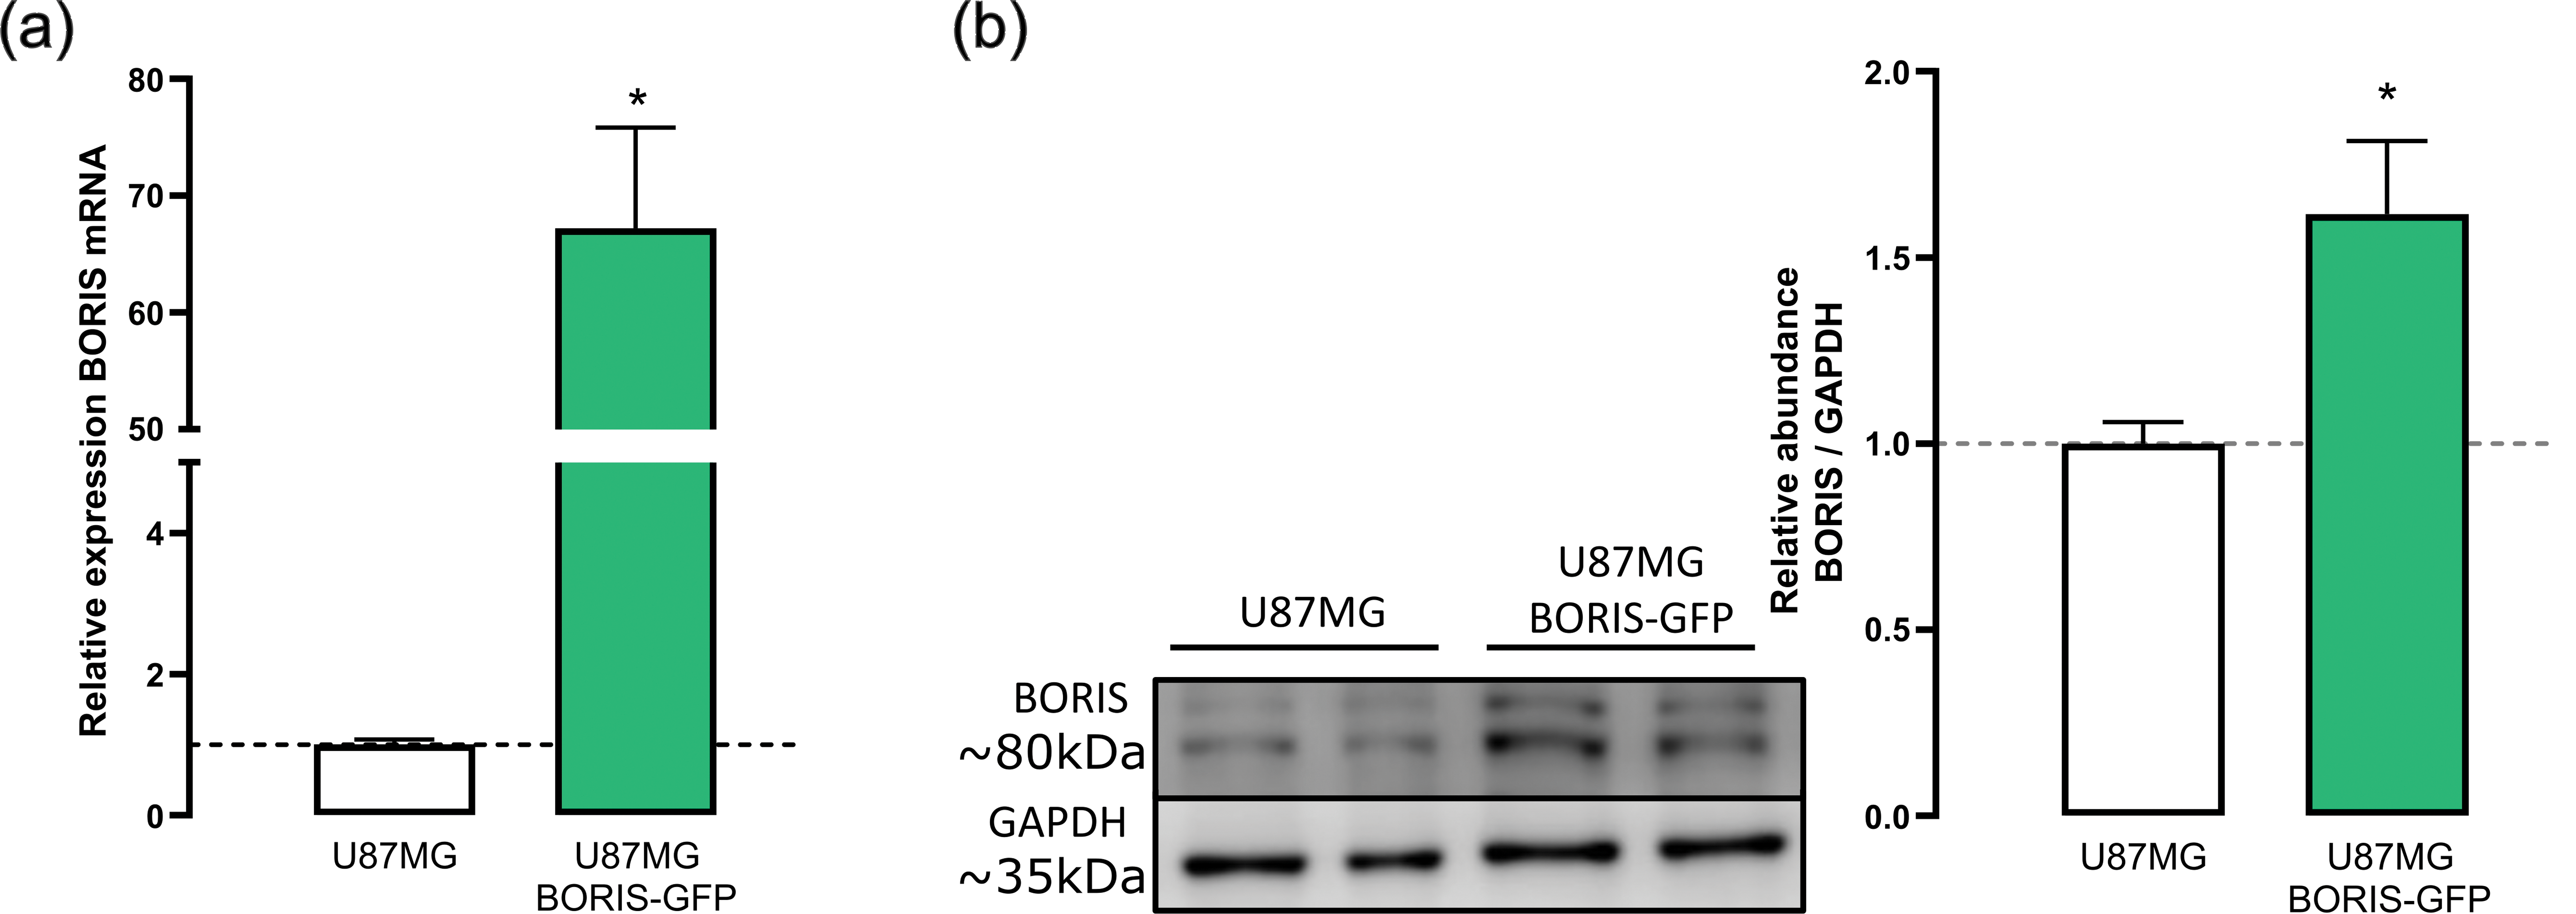
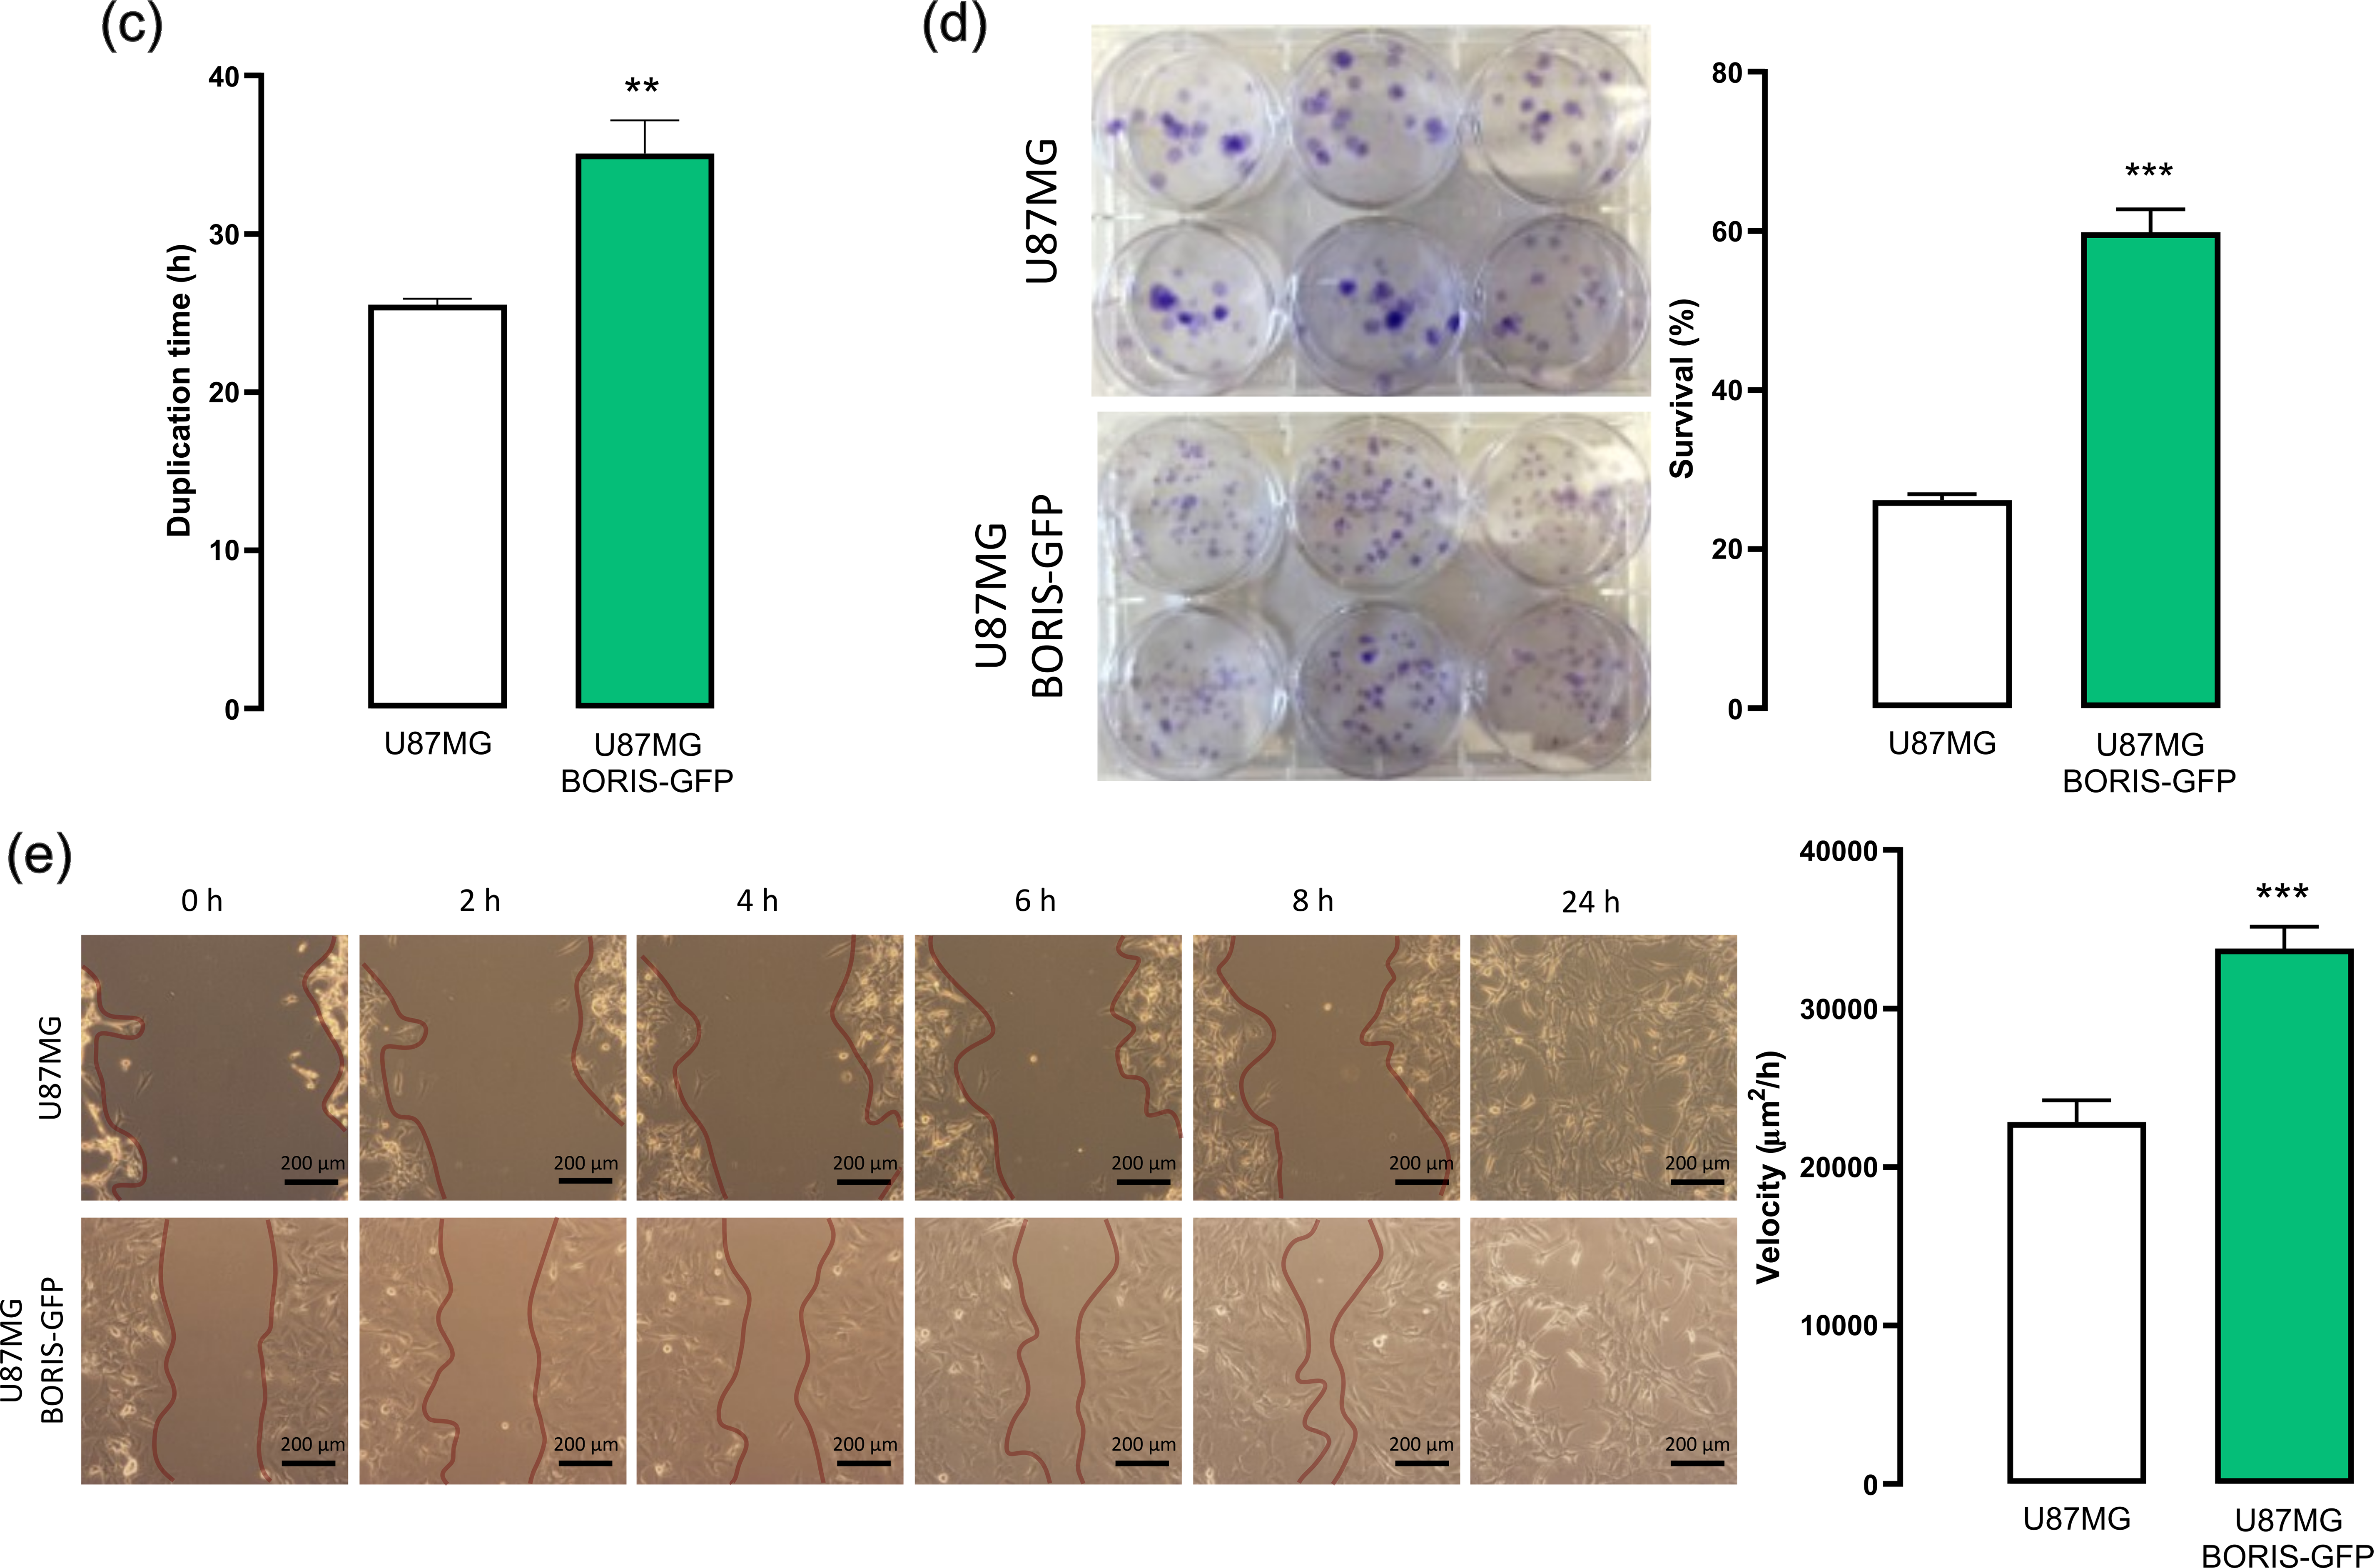
Figure 5: BORIS overexpression modulates proliferation, survival, and migration in U87MG cells. (a) BORIS mRNA levels were measured by RT-qPCR in wild type (U87MG, n = 4) and BORIS-overexpressing cells (U87MG BORIS-GFP, n = 4) cells. Mann-Whitney test, median 1.045 vs. 59.42; U = 0, p = 0.0286, two tailed) with a large effect size (Hedges’ g = 5.4352). (b) Immunoblot analysis showing BORIS protein abundance in U87MG and U87MG BORIS-GFP cells. Two-tailed unpaired t-test, t(4) = 0.0395, p = 0.0395) with a large effect size (Hedges’g = 2.4601). (c) Population doubling time assay shows that U87MG BORIS-GFP cells have a longer time than control U87MG cells, indicating reduced proliferative capacity. Two-tailed unpaired t-test with Welch’s correction, t(7.498) = 4.524, p = 0.0023) with a large size effect (Hedges’ g = 2.2618). (d) Colony formation assay reveals increased survival of U87MG BORIS-GFP cells, suggesting enhanced resilience under the tested conditions. Two-tailed unpaired t-test with Welch’s correction, t(5.684) = 11.40, p < 0.0001) with a large size effect (Hedges’ g = 6.5798) (e) Wound-healing assay demonstrates faster migration of U87MG BORIS-GFP cells, indicating that BORIS overexpression promotes enhanced migratory behavior. Two-tailed unpaired t-test with Welch’s correction, t(6.830) = 5.630, p = 0.0009) with a large size effect (Hedges’ g = 3.7304). Scale bar = 200 µm. *p < 0.05, **p < 0.01, ***p < 0.001.
Assessment of data distribution using the Shapiro-Wilk test indicated that RT-qPCR values were normally distributed in control U87MG cells (n = 4, W = 0.8525, p = 0.2342), but not in the U87MG BORIS-GFP group (n = 4, W = 0.6959, p = 0.0104). Accordingly, nonparametric analysis revealed a marked increase in BORIS mRNA levels in U87MG BORIS-GFP cells compared with controls (Mann-Whitney test, median 1.045 vs. 59.42; U = 0, p = 0.0286, two tailed) with a large effect size (Hedges’ g = 5.4352).
For protein abundance, densitometric values from immunoblot were normally distributed in both U87MG (n = 3, W = 1.000, p > 0.9999) and U87MG BORIS-GFP cells (n = 3, W = 0.9119, p = 0.4243). Consistent with transcript-level findings, BORIS protein abundance was significantly higher in U87MG BORIS-GFP cells compared with control cells (two-tailed unpaired t-test, t(4) = 0.0395, p = 0.0395) with a large effect size (Hedges’g = 2.4601) confirming robust BORIS overexpression (Fig. 5b).
Population doubling time were normally distributed for both U87MG (n = 8, A2 = 0.4430, p = 0.2086; K2 = 1.486, p = 0.4756; W = 0.8743, p = 0.1659; KS distance = 0.1996, p > 0.1000) and U87MG BORIS-GFP cells (n = 8, A2 = 0.1965, p = 0.8304; K2 = 0.4455, p = 0.8003; W = 0.9505, p = 0.7165; KS distance = 0.1328, p > 0.1000), as determined by multiple normality tests (Anderson–Darling, D’Agostino–Pearson, Shapiro–Wilk, and Kolmogorov–Smirnov tests). Analysis revealed that BORIS-GFP-expressing cells exhibited a significantly longer duplication time than control U87MG cells, indicating reduced proliferative activity under standard growth conditions (two-tailed unpaired t-test with Welch’s correction, t(7.498) = 4.524, p = 0.0023) with a large size effect (Hedges’ g = 2.2618) (Fig. 5c).
Despite this reduced proliferative rate, BORIS-GFP cells demonstrate enhanced clonogenic capacity. Colony formation assay data were normally distributed in both groups (U87MG: n = 6, W = 0.8502, p = 0.1579; KS distance = 0.2145, p > 0.1000; U87MG BORIS-GFP: n = 6, W = 0.8777, p = 0.2585; KS distance = 0.2117, p > 0.1000), and BORIS-GFP expressing cells formed significantly more colonies than control cells (two-tailed unpaired t-test with Welch’s correction, t(5.684) = 11.40, p < 0.0001) with a large size effect (Hedges’ g = 6.5798), suggesting increased survival under the experimental conditions (Fig. 5d).
Finally, wound healing assay data were normally distributed in both U87MG (n = 5, W = 0.8504, p = 0.1957) and U87MG-BORIS-GFP cells (n = 4, W = 0.9787, p = 0.8942). BORIS-GFP-expressing cells closed the wound area more rapidly than control cells, consistent with increased migratory capacity (two-tailed unpaired t-test with Welch’s correction, t(6.830) = 5.630, p = 0.0009) with a large size effect (Hedges’ g = 3.7304) (Fig. 5e).
Taken together, these results indicate that BORIS overexpression is related to distinct and measurable changes in proliferation, survival, and migration in U87MG cells, supporting a potential role for BORIS in modulating cellular programs related to adaptation and motility.
3.6 BORIS Targets Include Genes Relevant for Tumor Pathogenesis
Among the genes with increasing evidence of involvement in tumor progression, CD36 has been associated with stemness-related properties [34–36], while Fibrillin 2 (FBN2) is a regulator of TGF-β signaling with reported roles in angiogenesis and immune modulation [37–41].
To identify putative BORIS targets, differentially expressed genes (DEGs) from the comparison between highest (Q4) and lowest (Q1) BORIS expression quartiles were overlapped with BORIS-bound genes identified by ChIP-seq analysis. Both CD36 and FBN2 appeared in the intersection of datasets, suggesting that they may represent direct BORIS target genes (Fig. 6a).
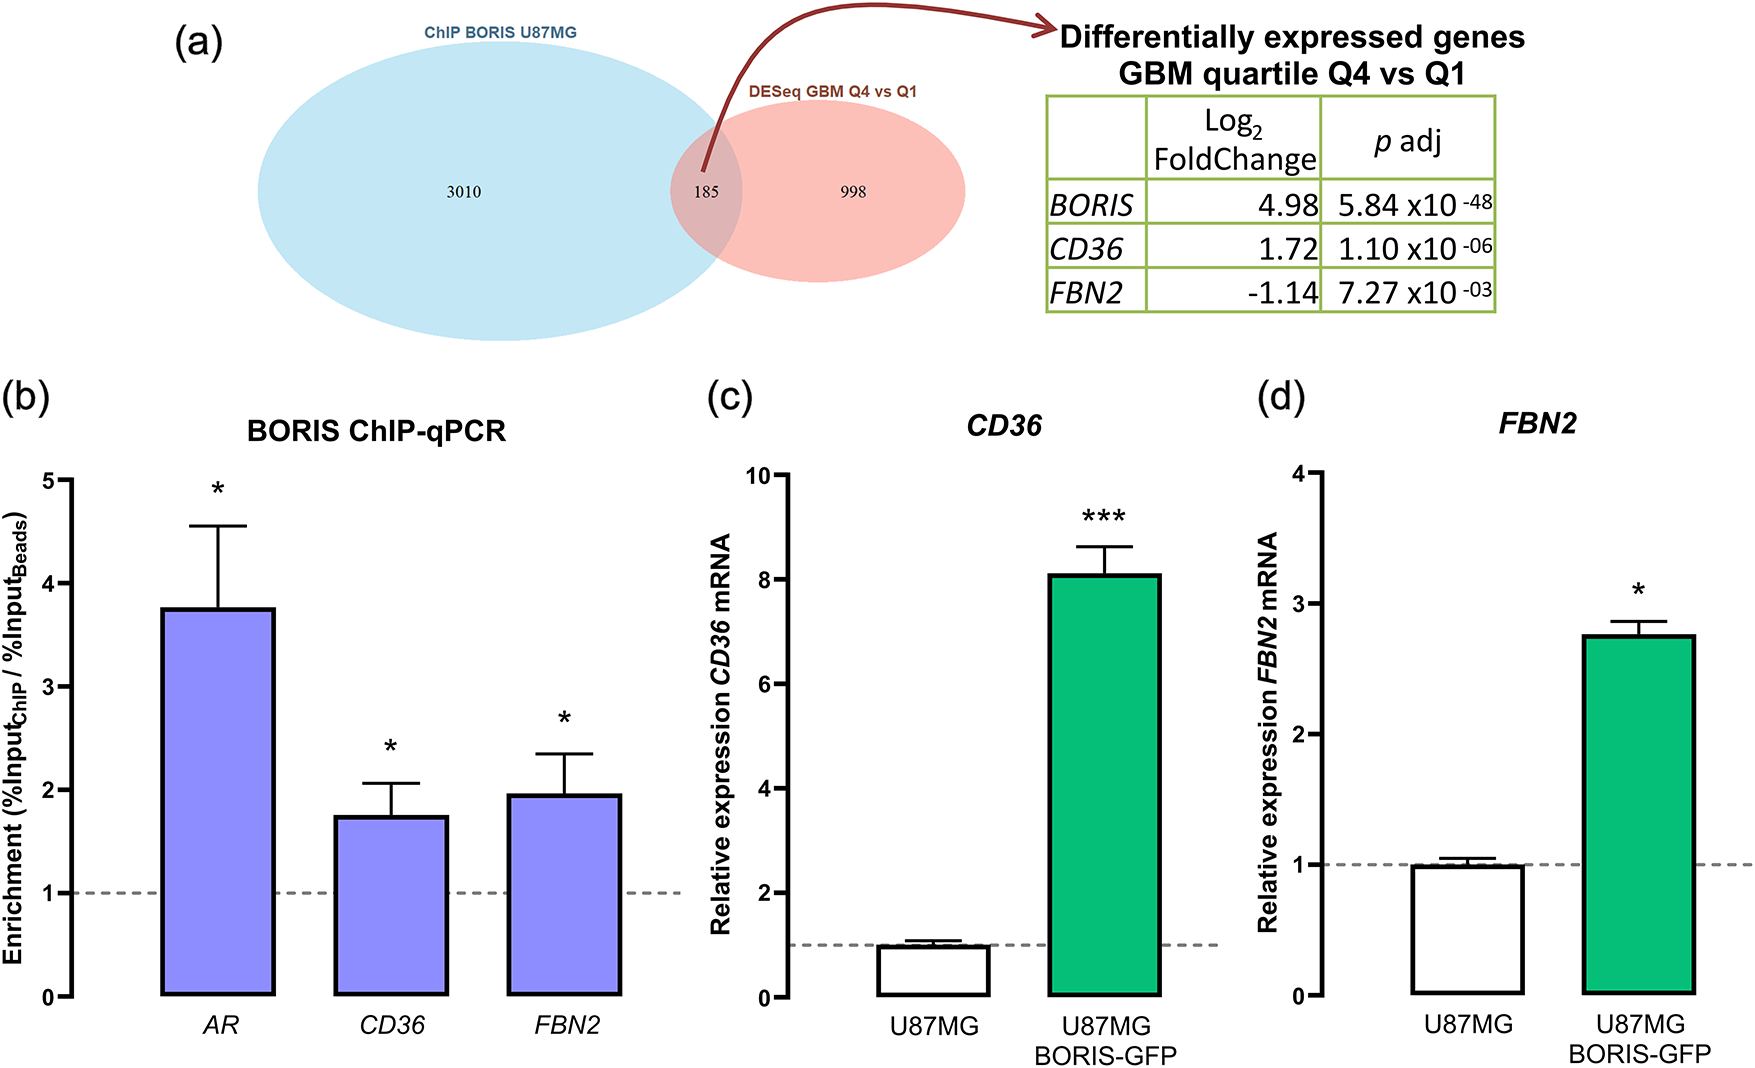
Figure 6: BORIS positively regulates the expression of the fatty acid translocase (CD36) and fibrillin 2 (FBN2) in glioblastoma cell line. (a) Venn diagram showing the overlap between differentially expressed genes (DESEq2 GBM vs. brain cortex) and BORIS ChIP-seq targets in U87MG cells, identifying 185 common genes. Among these, BORIS, CD36, and FBN2 were present in both datasets (log2FC and padj from GBM Q4 vs. Q1 were described previously). (b) ChIP-qPCR validation of BORIS enrichment at androgen receptor (AR) (n = 3), CD36 (n = 4), and FBN2 (n = 4) loci. The AR gene was used as a positive control. The gray dotted line indicates the beads-only (no antibody) control. AR t(4) = 3.524, p = 0.0244. CD36 t(6) = 2.465, p = 0.0488. FBN2 t(6) = 2.542, p = 0.0440. (c) CD36 mRNA expression quantified by RT-qPCR in U87MG (n = 4) and U87MG BORIS-GFP (n = 4) cells. Two-tailed unpaired t-test; t(6.0) = 13.80, p < 0.0001. (d) FBN2 mRNA expression quantified by RT-qPCR in U87MG (n = 4) and U87MG BORIS-GFP cells (n = 4) cells. Mann-Whitney test, median 0.9600 vs. 2.730; U = 0, p = 0.0286, two tailed with a large effect size (Hedges’ g = 11.5424). *p < 0.05. ***p < 0.001 vs. U87MG group.
To validate BORIS occupancy at the loci, ChIP-qPCR assays were performed using primers targeting the predicted BORIS binding sites for CD36 and FBN2. The androgen receptor (AR) locus was included as a positive control, as BORIS binding at this site has been previously reported [16]. Significant enrichment was detected at the AR locus relative to bead controls (Shapiro-Wilk test n = 3, W = 0.8801, p = 0.3248; two-tailed unpaired t-test, t(4) = 3.524, p = 0.0244), with a large size effect: Hedges’ g = 2.8772), supporting assay specificity (Fig. 6b). Consistent with the ChIP-seq data, significant enrichment of BORIS was also observed at the CD36 locus (Shapiro-Wilk test n = 4, W = 0.7890, p = 0.0840; two-tailed unpaired t-test, t(6) = 2.465, p = 0.0488; Hedges’ g = 1.7445) and at the FBN2 locus (Shapiro-Wilk test n = 4, W = 0.8342, p = 0.1791; two-tailed unpaired t-test, t(6) = 2.542, p = 0.0440; Hedges’ g = 1.7984), confirming BORIS recruitment to these regulatory regions (Fig. 6b).
To assess whether BORIS binding is associated with transcriptional regulation of these genes, CD36 and FBN2 mRNA levels were quantified in BORIS-GFP-overexpressing U87MG cells. RT-qPCR analysis showed a significantly increased in CD36 transcript levels upon BORIS overexpression (Shapiro-Wilk normality test U87MG: n = 4, W = 0.9743, p = 0.8678; U87MG-BORIS-GFP: n = 4, W = 9888, p = 0.9511; two-tailed unpaired t-test, t(6) = 13.80, p < 0.0001 with a large size effect (Hedges’ g = 9.7573)) (Fig. 6c). Similarly, FBN2 mRNA levels were significantly increased in BORIS-GFP-expressing cells (Shapiro-Wilk normality test U87MG: n = 4, W = 0.6746, p = 0.0056; U87MG-BORIS-GFP: n = 4, W = 0.9454, p = 0.6875, Mann-Whitney test, median 0.9600 vs. 2.730; U = 0, p = 0.0286, two tailed) with a large effect size (Hedges’ g = 11.5424)) (Fig. 6d).
Together, these data indicate that BORIS directly binds regulatory regions of CD36 and FBN2 and that its overexpression is associated with increased expression of both genes. Given the reported roles of CD36 and FBN2 in tumor-related processes, these findings support a functional link between BORIS occupancy and transcriptional programs relevant to glioblastoma pathogenesis.
To evaluate whether these BORIS-associated transcriptional relationships are reflected in patient-derived tumors, we examined the correlation between BORIS expression and CD36 or FBN2 expression across TCGA GBM samples. When all IDH-wildtype GBM tumors encompassing mesenchymal (ME), classical (CL), and proneural (PN) subtypes were analyzed together, BORIS expression showed a modest positive correlation with CD36 (Pearson’s r = 0.16, 95% CI [0.01612, 0.2925], n = 192, p = 0.029) and a weak negative correlation with FBN2 (r = −0.08, 95% CI [−0.2225, 0.05879], n = 192, p = 0.249).
Subtype-stratified analyses revealed heterogeneity in these associations. The classical subtype exhibited a stronger positive correlation between BORIS and CD36 (r = 0.48, 95% CI [0.2721, 0.6421], n = 69, p = 3.269 × 10⁻⁵), whereas correlations were weaker in mesenchymal (r = 0.15, 95% CI [−0.052222, 0.3460], n = 93, p = 0.143) and proneural tumors (r = 0.11, 95% CI [−0.2643, 0.4491], n = 30, p = 0.577). Correlations between BORIS and FBN2 remained weak or negative across all subtypes (classical: r = −0.198, 95% CI [−0.4153, 0.04053], n = 69, p = 0.103; mesenchymal: r = −0.051, 95% CI [−0.2516, 0.1548], n = 93, p = 0.631; proneural: r = −0.191, 95% CI [−0.5159, 0.1816], n = 30, p = 0.312). These data indicate that the transcriptional association between BORIS and its target genes varies across GBM molecular subtypes, consistent with the known heterogeneity of the disease.
GBM remains the most aggressive and most common primary tumor of the central nervous system [1]. Similar to other malignancies, GBM is driven by profound transcriptional and epigenetic deregulation that disrupts regulatory networks controlling proliferation, differentiation, and survival [7,8,42,43]. In this study, we combined integrative bioinformatics analyses of large-scale patient-derived datasets with experimental validation to investigate the role BORIS in GBM, following a systems-level strategy increasingly used to infer disease-relevant regulatory networks in cancer.
Comparative transcriptomic analysis of TCGA-GBM and GTex brain cortex samples revealed a pronounced transcriptional divergence consistent with the malignant phenotype of GBM. After ComBat-seq normalization, PCA showed clustering driven primarily by biological differences rather than batch effects. Differential expression analysis identified widespread transcriptional reprogramming, with upregulated genes enriched for chromatin modification, transcriptional regulation, immune signaling, and cell cycle control, and downregulated genes associated with neuronal differentiation and cytoskeletal organization. This pattern reflects a shift from a neuronal identity toward a proliferative and invasive state, a hallmark of GBM biology.
BORIS, a paralog of CTCF, has established roles in germ cell development and cancer-related gene regulation [11,44,45]. While CTCF primarily functions as a tumor suppressor by maintaining chromatin insulation by maintaining chromatin insulation and three-dimensional genome organization [46–48], BORIS has been linked to transcriptional activation, chromatin remodeling, and competition for CTCF binding sites [33,49–51]. Although BORIS overexpression has been reported in several malignancies [12–18], its regulatory role in GBM remains insufficiently characterized. Our findings provide evidence that BORIS contributes to GBM gene regulatory networks, consistent with a role in modulating transcriptional programs relevant to tumor progression.
Gene ontology analysis further highlighted the biological consequences of this transcriptional reprogramming. Upregulated genes in GBM were enriched for pathways promoting tumorigenesis (consistent with hallmark features of cancer [7]), whereas downregulated genes were strongly associated with nervous system development and neuronal functions, supporting the notion that GBM cells suppress lineage-specific programs. This observation aligns with prior reports implicating Repressor Element 1 Silencing Transcription factor (REST)-mediated repression of neuronal gene expression in GBM [52], as well as models proposing neural stem or progenitor origins for glioma initiation [53–57]. Consistently, stratification of TCGA-GBM samples by BORIS expression revealed distinct transcriptional signatures, with upregulated genes in BORIS-high tumors enriched for pathways related to morphogenesis, cell signaling, and metabolic stability, while downregulated genes were enriched for processes related to chromatin structure, DNA methylation, recombination, and genome stability. These patterns suggest that BORIS may contribute to GBM pathogenesis by modulating transcriptional programs that support cellular plasticity, proliferation, and adaptation to genomic stress as previously described for other malignances [58–61].
ChIP-seq analysis in U87MG cells demonstrated that BORIS binding is predominantly localized to promoter-proximal regions, with approximately two-thirds of peaks mapped within ±3 kb of transcription start sites. Functional enrichment of BORIS-bound genes highlighted processes related to development, morphogenesis, cell communication, adhesion and migration. These results are consistent with prior studies describing BORIS as a transcriptional activator capable of reprogramming chromatin structure, recruiting chromatin-remodeling complexes, and altering higher-order genome architecture [13,33,62], supporting a model in which BORIS contributes to a developmental-like transcriptional state in GBM.
The phenotypic effects of BORIS overexpression observed in this study, characterized by reduced proliferation together with enhanced survival and migratory capacity, highlight a context-dependent role for BORIS in GBM that expands upon its previously described functions. While BORIS has been reported to promote proliferation and viability in general tumorigenesis [19], our findings in GBM cells more closely mirror its recently described pro-invasive role in melanoma [15,51]. These results suggest that BORIS may drive a phenotypic switch in GBM, attenuating proliferative programs while activating adaptive traits associated with invasion and long-term persistence. Such a switch may be mediated through the regulation of stemness-related pathways, as BORIS has been implicated in the control of cancer stem cell properties, including self-renewal and migration [19], which are key determinants of GBM aggressiveness and recurrence.
To connect BORIS chromatin occupancy with transcriptional and functional outcomes, we focused on CD36 and FBN2, two genes identified at the intersection of BORIS-associated DEGs and BORIS ChIP-seq targets. These genes were selected as representative BORIS targets to provide mechanistic and functional validation; however, genome-wide BORIS ChIP-seq and enrichment analyses indicate that BORIS regulates a broader network of genes involved in development, metabolism, and cell migration. ChIP-qPCR confirmed BORIS binding at regulatory regions of both loci, and BORIS overexpression resulted in significant transcriptional upregulation. CD36 has been implicated in fatty acids uptake, metabolic reprogramming, and stem-like properties in GBM and other cancers [35,63–69], while FBN2 encodes an extracellular matrix component involved in TGF-β signaling, stromal remodeling, angiogenesis, and immune modulation [37,38,40,41]. Notably, evidence from functional studies in lung cancer have shown that FBN2 knockdown significantly impairs tumor cell migration and invasion, supporting a role for FBN2 in regulating cell motility through extracellular matrix-dependent mechanisms [70]. Although the role of FBN2 in GBM remains poorly defined, its regulation by BORIS suggests a potential link between chromatin-level transcriptional control and microenvironmental remodeling.
Together, our results support a model in which BORIS functions as a transcriptional regulator in GBM, linking promoter-proximal chromatin occupancy to gene expression programs associated with developmental plasticity, survival and migration. Rather than acting solely as a driver of proliferation, BORIS appears to promote adaptive tumor states that may contribute to GBM aggressiveness and therapeutic resistance.
To assess the consistency of BORIS–target gene relationships in patient tumors, we examined the correlation between BORIS expression and CD36 or FBN2 transcript levels across TCGA-GBM samples, stratified by molecular subtype. These analyses revealed modest and subtype-dependent correlations, with the strongest association observed in the classical subtype, whereas weaker or inconsistent correlations were detected in mesenchymal and proneural tumors. These findings indicate that BORIS-dependent regulation of CD36 and FBN2 is context-specific and likely influenced by additional regulatory layers present in vivo, including subtype-specific transcriptional programs, microenvironmental cues, and epigenetic states. Importantly, this analysis was intended to provide biological context rather than direct validation of the U87MG-based mechanistic findings, and a comprehensive dissection of subtype-specific regulatory interactions lies beyond the scope of the present study.
This study has some limitations. The findings are primarily based on in vitro analyses in a single GBM cell line (U87MG), and validation in additional models will be required to assess broader relevance. Although CD36 and FBN2 were identified as direct BORIS targets, their causal roles in the observed phenotypes were not functionally dissected. Moreover, loss-of-function analyses to formally establish the necessity of BORIS for CD36 and FBN2 expression were not feasible in this study, as BORIS depletion resulted in severe viability defects (data not shown) consistent with previously reported roles of BORIS in cell-cycle regulation, genomic stability, and cellular stress responses [71,72]. The influence of BORIS on higher-order chromatin regulation and in vivo tumor behavior remains to be explored. Additionally, while subtype-stratified correlation analyses provide contextual support for BORIS target regulation in patient tumors, the mechanistic basis of these subtype-specific relationships warrants dedicated investigation in future studies.
In summary, this study integrates transcriptomics analysis, BORIS ChIP-seq, and functional assays to characterize the role of BORIS in glioblastoma. BORIS is differentially expressed in GBM and is associated with distinct transcriptional programs linked to development, metabolism, and cell signaling. Chromatin occupancy analyses identify CD36 and FBN2 as BORIS targets, and their transcriptional activation supports a role for BORIS in regulating genes relevant to tumor adaptation.
Functional assays further indicate that BORIS overexpression is related to an altered proliferative dynamic, enhanced clonogenic survival, and increased migratory capacity in GBM cells. Together, these findings suggest that BORIS contributes to transcriptional and phenotypic programs associated with GBM aggressiveness. Although additional validation is required, BORIS and its downstream targets represent potential candidates for future biomarker development and therapeutic exploration in glioblastoma.
Acknowledgement: We dedicate this work to the memory of Dr. Lissania Guerra Calderas, an outstanding scientist and a deeply committed researcher in the field of epigenetics. Her intellectual rigor, curiosity, and passion for discovery left a lasting mark on this project and on all those who had the privilege of working with her. Beyond her scientific contributions, she will be remembered for her generosity as a mentor and colleague, and for the inspiration she provided to those who continue to follow the scientific path she so passionately embraced.
Funding Statement: This work was supported by the Secretaría de Ciencia, Humanidades, Tecnología e Innovación (SECIHTI), Fondo Ciencia Básica y de Frontera 2025 (CBF-2025-G-97) to E. Soto-Reyes and PRODEP (511/2023-3066-1599); and SECIHTI, Fondo de Ciencia de Frontera 2023 (CF-2023-G398) to C. Sámano. The project was also supported by the Departamento de Ciencias Naturales (DCN), División de Ciencias Naturales e Ingeniería (DCNI), UAM, Unidad Cuajimalpa, through Divisional Project Number 101S243-23 to E. Soto-Reyes and 123 S289-25 to C. Sámano. Sofía Plata-Burgos was a master student from Programa de Maestría y Doctorado en Ciencias Bio-químicas, Universidad Nacional Autónoma de México (UNAM) and received a fellowship (CVU number 1184475) from Secretaría de Ciencia, Humanidades, Tecnología e Innovación (SECIHTI), Mexico. Gerardo Ramirez-Mejia is a postdoctoral fellow at the Universidad Autónoma Metropolitana - Cuajimalpa (UAM-C) and received a fellowship (CVU number 588333) from SECIHTI, Mexico.
Author Contributions: The authors confirm contribution to the paper as follows: conceptualization: Gerardo Ramírez-Mejía, Sofía Plata-Burgos and Ernesto Soto-Reyes; methodology, Gerardo Ramírez-Mejía, Sofía Plata-Burgos, Adrian Ledesma-Beiza and Ernesto Soto-Reyes; software, Gerardo Ramírez-Mejía, Sofía Plata-Burgos and Raquel Cuevas-Díaz Duran; validation, Gerardo Ramírez-Mejía, Sofía Plata-Burgos and Raquel Cuevas-Díaz Duran; formal analysis, Gerardo Ramírez-Mejía, Sofía Plata-Burgos, Raquel Cuevas-Díaz Duran, Adrian Ledesma-Beiza; investigation, Gerardo Ramírez-Mejía, Sofía Plata-Burgos and Ernesto Soto-Reyes; resources, Cynthia Sámano and Ernesto Soto-Reyes; data curation, Gerardo Ramírez Mejía, Sofía Plata-Burgos and Raquel Cuevas-Díaz Duran, Adrian Ledesma-Beiza; writing—original draft preparation, Gerardo Ramírez Mejía; writing—review and editing, Gerardo Ramírez Mejía, Raquel Cuevas-Díaz Duran, Cynthia Sámano, Thalía Estefanía Sánchez-Correa and Ernesto Soto-Reyes; visualization, Gerardo Ramírez Mejía, Cynthia Sámano, and Ernesto Soto-Reyes; supervision, Ernesto Soto-Reyes; project administration, Gerardo Ramírez-Mejía and Ernesto Soto-Reyes; funding acquisition, Ernesto Soto-Reyes. All authors reviewed and approved the final version of the manuscript.
Availability of Data and Materials: All RNA-seq and clinical data analyzed in this study are publicly available from TCGA/GDC, GTEx, and cBioPortal. No new RNA-seq data were generated. The RNA-seq analysis scripts, including all filtering thresholds and ComBat-seq batch-correction parameters, are available at GitHub: https://github.com/gerardramm/GBM-BORIS-CTCFL. The processed ChIP-seq data have been deposited in the ArrayExpress database under accession number E-MTAB-15935. Raw ChIP-seq data are available under the same accession in the “Linked information” section.
Ethics Approval: Not applicable.
Conflicts of Interest: The authors declare no conflicts of interest.
Supplementary Materials: The supplementary material is available online at https://www.techscience.com/doi/10.32604/biocell.2026.075061/s1. Fig. S1. Principal component analysis (PCA) before and after batch correction. Fig. S2. Stratification of TCGA-GBM samples based on BORIS expression levels. Table S1. GO BP and Reactome pathway enrichment results for downregulated DEGs identified from TCGA-GBM vs. GTex brain cortex RNA-seq data. Table S2. GO BP and Reactome pathway enrichment results for upregulated DEGs identified from TCGA-GBM vs. GTex brain cortex RNA-seq data. Table S3. GO BP and Reactome pathway enrichment results for downregulated DEGs identified from quartile 4 vs. quartile 1 BORIS expression in TCGA-GBM RNA-seq data. Table S4. GO BP and Reactome pathway enrichment results for upregulated DEGs identified from quartile 4 vs. quartile 1 BORIS expression in TCGA-GBM RNA-seq data. Table S5. GO BP and Reactome pathway enrichment results for genes associated with BORIS ChIP-seq peaks.
References
1. Ostrom QT, Cioffi G, Waite K, Kruchko C, Barnholtz-Sloan JS. CBTRUS statistical report: primary brain and other central nervous system tumors diagnosed in the United States in 2014–2018. Neuro Oncol. 2021;23:iii1–105. doi:10.1093/neuonc/noab200. [Google Scholar] [PubMed] [CrossRef]
2. Czarnywojtek A, Borowska M, Dyrka K, Van Gool S, Sawicka-Gutaj N, Moskal J, et al. Glioblastoma multiforme: the latest diagnostics and treatment techniques. Pharmacology. 2023;108:423–31. doi:10.1159/000531319. [Google Scholar] [PubMed] [CrossRef]
3. Jiang H, Yu K, Li M, Cui Y, Ren X, Yang C, et al. Classification of progression patterns in glioblastoma: analysis of predictive factors and clinical implications. Front Oncol. 2020;10:590648. doi:10.3389/fonc.2020.590648. [Google Scholar] [PubMed] [CrossRef]
4. Poursaeed R, Mohammadzadeh M, Safaei AA. Survival prediction of glioblastoma patients using machine learning and deep learning: a systematic review. BMC Cancer. 2024;24:1581. doi:10.1186/s12885-024-13320-4. [Google Scholar] [PubMed] [CrossRef]
5. Karschnia P, Dono A, Young JS, Juenger ST, Teske N, Häni L, et al. Prognostic evaluation of re-resection for recurrent glioblastoma using the novel RANO classification for extent of resection: a report of the RANO resect group. Neuro Oncol. 2023;25:1672–85. doi:10.1093/neuonc/noad074. [Google Scholar] [PubMed] [CrossRef]
6. Croce CM. Oncogenes and cancer. N Engl J Med. 2008;358:502–11. doi:10.1056/NEJMra072367. [Google Scholar] [PubMed] [CrossRef]
7. Hanahan D. Hallmarks of cancer: new dimensions. Cancer Discov. 2022;12:31–46. doi:10.1158/2159-8290.CD-21-1059. [Google Scholar] [PubMed] [CrossRef]
8. Bushweller JH. Targeting transcription factors in cancer—from undruggable to reality. Nat Rev Cancer. 2019;19:611–24. doi:10.1038/s41568-019-0196-7. [Google Scholar] [PubMed] [CrossRef]
9. Islam Z, Ali AM, Naik A, Eldaw M, Decock J, Kolatkar PR. Transcription factors: the fulcrum between cell development and carcinogenesis. Front Oncol. 2021;11:681377. doi:10.3389/fonc.2021.681377. [Google Scholar] [PubMed] [CrossRef]
10. Cheever MA, Allison JP, Ferris AS, Finn OJ, Hastings BM, Hecht TT, et al. The prioritization of cancer antigens: a national cancer institute pilot project for the acceleration of translational research. Clin Cancer Res. 2009;15:5323–37. doi:10.1158/1078-0432.CCR-09-0737. [Google Scholar] [PubMed] [CrossRef]
11. Pugacheva EM, Rivero-Hinojosa S, Espinoza CA, Méndez-Catalá CF, Kang S, Suzuki T, et al. Comparative analyses of CTCF and BORIS occupancies uncover two distinct classes of CTCF binding genomic regions. Genome Biol. 2015;16:161. doi:10.1186/s13059-015-0736-8. [Google Scholar] [PubMed] [CrossRef]
12. Alberti L, Losi L, Leyvraz S, Benhattar J. Different effects of BORIS/CTCFL on stemness gene expression, sphere formation and cell survival in epithelial cancer stem cells. PLoS One. 2015;10:e0132977. doi:10.1371/journal.pone.0132977. [Google Scholar] [PubMed] [CrossRef]
13. Debruyne DN, Dries R, Sengupta S, Seruggia D, Gao Y, Sharma B, et al. BORIS promotes chromatin regulatory interactions in treatment-resistant cancer cells. Nature. 2019;572:676–80. doi:10.1038/s41586-019-1472-0. [Google Scholar] [PubMed] [CrossRef]
14. Garikapati KR, Patel N, Makani VKK, Cilamkoti P, Bhadra U, Bhadra MP. Down-regulation of BORIS/CTCFL efficiently regulates cancer stemness and metastasis in MYCN amplified neuroblastoma cell line by modulating Wnt/β-catenin signaling pathway. Biochem Biophys Res Commun. 2017;484:93–9. doi:10.1016/j.bbrc.2017.01.066. [Google Scholar] [PubMed] [CrossRef]
15. Janssen SM, Moscona R, Elchebly M, Papadakis AI, Redpath M, Wang H, et al. BORIS/CTCFL promotes a switch from a proliferative towards an invasive phenotype in melanoma cells. Cell Death Discov. 2020;6:1. doi:10.1038/s41420-019-0235-x. [Google Scholar] [PubMed] [CrossRef]
16. Salgado-Albarrán M, González-Barrios R, Guerra-Calderas L, Alcaraz N, Estefanía Sánchez-Correa T, Castro-Hernández C, et al. The epigenetic factor BORIS (CTCFL) controls the androgen receptor regulatory network in ovarian cancer. Oncogenesis. 2019;8:41. doi:10.1038/s41389-019-0150-2. [Google Scholar] [PubMed] [CrossRef]
17. Zhang Y, Fang M, Song Y, Ren J, Fang J, Wang X. Brother of regulator of imprinted sites (BORIS) suppresses apoptosis in colorectal cancer. Sci Rep. 2017;7:40786. doi:10.1038/srep40786. [Google Scholar] [PubMed] [CrossRef]
18. Okabayashi K, Fujita T, Miyazaki J, Okada T, Iwata T, Hirao N, et al. Cancer-testis antigen BORIS is a novel prognostic marker for patients with esophageal cancer. Cancer Sci. 2012;103:1617–24. doi:10.1111/j.1349-7006.2012.02355.x. [Google Scholar] [PubMed] [CrossRef]
19. Soltanian S, Dehghani H. BORIS: a key regulator of cancer stemness. Cancer Cell Int. 2018;18:154. doi:10.1186/s12935-018-0650-8. [Google Scholar] [PubMed] [CrossRef]
20. Renaud S, Pugacheva EM, Delgado MD, Braunschweig R, Abdullaev Z, Loukinov D, et al. Expression of the CTCF-paralogous cancer-testis gene, brother of the regulator of imprinted sites (BORISis regulated by three alternative promoters modulated by CpG methylation and by CTCF and p53 transcription factors. Nucleic Acids Res. 2007;35:7372–88. doi:10.1093/nar/gkm896. [Google Scholar] [PubMed] [CrossRef]
21. Li X, Ning L, Zhang Q, Ge Y, Liu C, Bi S, et al. Expression profile of ACTL8, CTCFL, OIP5 and XAGE3 in glioma and their prognostic significance: a retrospective clinical study. Am J Transl Res. 2020;12:7782–96. doi:10.4238/gmr.15027656. [Google Scholar] [CrossRef]
22. Silva TC, Colaprico A, Olsen C, D’Angelo F, Bontempi G, Ceccarelli M, et al. TCGA workflow: analyze cancer genomics and epigenomics data using Bioconductor packages. F1000Res. 2016;5:1542. doi:10.12688/f1000research.8923.2. [Google Scholar] [PubMed] [CrossRef]
23. Guo W, Chen J, Li S, Zeng X, Wu X. Integrative pan-cancer analysis of UCP family and experimental validation identifies UCP2 as a potential therapeutic target for glioma. Front Cell Dev Biol. 2025;13:1662654. doi:10.3389/fcell.2025.1662654. [Google Scholar] [PubMed] [CrossRef]
24. Peng Q, Zhang M, Zhao S, Guo Y, Shan M, Su B, et al. Multi-omics characterization identifies AHCY as a prognostic biomarker driving immunometabolic reprogramming in bladder cancer. Transl Oncol. 2025;64:102652. doi:10.1016/j.tranon.2025.102652. [Google Scholar] [PubMed] [CrossRef]
25. Aran D, Camarda R, Odegaard J, Paik H, Oskotsky B, Krings G, et al. Comprehensive analysis of normal adjacent to tumor transcriptomes. Nat Commun. 2017;8:1077. doi:10.1038/s41467-017-01027-z. [Google Scholar] [PubMed] [CrossRef]
26. Cerami E, Gao J, Dogrusoz U, Gross BE, Sumer SO, Aksoy BA, et al. The cBio cancer genomics portal: an open platform for exploring multidimensional cancer genomics data. Cancer Discov. 2012;2:401–4. doi:10.1158/2159-8290.CD-12-0095. [Google Scholar] [PubMed] [CrossRef]
27. Verhaak RGW, Hoadley KA, Purdom E, Wang V, Qi Y, Wilkerson MD, et al. Integrated genomic analysis identifies clinically relevant subtypes of glioblastoma characterized by abnormalities in PDGFRA, IDH1, EGFR, and NF1. Cancer Cell. 2010;17:98–110. doi:10.1016/j.ccr.2009.12.020. [Google Scholar] [PubMed] [CrossRef]
28. Wang Q, Hu B, Hu X, Kim H, Squatrito M, Scarpace L, et al. Tumor evolution of glioma-intrinsic gene expression subtypes associates with immunological changes in the microenvironment. Cancer Cell. 2017;32:42–56.e6. doi:10.1016/j.ccell.2017.06.003. [Google Scholar] [PubMed] [CrossRef]
29. Kolberg L, Raudvere U, Kuzmin I, Adler P, Vilo J, Peterson H. g:Profiler—interoperable web service for functional enrichment analysis and gene identifier mapping (2023 update). Nucleic Acids Res. 2023;51:W207–12. doi:10.1093/nar/gkad347. [Google Scholar] [PubMed] [CrossRef]
30. Shannon P, Markiel A, Ozier O, Baliga NS, Wang JT, Ramage D, et al. Cytoscape: a software environment for integrated models of biomolecular interaction networks. Genome Res. 2003;13:2498–504. doi:10.1101/gr.1239303. [Google Scholar] [PubMed] [CrossRef]
31. Merico D, Isserlin R, Stueker O, Emili A, Bader GD. Enrichment map: a network-based method for gene-set enrichment visualization and interpretation. PLoS One. 2010;5:e13984. doi:10.1371/journal.pone.0013984. [Google Scholar] [PubMed] [CrossRef]
32. Suarez-Arnedo A, Torres Figueroa F, Clavijo C, Arbeláez P, Cruz JC, Muñoz-Camargo C. An image J plugin for the high throughput image analysis of in vitro scratch wound healing assays. PLoS One. 2020;15:e0232565. doi:10.1371/journal.pone.0232565. [Google Scholar] [PubMed] [CrossRef]
33. Pugacheva EM, Bhatt DN, Rivero-Hinojosa S, Tajmul M, Fedida L, Price E, et al. BORIS/CTCFL epigenetically reprograms clustered CTCF binding sites into alternative transcriptional start sites. Genome Biol. 2024;25:40. doi:10.1186/s13059-024-03175-0. [Google Scholar] [PubMed] [CrossRef]
34. Bao S, Wu Q, McLendon RE, Hao Y, Shi Q, Hjelmeland AB, et al. Glioma stem cells promote radioresistance by preferential activation of the DNA damage response. Nature. 2006;444:756–60. doi:10.1038/nature05236. [Google Scholar] [PubMed] [CrossRef]
35. Hale JS, Otvos B, Sinyuk M, Alvarado AG, Hitomi M, Stoltz K, et al. Cancer stem cell-specific scavenger receptor CD36 drives glioblastoma progression. Stem Cells. 2014;32:1746–58. doi:10.1002/stem.1716. [Google Scholar] [PubMed] [CrossRef]
36. Lathia JD, Gallagher J, Heddleston JM, Wang J, Eyler CE, MacSwords J, et al. Integrin Alpha 6 regulates glioblastoma stem cells. Cell Stem Cell. 2010;6:421–32. doi:10.1016/j.stem.2010.02.018. [Google Scholar] [PubMed] [CrossRef]
37. Brinckmann J, Hunzelmann N, Kahle B, Rohwedel J, Kramer J, Gibson MA, et al. Enhanced fibrillin-2 expression is a general feature of wound healing and sclerosis: potential alteration of cell attachment and storage of TGF-β. Lab Investig. 2010;90:739–52. doi:10.1038/labinvest.2010.49. [Google Scholar] [PubMed] [CrossRef]
38. Lu Z, Lu Z, Lai Y, Zhou H, Li Z, Cai W, et al. A comprehensive analysis of FBN2 in bladder cancer: a risk factor and the tumour microenvironment influencer. IET Syst Biol. 2023;17:162–73. doi:10.1049/syb2.12067. [Google Scholar] [PubMed] [CrossRef]
39. Mahdizadehi M, Saghaeian Jazi M, Mir SM, Jafari SM. Role of fibrilins in human cancer: a narrative review. Health Sci Rep. 2023;6:e1434. doi:10.1002/hsr2.1434. [Google Scholar] [PubMed] [CrossRef]
40. Nistala H, Lee-Arteaga S, Smaldone S, Siciliano G, Carta L, Ono RN, et al. Fibrillin-1 and -2 differentially modulate endogenous TGF-β and BMP bioavailability during bone formation. J Cell Biol. 2010;190:1107–21. doi:10.1083/jcb.201003089. [Google Scholar] [PubMed] [CrossRef]
41. Van Loon K, Yemelyanenko-Lyalenko J, Margadant C, Griffioen AW, Huijbers EJM. Role of fibrillin-2 in the control of TGF-β activation in tumor angiogenesis and connective tissue disorders. Biochim Biophys Acta Rev Cancer. 2020;1873:188354. doi:10.1016/j.bbcan.2020.188354. [Google Scholar] [PubMed] [CrossRef]
42. Kondo Y, Katsushima K, Ohka F, Natsume A, Shinjo K. Epigenetic dysregulation in glioma. Cancer Sci. 2014;105:363–9. doi:10.1111/cas.12379. [Google Scholar] [PubMed] [CrossRef]
43. Prakash V, Gabrani R. Epigenetic dysregulation in glioblastoma: potential pathways to precision medicine. Neurogenetics. 2024;26:5. doi:10.1007/s10048-024-00793-5. [Google Scholar] [PubMed] [CrossRef]
44. Loukinov DI, Pugacheva E, Vatolin S, Pack SD, Moon H, Chernukhin I, et al. BORIS, a novel male germ-line-specific protein associated with epigenetic reprogramming events, shares the same 11-zinc-finger domain with CTCF, the insulator protein involved in reading imprinting marks in the soma. Proc Natl Acad Sci USA. 2002;99:6806–11. doi:10.1073/pnas.092123699. [Google Scholar] [PubMed] [CrossRef]
45. Martin-Kleiner I. BORIS in human cancers—a review. Eur J Cancer. 2012;48:929–35. doi:10.1016/j.ejca.2011.09.009. [Google Scholar] [PubMed] [CrossRef]
46. Fiorentino FP, Giordano A. The tumor suppressor role of CTCF. J Cell Physiol. 2012;227:479–92. doi:10.1002/jcp.22780. [Google Scholar] [PubMed] [CrossRef]
47. Oreskovic E, Wheeler EC, Mengwasser KE, Fujimura E, Martin TD, Tothova Z, et al. Genetic analysis of cancer drivers reveals cohesin and CTCF as suppressors of PD-L1. Proc Natl Acad Sci USA. 2022;119:e2120540119. doi:10.1073/pnas.2120540119. [Google Scholar] [PubMed] [CrossRef]
48. Segueni J, Noordermeer D. CTCF: a misguided jack-of-all-trades in cancer cells. Comput Struct Biotechnol J. 2022;20:2685–98. doi:10.1016/j.csbj.2022.05.044. [Google Scholar] [PubMed] [CrossRef]
49. Bhan S, Negi SS, Shao C, Glazer CA, Chuang A, Gaykalova DA, et al. BORIS binding to the promoters of cancer testis antigens, MAGEA2, MAGEA3, and MAGEA4, is associated with their transcriptional activation in lung cancer. Clin Cancer Res. 2011;17:4267–76. doi:10.1158/1078-0432.CCR-11-0653. [Google Scholar] [PubMed] [CrossRef]
50. Kosaka-Suzuki N, Suzuki T, Pugacheva EM, Vostrov AA, Morse HC, Loukinov D, et al. Transcription factor BORIS (Brother of the Regulator of Imprinted Sites) directly induces expression of a cancer-testis antigen, TSP50, through regulated binding of BORIS to the promoter. J Biol Chem. 2011;286:27378–88. doi:10.1074/jbc.M111.243576. [Google Scholar] [PubMed] [CrossRef]
51. Moscona R, Janssen SM, Elchebly M, Papadakis AI, Rubin E, Spatz A. BORIS/CTCFL-mediated chromatin accessibility alterations promote a pro-invasive transcriptional signature in melanoma cells. Pigment Cell Melanoma Res. 2023;36:299–313. doi:10.1111/pcmr.13089. [Google Scholar] [PubMed] [CrossRef]
52. Conti L, Crisafulli L, Caldera V, Tortoreto M, Brilli E, Conforti P, et al. REST controls self-renewal and tumorigenic competence of human glioblastoma cells. PLoS One. 2012;7:e38486. doi:10.1371/journal.pone.0038486. [Google Scholar] [PubMed] [CrossRef]
53. Ah-Pine F, Khettab M, Bedoui Y, Slama Y, Daniel M, Doray B, et al. On the origin and development of glioblastoma: multifaceted role of perivascular mesenchymal stromal cells. Acta Neuropathol Commun. 2023;11:104. doi:10.1186/s40478-023-01605-x. [Google Scholar] [PubMed] [CrossRef]
54. Altmann C, Keller S, Schmidt MHH. The role of SVZ stem cells in glioblastoma. Cancers. 2019;11:448. doi:10.3390/cancers11040448. [Google Scholar] [PubMed] [CrossRef]
55. Beiriger J, Habib A, Jovanovich N, Kodavali CV, Edwards L, Amankulor N, et al. The subventricular zone in glioblastoma: genesis, maintenance, and modeling. Front Oncol. 2022;12:790976. doi:10.3389/fonc.2022.790976. [Google Scholar] [PubMed] [CrossRef]
56. Loras A, Gonzalez-Bonet L, Gutierrez-Arroyo J, Martinez-Cadenas C, Marques-Torrejon M. Neural stem cells as potential glioblastoma cells of origin. Life. 2023;13:905. doi:10.3390/life13040905. [Google Scholar] [PubMed] [CrossRef]
57. Sojka C, Wang H-L, Bhatia V, Li TN, Chopra Y, Sing P, et al. Mapping the developmental trajectory of human astrocytes reveals divergence in glioblastoma. Nat Cell Biol. 2025;27:347–59. doi:10.1038/s41556-024-01583-9. [Google Scholar] [PubMed] [CrossRef]
58. Pavlova NN, Zhu J, Thompson CB. The hallmarks of cancer metabolism: still emerging. Cell Metab. 2022;34:355–77. doi:10.1016/j.cmet.2022.01.007. [Google Scholar] [PubMed] [CrossRef]
59. Boccacino JM, dos Santos Peixoto R, de Fernandes CFL, Cangiano G, Sola PR, Coelho BP, et al. Integrated transcriptomics uncovers an enhanced association between the prion protein gene expression and vesicle dynamics signatures in glioblastomas. BMC Cancer. 2024;24:199. doi:10.1186/s12885-024-11914-6. [Google Scholar] [PubMed] [CrossRef]
60. Prado MB, Coelho BP, Iglesia RP, Alves RN, Boccacino JM, Fernandes CFL, et al. Prion protein regulates invasiveness in glioblastoma stem cells. BMC Cancer. 2024;24:1539. doi:10.1186/s12885-024-13285-4. [Google Scholar] [PubMed] [CrossRef]
61. Burgoyne AM, Phillips-Mason PJ, Burden-Gulley SM, Robinson S, Sloan AE, Miller RH, et al. Proteolytic cleavage of protein tyrosine phosphatase μ regulates glioblastoma cell migration. Cancer Res. 2009;69:6960–8. doi:10.1158/0008-5472.CAN-09-0863. [Google Scholar] [PubMed] [CrossRef]
62. Nguyen P, Bar-Sela G, Sun L, Bisht KS, Cui H, Kohn E, et al. BAT3 and SET1A Form a complex with CTCFL/BORIS to modulate H3K4 histone dimethylation and gene expression. Mol Cell Biol. 2008;28:6720–9. doi:10.1128/MCB.00568-08. [Google Scholar] [PubMed] [CrossRef]
63. Liang Y, Han H, Liu L, Duan Y, Yang X, Ma C, et al. CD36 plays a critical role in proliferation, migration and tamoxifen-inhibited growth of ER-positive breast cancer cells. Oncogenesis. 2018;7:98. doi:10.1038/s41389-018-0107-x. [Google Scholar] [PubMed] [CrossRef]
64. Wang J, Li Y. CD36 tango in cancer: signaling pathways and functions. Theranostics. 2019;9:4893–908. doi:10.7150/thno.36037. [Google Scholar] [PubMed] [CrossRef]
65. Yang P, Su C, Luo X, Zeng H, Zhao L, Wei L, et al. Dietary oleic acid-induced CD36 promotes cervical cancer cell growth and metastasis via up-regulation Src/ERK pathway. Cancer Lett. 2018;438:76–85. doi:10.1016/j.canlet.2018.09.006. [Google Scholar] [PubMed] [CrossRef]
66. Nath A, Li I, Roberts LR, Chan C. Elevated free fatty acid uptake via CD36 promotes epithelial-mesenchymal transition in hepatocellular carcinoma. Sci Rep. 2015;5:14752. doi:10.1038/srep14752. [Google Scholar] [PubMed] [CrossRef]
67. Erhart F, Blauensteiner B, Zirkovits G, Printz D, Soukup K, Klingenbrunner S, et al. Gliomasphere marker combinatorics: multidimensional flow cytometry detects CD44+/CD133+/ITGA6+/CD36+ signature. J Cell Mol Med. 2019;23:281–92. doi:10.1111/jcmm.13927. [Google Scholar] [PubMed] [CrossRef]
68. Ruan C, Meng Y, Song H. CD36: an emerging therapeutic target for cancer and its molecular mechanisms. J Cancer Res Clin Oncol. 2022;148:1551–8. doi:10.1007/s00432-022-03957-8. [Google Scholar] [PubMed] [CrossRef]
69. Jiang M, Karsenberg R, Bianchi F, Van den Bogaart G. CD36 as a double-edged sword in cancer. Immunol Lett. 2024;265:7–15. doi:10.1016/j.imlet.2023.12.002. [Google Scholar] [PubMed] [CrossRef]
70. Hong Q, Li R, Zhang Y, Gu K. Fibrillin 2 gene knockdown inhibits invasion and migration of lung cancer cells. Cell Mol Biol. 2020;66:190–6. doi:10.14715/cmb/2020.66.7.29. [Google Scholar] [CrossRef]
71. Rosa-Garrido M, Ceballos L, Alonso-Lecue P, Abraira C, Delgado MD, Gandarillas A. A cell cycle role for the epigenetic factor CTCF-L/BORIS. PLoS One. 2012;7:e39371. doi:10.1371/journal.pone.0039371. [Google Scholar] [PubMed] [CrossRef]
72. Rao GK, Makani VKK, Mendonza JJ, Edathara PM, Patel N, Ramakrishna M, et al. Downregulation of BORIS/CTCFL leads to ROS-dependent cellular senescence and drug sensitivity in MYCN-amplified neuroblastoma. FEBS J. 2022;289:2915–34. doi:10.1111/febs.16309. [Google Scholar] [PubMed] [CrossRef]
Cite This Article
 Copyright © 2026 The Author(s). Published by Tech Science Press.
This work is licensed under a Creative Commons Attribution 4.0 International License , which permits unrestricted use, distribution, and reproduction in any medium, provided the original work is properly cited.
 Downloads
 Citation Tools