
 Submit a Paper
 Propose a Special lssue
 Open Access
ARTICLE
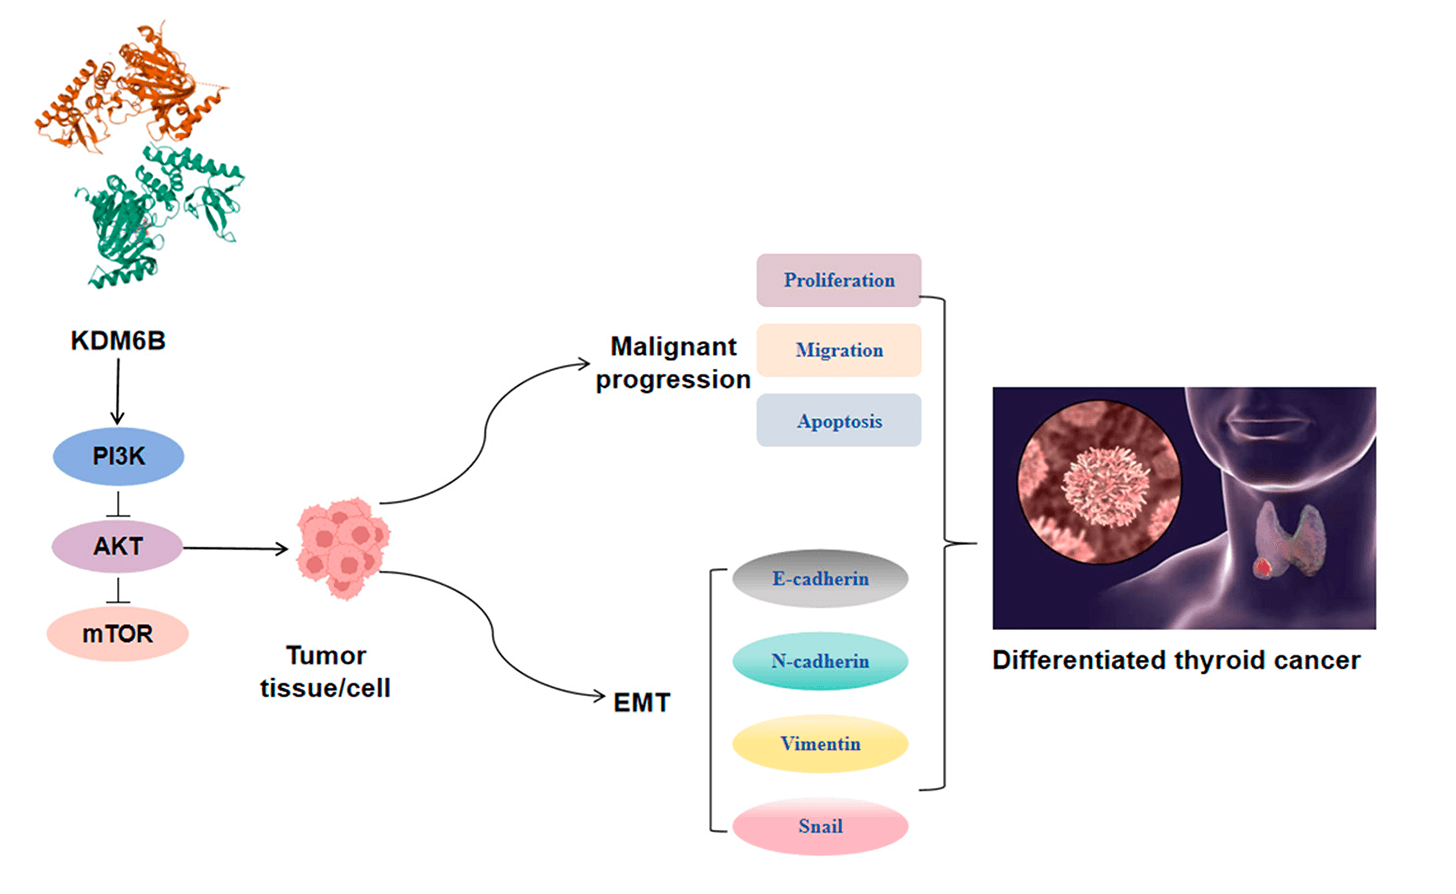
KDM6B Regulates the Tumor Microenvironment and Promotes EMT via the PI3K/AKT/mTOR Signaling in Differentiated Thyroid Cancer
General Surgery II (thyroid), The Fifth Clinical Medical College of Henan University of Chinese Medicine (Zhengzhou People’s Hospital), Zhengzhou, China
* Corresponding Author: Jiangtao Yu. Email:
BIOCELL 2026, 50(4), 9 https://doi.org/10.32604/biocell.2026.073331
Received 16 September 2025; Accepted 16 January 2026; Issue published 21 April 2026
 View Full Text
 Download PDF
Abstract
Objectives: The tumor microenvironment and epithelial-mesenchymal transition (EMT) are closely linked to the progression of differentiated thyroid cancer (DTC). However, the functional mechanisms of lysine-specific demethylase 6B (KDM6B) in carcinogenesis remain incompletely understood. This study aims to clarify whether KDM6B affects DTC progression and EMT through the phosphatidylinositol 3-kinase/protein kinase B/mammalian target of the rapamycin (PI3K/AKT/mTOR) pathway, providing a potential target for clinical treatment of DTC. Methods: Tissue samples from DTC patients (n = 39) were collected, and KDM6B expression was determined through Reverse Transcription-Polymerase Chain Reaction (RT-PCR) and Western blot. Cell counting kit-8 assay, 5-Ethynyl-2′-deoxyuridine staining, Transwell, Scratch-Wound, and other experiments were used to detect cell biological behavior; flow cytometry and enzyme-linked immunosorbent assay were used to investigate its effect on macrophage polarization. A subcutaneous tumor model was constructed in mice, and immunohistochemistry was used to detect nuclear proliferation antigen Ki-67, and a Western blot was used to validate protein expression. Results: KDM6B level was elevated in DTC tissues and cells compared to normal ones. Knocking down KDM6B inhibited DTC cell proliferation, reduced migratory and invasive capabilities, suppressed M2 macrophage polarization and EMT processes, while overexpression of KDM6B promoted the aforementioned biological behaviors. Knocking down KDM6B blocked the PI3K/AKT/mTOR pathway, while overexpression of KDM6B activated this pathway. PI3K agonists weakened the inhibitory impact of KDM6B knockdown on malignant biological characteristics; the opposite was true for PI3K inhibitors. Additionally, knocking down KDM6B inhibited tumor growth, decreased the Ki67 positivity rate, and inhibited the EMT process and M2 macrophage polarization in mice. Conclusion: KDM6B regulates the tumor microenvironment and EMT process via PI3K/AKT/mTOR pathway, thereby influencing DTC progression.Graphic Abstract
Keywords
Supplementary Material
Supplementary Material FileA malignant tumor arising from thyroid follicular or parafollicular epithelial cells, thyroid cancer represents the most frequently occurring cancerous growth in the head and neck and endocrine system [1]. Its incidence has shown an increasing trend worldwide over the past several decades [2,3]. According to the 2025 American Cancer Society (ACS) projection data, there are 44,020 new thyroid cancer diagnoses and 2290 related fatalities [4]. Up to 90% of thyroid cases are differentiated thyroid cancer (DTC) [5]. DTC usually progresses slowly, but has a strong tendency to lymph node metastasis, with an incidence of approximately 40% to 70% in patients, which leads to a poor prognosis [6]. In terms of pathological mechanism, the malignant progression of DTC is closely associated with epithelial-mesenchymal transition (EMT) [7,8]. Additionally, the tumor microenvironment (TME) plays a key role in DTC progression. M2-type tumor-associated macrophages (TAMs) promote the establishment of an immunosuppressive microenvironment, and the degree of infiltration is significantly related to tumor invasiveness and poor prognosis [9,10]. Thus, it is crucial to find prognostic markers that can regulate the polarization and EMT of M2 TAMs in DTC.
Lysine demethylase 6B (KDM6B) takes part in biological processes, including cell differentiation and inflammatory response, through its regulation of epigenetic changes at target gene promoters [11,12]. In cancer research, KDM6B exhibits a dual role. It facilitates cancer cell proliferation by inducing demethylation of H3K27me3 in gastric cancer, and its high level in patient tumor tissues indicates poor prognosis [13]. In breast cancer, KDM6B hindered the proliferation and metastasis of cancer cells via the Wnt/β-catenin pathway [14]. Recent studies have found that KDM6B can bind to TFEB in thyroid cancer, thereby regulating autophagy and promoting malignant progression of tumors [15]. Notably, elevated KDM6B expression correlates with diminished overall survival for patients suffering from thyroid cancer [16]. Additionally, knockout of KDM6B in macrophages or treatment of macrophages with KDM6B inhibitors can inhibit M2 polarization-related gene expression, which suggests that KDM6B plays a vital role in M2 macrophage polarization [17]. Nevertheless, whether KDM6B modulates M2 macrophage infiltration in the DTC TME and the specific function of KDM6B in DTC progression remains unclear.
Serving as a pivotal regulatory center for cell growth, viability, and metabolism, the PI3K/AKT/mTOR pathway exhibits common aberrant activation in thyroid, liver, and breast cancer, among others [18–20]. Activating the PI3K/AKT/mTOR pathway can boost Snail, Slug, Vimentin, and N-cadherin expression, which is strongly associated with the EMT process in thyroid cancer [21]. Additionally, activating the PI3K/AKT/mTOR pathway also regulated the recruitment of TAMs in thyroid cancer and promoted M2 polarization, forming a pro-cancer microenvironment [22]. These studies indicate a potentially significant involvement of the PI3K/AKT/mTOR pathway in the EMT process of DTC cells and the establishment of a tumor-promoting microenvironment.
Therefore, we hypothesize that KDM6B activates the PI3K/AKT/mTOR pathway to drive EMT and macrophage polarization in DTC. In this study, we investigate whether KDM6B could affect the M2 polarization of TAMs and the EMT process of DTC cells by regulating the PI3K/AKT/mTOR pathway, thereby promoting the malignant progression of DTC. This research aims to provide a theoretical foundation for developing targeted therapy strategies for DTC.
2.1 Clinical Sample Collection
39 DTC tissue samples and corresponding paracancerous tissue samples surgically resected by the Fifth Clinical Medical College of Henan University of Chinese Medicine (Zhengzhou People’s Hospital) were collected and stored in liquid nitrogen after cleaning. Detailed information on these patients is provided in Supplementary Table S1. Inclusion criteria: initial diagnosis and no preoperative radiotherapy, chemotherapy, or targeted therapy; postoperative pathologically confirmed diagnosis of DTC; possession of complete clinicopathological data; frozen or paraffin-embedded cancer tissue and paired paracancerous tissue samples were of good quality. Exclusion criteria: preoperative treatment for any thyroid tumor; pathologic diagnosis of medullary thyroid carcinoma, undifferentiated carcinoma, or other tumor of non-epithelial origin; incomplete clinical or pathological data; presence of tumor cell infiltration or significant atypical hyperplasia in paired paracancerous tissues confirmed by pathological review. Paired paracancerous tissues were obtained from normal thyroid tissues that were ≥2 cm from the margins of the primary tumors as viewed by the naked eye and were pathologically reviewed to confirm that they were normal tissues without any infiltration of tumor cells, heterogeneous hyperplasia, lymphocytic thyroiditis, or other notable pathologic changes. All enrolled patients were clinically diagnosed as DTC before surgery, and had not received any form of systemic anti-tumor therapy before inclusion in this study. At the same time, all included patients or their families have been fully informed and signed informed consent. This research was approved by The Fifth Clinical Medical College of Henan University of Chinese Medicine (Zhengzhou People’s Hospital) Ethics Committee (No. 2023011111), and all experimental procedures were strictly followed by the Declaration of Helsinki.
Kaplan-Meier (https://kmplot.com/analysis/) was employed to examine the association between KDM6B level and the prognosis of DTC patients. The data were obtained from the Kaplan-Meier Plotter online tool. A total of 502 cases of thyroid cancer were included in the cohort (with complete expression profiles and survival information). Using the tool “automatically select the optimal cut-off value”, the samples were divided into KDM6B high/low expression groups; the survival endpoint was overall survival (defined as the time from diagnosis to death). Survival curves were plotted, and differences in survival between high/low expression groups were compared by the log-rank test.
Additionally, the correlation between KDM6B level and the infiltration degree of M2 TAMs in the THCA dataset was analyzed by the Tumor Immune Estimation Resource (TIMER) 2.0 online database (https://compbio.cn/timer2/).
2.3 Reverse Transcription-Polymerase Chain Reaction (RT-PCR)
The DTC tissue samples and adjacent tissue samples (50 mg/sample) were cut into small pieces using ophthalmic scissors, and 300 μL of Trizol reagent (15596018CN, Invitrogen, Carlsbad, CA, USA) was added to lyse the tissues at 4°C for 10 min to extract total RNA. RNA concentration and purity were detected using the NanoDrop One micro spectrophotometer (840-317400, Thermo Fisher Scientific, Waltham, MA, USA). Next, AMV reverse transcriptase (B600020, Sangon Biotech Co., Ltd., Shanghai, China) was employed to carry out the reverse transcription reaction. The reaction system was set as follows: the total volume was 20 μL, including 1 μg of RNA template, 5 μL of 5× AMV reaction buffer, 2.5 μL of dNTP mixture, 1 μL of AMV reverse transcriptase (30 U/μL), 1 μL of RNase inhibitor (40 U/μL), and the remaining volume was supplemented with RNase-free water. The synthesized cDNA was diluted at a ratio of 1:10 with RNase-free water and used as the template for subsequent PCR amplification. Subsequently, the amplification was conducted in accordance with the TB Green FAST qPCR Kit (CN830S, TAKARA, Tokyo, Japan) instructions and utilizing the RT-PCR system (PRISM 7300, ABI, Carlsbad, CA, USA). The total volume of the qPCR reaction system was 20 μL, consisting of 10 μL of 2× TB Green FAST qPCR Mix, 0.4 μL of upstream primer (10 μmol/L), 0.4 μL of downstream primer (10 μmol/L), 2 μL of the diluted cDNA template, and 7.2 μL of RNase-free water. The primer annealing temperature is 59°C, and the cycle is 40 times [23]. Using the 2−ΔΔCt method, the relative expression of the target gene was calculated, with β-actin serving as the internal reference gene. The adjacent tissues were used as the control group (n = 39).
The primer sequences were: KDM6B: F: 5′-GGCAGTGGAGGTACGAAT-3′; R: 5′-TCCTGCAGCAA TGAGAGCTT-3′. β-actin: F: 5′-ACCTTCTACAATGAGCTGCG-3′; R: 5′-CCTGGATAGCAACGTACA TGG-3′.
2.4 Cell Culture and Processing
Human thyroid normal cells (Nthy-ori 3-1, CL-0817), DTC cells FTC-133 (CL-0644), B-CPAP (CL-0575), and monocytic leukemia cells THP-1 (CL-0233) were obtained from Wuhan Pricella Biotechnology (Hubei, China) and were free from mycoplasma contamination. The DTC cell line TPC-1 (SNL-231) was derived from Wuhan Sunncell Biotechnology (Hubei, China) and was free from mycoplasma contamination. Nthy-ori 3-1, FTC-133, B-CPAP, and TPC-1 cells were placed in sterile culture flasks and maintained in complete medium, which consisted of 10% fetal bovine serum (164220, Wuhan Pricella Biotechnology) and 90% RPMI-1640 (containing Penicillin-Streptomycin, PM150110A, Wuhan Pricella Biotechnology). THP-1 cells were maintained in THP-1 special medium (CM-0233, Wuhan Pricella Biotechnology). The culture temperature was 37°C, and the culture environment contained 5% CO2.
Green fluorescent protein (GFP)-labeled KDM6B small interfering RNA (si-KDM6B: 5′-GAGCAACUCCUGUACUGUA-3′), KDM6B overexpression plasmid (oe-KDM6B, 5′-GAGAGAGCA GAGTTCAGAGG-3′), and the corresponding control (si-NC: 5′-AAACGTGACACGTTCGG AGAA-3′, oe-NC: 5′-GUGCACGAAGGCUCAUCAUU-3′) were synthesized by Sangon Biotech Co., Ltd. Following the instructions provided with Lipofectamine 3000 (L3000001, Invitrogen), 2 μg of plasmid DNA per well was mixed with 4 μL of P3000 reagent (included in the kit) in 125 μL of Opti-MEM medium (51985091, Invitrogen); separately, 4 μL of Lipofectamine 3000 was diluted in 125 μL of Opti-MEM medium. The two mixtures were gently combined and incubated at room temperature for 15 min to form stable DNA-Lipofectamine 3000 complexes (DNA: L3000 ratio = 1 μg:2 μL), and these plasmids were transfected into TPC-1 cells (70%–80% confluency) for 48 h in 12-well plates at 37°C, with 5% CO2. The proportion of GFP-positive cells was observed by DM3000 fluorescence microscope (Leica, Heidelberg, Germany), and the transfection efficiency was preliminarily evaluated using ImageJ 1.54 h software (National Institute of Mental Health, Bethesda, MD, USA). In addition, for si-KDM6B+740Y-P and si-KDM6B+LY294002 groups, si-KDM6B was transfected into TPC-1 cells, and then cells were exposed to PI3K/AKT pathway agonist 740Y-P (30 μg/mL, HY-P0175, MedChemExpress, Monmouth Junction, NJ, USA) or inhibitor LY294002 (20 μm, HY-10108, MedChemExpress) for 24h [24,25].
2.5 Cell Counting Kit-8 (CCK-8) Assay
TPC-1 cells were inoculated into 96-well cell culture plates with 1 × 10⁴ cells (100 μL) per well. When the cells were fully adherent, 740Y-P or LY294002 was introduced, and continued to be cultured for 24 h. After that, 100 μL of CCK-8 reagent (10%, HY-K0301, MedChemExpress) was introduced, fully mixed, and incubated for 2 h in the dark at 37°C, with 5% CO2. Subsequently, the OD450 value was examined using a microplate reader (1410101, Thermo Fisher Scientific). Relative cell viability (%) = (OD450 value of experimental group/OD450 value of control group) × 100%.
2.6 Detection of Macrophage Polarization Markers
THP-1 cells were seeded in 12-well plates (1 × 10⁶ cells/well) and cultured overnight. Subsequently, exposed to PMA (100 ng/mL, HY-18739, MedChemExpress) for 24 h and induced into M0 macrophages [26]. Subsequently, M0 macrophages were treated with interleukin (IL)-4 (20 ng/mL, GMP-L04H26, Acrobiosystems Co., Ltd., Beijing, China) and IL-13 (20 ng/mL, IL3-H52H3, Acrobiosystems Co., Ltd.) for 48 h to induce M2 macrophages, and the supernatant was collected by centrifugation as conditioned medium for M2 macrophages. A Transwell chamber was used for co-culture experiments; M2 macrophages were placed in the upper chamber, while TPC-1 cells were in the lower chamber, and co-cultured in 500 μL RPMI-1640 (containing 10% fetal bovine serum and 1% Penicillin-Streptomycin) at 37°C for 48 h. Next, M2 macrophages were processed to form a single cell suspension (1.0 × 10⁷/mL). CD68 antibody (0.5 μg, 12-0689-42, Invitrogen), CD163 antibody (0.25 μg, 12-1631-82, Invitrogen), or CD206 antibody (0.125 μg, 12-2061-82, Invitrogen) was introduced to the above cell suspension, mixed thoroughly, and subsequently incubated for half an hour at 4°C in a dark environment. All staining reactions were performed in phosphate buffer saline (PBS). Following incubation, the proportions of CD68, CD206, and CD163 positive cells were detected in a BD FACSCalibur™ flow cytometer (BD biosciences, San Jose, CA, USA), with subsequent analysis conducted through FlowJo software (v10.8, BD biosciences).
2.7 5-Ethynyl-2′-Deoxyuridine (EdU) Staining
EdU can be incorporated into newly synthesized DNA during S phase, and the count of EdU positive cells can reflect the proliferation of cells [27]. TPC-1 cells were seeded in a 6-well plate (1 × 10⁶ cells/well, built-in sterile coverslip) and cultured overnight. Subsequently, cells were gently washed twice with PBS and exposed to EdU working solution (10 μm, C0071S, Beyotime, Shanghai, China) and maintained in the dark for 2 h. Subsequently, it was exposed to 4% paraformaldehyde (HY-Y0333, MedChemExpress) for 15 min, then covered with 0.3% Triton X-100 (T824275, Macklin, Shanghai, China) for 10 min. The 500 μL Click reaction solution (containing 430 μL Click Reaction Buffer + 20 μL CuSO4 + 1 μL Azide 488+ 50 μL Click Additive Solution) was prepared and incubated with the cells for 30 min in a dark environment. The cells were mounted using AntiFade mounting medium (including DAPI, HY-K1047, MedChemExpress) and observed using a DM3000 fluorescence microscope (Leica). EdU positive rate = number of EdU positive cells (red and blue dual fluorescent)/total number of cells (blue fluorescent) × 100%.
The Matrigel gel (C0383, Beyotime) was diluted with serum-free medium (Matrigel gel:medium = 1:10, v/v), and 60 μL of the mixed medium was introduced to the transwell chamber and cultured for 3 h. After removing any unsolidified medium, 100 μL serum-free medium was added for hydration for 30 min. Subsequently, 600 μL complete medium was placed in 24-well plates, while TPC-1 cell suspension (100 μL, 2 × 10⁵ cells/mL) was introduced to a Transwell chamber pre-coated with Matrigel, and cultured at 37°C for 48 h, with 5% CO2. The chambers were fixed in paraformaldehyde for 30 min, unmigrated cells were gently wiped away using a cotton swab, dyed with 0.1% crystal violet (C916088, Macklin) for 20 min, and then viewed using a CX33 optical microscope (Olympus, Tokyo, Japan) [28].
TPC-1 cells were plated in a 6-well plate (2 × 10⁵ cells/mL). When the cell density grew to more than 90%, a 20 μL pipette tip was employed to make a straight scratch across the cell monolayer. The dislodged cells and cell debris generated during the scratch process were removed by washing three times with PBS solution. Then, serum-free RPMI-1640 medium (PM150110A, Wuhan Pricella Biotechnology) was added. After 48 h of culture, images were taken using a CX33 optical microscope, and ImageJ 1.54 h software was used to collect and analyze the data of cell migration distance. Migration Rate (%) = [(Initial scratch width at 0 h-Remaining scratch width at 48 h)/Initial scratch width at 0 h] × 100% [29].
After different treatments, the TPC-1 cell (2 × 10⁶ cells) precipitate was collected by centrifugation, then mixed with 1× g Binding Buffer (500 μL, A709121, Macklin), 5 μL Annexin-V-FITC (final concentration: 10 μg/mL), and 5 μL Propidium Iodide (PI, ST511, Beyotime, final concentration: 10 μg/mL) in turn. After fully mixing, they were incubated for 15 min at 25°C in a dark environment. The fluorescence signals were measured by BD FACSCalibur™ flow cytometry and analyzed by FlowJo software (v10.8, BD biosciences) to calculate the apoptosis rate.
2.11 Mouse Subcutaneous Graft Tumor Model
Twenty-four female C57BL/6 mice (4–5 weeks old, 15–18 g) were obtained from Vitalriver (Beijing, China) and raised in a constant temperature environment of 22°C, with humidity maintained at 45%–50%, 12 h/12 h light-dark cycle, and supplied with sufficient food and water. The animal experimental protocol of this study has been approved by The Fifth Clinical Medical College of Henan University of Chinese Medicine (Zhengzhou People’s Hospital) Ethics Committee (Approval No.: 2023011111 [02]), and all operations strictly followed the “Guidelines for Ethical Review of Laboratory Animal Welfare” to ensure animal welfare and the requirements of the ARRIVE Essential 10 guidelines to maximize the protection of animal welfare. After a week of acclimatization feeding, the mice were randomly separated into si-NC, si-KDM6B, si-KDM6B+740Y-P, si-KDM6B+LY294002 groups (n = 6) according to the random number table method [30,31]. After TPC-1 cells were mixed with matrigel (10:1, v/v), 100 μL si-NC-transfected TPC-1 cells (1 × 10⁷) were subcutaneously injected into the right armpit of the mice in the si-NC group, and the mice in the other groups were subcutaneously injected with si-KDM6B-transfected TPC-1 cells (1 × 10⁷). One week later, mice in the si-KDM6B+740Y-P group were intraperitoneally injected with 740Y-P (20 mg/kg/d) [32], and mice in the si-KDM6B + LY294002 group were intraperitoneally injected with LY294002 (30 mg/kg/d) [33]. In contrast, the si-NC and si-KDM6B groups were intraperitoneally injected with the same volume of normal saline. The tumor growth was observed weekly, with tumor size measured and recorded using a vernier caliper to establish a tumor growth curve, and tumor volume was calculated according to the formula: V (mm3) = length × width2 × 0.5. After 4 weeks, the mice were anesthetized by intraperitoneal injection of pentobarbital sodium (60 mg/kg) and then humanely sacrificed using cervical dislocation. The tumor tissue was completely removed with tissue scissors and then weighed. To minimize bias, a double-blind approach was adopted. All the researchers involved in animal breeding, model construction, behavioral assessment, and pathological section staining were unaware of the grouping situation.
The mouse tumor tissue was immersed in 4% paraformaldehyde for 24h, followed by dehydration with 100%, 95%, 75% and 50% gradient ethanol in turn. After embedding in paraffin, the tumor tissue was prepared into 4 μm sections. Subsequently, the slices were dewaxed in xylene (X821391, Macklin), hydrated with gradient ethanol. For antigen retrieval, the sections were fully immersed in 0.01 M citrate buffer (pH 6.0) and placed in a microwave oven, heated for 8 min at medium-high temperature (700 W), 7 min at cease-fire, and 7 min at medium-low temperature (400 W). The sections were immersed in 3% H2O2 solution for half an hour, then rinsed with PBS. They were subsequently covered evenly with bovine serum albumin (BSA, 5%, A801320, Macklin) for 30 min and then exposed to Ki67 primary antibody (PA1-38032, 1:100, Invitrogen) at 37°C for 1.5h. After that, incubated with goat anti-rabbit IgG (31460, 1:500, Invitrogen) for 20 min at 25°C. DAB (P0203, Beyotime) was used for the color reaction for 10 min at 25°C. Re-stained using Hematoxylin (C0107, Beyotime), rinsed with distilled water, mounted using Neutral Balsam (C0173, Beyotime), dried, and observed using a CX33 optical microscope.
After dewaxing, hydration, and antigen repair, 0.3% Triton X-100 was applied to the paraffin section of mouse tumor tissue for 10 min at 25°C. Following the addition of 5% BSA for 60 min of closure at 25°C, primary antibodies CD206 (MA5-32498, 1:100, Invitrogen) or CD86 (MA5-30196, 1:50, Invitrogen) were introduced to the slices and incubated at 4°C overnight. On the second day, sections were exposed to goat anti-rabbit secondary IgG (F-2765, 1:100, Invitrogen) in darkness for 1.5 h at 37°C, sealed with AntiFade Mounting Medium, and the development was observed under a CX33 optical microscope. Fluorescence intensity was quantified using ImageJ 1.54 h software.
For TPC-1 cells, they were inoculated in a 12-well plate (coverslips were placed in the plate) for 24 h at 37°C to make cell climbing slices, then exposed to 4% paraformaldehyde for half an hour. After incubation with 0.3% Triton X-100 at 25°C for 10 min, they were blocked with 5% BSA for 1 h at 25°C, and then incubated with E-cadherin (PA5-32178, 1:100, Invitrogen) at 4°C overnight. The rest of the operation was consistent with the fluorescence staining steps of tumor tissue sections. Images were observed with a CX33 optical microscope, and fluorescence intensity was quantified using ImageJ 1.54 h software.
2.14 Enzyme-Linked Immunosorbent Assay (ELISA)
To evaluate the levels of cytokines in TPC-1 cells and mouse tumor tissues, human tumor necrosis factor-α (TNF-α, ml077385), IL-6 (ml058097), IL-10 (ml064299), and Chemokine C-C motif ligand 18 (CCL18, ml058388) ELISA Kit were utilized. These kits were sourced from Enzyme-linked Biotechnology Co., Ltd. (Shanghai, China). Different concentrations of the standard and the supernatant of mouse tumor tissue homogenate or TPC-1 cell culture supernatant were introduced to the ELISA plate, mixed well, and incubated at 37°C for 1.5 h. Following rinsing with washing buffer for 3 times, the corresponding antibody working solution was introduced and reacted at 37°C for 1 h. HRP-labeled Streptavidin working solution was introduced and left to incubate for 30 min. Following washes with washing buffer, color reagent A and color reagent B were introduced, and incubated for 15 min, and then the termination liquid was added and mixed thoroughly, and immediately measured the OD450 value using a microplate reader (1410101, Thermo Fisher Scientific). The concentration of the standard was taken as the horizontal coordinate, and the OD450 value as the vertical coordinate, and a smooth line was used to connect the coordinate points of each standard in order to draw the standard curve. The corresponding concentration of the sample was calculated from the absorbance value of the sample and the standard curve.
After the mouse tumor tissue was cut into pieces, RIPA lysis buffer (P0013B, Beyotime) was introduced and fully ground to break the cells, then centrifuged at 4°C for 10 min (12,000× g). For TPC-1 cells, they were also lysed with RIPA lysis buffer. After lysis, the protein content of the sample was detected by the BCA protein quantification kit (B917925, Macklin). Subsequently, the proteins were separated using 10% SDS-PAGE electrophoresis, and then transferred onto a PVDF membrane (88518, Invitrogen) and blocked using 5% BSA for 2 h at 25°C. Following the membrane washing, it was placed in a 4°C environment overnight with primary antibodies E-cadherin (PA5-32178, 1:500) [34], Vimentin (PA5-27231, 1:5000) [35], N-cadherin (PA5-19486, 1:100) [36], Snail (MA5-14801, 1:1000) [37], KDM6B (PA5-72751, 1:2000) [38], p-PI3K (PA5-17387, 1:1000) [39], PI3K (710400, 1:2000) [40], p-AKT (710122,1:2000) [41], AKT (PA5-29169, 1:1000) [42], p-mTOR (44-1125G, 1:1000) [43], or mTOR (PA5-34663, 1:3000) [44]. On the second day, following three membrane washes, it was exposed to goat anti-rabbit IgG (31,460, 1:10,000) [45] for 2 h at 25°C. These antibodies were purchased from Invitrogen. The ECL working solution (HY-K1005, MedChemExpress) was prepared and uniformly dropped on the membrane and incubated for 2 min at 25°C, and scanned using an iBright CL1500 gel imaging system (Invitrogen). Gray value analysis was conducted using ImageJ software (1.54 h, National Institute of Mental Health), and the ratio of gray value to β-actin (PA1-16889,1:2000, Invitrogen) representing the relative level of each protein. Specific analysis steps: Select the target bands with the “rectangular selection” tool; Run Analyze → Gels → Select First Lane to sequentially identify lanes and generate lane profiles, then plot gray value peak graphs via Analyze → Gels → Plot Lanes; Draw a baseline under the peak graphs using the “line” tool, and click each peak with the “wand” tool to automatically calculate the integrated optical density (IOD) value (Area) of each band; Measure the background gray value in the band-free area adjacent to the target band (either above, below, or beside it) using a rectangular selection of the same size, and subtract this background value from the target band’s IOD value.
Each experiment was repeated a minimum of three times independently, with outcomes displayed presented as mean ± standard deviation. Statistical analysis was performed using SPSS26.0 software (IBM SPSS Statistics, Armonk, NY, USA), and Prism software 9.0 (GraphPad Software, Inc., San Diego, CA, USA) was performed for drawing. For intergroup comparisons, an unpaired Student’s t-test was applied to compare means between two independent samples. The data were initially analyzed for normality using the Shapiro-Wilk test and for homogeneity of variance via Levene’s test. In cases of heterogeneous variances, an approximate t-test was performed instead. One-way ANOVA was utilized for comparing means across multiple groups. When variances were homogeneous, multiple comparisons between groups were carried out with Tukey’s test, Dunnett’s T3 test was used when variances were heterogeneous. p < 0.05 indicated a significant difference.
3.1 The Expression of KDM6B Was up-Regulated in DTC
RT-PCR was utilized to assess clinical samples, and KDM6B gene expression was notably elevated in tumor tissues of 39 DTC patients, while the expression level was maintained at a low level in normal tissues (Fig. 1A). KDM6B protein level was further detected by WB, and KDM6B protein level was also markedly up-regulated in tumor tissues (Fig. 1B,C). Moreover, the KDM6B protein level in DTC cell lines (including FTC-133, B-CPAP, and TPC-1) was greater than in normal thyroid cells (Fig. 1D,E). Additionally, DTC patients with higher KDM6B levels experienced a poorer survival outcome as demonstrated by Kaplan-Meier analysis (Fig. 1F). Among the above DTC cell lines, TPC-1 cells exhibited the highest KDM6B protein level in TPC-1 cells. Therefore, we selected the TPC-1 cell to carry out KDM6B knockdown and overexpression experiments to explore the impact of KDM6B expression on the malignant progression of DTC.

Figure 1: The expression of lysine-specific demethylase 6B (KDM6B) was up-regulated in differentiated thyroid cancer (DTC). (A) Reverse Transcription-Polymerase Chain Reaction (RT-PCR) confirmed that KDM6B exhibited elevated expression in tumor tissues of DTC patients (n = 39). (B,C) Western blot (WB) revealed that the KDM6B protein was higher in tumor tissues of DTC patients (n = 39). (D,E) WB measured higher expression of KDM6B protein in DTC cell lines (FTC-133, B-CPAP, TPC-1) than in normal thyroid cells (n = 3). (F) Kaplan-Meier curves indicated poorer survival in DTC patients with high KDM6B expression. p < 0.05 indicated a significant difference.
3.2 Knockdown of KDM6B Hindered the Proliferation of DTC Cells and Promoted Their Apoptosis
After transfection with si-NC/si-KDM6B or oe-NC/oe-KDM6B in TPC-1 cells, the percentage of GFP-positive cells was observed via fluorescence microscopy. The results showed that GFP green fluorescent cells accounted for more than 80% of the field of vision, which indicated that the transfection was successful (Fig. 2A,B). Subsequently, WB demonstrated that the relative expression level of KDM6B protein in TPC-1 cells was reduced by 54% after transfection with si-KDM6B, while the relative expression level of KDM6B protein was increased by 87% after transfection with oe-KDM6B. (Fig. 2C,D). CCK-8 assay showed that knockdown of si-KDM6B caused a decrease in the viability of TPC-1 cells, and the transfection of oe-KDM6B resulted in an increase in cell viability (Fig. 2E). EdU staining indicated that knockdown of KDM6B declined EdU positive cells, while overexpression of KDM6B elevated EdU positive cells (Fig. 2F,G). Transwell invasion assay revealed that knockdown of KDM6B caused a marked reduction in invasive cells, while overexpression of KDM6B caused an increase in invasive cell count (Fig. 2H,I). Scratch assay indicated that knockdown of KDM6B reduced migration rate, and overexpression of KDM6B led to a marked increase in migration rate (Fig. 2J,K). In addition, knockdown of KDM6B increased the apoptosis rate as demonstrated by flow cytometry, while overexpression of KDM6B decreased the apoptosis rate (Fig. 2L,M). The above experimental findings indicate a regulatory role for KDM6B in the malignant biological behaviors of TPC-1 cells.

Figure 2: Knockdown of KDM6B hindered the proliferation and promoted the apoptosis of DTC cells. (A,B) To assess the transfection of cells, the proportion of GFP-positive cells was observed using a fluorescence microscope (20×, 100 μm). (C,D) WB measured the down-regulation of KDM6B expression after transfection with si-KDM6B, and transfection with oe-KDM6B resulted in up-regulation of KDM6B expression. (E) CCK-8 assay measured a decrease in cell viability after transfection with si-KDM6B, and transfection with oe-KDM6B resulted in an increase in cell viability. (F,G) EdU staining revealed that KDM6B knockdown decreased cellular EdU positivity, and overexpression of KDM6B resulted in increased EdU positivity (40×, 50 μm). (H,I) Transwell assay revealed that KDM6B knockdown declined invasive cells and overexpression of KDM6B increased invasive cells (20×, 100 μm). (J,K) Cell scratch assay confirmed that KDM6B knockdown diminished cell migration and overexpression of KDM6B increased cell migration (10×, 200 μm). (L,M) Flow cytometry verified that KDM6B knockdown caused increased apoptosis, whereas KDM6B overexpression decreased apoptosis. n = 3, p < 0.05 indicated a significant difference.
3.3 Knockdown of KDM6B Can Improve M2 Macrophage Polarization and Inhibit EMT in DTC Cells
Then, through the Cancer Genome Atlas (TCGA) database, there was a positive correlation between KDM6B level and the infiltration degree of M2-type TAMs in DTC tumor tissues (Fig. 3A). THP-1 cells underwent a 24-h PMA treatment, and the phenotypic changes of macrophages were assessed through flow cytometry. The proportion of CD68 positive cells was markedly elevated after PMA treatment, indicating that M0 macrophages were successfully induced (Fig. 3B,C). After co-culturing with TPC-1 cells that knockdown of KDM6B for 48 h, the proportion of CD206-positive macrophages decreased, while overexpression of KDM6B increased the proportion of CD206-positive cells, indicating that knockdown of KDM6B inhibited the polarization of macrophages towards the M2 phenotype (Fig. 3D,E). ELISA revealed that knockdown of KDM6B caused a significant increase in IL-6 levels and a decline in IL-10 and CCL18 levels in co-cultured supernatant, while KDM6B overexpression showed the opposite trend (Fig. 3F–H). In addition, immunofluorescence indicated that knockdown of KDM6B notably increased E-cadherin level in TPC-1 cells, whereas KDM6B overexpression decreased the fluorescence intensity of E-cadherin (Fig. 3I,J). WB results further confirmed that knockdown of KDM6B up-regulated E-cadherin, and declined N-cadherin, Vimentin, and Snail levels in TPC-1 cells. KDM6B overexpression caused opposite changes in the above protein levels (Fig. 3K–M). These findings indicate that KDM6B might affect the malignant progression of DTC through regulating M2 macrophages polarization and EMT-related molecules expression.

Figure 3: Knockdown of KDM6B improved M2-type macrophage polarization and inhibited EMT in DTC cells. (A) The Cancer Genome Atlas (TCGA) database indicated a direct relationship between the expression of KDM6B and the extent of M2-type TAM infiltration in DTC tumor tissues. (B,C) Elevated expression of CD68 was measured by flow cytometry in the THP-1+PMA group of cells. (D,E) Knockdown of KDM6B decreased CD206 expression as measured by flow cytometry, whereas overexpression of KDM6B caused an elevated number of CD206-positive cells. (F–H) ELISA results showed that knockdown of KDM6B increased IL-6 levels and decreased IL-10 and CCL18 levels, whereas overexpression of KDM6B did the opposite. (I,J) Immunofluorescence measured that KDM6B knockdown raised the fluorescence intensity of E-cadherin in TPC-1 cells, whereas KDM6B overexpression caused a decline in E-cadherin level (40×, 50 μm). (K–M) WB measured that KDM6B knockdown raised E-cadherin and lowered N-cadherin, Snail, and Vimentin levels, whereas KDM6B overexpression did the opposite. n = 3, p < 0.05 indicated a significant difference.
3.4 Knockdown of KDM6B Hindered the Malignant Progression of DTC Cells through Hindering PI3K/AKT/mTOR Pathway
To explore the mechanism of KDM6B regulating the malignant progression of DTC cells, we evaluated the related signaling pathways. After knocking down KDM6B, p-PI3K/PI3K, p-AKT/AKT, and p-mTOR/mTOR levels were notably declined in TPC-1 cells; overexpression of KDM6B caused a marked rise in these protein levels (Fig. 4A,B). TPC-1 cells after transfection with KDM6B were treated with pathway agonist 740Y-P and inhibitor LY294002, respectively. The results revealed that 740Y-P treatment caused raised p-PI3K/PI3K, p-AKT/AKT, and p-mTOR/mTOR levels, while LY294002 treatment decreased these proteins (Fig. 4C,D). Cell biology experiments showed that TPC-1 cells exposed to 740Y-P on the basis of knocking down KDM6B resulted in an increase in EdU positive rate (Fig. 4E,F), a rise in invasive cells (Fig. 4G,H), and an increase in cell migration rate (Fig. 4I,J). After treatment with LY294002, the EdU positive rate and invasive cells declined, and the cell migration rate also decreased significantly. In addition, the addition of 740Y-P reduced the apoptosis rate, while LY294002 treatment increased the apoptosis rate (Fig. 4K,L). These experimental findings suggest that KDM6B might regulate the DTC progression via PI3K/AKT/mTOR pathway.

Figure 4: Knockdown of KDM6B inhibited the malignant progression of DTC cells by hindering the PI3K/AKT/mTOR pathway. (A,B) KDM6B knockdown caused decreased p-PI3K/PI3K, p-AKT/AKT, and p-mTOR/mTOR levels as measured by WB, whereas KDM6B overexpression caused elevated levels of these proteins. (C,D) After knockdown of KDM6B, addition of 740Y-P resulted in elevated p-PI3K/PI3K, p-AKT/AKT, and p-mTOR/mTOR levels, whereas addition of LY294002 decreased the expression of these proteins. (E,F) EdU staining indicated that treating TPC-1 cells with 740Y-P, based on knockdown of KDM6B, resulted in increased EdU positivity cells, whereas LY294002 treatment decreased EdU positivity cells (40×, 500 μm). (G,H) Transwell assay demonstrated that the addition of 740Y-P increased invading cells, and the addition of LY294002 decreased invading cells (20×, 100 μm). (I,J) Cell scratch assay indicated that 740Y-P elevated the cell migration rate and LY294002 decreased the migration rate (10×, 200 μm). (K,L) Flow cytometry demonstrated that the addition of 740Y-P led to a decrease in apoptosis, while LY294002 increased the apoptosis rate. n = 3, p < 0.05 indicated a significant difference.
3.5 Knockdown of KDM6B Inhibited M2 Macrophage Polarization and EMT via Inhibiting PI3K/AKT/mTOR Pathway
Next, we explored whether KDM6B inhibits M2 macrophage polarization and EMT by regulating the PI3K/AKT/mTOR pathway. The TPC-1 cells with knocked-down KDM6B were first treated with the PI3K/AKT pathway activator 740Y-P or inhibitor LY294002 for 24 h, and then co-cultured with M2-type macrophages. 740Y-P intervention caused an elevated proportion of cells positive for CD206 and CD163, while LY294002 treatment decreased CD206 and CD163 positive cells (Fig. 5A–D). In addition, we treated macrophages with 740Y-P/LY294002 alone for 48 h and found that neither affected the expression of CD206 and CD163, ruling out a direct effect of the drug on macrophages (Supplementary Fig. S1). 740Y-P treatment reduced IL-6 levels and increased IL-10 and CCL18 levels, whereas LY294002 treatment showed the opposite results (Fig. 5E–G). 740Y-P treatment declined E-cadherin fluorescence intensity in TPC-1 cells, while LY294002 treatment raised E-cadherin level (Fig. 5H,I). In addition, 740Y-P treatment declined E-cadherin levels and raised Vimentin, N-cadherin, and Snail levels. LY294002 treatment caused opposite changes in the above protein levels (Fig. 5J–N). These findings imply that KDM6B knockdown might hinder M2 macrophages polarization and the EMT process in TPC-1 cells via hindering the PI3K/AKT/mTOR pathway.

Figure 5: Knockdown of KDM6B hindered the PI3K/AKT/mTOR pathway to suppress M2-type macrophage polarization and EMT. (A–D) After knockdown of KDM6B, the addition of 740Y-P resulted in a rise in CD206- and CD163-positive cells as assessed by flow cytometry, whereas the addition of LY294002 decreased CD206- and CD163-positive cells. (E–G) ELISA results showed that the addition of 740Y-P declined IL-6 levels and increased IL-10 and CCL18 levels, whereas the opposite was true for LY294002 treatment. (H,I) Immunofluorescence measured that 740Y-P treatment decreased E-cadherin levels in TPC-1 cells, whereas LY294002 treatment resulted in increased E-cadherin levels (40×, 50 μm). (J–N) WB measured that the 740Y-P treatment declined E-cadherin and raised N-cadherin, Vimentin, and Snail levels, whereas the opposite was true for the LY294002 treatment. n = 3, p < 0.05 indicated a significant difference.
3.6 Knockdown of KDM6B Hindered Tumor Growth by Inhibiting PI3K/AKT/mTOR Pathway
Finally, to explore whether knockdown of KDM6B can also inhibit tumor growth in vivo, a DTC mouse model was constructed by injection of TPC-1 cells. KDM6B protein level in tumor tissues declined after injection of si-KDM6B-transfected TPC-1 cells, which met the requirements of subsequent experiments (Fig. 6A). Further detection showed that knockdown of KDM6B resulted in declined p-AKT/AKT, p-PI3K/PI3K, and p-mTOR/mTOR levels in tumor tissues. Injection of 740Y-P increased the expression of these proteins, while injection of LY294002 showed the opposite effect (Fig. 6B,C). Knockdown of KDM6B markedly declined tumor volume and weight; injection of LY294002 further inhibited tumor growth, while injection of 740Y-P promoted tumor growth (Fig. 6D,E). The results of immunohistochemistry showed that knockdown of KDM6B declined Ki-67 level, and injection of LY294002 further reduced Ki-67 level, while 740Y-P increased Ki-67 level (Fig. 6G,H). Knockdown of KDM6B caused a notable decline in CD206 positive cells and a rise in CD86 positive cells, implying that knockdown of KDM6B also inhibited M2 macrophage polarization in vivo. LY294002 enhanced the above effects of KDM6B knockdown, while 740Y-P reversed this phenomenon (Fig. 6I–K). In addition, knockdown of KDM6B increased TNF-α and declined IL-10 levels in tumor tissues. Injection of 740Y-P reversed this phenomenon, while the effect of LY294002 was opposite to that of 740Y-P (Fig. 6L,M). Knockdown of KDM6B also raised E-cadherin levels and declined Vimentin, N-cadherin, and Snail levels in tumor tissues. LY294002 treatment further enhanced the effect of KDM6B knockdown, while 740Y-P reversed this phenomenon (Fig. 6N,O). The above findings indicate that KDM6B knockdown can regulate the malignant progression of DTC in vivo via hindering the PI3K/AKT/mTOR pathway.

Figure 6: Knockdown of KDM6B hindered tumor growth through hindering PI3K/AKT/mTOR pathway. (A) WB determined a decline in KDM6B level in the si-KDM6B group. (B,C) Knockdown of KDM6B caused decreased p-PI3K/PI3K, p-AKT/AKT, and p-mTOR/mTOR levels, and injection of 740Y-P increased these protein levels, with the inverse result observed following LY294002 injection. (D) On the 28th day after injection of TPC-1 cells, the mouse tumors were removed and imaged. (E,F) The volume of subcutaneous tumors was recorded weekly, V (mm3) = length × width2× 0.5. (G,H) Immunohistochemistry measured that knockdown of KDM6B decreased Ki-67 levels in tumor tissues, and injection of LY294002 further decreased Ki-67 levels, but 740Y-P increased Ki-67 levels (20×, 100 μm). (I–K) Immunofluorescence results demonstrated that KDM6B knockdown decreased the percentage of CD206 positivity and raised the percentage of CD86 positivity, and the effect of knockdown of KDM6B was further enhanced by LY294002, but reversed by 740Y-P (40×, 50 μm). (L,M) The ELISA assay showed that knockdown of KDM6B increased TNF-α level and decreased IL-10 level, which was reversed by 740Y-P, while LY294002 had the opposite effect to 740Y-P. (N,O) Knockdown of KDM6B raised E-cadherin and declined Vimentin, N-cadherin, and Snail levels as measured by WB, whereas LY294002 treatment further increased the effect of knockdown of KDM6B, which was reversed by 740Y-P. n = 6, p < 0.05 indicated a significant difference.
Identifying biomarkers and therapeutic targets for DTC could aid in enhancing diagnostic accuracy and improving patient prognosis. KDM6B has been indicated in previous research to exert a dual role in tumor initiation and progression [46]. Osteosarcoma patients exhibit high levels of KDM6B in their tumor tissues, and targeted inhibition of KDM6B expression can hinder cell migration and proliferation and promote cell apoptosis [23]. Whereas in breast cancer and hepatocellular carcinoma, high expression of KDM6B tends to predict longer survival and a favorable prognosis [14,47]. Upon examination of clinical samples, we found that KDM6B was aberrantly highly expressed in DTC tissues. Notably, Kaplan-Meier survival analysis revealed an unfavorable prognosis for DTC patients exhibiting elevated KDM6B expression. Based on this, we transfected DTC cells with si-KDM6B or oe-KDM6B to explore how KDM6B expression affects the malignant biological behaviors of DTC cells and to clarify its potential mechanism of action. In cell function studies, KDM6B overexpression promoted the proliferation of DTC cells and promoted their migration and invasion. In contrast, KDM6B knockdown notably inhibited the malignant biological behaviors of DTC cells. In vivo studies further validated that KDM6B knockdown hindered DTC tumor growth, suggesting that KDM6B might serve as a key target for DTC treatment.
There exists a strong correlation between the tumor growth process and the TME, which consists of tumor cells, immune cells, as well as surrounding blood vessels, extracellular matrix, and many other components [48]. Among them, the immune cells cover a number of types such as tumor-infiltrating lymphocytes, TAMs, and dendritic cells [49]. In TME, most of the TAMs are alternatively activated M2-type macrophages, for which CD206 and CD163 are specific markers; these cells induce inactivation of CD8+ T cells, creating an immunosuppressive state, and are also involved in angiogenesis and mesenchymal stromal cell construction, which in turn drives tumor growth [50,51]. In DTC, polarization of TAMs to M2-type is strongly associated with larger primary tumors and more lymph node metastases [52,53]. Xu et al. revealed that artesunate suppressed the M2-type TAMs polarization, thereby suppressing the proliferation of thyroid cancer cells [54]. In the present study, we co-cultured M2-type macrophages with TPC-1 cells overexpressing or knocking down KDM6B and found that knocking down KDM6B inhibited M2-type macrophage polarization, whereas overexpressing KDM6B promoted this polarization process. In addition, Du et al. found that upregulation of KDM6B expression in TAMs inhibited M2 macrophage polarization and suppressed malignant progression of breast cancer [30]. This reflects the dual role of KDM6B in different cancers, a phenomenon that may be caused by tissue-specific cofactors or differences in chromatin environment. The mechanisms influencing the different roles of KDM6B in different cancers can be further explored in the future. More importantly, unlike previous studies focusing on the effect of KDM6B expression in macrophages on the malignant progression of cancer cells, our study reveals for the first time that KDM6B in DTC cells regulates TME by promoting M2 macrophage polarization and infiltration, which in turn promotes DTC progression.
EMT refers to a biological process where epithelial cells lose their polarity and intercellular adhesive properties, while gaining the migratory and invasive characteristics typical of mesenchymal cells [55]. The EMT process plays an integral role in embryonic development and tissue repair, yet is aberrantly activated in tumors as one of the central mechanisms driving malignant metastasis and treatment resistance [56,57]. In particular, overexpression of N-cadherin enhances the invasion and migration of cancer cells, whereas deletion of E-cadherin expression weakens the stability of adhesion junctions between epithelial cells and ultimately promotes the metastatic process of tumor cells [58,59]. In our research, KDM6B knockdown resulted in increased E-cadherin levels in TPC-1 cells, accompanied by downregulation of N-cadherin, Vimentin, and Snail; whereas KDM6B overexpression caused the opposite results. These findings imply that KDM6B may ultimately contribute to the malignant progression of DTC by promoting EMT, thereby promoting cell invasion and metastasis.
PI3K/AKT/mTOR is the core pathway regulating the EMT process [60,61]. PI3K ensures full activation of AKT by regulating multiple downstream pathways and providing specific anchor sites for AKT [62]. Activated AKT initiates signaling and triggers a cascade reaction by regulating downstream target proteins, thereby affecting tumor cell proliferation, differentiation, metabolism, and migration [63,64]. The mTOR kinase is a major negative regulator of autophagy; it promotes cell growth and hinders apoptosis by activating the phosphorylation of mTOR [65,66]. It has been shown that inhibiting the PI3K/AKT/mTOR pathway effectively hinders the invasion of undifferentiated thyroid cancer cells and reduces cancer cell stemness [22]. Therefore, we hypothesized that KDM6B might regulate DTC progression via the PI3K/AKT/mTOR pathway. We found that overexpression of KDM6B increased PI3K, AKT, and mTOR phosphorylation levels. In contrast, KDM6B knockdown suppressed the activation of the above pathway-related proteins, suggesting that KDM6B regulates the PI3K/AKT/mTOR pathway. Not only that, 740Y-P impaired the inhibitory impact of knocking down KDM6B on M2 macrophage polarization and the EMT process, whereas LY294002 further enhanced the impact of knocking down KDM6B. KDM6B also regulated the PI3K/AKT/mTOR pathway in mice, and KDM6B knockdown effectively inhibited tumor growth. The findings confirmed that KDM6B may facilitate the malignant progression of tumors via regulating the PI3K/AKT/mTOR pathway. In the future, we will further validate the regulatory association of KDM6B with the PI3K/AKT/mTOR pathway through KDM6B overexpression combined with LY294002 rescue experiments.
This study focused on the function of KDM6B in DTC and its association with the tumor microenvironment. Future studies could assay demethylase (e.g., H3K27me3) activity to further investigate the mechanism of action of KDM6B. In the future, transcriptomic profiling or ChIP-seq could be employed to identify KDM6B-dependent gene networks, and the interactions between the PI3K/AKT/mTOR signaling and other pathways could be further explored in depth, thereby comprehensively elucidating the regulatory mechanism of KDM6B in DTC. The clinical sample size (n = 39) was relatively small, and selection bias may exist; subsequent studies may combine multiple centers to expand the sample size. In addition, the criteria for the selection of clinical samples were broad and did not make a careful distinction between the specific clinical stages of DTC, and the differences in KDM6B expression and its clinical significance in DTC patients with different stages could be further investigated in the future. Not only that, but this study also lacked long-term survival follow-up and metastatic potential assessment, which can be combined with long-term survival curve analysis in the future to clarify the impact of KDM6B on DTC metastasis and patient prognosis. The cellular experiments were mainly carried out based on TPC-1 cells and will be repeated in different DTC cell lines to verify the mechanism of action of KDM6B. Based on the results of this study, it is possible to explore whether small molecule inhibitors targeting KDM6B can enhance the effect of immunotherapy by inhibiting M2 macrophage infiltration in the future. In addition, murine DTC cells can be used to construct a homologous transplanted tumor model in the future to further explore the effect of KDM6B on tumor immune microenvironment.
KDM6B is highly expressed in DTC, and it can affect the malignant biological behaviors of DTC cells, regulate M2-type macrophage polarization in TEM, and promote EMT through the PI3K/AKT/mTOR pathway. Knockdown of KDM6B inhibited DTC progression by blocking this pathway, implying that KDM6B could serve as a probable therapeutic target for intervening in DTC progression. This research preliminarily indicated the mechanism of action of KDM6B in regulating DTC progression, expanding the biological function of KDM6B in tumors.
Acknowledgement: None.
Funding Statement: This research was funded by the Key Scientific Research Project Plan of colleges and universities in Henan Province (No. 24B320007).
Author Contributions: The authors confirm contribution to the paper as follows: study conception and design: Jiangtao Yu, Qingfeng Huo; data collection: Jiangtao Yu; analysis and interpretation of results: Jiangtao Yu, Qingfeng Huo, Xinxin Duan; draft manuscript preparation: Jiangtao Yu and Qingfeng Huo. All authors reviewed and approved the final version of the manuscript.
Availability of Data and Materials: The data that supports the findings of this study are available from the Corresponding Author, [Jiangtao Yu], upon reasonable request.
Ethics Approval: Human components of this study have been approved by The Fifth Clinical Medical College of Henan University of Chinese Medicine (Zhengzhou People’s Hospital) Ethics Committee (No. 2023011111) and all experimental procedures were strictly followed by the Declaration of Helsinki; Animals components of this study have been approved by The Fifth Clinical Medical College of Henan University of Chinese Medicine (Zhengzhou People’s Hospital) Animal Welfare Ethics Committee (No. 2023011111[02]). We secured a signed informed consent form from every participant.
Conflicts of Interest: The authors declare no conflicts of interest.
Supplementary Materials: The supplementary material is available online at https://www.techscience.com/doi/10.32604/biocell.2026.073331/s1.
Abbreviations
| DTC | Differentiated thyroid carcinoma |
| EMT | Epithelial-mesenchymal transition |
| KDM6B | Lysine-specific demethylase 6B |
| TAMs | Tumor-associated macrophage |
| CCK-8 | Cell Counting Kit-8 |
| IL | Interleukin |
| GFP | Green fluorescent protein |
| EdU | 5-Ethynyl-2′-deoxyuridine |
| PI | Propidium Iodide |
| TNF-α | Tumor necrosis factor-α |
| CCL18 | Chemokine C-C motif ligand 18 |
| BSA | Bovine serum albumin |
References
1. Boucai L, Zafereo M, Cabanillas ME. Thyroid cancer: a review. Jama. 2024;331(5):425. doi:10.1001/jama.2023.26348. [Google Scholar] [PubMed] [CrossRef]
2. Reverter JL. Thyroid cancer. Med Clínica Engl Ed. 2025;164(8):421–8. doi:10.1016/j.medcle.2024.12.003. [Google Scholar] [CrossRef]
3. Forma A, Kłodnicka K, Pająk W, Flieger J, Teresińska B, Januszewski J, et al. Thyroid cancer: epidemiology, classification, risk factors, diagnostic and prognostic markers, and current treatment strategies. Int J Mol Sci. 2025;26(11):5173. doi:10.3390/ijms26115173. [Google Scholar] [PubMed] [CrossRef]
4. Siegel RL, Kratzer TB, Giaquinto AN, Sung H, Jemal A. Cancer statistics, 2025. CA Cancer J Clin. 2025;75(1):10–45. doi:10.3322/caac.21871. [Google Scholar] [PubMed] [CrossRef]
5. Sakulpisuti C, Charoenphun P, Chamroonrat W. Positron emission tomography radiopharmaceuticals in differentiated thyroid cancer. Molecules. 2022;27(15):4936. doi:10.3390/molecules27154936. [Google Scholar] [PubMed] [CrossRef]
6. Yao S, Shen P, Dai F, Deng L, Qiu X, Zhao Y, et al. Thyroid cancer central lymph node metastasis risk stratification based on homogeneous positioning deep learning. Research. 2024;7(6):432. doi:10.34133/research.0432. [Google Scholar] [PubMed] [CrossRef]
7. Liu R, Cao Z, Pan M, Wu M, Li X, Yuan H, et al. A novel prognostic model for papillary thyroid cancer based on epithelial-mesenchymal transition-related genes. Cancer Med. 2022;11(23):4703–20. doi:10.1002/cam4.4836. [Google Scholar] [PubMed] [CrossRef]
8. Mardente S, Aventaggiato M, Splendiani E, Mari E, Zicari A, Catanzaro G, et al. Extra-cellular vesicles derived from thyroid cancer cells promote the epithelial to mesenchymal transition (EMT) and the transfer of malignant phenotypes through immune mediated mechanisms. Int J Mol Sci. 2023;24(3):2754. doi:10.3390/ijms24032754. [Google Scholar] [PubMed] [CrossRef]
9. Fagin JA, Krishnamoorthy GP, Landa I. Pathogenesis of cancers derived from thyroid follicular cells. Nat Rev Cancer. 2023;23(9):631–50. doi:10.1038/s41568-023-00598-y. [Google Scholar] [PubMed] [CrossRef]
10. MacDonald L, Jenkins J, Purvis G, Lee J, Franco AT. The thyroid tumor microenvironment: potential targets for therapeutic intervention and prognostication. Horm Cancer. 2020;11(5–6):205–17. doi:10.1007/s12672-020-00390-6. [Google Scholar] [PubMed] [CrossRef]
11. Lagunas-Rangel FA. KDM6B (JMJD3) and its dual role in cancer. Biochimie. 2021;184:63–71. doi:10.1016/j.biochi.2021.02.005. [Google Scholar] [PubMed] [CrossRef]
12. Brauer B, Ancatén-González C, Ahumada-Marchant C, Meza RC, Merino-Veliz N, Nardocci G, et al. Impact of KDM6B mosaic brain knockout on synaptic function and behavior. Sci Rep. 2024;14(1):20416. doi:10.1038/s41598-024-70728-5. [Google Scholar] [PubMed] [CrossRef]
13. Liu F, Wang Y, Yang Z, Cui X, Zheng L, Fu Y, et al. KDM6B promotes gastric carcinogenesis and metastasis via upregulation of CXCR4 expression. Cell Death Dis. 2022;13(12):1068. doi:10.1038/s41419-022-05458-5. [Google Scholar] [PubMed] [CrossRef]
14. Xun J, Gao R, Wang B, Li Y, Ma Y, Guan J, et al. Histone demethylase KDM6B inhibits breast cancer metastasis by regulating Wnt/β-catenin signaling. FEBS Open Bio. 2021;11(8):2273–81. doi:10.1002/2211-5463.13236. [Google Scholar] [PubMed] [CrossRef]
15. Wang X, Zhang C, Dong N, Xu HE, Zhou Y, Hou D. E2F1-driven histone demethylase KDM6B enhances thyroid malignancy via manipulating TFEB-dependent autophagy axis. Exp Cell Res. 2023;431(1):113742. doi:10.1016/j.yexcr.2023.113742. [Google Scholar] [PubMed] [CrossRef]
16. Ding JT, Yu XT, He JH, Chen DZ, Guo F. A pan-cancer analysis revealing the dual roles of lysine (K)-specific demethylase 6B in tumorigenesis and immunity. Front Genet. 2022;13:912003. doi:10.3389/fgene.2022.912003. [Google Scholar] [PubMed] [CrossRef]
17. Liang X, Luo M, Shao B, Yang JY, Tong A, Wang RB, et al. Phosphatidylserine released from apoptotic cells in tumor induces M2-like macrophage polarization through the PSR-STAT3-JMJD3 axis. Cancer Commun. 2022;42(3):205–22. doi:10.1002/cac2.12272. [Google Scholar] [PubMed] [CrossRef]
18. Miricescu D, Totan A, Stanescu-Spinu I-I, Badoiu SC, Stefani C, Greabu M. PI3K/AKT/mTOR signaling pathway in breast cancer: from molecular landscape to clinical aspects. Int J Mol Sci. 2020;22(1):173. doi:10.3390/ijms22010173. [Google Scholar] [PubMed] [CrossRef]
19. Tian LY, Smit DJ, Jücker M. The role of PI3K/AKT/mTOR signaling in hepatocellular carcinoma metabolism. Int J Mol Sci. 2023;24(3):2652. doi:10.3390/ijms24032652. [Google Scholar] [PubMed] [CrossRef]
20. Jiang Q, Guan Y, Zheng J, Lu H. TBK1 promotes thyroid cancer progress by activating the PI3K/Akt/mTOR signaling pathway. Immun Inflamm Dis. 2023;11(3):e796. doi:10.1002/iid3.796. [Google Scholar] [PubMed] [CrossRef]
21. Luo X, Wang J, Lu J, Wang X, Miao Y, Li Q, et al. Rab22a promotes epithelial-mesenchymal transition in papillary thyroid carcinoma by activating PI3K/AKT/mTOR signaling pathway. Biomed Res Int. 2022;2022(1):1874550. doi:10.1155/2022/1874550. [Google Scholar] [PubMed] [CrossRef]
22. Lv J, Liu C, Chen FK, Feng ZP, Jia L, Liu PJ, et al. M2-like tumour-associated macrophage-secreted IGF promotes thyroid cancer stemness and metastasis by activating the PI3K/AKT/mTOR pathway. Mol Med Rep. 2021;24(2):604. doi:10.3892/mmr.2021.12249. [Google Scholar] [PubMed] [CrossRef]
23. Jiang Y, Li F, Gao B, Ma M, Chen M, Wu Y, et al. KDM6B-mediated histone demethylation of LDHA promotes lung metastasis of osteosarcoma. Theranostics. 2021;11(8):3868–81. doi:10.7150/thno.53347. [Google Scholar] [PubMed] [CrossRef]
24. Zhang Z, Ren J, Tang K, Hu X, Liu J, Li C. Matrix stiffness enhances viability, migration, invasion and invadopodia formation of oral cancer cells via PI3K/AKT pathway in vitro. Eur J Med Res. 2025;30(1):413. doi:10.1186/s40001-025-02666-5. [Google Scholar] [PubMed] [CrossRef]
25. Du H, Jin X, Jin S, Zhang D, Chen Q, Jin X, et al. Anti-leukemia activity of polysaccharide from Sargassum fusiforme via the PI3K/AKT/BAD pathway in vivo and in vitro. Mar Drugs. 2023;21(5):289. doi:10.3390/md21050289. [Google Scholar] [PubMed] [CrossRef]
26. Shao R, Liu C, Xue R, Deng X, Liu L, Song C, et al. Tumor-derived exosomal ENO2 modulates polarization of tumor-associated macrophages through reprogramming glycolysis to promote progression of diffuse large B-cell lymphoma. Int J Biol Sci. 2024;20(3):848–63. doi:10.7150/ijbs.91154. [Google Scholar] [PubMed] [CrossRef]
27. Shen Z, Zhao L, Yoo SA, Lin Z, Zhang Y, Yang W, et al. Emodin induces ferroptosis in colorectal cancer through NCOA4-mediated ferritinophagy and NF-κb pathway inactivation. Apoptosis. 2024;29(9–10):1810–23. doi:10.1007/s10495-024-01973-2. [Google Scholar] [PubMed] [CrossRef]
28. Beeraka NM, Nagalakshmi A, Satyavathi A, Kote DM, Reddy YP, Basappa B, et al. Ginsenoside Rh4 Suppresses Notch3 and PI3K/Akt Pathway to Inhibit Growth and Metastasis of Gastric Cancer Cells: ginsenoside Rh4 inhibit gastric cancer progression. J Can Biomol Therap. 2024;2(1):145–56. doi:10.62382/jcbt.v2i1.51. [Google Scholar] [CrossRef]
29. Zhao R, Zhao D, Zhu X, Li F, Xiong P, Li S, et al. The influence of miR-3149 on the malignancy progression of gastric cancer by negatively regulating CEACAM5. J Cancer Biomol Ther. 2024;1(1):1–10. doi:10.62382/jcbt.v1i1.1. [Google Scholar] [CrossRef]
30. Du L, Dai B, Liu X, Zhou D, Yan H, Shen T, et al. KDM6B regulates M2 polarization of macrophages by modulating the stability of nuclear β-catenin. Biochim Biophys Acta Mol Basis Dis. 2023;1869(2):166611. doi:10.1016/j.bbadis.2022.166611. [Google Scholar] [PubMed] [CrossRef]
31. Wang Z, Liu Z, Yang Y, Wang W, Chen Q, Liang S, et al. KDM6B inhibition enhances chemotherapeutic response in small cell lung cancer via epigenetic regulation of apoptosis and ferroptosis. Cell Biosci. 2025;15(1):162. doi:10.1186/s13578-025-01496-6. [Google Scholar] [PubMed] [CrossRef]
32. Si X, Lin W, Chen Z, Xu J, Huang W, Chen F, et al. Atractylenolide III ameliorated reflux esophagitis via PI3K/AKT/NF-κB/iNOS pathway in rats. Heliyon. 2023;9(11):e21224. doi:10.1016/j.heliyon.2023.e21224. [Google Scholar] [PubMed] [CrossRef]
33. Cheng X, Zhu C, Chen Y, Li M, Li G, Zu Y, et al. Huaier relieves oxaliplatin-induced hepatotoxicity through activation of the PI3K/AKT/Nrf2 signaling pathway in C57BL/6 mice. Heliyon. 2024;10(17):e37010. doi:10.1016/j.heliyon.2024.e37010. [Google Scholar] [PubMed] [CrossRef]
34. Chu Z, Luo Y, Ni T, Zhu M, Feng X, Liu Y, et al. Betulonic acid, as one of the active components of the Celastrus orbiculatus extract, inhibits the invasion and metastasis of gastric cancer cells by mediating cytoskeleton rearrangement in vitro. Molecules. 2022;27(3):1025. doi:10.3390/molecules27031025. [Google Scholar] [PubMed] [CrossRef]
35. Wang T, Zhang C, Wang S. Ginsenoside Rg3 inhibits osteosarcoma progression by reducing circ_0003074 expression in a miR-516b-5p/KPNA4-dependent manner. J Orthop Surg Res. 2021;16(1):724. doi:10.1186/s13018-021-02868-7. [Google Scholar] [PubMed] [CrossRef]
36. Wang A, Zhou D, Krawczyk E, Li T, Simic V, Lu J, et al. Overexpression of the telomerase holoenzyme induces EMT and tumorigenesis of HPV-immortalized keratinocytes. J Med Virol. 2023;95(4):e28681. doi:10.1002/jmv.28681. [Google Scholar] [PubMed] [CrossRef]
37. Li SL, Jiang TQ, Cao QW, Liu SM. Transmembrane protein ADAM29 facilitates cell proliferation, invasion and migration in clear cell renal cell carcinoma. J Chemother. 2021;33(1):40–50. doi:10.1080/1120009X.2020.1842035. [Google Scholar] [PubMed] [CrossRef]
38. Xiao J, Cai T, Fang Y, Liu R, Flores JJ, Wang W, et al. Activation of GPR40 attenuates neuroinflammation and improves neurological function via PAK4/CREB/KDM6B pathway in an experimental GMH rat model. J Neuroinflammation. 2021;18(1):160. doi:10.1186/s12974-021-02209-9. [Google Scholar] [PubMed] [CrossRef]
39. Rizzo B, Zambonin L, Angeloni C, Leoncini E, Dalla Sega FV, Prata C, et al. Steviol glycosides modulate glucose transport in different cell types. Oxid Med Cell Longev. 2013;2013:348169. doi:10.1155/2013/348169. [Google Scholar] [PubMed] [CrossRef]
40. Yang X, Huo F, Liu B, Liu J, Chen T, Li J, et al. Crocin inhibits oxidative stress and pro-inflammatory response of microglial cells associated with diabetic retinopathy through the activation of PI3K/Akt signaling pathway. J Mol Neurosci. 2017;61(4):581–9. doi:10.1007/s12031-017-0899-8. [Google Scholar] [PubMed] [CrossRef]
41. He A, Ma L, Huang Y, Zhang H, Duan W, Li Z, et al. CDKL3 promotes osteosarcoma progression by activating Akt/PKB. Life Sci Alliance. 2020;3(5):e202000648. doi:10.26508/lsa.202201656. [Google Scholar] [PubMed] [CrossRef]
42. Chia K, Mazzolini J, Mione M, Sieger D. Tumor initiating cells induce Cxcr4-mediated infiltration of pro-tumoral macrophages into the brain. Elife. 2018;7:e31918. doi:10.7554/eLife.31918. [Google Scholar] [PubMed] [CrossRef]
43. Li H, Guan B, Liu S, Liu H, Song L, Zhang G, et al. PTPN14 promotes gastric cancer progression by PI3KA/AKT/mTOR pathway. Cell Death Dis. 2023;14(3):188. doi:10.1038/s41419-023-05712-4. [Google Scholar] [PubMed] [CrossRef]
44. Farini A, Tripodi L, Villa C, Napolitano F, Strati F, Molinaro D, et al. Inhibition of the immunoproteasome modulates innate immunity to ameliorate muscle pathology of dysferlin-deficient BlAJ mice. Cell Death Dis. 2022;13(11):975. doi:10.1038/s41419-022-05416-1. [Google Scholar] [PubMed] [CrossRef]
45. Mukherjee A, Lo M, Chandra P, Datta Chaudhuri R, De P, Dutta S, et al. SARS-CoV-2 nucleocapsid protein promotes self-deacetylation by inducing HDAC6 to facilitate viral replication. Virol J. 2024;21(1):186. doi:10.1186/s12985-024-02460-5. [Google Scholar] [PubMed] [CrossRef]
46. Sanchez A, Houfaf Khoufaf FZ, Idrissou M, Penault-Llorca F, Bignon YJ, Guy L, et al. The functions of the demethylase JMJD3 in cancer. Int J Mol Sci. 2021;22(2):968. doi:10.3390/ijms22020968. [Google Scholar] [PubMed] [CrossRef]
47. Qu LH, Fang Q, Yin T, Yi HM, Mei GB, Hong ZZ, et al. Comprehensive analyses of prognostic biomarkers and immune infiltrates among histone lysine demethylases (KDMs) in hepatocellular carcinoma. Cancer Immunol Immunother. 2022;71(10):2449–67. doi:10.1007/s00262-022-03167-8. [Google Scholar] [PubMed] [CrossRef]
48. Xiao Y, Yu D. Tumor microenvironment as a therapeutic target in cancer. Pharmacol Ther. 2021;221:107753. doi:10.1016/j.pharmthera.2020.107753. [Google Scholar] [PubMed] [CrossRef]
49. Fu X, He Y, Li M, Huang Z, Najafi M. Targeting of the tumor microenvironment by curcumin. Biofactors. 2021;47(6):914–32. doi:10.1002/biof.1776. [Google Scholar] [PubMed] [CrossRef]
50. Pan Y, Yu Y, Wang X, Zhang T. Tumor-associated macrophages in tumor immunity. Front Immunol. 2020;11:583084. doi:10.3389/fimmu.2020.583084. [Google Scholar] [PubMed] [CrossRef]
51. Park J, Hsueh PC, Li Z, Ho PC. Microenvironment-driven metabolic adaptations guiding CD8+ T cell anti-tumor immunity. Immunity. 2023;56(1):32–42. doi:10.1016/j.immuni.2022.12.008. [Google Scholar] [PubMed] [CrossRef]
52. Song M, Liu Q, Sun W, Zhang H. Crosstalk between thyroid carcinoma and tumor-correlated immune cells in the tumor microenvironment. Cancers. 2023;15(10):2863. doi:10.3390/cancers15102863. [Google Scholar] [PubMed] [CrossRef]
53. Qing W, Fang WY, Ye L, Shen LY, Zhang XF, Fei XC, et al. Density of tumor-associated macrophages correlates with lymph node metastasis in papillary thyroid carcinoma. Thyroid. 2012;22(9):905–10. doi:10.1089/thy.2011.0452. [Google Scholar] [PubMed] [CrossRef]
54. Xu Z, Li X, Zhuang D. Artesunate suppresses the migration and invasion of thyroid cancer cells via upregulating PTEN to block M2 polarization of tumor-associated macrophages. Chem Biol Drug Des. 2025;105(3):e70076. doi:10.1111/cbdd.70076. [Google Scholar] [PubMed] [CrossRef]
55. Guarino M. EMT: from embryogenesis, through cancer progression, to the development of carcinosarcoma. Differentiation. 2025;146(6):100903. doi:10.1016/j.diff.2025.100903. [Google Scholar] [PubMed] [CrossRef]
56. Gundamaraju R, Lu W, Paul MK, Jha NK, Gupta PK, Ojha S, et al. Autophagy and EMT in cancer and metastasis: who controls whom? Biochim Biophys Acta Mol Basis Dis. 2022;1868(9):166431. doi:10.1016/j.bbadis.2022.166431. [Google Scholar] [PubMed] [CrossRef]
57. Tomecka P, Kunachowicz D, Górczyńska J, Gebuza M, Kuźnicki J, Skinderowicz K, et al. Factors determining epithelial-mesenchymal transition in cancer progression. Int J Mol Sci. 2024;25(16):8972. doi:10.3390/ijms25168972. [Google Scholar] [PubMed] [CrossRef]
58. Ang HL, Mohan CD, Shanmugam MK, Leong HC, Makvandi P, Rangappa KS, et al. Mechanism of epithelial-mesenchymal transition in cancer and its regulation by natural compounds. Med Res Rev. 2023;43(4):1141–200. doi:10.1002/med.21948. [Google Scholar] [PubMed] [CrossRef]
59. Debnath P, Huirem RS, Dutta P, Palchaudhuri S. Epithelial-mesenchymal transition and its transcription factors. Biosci Rep. 2022;42(1):BSR20211754. doi:10.1042/BSR20211754. [Google Scholar] [PubMed] [CrossRef]
60. Peng Y, Wang Y, Zhou C, Mei W, Zeng C. PI3K/Akt/mTOR pathway and its role in cancer therapeutics: are we making headway? Front Oncol. 2022;12:819128. doi:10.3389/fonc.2022.819128. [Google Scholar] [PubMed] [CrossRef]
61. Karami Fath M, Ebrahimi M, Nourbakhsh E, Zia Hazara A, Mirzaei A, Shafieyari S, et al. PI3K/Akt/mTOR signaling pathway in cancer stem cells. Pathol Res Pract. 2022;237:154010. doi:10.1016/j.prp.2022.154010. [Google Scholar] [PubMed] [CrossRef]
62. Mishra R, Patel H, Alanazi S, Kilroy MK, Garrett JT. PI3K inhibitors in cancer: clinical implications and adverse effects. Int J Mol Sci. 2021;22(7):3464. doi:10.3390/ijms22073464. [Google Scholar] [PubMed] [CrossRef]
63. Li H, Wen X, Ren Y, Fan Z, Zhang J, He G, et al. Targeting PI3K family with small-molecule inhibitors in cancer therapy: current clinical status and future directions. Mol Cancer. 2024;23(1):164. doi:10.1186/s12943-024-02072-1. [Google Scholar] [PubMed] [CrossRef]
64. Hashemi M, Taheriazam A, Daneii P, Hassanpour A, Kakavand A, Rezaei S, et al. Targeting PI3K/Akt signaling in prostate cancer therapy. J Cell Commun Signal. 2023;17(3):423–43. doi:10.1007/s12079-022-00702-1. [Google Scholar] [PubMed] [CrossRef]
65. Yu L, Wei J, Liu P. Attacking the PI3K/Akt/mTOR signaling pathway for targeted therapeutic treatment in human cancer. Semin Cancer Biol. 2022;85(1):69–94. doi:10.1016/j.semcancer.2021.06.019. [Google Scholar] [PubMed] [CrossRef]
66. Zhu K, Wu Y, He P, Fan Y, Zhong X, Zheng H, et al. PI3K/AKT/mTOR-targeted therapy for breast cancer. Cells. 2022;11(16):2508. doi:10.3390/cells11162508. [Google Scholar] [PubMed] [CrossRef]
Cite This Article
 Copyright © 2026 The Author(s). Published by Tech Science Press.
This work is licensed under a Creative Commons Attribution 4.0 International License , which permits unrestricted use, distribution, and reproduction in any medium, provided the original work is properly cited.
 Downloads
 Citation Tools