
 Submit a Paper
 Propose a Special lssue
 Open Access
ARTICLE

PD-1 Blockade Reduces Parasite Load and Restores Anti-Parasitic Immunity in Murine Visceral Leishmaniasis
1 Department of Pathogenic Biology, West China School of Basic Medical Sciences and Forensic Medicine, Sichuan University, Chengdu, China
2 Department of Pharmaceutics, School of Pharmacy, Chengdu Medical College, Chengdu, China
* Corresponding Authors: Jianping Chen. Email: ; Jinlei He. Email:
# These authors contributed equally to this work
BIOCELL 2026, 50(5), 9 https://doi.org/10.32604/biocell.2026.077240
Received 04 December 2025; Accepted 21 February 2026; Issue published 13 May 2026
 View Full Text
 Download PDF
Abstract
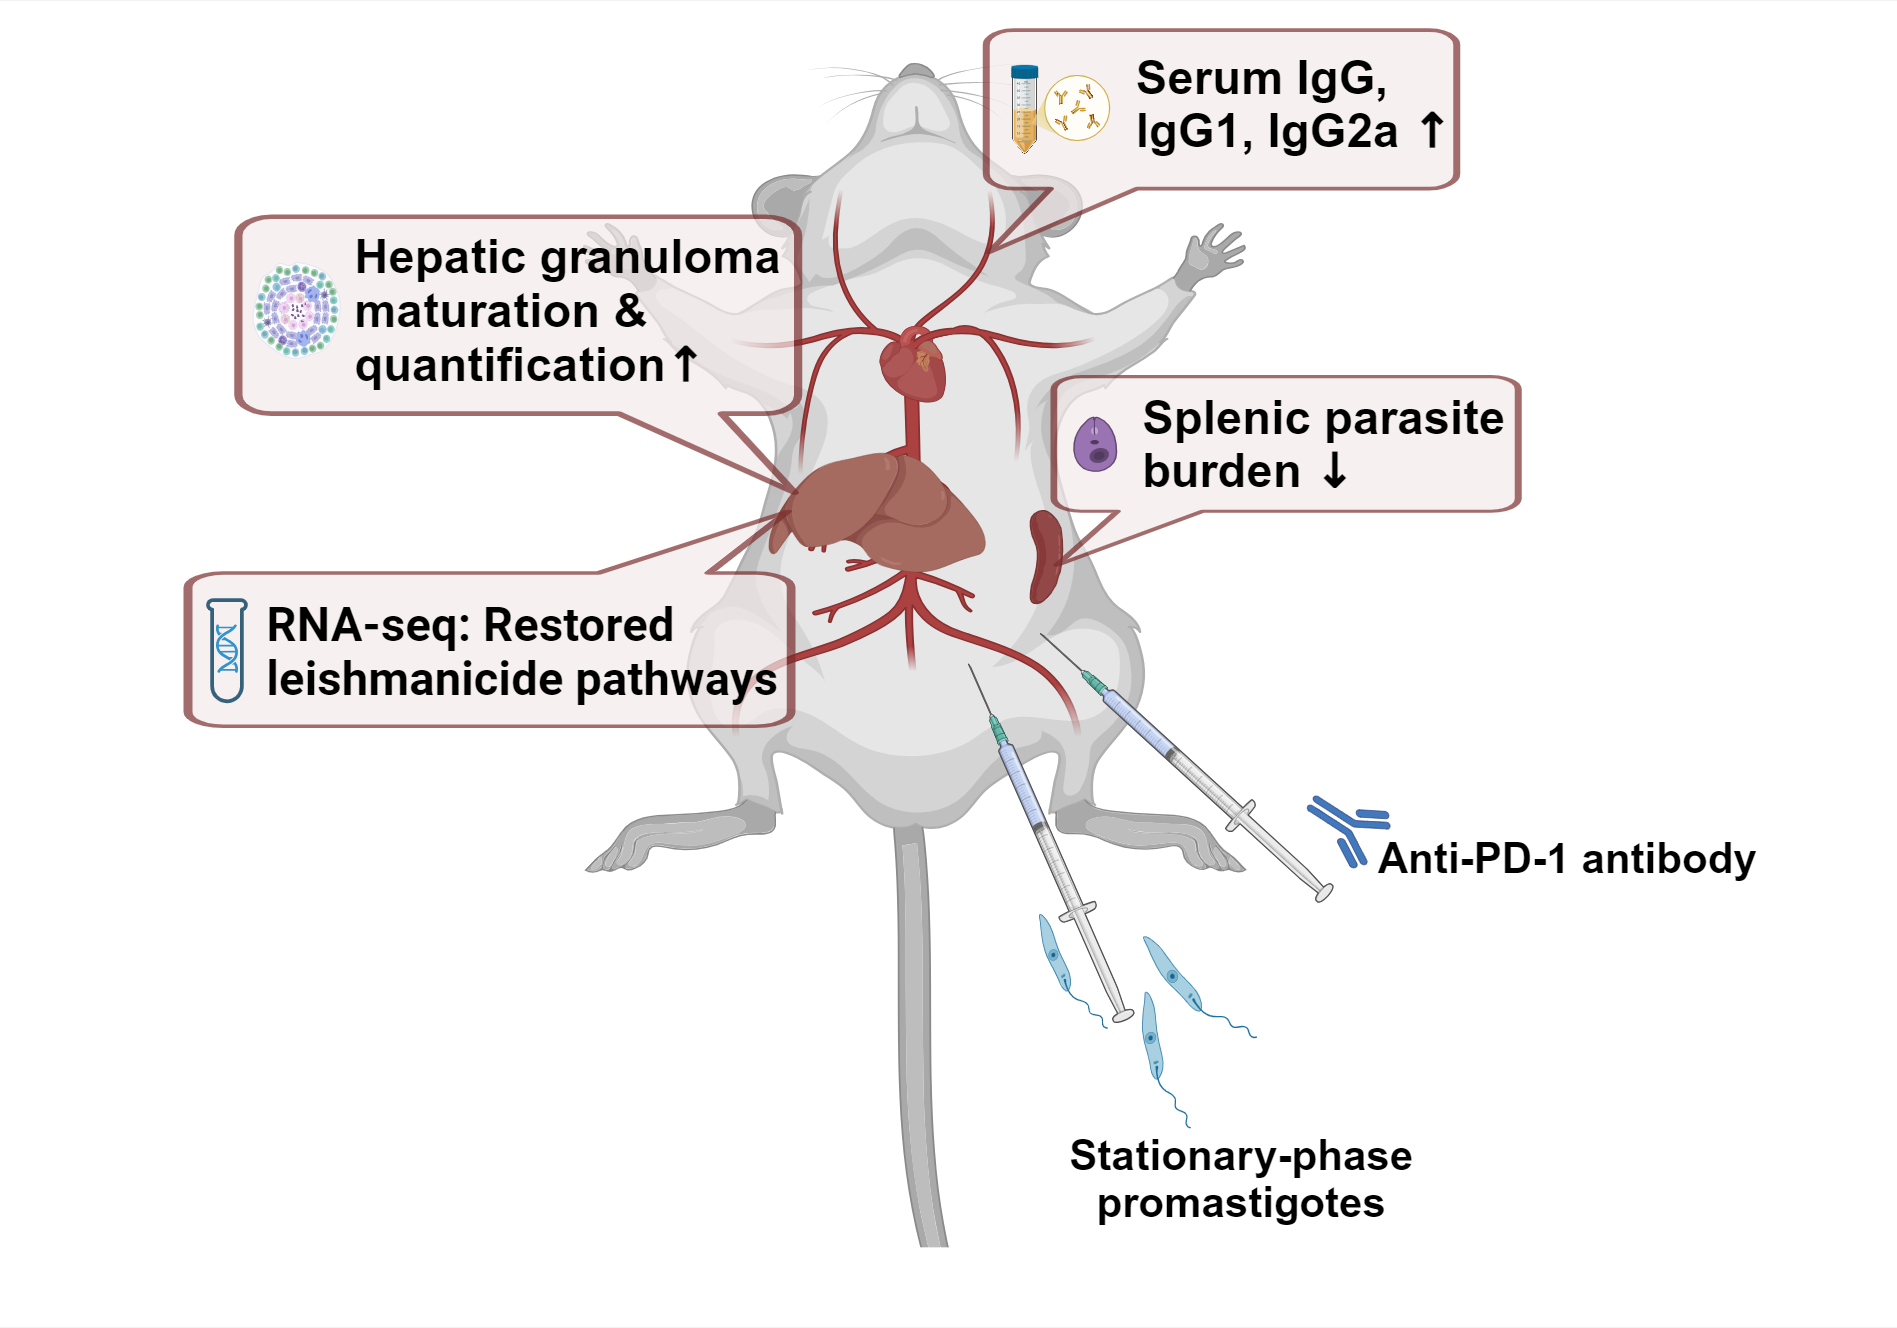
Objective: Immune checkpoint blockade holds therapeutic potential in visceral leishmaniasis; its underlying mechanism remains unclear. This study aimed to investigate the therapeutic potential and underlying immune mechanisms of Programmed cell death protein 1 (PD-1) blockade in experimental visceral leishmaniasis. Methods: BALB/c mice infected with Leishmania donovani received anti-PD-1 antibody at 35–44 days post-infection. Parasite burden in target organs, serum antibodies, hepatopathology, and transcriptome of the liver were analyzed. T cell exhaustion, activation, apoptosis, and inflammation genes were quantified in target organs. Results: PD-1 blockade reduced splenic parasite load (reduction rate = 82.6%, ***p < 0.001), enhanced hepatic granulomatous maturation, and elevated anti-Leishmania IgG/IgG1/IgG2a levels. qPCR analysis revealed that the expressions of exhaustion marker genes Programmed cell death 1 (Pdcd1) and B and T lymphocyte attenuator (Btla) were upregulated in the liver and spleen following Leishmania infection, indicating an exhausted state. After PD-1 blockade, the expression of pro-inflammatory cytokine genes Tumor necrosis factor alpha (Tnfa), Interferon gamma (Ifng), and Nitric Oxide Synthase 2 (Nos2) was upregulated in the spleen, while the expression of anti-inflammatory cytokine genes Interleukin 4 (Il4) and Interleukin 10 (Il10) was downregulated in the liver. Transcriptome suggested that antigen processing & presentation, Natural Killer cell-mediated cytotoxicity, and neutrophil extracellular trap formation pathways were restored after blockade. Six hub genes associated with immune restoration were identified, of which Activating transcription factor 3 (Atf3) was chosen to be overexpressed in RAW 264.7 and manifested a reduced infection rate and average Leishmania at 12 h post-infection. Conclusion: This study demonstrated PD-1 blockade reinvigorated anti-parasitic immunity through multimodal mechanisms and illuminated both the potential and intricate dynamics of immune checkpoint modulation in leishmaniasis, where treatment success hinges on coordinated immune activation.Graphic Abstract
Keywords
Leishmania is a parasite primarily transmitted through sand fly bites, capable of infecting various animals, including canines, equines, and wildlife, and under certain conditions, it can be transmitted to humans, causing leishmaniasis. The main endemic areas of leishmaniasis include tropical, subtropical, and some temperate regions, concentrated in Asia, Africa, South America, the Mediterranean coast, and the Middle East [1]. Approximately 700 million people worldwide live in endemic areas of leishmaniasis, with approximately 700,000–1,000,000 new cases and 26,000–65,000 deaths each year (mostly of the visceral form) [2]. The WHO lists leishmaniasis as a “Neglected tropical disease (NTDs)”. The primary clinical manifestations of visceral leishmaniasis encompass long-term irregular fever, hepatosplenomegaly, pancytopenia, immunosuppression, etc. Symptoms in the initial stage are typically insidious, with the disease course potentially extending from 2 to 6 months or longer [1]. At present, the treatment of leishmaniasis is limited, and specific drugs (such as antimony and amphotericin B) have toxicity, resistance, and cost problems [3].
During chronic infections, the function of antigen-specific T cells is impaired and may even be deleted. Antigen-specific T cells exhibit weak effector function, poor recall response, and suboptimal antigen-independent homeostasis proliferation, known as depletion [4]. This phenomenon has been demonstrated in various models of chronic viral infection, including lymphocytic choriomeningitis virus (LCMV), human immunodeficiency virus (HIV), simian immunodeficiency virus (SIV), hepatitis B virus (HBV), and hepatitis C virus (HCV) [5,6]. Recent studies have reported that inhibitory receptors, particularly the programmed cell death protein 1 (PD-1)/programmed cell death 1 ligand 1 (PD-L1) pathway, play a pivotal role in regulating T cell exhaustion [7]. In acute infection models, T cells upregulate the expression of inhibitory receptors transiently upon activation. However, exhausted CD4+ and CD8+ T cells featured with sustained expression of these molecules [8]. Blocking this inhibitory receptor pathway, specifically the PD-1-PD-L1 interaction, rejuvenates exhausted CD8+ T cells, thereby diminishing pathogen burden [9,10,11].
Leishmaniasis is a typical chronic infectious disease, in which CD4+ and CD8+ T cells play major roles in host protection, but also due to long-term exposure of parasite antigens to the immune environment of the target organs, their ability to respond to infection is delayed. Joshi et al. found that blockade of B7-H1 (PD-L1) elevated the survival rate of dysfunctional CD8+ T cells and significantly reduced the splenic parasite burden, consequently promoting protection against L. donovani infections [12]. PD-1 blockade was able to restore the antigen-dependent lymphoproliferative response and regulate production of IL-4, IL-10, and NO in canines infected with L. infantum [13]. Blocking PD-L1 in a murine model infected with L. donovani led to enhanced T cell proliferation and weakened autophagy, thus promoting clearance of the parasite [14]. Despite numerous studies demonstrating that blocking the PD-1/PD-L1 pathway enhances the host’s anti-leishmaniasis response, the underlying mechanisms remain inadequately understood. While immune checkpoint therapy has been extensively investigated in oncology, it is crucial to explore potential similarities and differences in the mechanisms of action between immune checkpoint inhibitors and chronic parasitic infections. Addressing these questions will significantly contribute to the targeted development of immune checkpoint therapies for visceral leishmaniasis.
In this study, we investigated the parasite burdens in the liver and spleen, serum-specific IgG, IgG1, and IgG2a antibody titers, and hepatic pathological alterations to evaluate the progression of visceral leishmaniasis following the blockade of the PD-1/PD-L1 pathway using anti-PD-1 antibodies. Quantitative PCR was employed to detect genes associated with T cell exhaustion, apoptosis, activation, and inflammation in both the liver and spleen. Liver transcriptome and Protein-Protein Interaction (PPI) network were performed to find differently regulated pathways and identify hub genes involved in potential mechanisms underlying the efficacy of PD-1 immune checkpoint therapy in alleviating disease. Furthermore, we selected Atf3 for overexpression, as it exhibited the most significant change among the hub genes following in vitro infection.
In this study, 6- to 8-week-old female BALB/c mice, all specific pathogen-free (SPF) grade, were purchased from Dossy Experimental Animals Co., Ltd. (Chengdu, China). All mice were acclimatized for 7 days before the experiment and maintained under standard conditions (temperature 22 ± 2°C, relative humidity 50% ± 10%, 12 h light/12 h dark cycle, with free access to food and water). For model establishment, mice were randomly divided into three groups with the individual mouse as the experimental unit: Normal control group (Group N), Infection group (Group I), and PD-1 blockade group (Group B). Each group contained 3 biological replicates. A total of 9 experimental mice were used in this study. General condition, including mental state, food and water intake, and overall health, was observed and recorded daily. Body weight was measured once per week at a fixed time. At the experimental endpoint, mice were anesthetized by intraperitoneal injection of 1% sodium pentobarbital solution (50 mg/kg), followed by blood collection from the retro-orbital venous plexus. After blood collection, euthanasia was performed by cervical dislocation, in strict compliance with laboratory animal ethical guidelines. The animal experiment protocol was approved by the Medical Ethics Committee of Sichuan University (Approval No. K2022014). All procedures followed the 3R principles and relevant guidelines for laboratory animal welfare.
2.2 Culture of Parasites and In Vivo Infections
Promastigotes of Leishmania donovani (MHOM/CN/90/9044, L. 9044) were obtained from the Department of Pathogenic Biology, West China School of Basic Medical Sciences and Forensic Medicine (No. 17, section 3, RenMin south road, Chengdu, China). Promastigotes were maintained in Medium 199 (M199) medium (L640KJ, Basalmedia Technologies, Shanghai, China) supplemented with 10% fetal bovine serum (FBS) (Zeta Life, Menlo Park, CA, USA) and 1% penicillin-streptomycin (Gibco, Thermo Fisher Scientific, Waltham, MA, USA). Mice in groups I and B were infected via the intraperitoneal route with 5 × 10⁷ stationary-phase promastigotes per mouse and monitored daily for signs of illness and survival [15]. Mice were euthanized at the 7th week post-infection (Fig. 1A).

Figure 1: Schematic representation of timelines for infection and anti-PD-1 antibody administration in BALB/c mice, parasite load of spleen and liver, liver inflammatory lesion, and serum anti-Leishmania total IgG, IgG1, and IgG2a antibodies. (A) Timeline for infection and anti-PD-1 antibody administration. (B) Comparative parasite burden quantification in spleen and liver tissues of infected groups. Data are presented as mean ± SEM. ***p < 0.001, Mann-Whitney U test. (C) Histopathological quantification of granulomas in hepatic tissue at 7 weeks post-infection (wpi). Data are presented as mean ± SEM. *p < 0.05, Mann-Whitney U test. (D) Representative H&E-stained liver sections, images a, b, and c were taken at 10× objective lens (scale bar = 200 μm), and images d, e, and f were taken at 40× objective lens (scale bar = 50 μm). The area indicated by the arrow is the lesion in the liver pathological section, and the boxed region is shown at a higher magnification for emphasis. (E) Serum anti-Leishmania IgG, IgG1, and IgG2a antibody titers determined by ELISA. Data are presented as mean ± SEM. *p < 0.05, **p < 0.01, ***p < 0.001, two-way ANOVA.
2.3 In Vivo Treatment of the Antibody
In vivo MAb anti-mouse PD-1 (CD279) antibody (BE0146, BioXcell, Lebanon, NH, USA) was administered intraperitoneally at 100 μg/mouse (dissolved in 0.1 mL of normal saline) in four divided doses at 35, 38, 41 and 44 dpi (Fig. 1A). The timing of anti-PD-1 antibody injections in this study was determined based on the reported period in experimental mouse models of leishmaniasis when liver and spleen parasite loads enter a plateau (the chronic phase) [16], as well as on previously published data from our laboratory. During this period, Leishmania infection has progressed to the chronic stage, and elevated expression of CD279 (PD-1) is observed on the surface of splenic T lymphocytes [17].
Serum, liver, and spleen samples were obtained after euthanization. Liver tissues were fixed in 10% neutral buffered formalin for 50 min, embedded in paraffin, prepared into pathological sections, and then stained with hematoxylin and eosin (H&E) (G1120, Solarbio, Beijing, China) to observe the pathological changes under the optical microscope (CX43RF, Olympus, Tokyo, Japan).
2.5 ELISA of Serum IgG, IgG1, and IgG2a Anti-Leishmania Antibodies
Serum titers of total immunoglobulin G (IgG), IgG1, and IgG2a antibodies were measured using an indirect enzyme-linked immunosorbent assay (ELISA). Soluble Leishmania antigen (SLA) was prepared by subjecting Leishmania promastigotes to five freeze-thaw cycles in liquid nitrogen, followed by centrifugation to collect the supernatant. The protein concentration of the SLA was determined using a BCA Protein Assay Kit (P0010, Beyotime, Shanghai, China). SLA (2 μg/mL, 100 μL/well) was used to coat 96-well plates overnight at 4°C (coating buffer: 1.59 g Na2CO3 and 2.93 g NaHCO3 dissolved in 800 mL deionized water, pH adjusted to 9.6 with 1 mol/L NaOH, and then brought to a final volume of 1000 mL). The plates were blocked with 1% BSA solution for 2 h at 37°C [18]. Serum samples were serially diluted twofold from 1:125 to 1:4000. Horseradish peroxidase-conjugated goat anti-mouse IgG (SA00001-1-A, Proteintech, Wuhan, China, 1:8000), IgG1 (SA00012-1, Proteintech, Wuhan, China, 1:2000), and IgG2a monoclonal antibodies (SA00012-2, Proteintech, Wuhan, China, 1:2000) were used as secondary antibodies. The absorbance was measured at 450 nm (SpectraMax 190, Molecular Device, San Jose, CA, USA).
2.6 Detection of Gene Expression and Parasite Load
In accordance with the manufacturer’s instructions, we extracted RNA from spleens, livers, and RAW264.7 cells using RNAeasy™ Animal RNA Isolation Kit (R0024, Beyotime, Shanghai, China) and then reverse transcribed the RNA into cDNA using BeyoRT™II First Strand cDNA Synthesis Kit (D7168S, Beyotime, Shanghai, China). Real-time PCR was performed with SYBR green (D7501, Beyotime, Shanghai, China) to detect the expression of T cell exhaustion genes (Pdcd1, Cd274, Btla, Lag3, Tim3, Ctla4, 2b4, Cd160), T cell activation genes (Trbc2, Cd28, Icos, Cd40l), apoptosis genes (Bax, Bcl2, Casp3), inflammation genes (Il4, Il10, Tnfa, Ifng, Nos2) and screened hub genes (Lck, Atf3, Irf4, Klrd1, Cxcl10), Gapdh was chosen as an internal control. Relative quantitation was calculated using the comparative 2(−∆∆Ct) method with the group N as a control. The contents of Leishmania 18S ribosomal RNA in spleen and liver tissues were detected by qPCR with SYBR green as a fluorescent dye to evaluate parasite load after infection. The RNA of 1 × 10⁷ Leishmania parasites was extracted and reverse-transcribed into cDNA. The Leishmania standard curve was built by detecting Leishmania 18S ribosomal RNA from 10-fold serial dilutions ranging from 1.38 × 10⁵ to 1.38 × 101 parasite cDNA. Finally, the Ct values of liver and spleen samples were taken into the standard curve to calculate the parasite load. All the primer sequences used in this study are provided in Table S1 [19].
Liver tissues were sent to Shanghai Personalbio Technology Co., Ltd. for transcriptome sequencing analysis. Transcriptome libraries were constructed after RNA extraction and purification. Next-generation sequencing (NGS) based on the Illumina HiSeq platform was applied for pair-end (PE) sequencing of these libraries. By comparing the high-quality data (Clean Data) screened from the raw data (Raw Data) with the reference genome (Mus musculus. GRCm39.dna.toplevel.fa), the expression of each gene was calculated. Differential expression of genes was analyzed by ‘DESeq’ (version 4.2.3). The transcripts with expression difference multiple |log2 fold change| > 1 and p < 0.05 were considered to be differentially expressed genes (DEGs). Venn diagrams were generated using the VennDiagram software (v1.8.2, 10.32614/CRAN.package.VennDiagram). Based on the results of differential analysis, the number of common and unique differentially expressed genes (DEGs) among each comparison group was calculated. Density distributions of gene expression levels were plotted using the ‘ggplot2’ package (v3.5, docs.ggplot2.org). The main purpose of this analysis is to visualize the overall distribution of gene expression levels, allowing for an intuitive observation of differences between samples. In accordance with the results above, expression differences, functional enrichment analysis (KEGG and GSEA), clustering analysis, and protein-protein interaction (PPI) network analysis of differentially expressed genes (DEGs) were further conducted. Gene Set Enrichment Analysis (GSEA) was performed using the GSEA software (accessible at http://www.gsea-msigdb.org/gsea/login.jsp, GSEA 4.2.3) to identify predefined gene sets that were significantly enriched in a coordinated manner between the experimental groups [20]. The enrichment of each gene set was quantified by the Normalized Enrichment Score (NES), which accounts for differences in gene set size and correlations between gene sets. A gene set was considered significantly enriched if it met the following criteria: |NES| > 1, p-value < 0.05, as recommended for discovery-based studies. A positive NES indicates coordinate up-regulation or activation of the gene set in the designated phenotype, whereas a negative NES indicates coordinate down-regulation or suppression. Search Tool for the Retrieval of Interacting Genes (STRING, https://cn.string-db.org/) was used to conduct PPI network; the resulting networks were then imported into Cytoscape (https://cytoscape.org/, version 3.9.1) for visualization and further analysis [21]. To identify densely connected regions, the molecular complex detection (MCODE) plugin was used with the following parameters: node score cutoff = 0.2, k-core = 2, and max. Depth = 100. Hub genes within the most significant clusters were identified and ranked using the CytoHubba plugin, applying the DEGREE method. In this method, the degree of a node represents the number of connections it has within the PPI network. Genes with a higher degree are considered more central and are thus designated as hub genes due to their potential pivotal roles in the biological network.
Spleens were collected from each group and mechanically dissociated through a 70 μm cell strainer (Biologix, Camarillo, CA, USA) to prepare single-cell suspensions. Red blood cells (RBCs) were lysed using RBC lysis buffer (BL503B, Biosharp, Hefei, China). Cell viability was assessed with trypan blue (C0040, Solarbio, Beijing, China) staining. Freshly isolated splenocytes were counted and adjusted to a concentration of 2 × 10⁷ cells/mL in PBS (1×, pH = 7.2) containing 10% FBS. For staining, 100 μL of cell suspension was incubated with the following fluorochrome-conjugated antibodies (all used at 10 μg/mL): APC anti-mouse CD4 (clone GK1.5, 553051, BD, Franklin Lakes, NJ, USA), PerCP-Cy™5.5 anti-mouse CD3ε (clone 145-2C11, 551163, BD, Franklin Lakes, NJ, USA), FITC anti-mouse CD8a (clone 53-6.7, 553030, BD, Franklin Lakes, NJ, USA), and PE anti-mouse CD279 (clone J43, 551892, BD, Franklin Lakes, NJ, USA). After incubation for 30 min at 4°C in the dark, cells were washed and resuspended in 500 μL of 10% FBS-PBS. Samples were analyzed on a flow cytometer (FACS Celesta, BD, Franklin Lakes, NJ, USA) and data were processed using FlowJo software (v10.8.1, BD, Franklin Lakes, NJ, USA). Lymphocytes were gated based on Fig. S1.
The mouse Atf3 gene was amplified from Atf3 (NM_007498.3)-pCMV-3 × Myc-SV40-Neo tool plasmid purchased from Hangzhou Youkang Biotechnology Co., Ltd. (Hangzhou, China), using PCR as a template. PCR amplification conditions were: 98°C for 2 min, 98°C for 10 s, 60°C for 10 s, 72°C for 20 s, 72°C for 5 min, 30 cycles. PCR amplification products were ligated to the vector pcDNA3.1-3 × Flag-C plasmid using seamless cloning (forward primer: 5′-ccaagctggctagttaagcttGCCACCATGATGCTTCAACATCCAGGCC-3′, reverse primer: 5′-gaagggccctctagactcgagGCTCTGCAATGTTCCTTCTTTTATC-3′). The ligated product was transformed into E. coli DH5α and incubated overnight at 37°C. Positive clones grown in LB medium (1 g tryptone, 0.5 g yeast extract, 1 g NaCl, and 1.5 g agar were added to distilled water to a final volume of 100 mL. The mixture was autoclaved at 121°C for 20 min, and then poured into plates after cooling) were sent to Tsingke Biotechnology Co., Ltd. (Beijing, China) for sequencing to confirm correct sequence identity.
2.10 Cell Culture, Transfection, and Validation of Overexpression
RAW264.7 cells, obtained from the Cell Bank of Guangzhou (Guangzhou, China), the cell line has undergone rigorous species identification, STR profiling, and certification confirming the absence of mycoplasma contamination (sample ID: IMMO-251699; testing agency: Xiamen IMMO Biotechnology Co., Ltd., Xiamen, China). Cells were maintained in Dulbecco’s modified Eagle’s medium (DMEM, C11995500BT, Gibco, Thermo Fisher Scientific, Waltham, MA, USA). The medium contained 10% fetal bovine serum (FBS, Zeta Life, Menlo Park, CA, USA), 100 μg/mL streptomycin, and 100 U/mL penicillin (HyClone, Marlborough, MA, USA). Cells were kept at 37°C in a 5% CO2 atmosphere. One day before transfection, the cells were seeded in 24-well plates at a density of 5 × 10⁴ cells per well to reach 70–90% confluence at the time of transfection. Before transfection, the medium was replaced with 500 μL of DMEM without antibiotics or FBS. For transfection, 0.8 μg of DNA (pcDNA3.1 or pcDNA3.1-Atf3) and 2 μL of lipofectamine 2000 reagent were separately diluted in 50 μL of serum- and antibiotic-free DMEM and left for 5 min at room temperature. The diluted Lipofectamine 2000 (11668030, Thermo Fisher Scientific, Waltham, MA, USA) was then combined with the DNA dilution and incubated at room temperature for 20 min to allow complex formation. 100 μL of the DNA-lipofectamine complex was added to each well and mixed gently. Cells were incubated with the complex for 6 h at 37°C in a CO2 incubator. Finally, the medium was replaced with complete DMEM. Transfection efficiency was assessed at 24 h and 48 h using an immunofluorescence assay. The overexpression of ATF3 at both mRNA and protein levels was evaluated by qPCR and Western blot, respectively.
RAW264.7 cells were washed with pre-chilled PBS and then lysed with RIPA lysis buffer (P0013C, Beyotime, Shanghai, China) supplemented with phosphatase inhibitor cocktail (HYK0010, MCE, Princeton, NJ, USA) to extract proteins. Protein concentration was determined using a BCA assay kit (P0010, Beyotime, Shanghai, China), and samples were adjusted to ensure equal protein loading per lane. Proteins were subsequently separated by polyacrylamide gel electrophoresis and transferred onto a PVDF membrane (IPVH00010, Millipore, Darmstadt, Germany). The membrane was blocked with 5% BSA solution for 2 h at room temperature and subsequently washed. Following blocking, the membrane was incubated overnight with an anti-Flag-tag primary antibody (20543-1-AP, 1:10,000, Proteintech, Wuhan, China), washed, and then incubated for 1 h with a goat anti-mouse IgG secondary antibody (SA00001-1-A, Proteintech, Wuhan, China, 1:10,000) for target protein detection.
RAW264.7 cells were seeded at a density of 2 × 10⁵ cells/well. Transfection of pcDNA3.1 and the recombinant plasmid carrying the Atf3 gene was performed using Lipofectamine 2000. At 24 and 48 h post-transfection, cell monolayers were collected, washed with PBS, and fixed with 4% paraformaldehyde (BL539A, Biosharp, Hefei, China). The cells were then permeabilized with 0.2% Triton X-100 (1139ML100, Biofroxx, Eching, Germany). After blocking nonspecific sites with PBS containing 10% goat serum for 30 min, the cells were incubated overnight at 4°C with mouse anti-Flag-tag antibody (20543-1-AP, 1:200, Proteintech, Wuhan, China). Following three washes with PBS, a fluorescent goat anti-mouse IgG antibody (SA00003-2, 1:100, Proteintech, Wuhan, China) was applied and incubated for 1 h in the dark. After another three PBS washes, nuclei were stained with DAPI for 3 min. Images were finally acquired using a laser-scanning confocal microscope (LSM710, Zeiss, Oberkochen, Germany).
The normal control RAW264.7 cells and cells transfected with pcDNA3.1 or pcDNA3.1-Atf3 were seeded into 6-well plates at 5 × 10⁵ cells per well. These cells were then infected with Leishmania promastigotes at a multiplicity of infection of 1:15. For cell maintenance and infection, cells were cultured in DMEM supplemented with 10% FBS. Leishmania promastigotes were co-incubated with cells for 6, 12, and 24 h; the parasite inoculum was not washed off during the infection period.
Statistical analysis was done with GraphPad Prism 8.0 (GraphPad Software Inc., San Diego, CA, USA). Mann-Whitney U test, Unpaired t test, one-way ANOVA, and two-way ANOVA analysis of variance were used to analyze data from animal experiments. Data are presented as the mean ± the standard error of the mean (SEM). The statistical difference was designed as asterisks (*p < 0.05, **p < 0.01, ***p < 0.001).
3.1 Parasite Burden, Hepatic Histopathology Analysis, and Specific IgG, IgG1, and IgG2a Antibody Titers
First, we assessed parasite burden, liver tissue pathology, and humoral immune responses to evaluate the pathological progression of visceral leishmaniasis following PD-1 blockade. Flow cytometry was performed to detect PD-1 expression on the surface of splenic T cells, with the gating strategy shown in Fig. S1A. Flow cytometry revealed downregulation of PD-1 on CD8+ T cells, indicating successful blockade (Fig. S1B). A significant reduction of parasite burden in the spleen was observed following the administration of the anti-PD-1 antibody (reduction rate = 82.6%, p = 0.0002), while no notable difference was detected in the liver (Fig. 1B). Under optical microscopy, distinct pathological alterations were observed in the liver sections (Fig. 1(Da–f)). In comparison to group N, hepatic tissues from both Leishmania-infected mouse groups displayed pronounced ballooning degeneration of hepatocytes. This pathological feature was marked by the presence of numerous enlarged cells containing rarefied cytoplasm. Notably, these distended hepatocytes formed distinctive rosette-like structures, reminiscent of the histological patterns observed in chronic active hepatitis [22]. In group I, hepatic pathological lesions were mainly characterized by inflammatory cell infiltration, without distinct boundaries or structural features (Fig. 1(De)). In contrast, group B presented primarily with mature granulomatous tissue, which is featured by organized epithelioid macrophages and structured cellular architecture (Fig. 1(Df)). The development of mature granulomas represents a crucial mechanism for controlling parasitic infections within the liver [23]. Supporting this, Gutierrez et al. demonstrated that granulomas characterized by prominent multinucleated and epithelioid cells were correlated with enhanced in vitro recall responses and required lower drug dosages to achieve clinical cure in L. braziliensis infections [24]. Counting of mature granulomatous tissue across the entire pathological sections revealed that the number in group B was significantly higher than that in group I, indicating that PD-1 blockade contributes to superior parasite containment and control in the liver (Fig. 1C).
The OD values of anti-Leishmania total IgG, IgG1, and IgG2a antibodies in the serum of each group with different dilutions are shown in Fig. 1E. Under dilutions from 1:250 to 1:4000, the OD values of total IgG in group B were significantly higher than those in group I. Mice in group B presented higher OD values of both IgG1 and IgG2a antibody antibodies than those in group I under dilutions from 1:125 to 1:2000. These results demonstrate that the administration of PD-1 blockade in mice could effectively activate humoral immunity during visceral leishmaniasis.
3.2 Expression of T Cell Exhaustion, T Cell Activation, Apoptosis, and Inflammation Genes in Spleen and Liver
Next, we analyzed the expression of genes associated with T cell exhaustion, activation, apoptosis, and inflammation in the spleen and liver to assess the tissue-specific effects of PD-1 blockade in infected mice. The relative expression results of T cell exhaustion, T cell activation, apoptosis, and inflammation genes in spleen and liver are shown in Fig. 2. In the results of spleen, compared with the normal uninfected mice, the expression of Pdcd1, Cd160, Btla, and Icos was significantly up-regulated in the Leishmania-infected group. Inhibitory receptors are negative regulators that control autoreactivity and prevent the development of immunopathology. Although some of these receptors are transiently expressed on functional effector T cells during activation, the high and sustained expression of inhibitory receptors is a hallmark of exhausted T cells [25]. It has been previously reported that chronic infection induced by Leishmania promoted the upregulation of several inhibitory receptor genes, including Pdcd1 [13], Ctla4 [26], Cd160 [27], Tim3 and Lag3 [28], etc. On the one hand, the up-regulation of Pdcd1 and Cd160 after Leishmania infection in the results above supported previous studies; on the other hand, we found that Btla also increased significantly after infection compared with the control group, which might become a potential target for future research. Interestingly, expressions of Il4 (anti-inflammatory), Tnfa (pro-inflammatory), Ifng (pro-inflammatory), and Nos2 (pro-inflammatory), which have opposite roles in the development of inflammation, were all up-regulated in group B compared to group I. In the liver results, we still observed that the expression of Btla in the two groups after infection was significantly up-regulated compared with that in group N. However, in comparison with group I, the expressions of anti-inflammatory factors Il4, Il10 and pro-inflammatory factor Tnfa decreased in group B, which is opposite to the tendency in the spleen. These results indicated that chronic Leishmania infection could induce the expression of T cell exhaustion hallmark genes Cd160 in the spleen and Pdcd1 and Btla in both the spleen and liver. In the liver, although the pro-inflammatory factor Tnfa decreased after PD-1 blockade, the anti-inflammatory cytokine Il10 was down-regulated more, which was also consistent with the results of liver pathology showing more inflammatory cell aggregation in group B.

Figure 2: Relative expression levels of genes related to T cell activation, exhaustion, apoptosis, and cytokines in hepatic and splenic tissues. (A) Splenic gene expression levels. (B) Hepatic gene expression levels. In the bar charts, blue, red, and yellow represent the control group, infection group, and PD-1 blockade group, respectively. All genes were normalized to the normal group for calculation, with Gapdh used as the reference gene, and the relative expression levels were determined by the 2−∆∆Ct method. Data are presented as mean ± SEM, *p < 0.05, **p < 0.01, ***p < 0.001, one-way ANOVA.
3.3 Analysis and Clustering of Differentially Expressed Genes in Liver Transcriptome
Based on liver transcriptome data, we analyzed the distribution and clustering patterns of differentially expressed genes to lay the groundwork for subsequent pathway analysis. The quality of raw data sequenced from samples in each group was evaluated. Q20 and Q30 values of sequencing samples were more than 97% and 92%, respectively, meeting the requirements for subsequent data analysis. The gene expression patterns were basically consistent among all samples according to the FPKM density distribution and violin plots shown in Fig. 3A. Based on DEGs, all samples were clustered, and the results manifested well-clustered biological replicates of each group and the gene expressions differed significantly among groups (Fig. 3B). The Venn diagram showed no identical differentially expressed genes among the three groups. The largest number of DEGs was found between group N and group I, with 181 genes up-regulated and 154 genes down-regulated. Volcano plots showed the distributions of up- and down-regulated genes were roughly symmetrical in three comparisons of groups (Fig. 3C).

Figure 3: Gene distribution patterns and DEGs number in groups. (A) FPKM density distribution and violin plots for all samples. In violin plots, the horizontal line in the middle of the box is the median, the upper and lower edges of the box are 75%, and the upper and lower limits are 90%. (B) Clustering of DEGs. Each column is a sample. The horizontal represents different genes, with red and green representing high- and low-expressed genes, respectively. (C) Venn diagram, bar chart, and volcano plot of DEGs in groups compared pairwise.
3.4 KEGG Signaling Pathway and GSEA Analysis
Using KEGG and GSEA enrichment analyses, we systematically identified regulatory changes in liver immune pathways following PD-1 blockade. The enriched KEGG signaling pathways under Leishmania infection contained several immune-related pathways (Fig. 4), including cell adhesion molecules (p < 0.0001), B cell receptor signaling pathway (p < 0.0001), intestinal immune network for IgA production (p < 0.0001), NF-kappa B signaling pathway (p < 0.001) and neutrophil extracellular trap formation (p < 0.01), etc. Meanwhile, the results of GSEA pathway enrichment showed that the expression of immune-related gene sets of antigen processing and presentation, natural killer cell mediated cytotoxicity, cell adhesion molecules and B cell receptor signaling pathway in the group I was lower than that in the group N (Fig. 5). The results of these two enrichment analyses suggested that Leishmania infection can induce a relatively suppressed state of liver immunity in mice, which may be conducive to the long-term survival of the amastigotes in the target organ and the chronic outcome of the disease. After PD-1 blockade, liver KEGG enrichment was more in metabolism-related pathways, including steroid biosynthesis (p < 0.0001), steroid hormone biosynthesis (p < 0.0001), retinol metabolism (p < 0.0001), etc., and the influence on immune-related pathways was less than that in group I. The results of KEGG can be supplemented by the results of GSEA. In addition, GSEA results showed that group B also had down-regulation of primary immunodeficiency and B cell receptor signaling pathway compared with group N. From the comparison between the I and B, we noticed that the treatment with in vivo anti-PD-1 antibody could induce the alternation of PD-L1 expression and PD-1 checkpoint pathway in cancer (p < 0.05). KEGG analysis revealed that PD-1 blockade influenced several pathways closely associated with the anti-leishmanial response in infected mice, such as NK cell-mediated cytotoxicity (p < 0.05), cell adhesion molecules (p < 0.05), antigen processing and presentation (p < 0.05), and TLR signaling pathways (p < 0.05). The incorporation of KEGG results through GSEA analysis revealed that gene sets associated with NK cell-mediated cytotoxicity, antigen processing and presentation, neutrophil extracellular trap formation, and phagosome were significantly enriched in group B compared to group I. These findings indicated that blocking the PD-1/PD-L1 pathway might restore leishmanicide responses by rescuing certain suppressed pathways effective for killing the parasite.

Figure 4: KEGG enrichment analysis of differentially expressed genes. This plot shows KEGG pathways with significant enrichment. The degree of enrichment was measured by the gene ratio, adjusted p-value, and the number of genes enriched in the pathway. The greater the gene ratio is, the greater the degree of enrichment. A higher-log10(p.adj) value indicates stronger statistical significance of the pathway. The larger the bubble diameter in the figure, the more differentially expressed genes are enriched in the pathway.

Figure 5: GSEA analysis results of important signaling pathways. For GSEA, a pathway is considered significantly enriched when |NES| > 1 and p.adj < 0.05 as recommended by the Broad Institute for discovering trends [20].
3.5 Protein-Protein Interaction (PPI) Network Construction and Hub Gene Screening
To identify key hub genes and uncover core molecular targets of PD-1 blockade against Leishmania, we constructed protein-protein interaction (PPI) networks from differentially expressed genes. (Fig. 6). Using STRING, we mapped the genes from each cluster to specific KEGG pathways (Table 1). The regulatory properties of each cluster suggest the up- or down-regulation of the involved pathways. This analysis provides complementary evidence to the earlier KEGG and GSEA results and helps to more precisely identify hub genes. Hub gene clusters and scores of DEGs between group N and I were shown in Fig. 7A, with a total of 7 clusters. Clusters 1, 3, 4, and 6 were down-regulated; the others were up-regulated. The signaling pathways enriched by the down-regulated cluster 1 and 3 were basically consistent with the results of KEGG and GSEA analysis; thus, we assumed that a total of 30 hub genes in clusters 1 and 3 might play vital roles in Leishmania infection. Hub gene clusters of DEGs between group N and B are shown in Fig. 7B. There were 6 clusters, of which clusters 1, 2, 4, 5, and 6 were metabolism-related and up-regulated, cluster 3 was down-regulated and consistent with KEGG and GSEA enrichment results. As shown in Fig. 7C, five hub gene clusters were enriched and all up-regulated in the comparison between group I and B. Gene Gm11127, Lck, and Klrd1 in cluster 2 were chosen as hub genes in the interaction of infection and PD-1 blockade, due to the signaling pathways enriched by this cluster coinciding with the results of KEGG and GSEA. Although the three genes in cluster 5 were not enriched in any specific KEGG pathway, they were nevertheless selected as hub genes due to their well-established importance and their observed enrichment in the Wikipathway “Type II interferon signaling (IFNG)” (WP1253). Thus, Cxcl10, Atf3, and Irf4 were also identified as hub genes.

Figure 6: PPI Network Diagram of Differentially Expressed Genes (DEGs) in the Three Comparison Groups. Wherein, red indicates that the gene is upregulated in the latter group relative to the former group within the comparison group, while blue indicates that the gene is downregulated in the latter group relative to the former group. The size of each gene node corresponds to its score calculated by the DEGREE algorithm; higher scores correspond to larger nodes, which indicates higher degree centrality of the gene and greater importance in the corresponding protein network.
Table 1: KEGG/Wiki signaling pathways enriched by hub gene clusters.
| Groups | Cluster | Regulation | KEGG/Wiki Pathway | Strength |
|---|---|---|---|---|
| N vs. I | Cluster 1 | Down | Primary immunodeficiency (mmu05340) B cell receptor signaling pathway (mmu04662) NF-kappa B signaling pathway (mmu04064) Intestinal immune network for IgA production (mmu04672) Hematopoietic cell lineage (mmu04640) | 2.23 2.07 1.87 1.87 1.69 |
| Cluster 2 | Up | Pyruvate metabolism (mmu00620) Biosynthesis of unsaturated fatty acids (mmu01040) Propanoate metabolism (mmu00640) PPAR signaling pathway (mmu03320) Adipocytokine signaling pathway (mmu04920) | 2.45 2.21 2.2 2.07 1.93 | |
| Cluster 3 | Down | Primary immunodeficiency (mmu05340) Hematopoietic cell lineage (mmu04640) Cell adhesion molecules (mmu04514) Epstein-Barr virus infection (mmu05169) Human immunodeficiency virus 1 infection (mmu05170) | 1.92 1.91 1.45 1.31 1.3 | |
| Cluster 4 | Down | Proteoglycans in cancer (mmu05205) | 1.68 | |
| Cluster 5 | Up | Primary bile acid biosynthesis (mmu00120) Terpenoid backbone biosynthesis (mmu00900) PPAR signaling pathway (mmu03320) Metabolic pathways (mmu01100) | 2.69 2.58 2.01 1.16 | |
| Cluster 6 | Down | Morphine addiction (mmu05032) GABAergic synapse (mmu04727) Circadian entrainment (mmu04713) Cholinergic synapse (mmu04725) Glutamatergic synapse (mmu04724) | 2.23 2.23 2.2 2.13 2.12 | |
| Cluster 7 | Up | N/A | ||
| N vs. B | Cluster 1 | Up | Steroid biosynthesis (mmu00100) Pyruvate metabolism (mmu00620) Terpenoid backbone biosynthesis (mmu00900) Butanoate metabolism (mmu00650) Propanoate metabolism (mmu00640) | 2.57 2.1 2.03 1.94 1.86 |
| Cluster 2 | Up | N/A | ||
| Cluster 3 | Down | Primary immunodeficiency (mmu05340) Hematopoietic cell lineage (mmu04640) B cell receptor signaling pathway (mmu04662) Cell adhesion molecules (mmu04514) Epstein-Barr virus infection (mmu05169) | 2.15 2.13 1.82 1.68 1.54 | |
| Cluster 4 | Up | Ascorbate and aldarate metabolism (mmu00053) Pentose and glucuronate interconversions (mmu00040) Retinol metabolism (mmu00830) Porphyrin and chlorophyll metabolism (mmu00860) Steroid hormone biosynthesis (mmu00140) | 2.51 2.41 2.38 2.33 2.31 | |
| Cluster 5 | Up | N/A | ||
| Cluster 6 | Up | Fatty acid metabolism (mmu01212) AMPK signaling pathway (mmu04152) Metabolic pathways (mmu01100) | 2.38 2.06 1.16 | |
| I vs. B | Cluster 1 | Up | N/A | |
| Cluster 2 | Up | Graft-versus-host disease (mmu05332) Antigen processing and presentation (mmu04612) Natural killer cell-mediated cytotoxicity (mmu04650) Human T-cell leukemia virus 1 infection (mmu05166) | 2.49 2.3 2.11 1.8 | |
| Cluster 3 | Up | Circadian rhythm (mmu04710) Circadian entrainment (mmu04713) | 2.69 2.2 | |
| Cluster 4 | Up | Retinol metabolism (mmu00830) Steroid hormone biosynthesis (mmu00140) Chemical carcinogenesis (mmu05204) Metabolic pathways (mmu01100) | 2.38 2.23 2.18 2.16 | |
| Cluster 5 | Up | Type II interferon signaling (IFNG) (WP1253) | 2.67 |

Figure 7: Protein-protein interaction (PPI) network clusters of differentially expressed genes. (A) Clusters of genes were significantly altered in Group I compared to Group N. (B) Clusters of genes were significantly altered in Group B compared to Group N. (C) Clusters of genes were significantly altered in Group B compared to Group I. For each comparison, node colors indicate the direction of gene expression change in the latter group relative to the former group: red nodes represent up-regulated genes, and blue nodes represent down-regulated genes. Specifically, in the N vs. I comparison, red/blue indicates up/down-regulation in the I group versus the N group; in the N vs. B comparison, red/blue indicates up/down-regulation in the B group versus the N group; and in the I vs. B comparison, red/blue indicates up/down-regulation in the B group versus the I group. The size of each node is proportional to its DEGREE score. Each gene cluster can be enriched into KEGG pathways with different functions (Table 1).
3.6 Reduced Parasite Invasion in Atf3-Overexpressed RAW264.7
Based on transcriptome screening results, we hypothesized that Atf3 regulates macrophage resistance to Leishmania infection. This was tested by constructing Atf3-overexpressing RAW264.7 cells and assessing their effects on parasite infection rate and intracellular load. First of all, to validate the results of transcriptomic screening, we performed in vitro infection in RAW264.7 cells and examined the expression of five hub genes, excluding Gm11127 (predicted) (Fig. 8A). Among these, Atf3 showed the most pronounced changes and was significantly up-regulated at 6, 12, and 24 h post-infection compared to the control group. Therefore, we selected Atf3 for subsequent overexpression construction. During pathogen infection, ATF3 can modulate the host’s ability to clear pathogens by regulating inflammatory factors, chemokines [29], and the activation of signaling in response to PAMPs and PRRs [30]. Research on the specific role of this gene and its impact on visceral leishmaniasis remains very limited. Successful overexpression of Atf3 in RAW264.7 cells was confirmed by qPCR, Western blot (Fig. 8B) and immunofluorescence assays (Fig. 8C). Compared to cells transfected with pcDNA3.1, Atf3-overexpressed cells showed significantly reduced infection rates at 12 h and 24 h post-infection with Leishmania. At the 12 h time point, the average number of intracellular parasites was also markedly lower in the Atf3-overexpressed group than in the control group (Fig. 8D).

Figure 8: Atf3-overexpression alleviates intracellular Leishmania infection in RAW264.7 cells. (A) Expressions of hub genes in RAW264.7 post-infection, data are presented as mean ± SEM. *p < 0.05, **p < 0.01, ***p < 0.001, Unpaired t test. (B) Atf3-overexpression in RAW264.7 cells was validated by qPCR and Western blot, data are presented as mean ± SEM. ***p < 0.001, one-way ANOVA. (C) Immunofluorescence was employed at 24 and 48 h post-transfection to assess intracellular protein expression. (D) Infection rate and average number of intracellular Leishmania at 6, 12, and 24 h post-infection with Leishmania in each group.
The interaction between PD-1 and its ligand PD-L1 enables Leishmania to evade host immune clearance, resulting in chronic infection; conversely, blockade of the PD-1/PD-L1 axis enhances anti-leishmanial T cell responses [31]. In this study, we evaluated changes in parasite burden, hepatic pathology, and systemic humoral immunity following PD-1 blockade in a murine model of visceral leishmaniasis. We further analyzed the relationships among T cell exhaustion, activation, apoptosis, and inflammatory mediators under PD-1/PD-L1 inhibition. The therapeutic potential of PD-1/PD-L1 blockade was mechanistically explored using hepatic transcriptome profiling, followed by pathway analyses to identify DEGs, enriched signaling pathways, and hub genes.
Under physiological conditions, PD-1 expression is rapidly induced upon T cell activation and maintained at moderate levels [32]. In contrast, chronic infection is associated with markedly elevated PD-1 expression compared with functional effector or memory CD8+ T cells [33]. Consistent with this, qPCR analysis of spleen tissue revealed significantly higher PD-1 expression in both infected groups than in group N, indicating that prolonged exposure to Leishmania antigens induces PD-1 upregulation. Although sustained PD-1 expression is generally driven by continuous epitope recognition, residual PD-1 expression has been reported even after antigen clearance [34,35]. This may account for the absence of a significant difference in PD-1 levels between groups I and B, despite the marked reduction in splenic parasite burden following PD-1 blockade.
Serological analysis showed that IgG, IgG1, and IgG2a titers were significantly elevated in group B compared with group I, indicating an enhanced systemic humoral response. In contrast, qPCR revealed distinct cytokine profiles in the liver and spleen, reflecting organ-specific immune regulation. In the spleen, group B displayed increased expression of the activation markers TNF-α, IFN-γ, and iNOS, which enhance nitric oxide (NO) and reactive oxygen species (ROS) production in infected macrophages [36], thereby promoting efficient elimination of intracellular amastigotes [37]. Accordingly, anti-PD-1 treatment markedly reduced splenic parasite burden by reversing T cell exhaustion and strengthening anti-leishmanial immunity. Notably, splenic IL-4 transcription was also increased following PD-1 blockade, despite IL-4 being traditionally associated with counter-protective type 2 responses. However, accumulating evidence indicates that IL-4 does not exacerbate murine visceral leishmaniasis. Alexander et al. demonstrated that IL-4-deficient BALB/c mice infected with L. donovani responded poorly to sodium stibogluconate treatment and harbored higher parasite burdens than wild-type mice, accompanied by reduced IFN-γ mRNA in splenocytes and lower serum IFN-γ levels [38]. Similarly, Stager et al. reported increased parasite loads and diminished serum IFN-γ in IL-4- or IL-4 receptor α-deficient mice [39]. These findings suggest that IL-4 contributes to effective anti-leishmanial immunity, potentially through regulation of IFN-γ production. Moreover, Th2 responses can be induced independently of IL-4, and under certain conditions, IL-4 can prime IL-12 production and promote type 1 immunity [40]. During immune checkpoint therapy, additional inhibitory pathways may also be reactively up-regulated through negative feedback mechanisms [41], suggesting that IL-4 induction may reflect compensatory regulation following effective PD-1 blockade. Consistent with this interpretation, Murray et al. showed that IL-10 knockout mice or wild-type mice treated with anti-IL-10 antibody exhibited accelerated granuloma formation, rapid parasite clearance, and no excessive tissue damage [42]. In line with these observations, anti-PD-1 treatment in the present study reduced hepatic IL-10 transcription and increased granuloma numbers. IL-4 and IL-10 are key mediators of an M2-polarizing milieu, which has been implicated in parasite containment [43]; their down-regulation likely contributed to improved localization of amastigotes in the livers of group B. During early infection, TNF-α coordinates granuloma formation by activating macrophages and orchestrating immune cell recruitment [44]. However, excessive TNF-α impairs host resistance and granuloma development, indicating that moderate TNF-α levels are critical for effective resolution of hepatic infection [44].
Integrated KEGG and GSEA analyses showed that group I exhibited broad down-regulation of immune-related pathways, including antigen processing and presentation, cell adhesion molecules, B cell receptor signaling, and neutrophil extracellular trap (NET) formation, indicating systemic immunosuppression and immune exhaustion during chronic L. donovani infection. This interpretation was supported by increased expression of exhaustion-associated genes detected by qPCR. Suppression of the B cell receptor pathway was consistent with the relatively limited increase in parasite-specific antibodies in group I compared with group N, while impaired cell adhesion molecule pathways may underlie the attenuated cytokine responses observed after infection [45]. Following PD-1 blockade, multiple compromised immune pathways were restored, notably antigen processing and presentation, NK cell–mediated cytotoxicity, NET formation, and phagosome pathways. Protein–protein interaction analysis identified five clusters enriched between groups B and I. Among them, Cluster 2 was strongly associated with immune function and contained Klrd1, Lck, and Gm11127. Klrd1 encodes CD94, an NK cell receptor that pairs with inhibitory (NKG2A) or activating (NKG2C/E) subunits to sense changes in MHC class I expression and regulate immune homeostasis. In particular, the CD94/NKG2C complex recognizes MHC-I–associated peptides and transduces activating signals via DAP12 to promote NK cell cytotoxicity during infection or cellular stress [46]. Lck is a key regulator of T cell receptor signaling, mediating downstream activation of pathways such as MAPK and NF-κB following antigen recognition, and enhancing TCR–MHC interactions through cooperation with CD4 or CD8 co-receptors [47]. Gm11127, a predicted MHC class I-related gene, may facilitate NK cell–mediated antigen recognition and innate immune activation, although its precise function requires further investigation. These genes were enriched in antigen processing and presentation and NK cell–mediated cytotoxicity pathways, consistent with KEGG and GSEA results. Although genes in Cluster 5 were not enriched in specific KEGG pathways, Cxcl10, Atf3, and Irf4 were identified as hub genes based on their biological relevance and enrichment in the Wikipathway “Type II interferon signaling (IFNG)” (WP1253). Together, these six genes may represent key mediators of PD-1 blockade efficacy in murine visceral leishmaniasis, acting through enhanced NK cell cytotoxicity and type II interferon signaling. Given the regulatory role of Atf3 in cytokine production, chemokine expression, and pathogen recognition during infection [29,30], and its limited characterization in visceral leishmaniasis, we generated an Atf3-overexpressing RAW264.7 macrophage cell line. Atf3-overexpression significantly reduced both infection rate and intracellular parasite burden, indicating a negative effect on parasite survival and infectivity. This phenotype was consistent with the reduced parasite loads observed in vivo, suggesting that PD-1 blockade may enhance anti-Leishmania immunity, at least in part, through Atf3. Notably, ATF3 has been reported to exert context-dependent effects in infectious diseases, either promoting or restricting host defense depending on the pathogen, model system, and experimental conditions [29]. Saha et al. reported that NRF2-induced ATF3 expression promoted parasite survival in L. donovani infection, and ATF3 silencing reduced parasite burden [48], apparently contradicting our findings. We propose that this discrepancy reflects differences in Leishmania genetic backgrounds and experimental parameters. Our laboratory experience indicates that even different L. donovani substrains can elicit distinct immune responses and signaling profiles in the same cell line or mouse strain, and variations in infection ratio or duration can substantially alter host stress and immune regulatory networks, including ATF3 responses. Therefore, the inhibitory effect of ATF3 overexpression on parasite load observed here does not contradict previous reports, but instead highlights an additional, context-specific role of ATF3, underscoring its complex regulatory function in host–pathogen interactions.
Although this study demonstrates the therapeutic potential of PD-1 blockade in murine visceral leishmaniasis, several limitations warrant consideration. First, while the sample size was sufficient to detect statistically significant phenotypic and transcriptomic trends, larger cohorts in future validation studies would improve statistical power and generalizability. Second, despite the use of qPCR, RNA-seq, and flow cytometry to assess global immune responses after PD-1 blockade, direct functional validation of key leishmanicidal cell populations, particularly T cells and macrophages, was not performed. Such assays will be essential for more precise and mechanistic dissection in future studies. Third, given the limited efficacy and resistance liability of current first-line treatments, including amphotericin B and antimonials, evaluating whether PD-1-based immunotherapy can synergize with conventional drugs represents a promising avenue for translational research. Finally, parasite burdens remained relatively low at the seven-week time point. To establish more robust and consistent infection models, future studies should consider methodological refinements, such as intravenous inoculation and the use of higher-virulence parasite strains.
This study demonstrated that PD-1 blockade effectively reduced Leishmania donovani infection in mice. The diminished parasite burden and elevated antibody production provide insights that may inform future translational research of immune checkpoint blockade (ICB) to counteract infection-associated immunosuppression. Transcriptomic and pathway analyses revealed that PD-1 inhibition partially restored immune pathways suppressed during chronic infection, including NK cell-mediated cytotoxicity, antigen processing and presentation, and neutrophil extracellular trap formation, while identifying Klrd1, Lck, Gm11127, Cxcl10, Atf3, and Irf4 as hub genes linked to immune recovery. Paradoxically, hepatic cytokine profiles showed reduced pro- and anti-inflammatory signals post-treatment, suggesting complex immune regulation and sophisticated parasite strategy. This work advances understanding of checkpoint biology in parasitic infections and provides a promising insight for translating ICB strategies into clinical interventions for neglected tropical diseases.
Acknowledgement:
Funding Statement: This work was supported by the National Natural Science Foundation of China to Jinlei He [Grant number: 82102425] and the Sichuan Science and Technology Program to Jinlei He [Grant number: 2024NSFSC1756].
Author Contributions: The authors confirm their contribution to the paper as follows: conceptualization, Jinlei He and Jianping Chen; methodology, Xuechun Liao, Xiaoxiao Chen and Shulan Wei; software, Xuechun Liao and Jinlei He; validation, Qiong Li and Yanqin Zhao; formal analysis, Xuechun Liao; investigation, Qi Zhou and Yuying Xiao; resources, Jinlei He; data curation, Shulan Wei and Qiong Li; writing—original draft preparation, Xuechun Liao and Xiaoxiao Chen; writing—review and editing, Jinlei He and Jianping Chen; visualization, Xuechun Liao; supervision, Jianping Chen; project administration, Jinlei He and Jianping Chen; funding acquisition, Jinlei He. All authors reviewed and approved the final version of the manuscript.
Availability of Data and Materials: The raw sequence data reported in this paper have been deposited in the Genome Sequence Archive in National Genomics Data Center, China National Center for Bioinformation/Beijing Institute of Genomics, Chinese Academy of Sciences (GSA: CRA033657) that are publicly accessible at https://ngdc.cncb.ac.cn/gsa.
Ethics Approval: The animal experiments in this study were approved by the Sichuan University Medical Ethics Committee (Approval Number: K2022014).
Conflicts of Interest: The authors declare no conflicts of interest.
Supplementary Materials: The supplementary material is available online at https://www.techscience.com/doi/10.32604/biocell.2026.077240/s1.
References
1. Pareyn M , Alves F , Burza S , Chakravarty J , Alvar J , Diro E , et al. Leishmaniasis. Nat Rev Dis Primers. 2025; 11: 81. doi:10.1038/s41572-025-00663-w. [Google Scholar] [CrossRef]
2. Montaner-Angoiti E , Llobat L . Is leishmaniasis the new emerging zoonosis in the world? Vet Res Commun. 2023; 47( 4): 1777– 99. doi:10.1007/s11259-023-10171-5. [Google Scholar] [CrossRef]
3. Mathison BA , Bradley BT . Review of the clinical presentation, pathology, diagnosis, and treatment of leishmaniasis. Lab Med. 2023; 54( 4): 363– 71. doi:10.1093/labmed/lmac134. [Google Scholar] [CrossRef]
4. Baessler A , Vignali DAA . T cell exhaustion. Annu Rev Immunol. 2024; 42: 179– 206. doi:10.1146/annurev-immunol-090222-110914. [Google Scholar] [CrossRef]
5. Blackburn SD , Shin H , Haining WN , Zou T , Workman CJ , Polley A , et al. Coregulation of CD8+ T cell exhaustion by multiple inhibitory receptors during chronic viral infection. Nat Immunol. 2009; 10( 1): 29– 37. doi:10.1038/ni.1679. [Google Scholar] [CrossRef]
6. Wherry EJ , Blattman JN , Murali-Krishna K , van der Most R , Ahmed R . Viral persistence alters CD8 T-cell immunodominance and tissue distribution and results in distinct stages of functional impairment. J Virol. 2003; 77( 8): 4911– 27. doi:10.1128/jvi.77.8.4911-4927.2003. [Google Scholar] [CrossRef]
7. Lin X , Kang K , Chen P , Zeng Z , Li G , Xiong W , et al. Regulatory mechanisms of PD-1/PD-L1 in cancers. Mol Cancer. 2024; 23( 1): 108. doi:10.1186/s12943-024-02023-w. [Google Scholar] [CrossRef]
8. Jubel JM , Barbati ZR , Burger C , Wirtz DC , Schildberg FA . The role of PD-1 in acute and chronic infection. Front Immunol. 2020; 11: 487. doi:10.3389/fimmu.2020.00487. [Google Scholar] [CrossRef]
9. Dong Y , Li X , Zhang L , Zhu Q , Chen C , Bao J , et al. CD4+ T cell exhaustion revealed by high PD-1 and LAG-3 expression and the loss of helper T cell function in chronic hepatitis B. BMC Immunol. 2019; 20( 1): 27. doi:10.1186/s12865-019-0309-9. [Google Scholar] [CrossRef]
10. Palmer BE , Neff CP , Lecureux J , Ehler A , Dsouza M , Remling-Mulder L , et al. In vivo blockade of the PD-1 receptor suppresses HIV-1 viral loads and improves CD4+ T cell levels in humanized mice. J Immunol. 2013; 190( 1): 211– 9. doi:10.4049/jimmunol.1201108. [Google Scholar] [CrossRef]
11. Velu V , Titanji K , Zhu B , Husain S , Pladevega A , Lai L , et al. Enhancing SIV-specific immunity in vivo by PD-1 blockade. Nature. 2009; 458( 7235): 206– 10. doi:10.1038/nature07662. [Google Scholar] [CrossRef]
12. Joshi T , Rodriguez S , Perovic V , Cockburn IA , Stäger S . B7-H1 blockade increases survival of dysfunctional CD8+ T cells and confers protection against Leishmania donovani infections. PLoS Pathog. 2009; 5( 5): e1000431. doi:10.1371/journal.ppat.1000431. [Google Scholar] [CrossRef]
13. Oliveira Silva KL , Marin Chiku V , Luvizotto Venturin G , Correa Leal AA , de Almeida BF , De Rezende Eugenio F , et al. PD-1 and PD-L1 regulate cellular immunity in canine visceral leishmaniasis. Comp Immunol Microbiol Infect Dis. 2019; 62: 76– 87. doi:10.1016/j.cimid.2018.12.002. [Google Scholar] [CrossRef]
14. Habib S , El Andaloussi A , Elmasry K , Handoussa A , Azab M , Elsawey A , et al. PDL-1 blockade prevents T cell exhaustion, inhibits autophagy, and promotes clearance of Leishmania donovani. Infect Immun. 2018; 86( 6): e00019– 18. doi:10.1128/IAI.00019-18. [Google Scholar] [CrossRef]
15. Xiao Y , He J , Zhu Z , Zhao Y , Luo X , Luo J , et al. Host-microbiota-parasite crosstalk: gut microbiota dysbiosis exacerbates Leishmania infantum pathogenesis through altered immunity and glycerylphosphatide metabolism. Acta Trop. 2025; 271: 107845. doi:10.1016/j.actatropica.2025.107845. [Google Scholar] [CrossRef]
16. Engwerda CR , Ato M , Kaye PM . Macrophages, pathology and parasite persistence in experimental visceral leishmaniasis. Trends Parasitol. 2004; 20( 11): 524– 30. doi:10.1016/j.pt.2004.08.009. [Google Scholar] [CrossRef]
17. He J , Zhang J , Liao X , Xiao Y , Li J , Zheng Z , et al. Upregulation of PD-1/PD-L1 and downregulation of immune signaling pathways lead to more severe visceral leishmaniasis in undernutrition mice. Parasit Vectors. 2024; 17( 1): 8. doi:10.1186/s13071-023-06018-2. [Google Scholar] [CrossRef]
18. Liao X , He J , Wang R , Zhang J , Wei S , Xiao Y , et al. TLR-2 agonist Pam3CSK4 has no therapeutic effect on visceral leishmaniasis in BALB/c mice and may enhance the pathogenesis of the disease. Immunobiology. 2023; 228( 5): 152725. doi:10.1016/j.imbio.2023.152725. [Google Scholar] [CrossRef]
19. He J , Huang F , Liao X , Zhang J , Wei S , Xiao Y , et al. TLR9 agonist CpG ODN 2395 promotes the immune response against Leishmania donovani in obesity and undernutrition mice. Acta Trop. 2023; 242: 106921. doi:10.1016/j.actatropica.2023.106921. [Google Scholar] [CrossRef]
20. Mootha VK , Lindgren CM , Eriksson KF , Subramanian A , Sihag S , Lehar J , et al. PGC-1alpha-responsive genes involved in oxidative phosphorylation are coordinately downregulated in human diabetes. Nat Genet. 2003; 34( 3): 267– 73. doi:10.1038/ng1180. [Google Scholar] [CrossRef]
21. Guo A , Wang W , Shi H , Wang J , Liu T . Identification of hub genes and pathways in a rat model of renal ischemia-reperfusion injury using bioinformatics analysis of the gene expression omnibus (GEO) dataset and integration of gene expression profiles. Med Sci Monit. 2019; 25: 8403– 11. doi:10.12659/MSM.920364. [Google Scholar] [CrossRef]
22. el Hag IA , Hashim FA , el Toum IA , Homeida M , el Kalifa M , el Hassan AM . Liver morphology and function in visceral leishmaniasis (Kala-azar). J Clin Pathol. 1994; 47( 6): 547– 51. doi:10.1136/jcp.47.6.547. [Google Scholar] [CrossRef]
23. Kaye PM , Beattie L . Lessons from other diseases: granulomatous inflammation in leishmaniasis. Semin Immunopathol. 2016; 38( 2): 249– 60. doi:10.1007/s00281-015-0548-7. [Google Scholar] [CrossRef]
24. Gutierrez Y , Salinas GH , Palma G , Valderrama LB , Santrich CV , Saravia NG . Correlation between histopathology, immune response, clinical presentation, and evolution in Leishmania braziliensis infection. Am J Trop Med Hyg. 1991; 45( 3): 281– 9. doi:10.4269/ajtmh.1991.45.281. [Google Scholar] [CrossRef]
25. Costa-Madeira JC , Trindade GB , Almeida PHP , Silva JS , Carregaro V . T lymphocyte exhaustion during human and experimental visceral leishmaniasis. Front Immunol. 2022; 13: 835711. doi:10.3389/fimmu.2022.835711. [Google Scholar] [CrossRef]
26. Andrews LP , Yano H , Vignali DAA . Inhibitory receptors and ligands beyond PD-1, PD-L1 and CTLA-4: breakthroughs or backups. Nat Immunol. 2019; 20( 11): 1425– 34. doi:10.1038/s41590-019-0512-0. [Google Scholar] [CrossRef]
27. Egui A , Ledesma D , Pérez-Antón E , Montoya A , Gómez I , Robledo SM , et al. Phenotypic and functional profiles of antigen-specific CD4+ and CD8+ T cells associated with infection control in patients with cutaneous leishmaniasis. Front Cell Infect Microbiol. 2018; 8: 393. doi:10.3389/fcimb.2018.00393. [Google Scholar] [CrossRef]
28. Schaut RG , Grinnage-Pulley TL , Esch KJ , Toepp AJ , Duthie MS , Howard RF , et al. Recovery of antigen-specific T cell responses from dogs infected with Leishmania (L.) infantum by use of vaccine associated TLR-agonist adjuvant. Vaccine. 2016; 34( 44): 5225– 34. doi:10.1016/j.vaccine.2016.09.016. [Google Scholar] [CrossRef]
29. Liu S , Li Z , Lan S , Hao H , Baz AA , Yan X , et al. The dual roles of activating transcription factor 3 (ATF3) in inflammation, apoptosis, ferroptosis, and pathogen infection responses. Int J Mol Sci. 2024; 25( 2): 824. doi:10.3390/ijms25020824. [Google Scholar] [CrossRef]
30. Du Y , Ma Z , Zheng J , Huang S , Yang X , Song Y , et al. ATF3 positively regulates antibacterial immunity by modulating macrophage killing and migration functions. Front Immunol. 2022; 13: 839502. doi:10.3389/fimmu.2022.839502. [Google Scholar] [CrossRef]
31. Jafarzadeh A , Kumar S , Bodhale N , Jafarzadeh S , Nemati M , Sharifi I , et al. The expression of PD-1 and its ligands increases in Leishmania infection and its blockade reduces the parasite burden. Cytokine. 2022; 153: 155839. doi:10.1016/j.cyto.2022.155839. [Google Scholar] [CrossRef]
32. Araki K , Youngblood B , Ahmed R . Programmed cell death 1-directed immunotherapy for enhancing T-cell function. Cold Spring Harb Symp Quant Biol. 2013; 78: 239– 47. doi:10.1101/sqb.2013.78.019869. [Google Scholar] [CrossRef]
33. Blackburn SD , Shin H , Freeman GJ , Wherry EJ . Selective expansion of a subset of exhausted CD8 T cells by alphaPD-L1 blockade. Proc Natl Acad Sci U S A. 2008; 105( 39): 15016– 21. doi:10.1073/pnas.0801497105. [Google Scholar] [CrossRef]
34. Utzschneider DT , Legat A , Fuertes Marraco SA , Carrié L , Luescher I , Speiser DE , et al. T cells maintain an exhausted phenotype after antigen withdrawal and population reexpansion. Nat Immunol. 2013; 14( 6): 603– 10. doi:10.1038/ni.2606. [Google Scholar] [CrossRef]
35. Angelosanto JM , Blackburn SD , Crawford A , Wherry EJ . Progressive loss of memory T cell potential and commitment to exhaustion during chronic viral infection. J Virol. 2012; 86( 15): 8161– 70. doi:10.1128/JVI.00889-12. [Google Scholar] [CrossRef]
36. Rodrigues V , Cordeiro-da-Silva A , Laforge M , Silvestre R , Estaquier J . Regulation of immunity during visceral Leishmania infection. Parasites Vectors. 2016; 9( 1): 118. doi:10.1186/s13071-016-1412-x. [Google Scholar] [CrossRef]
37. Kaye P , Scott P . Leishmaniasis: complexity at the host-pathogen interface. Nat Rev Microbiol. 2011; 9( 8): 604– 15. doi:10.1038/nrmicro2608. [Google Scholar] [CrossRef]
38. Alexander J , Carter KC , Al-Fasi N , Satoskar A , Brombacher F . Endogenous IL-4 is necessary for effective drug therapy against visceral leishmaniasis. Eur J Immunol. 2000; 30( 10): 2935– 43. doi:10.1002/1521-4141(200010)30:10<2935::AID-IMMU2935>3.0.CO;2-Q. [Google Scholar] [CrossRef]
39. Stäger S , Alexander J , Carter KC , Brombacher F , Kaye PM . Both interleukin-4 (IL-4) and IL-4 receptor alpha signaling contribute to the development of hepatic granulomas with optimal antileishmanial activity. Infect Immun. 2003; 71( 8): 4804– 7. doi:10.1128/IAI.71.8.4804-4807.2003. [Google Scholar] [CrossRef]
40. Alexander J , Bryson K . T helper (h)1/Th2 and Leishmania: paradox rather than paradigm. Immunol Lett. 2005; 99( 1): 17– 23. doi:10.1016/j.imlet.2005.01.009. [Google Scholar] [CrossRef]
41. Yang X , Deng Y , Ye Y , Meng J , Su M , Wei W , et al. Macrophage-derived itaconate suppresses dendritic cell function to promote acquired resistance to anti-PD-1 immunotherapy. Cancer Res. 2025; 85( 10): 1842– 56. doi:10.1158/0008-5472.CAN-24-2982. [Google Scholar] [CrossRef]
42. Murray HW , Lu CM , Mauze S , Freeman S , Moreira AL , Kaplan G , et al. Interleukin-10 (IL-10) in experimental visceral leishmaniasis and IL-10 receptor blockade as immunotherapy. Infect Immun. 2002; 70( 11): 6284– 93. doi:10.1128/IAI.70.11.6284-6293.2002. [Google Scholar] [CrossRef]
43. Sica A , Mantovani A . Macrophage plasticity and polarization: in vivo veritas. J Clin Investig. 2012; 122( 3): 787– 95. doi:10.1172/JCI59643. [Google Scholar] [CrossRef]
44. Tumang MC , Keogh C , Moldawer LL , Helfgott DC , Teitelbaum R , Hariprashad J , et al. Role and effect of TNF-alpha in experimental visceral leishmaniasis. J Immunol. 1994; 153( 2): 768– 75. doi:10.4049/jimmunol.153.2.768. [Google Scholar] [CrossRef]
45. Dayer JM , Isler P , Nicod LP . Adhesion molecules and cytokine production. Am Rev Respir Dis. 1993; 148( 6 Pt 2): S70– 4. doi:10.1164/ajrccm/148.6_Pt_2.S70. [Google Scholar] [CrossRef]
46. Siemaszko J , Marzec-Przyszlak A , Bogunia-Kubik K . Activating NKG2C receptor: functional characteristics and current strategies in clinical applications. Arch Immunol Ther Exp. 2023; 71( 1): 9. doi:10.1007/s00005-023-00674-z. [Google Scholar] [CrossRef]
47. Zhang J , Wu YJ , Hu XX , Wei W . New insights into the Lck-NF-κB signaling pathway. Front Cell Dev Biol. 2023; 11: 1120747. doi:10.3389/fcell.2023.1120747. [Google Scholar] [CrossRef]
48. Saha S , Roy S , Dutta A , Jana K , Ukil A . Leishmania donovani targets host transcription factor NRF2 to activate antioxidant enzyme HO-1 and transcriptional repressor ATF3 for establishing infection. Infect Immun. 2021; 89( 7): e00764– 20. doi:10.1128/IAI.00764-20. [Google Scholar] [CrossRef]
Cite This Article
 Copyright © 2026 The Author(s). Published by Tech Science Press.
This work is licensed under a Creative Commons Attribution 4.0 International License , which permits unrestricted use, distribution, and reproduction in any medium, provided the original work is properly cited.
 Downloads
 Citation Tools