
 Submit a Paper
 Propose a Special lssue
 Open Access
ARTICLE
Hemodynamic Profiling Using a Cardiac Index–Systemic Vascular Resistance Plot in Patients with Fontan Circulation
1 Division of Pediatric Cardiology, Osaka City General Hospital Pediatric Medical Center, Osaka, 5340021, Japan
2 Division of Cardiology, St. Louis Children’s Hospital, Department of Pediatrics, Washington University in St. Louis, St. Louis, MO 63130, USA
* Corresponding Author: Yuki Kawasaki. Email:
Congenital Heart Disease 2023, 18(4), 431-445. https://doi.org/10.32604/chd.2023.030910
Received 08 May 2023; Accepted 09 June 2023; Issue published 15 September 2023
 View Full Text
 Download PDF
Abstract
Background: Elevated Fontan pressure (FP) alone cannot fully predict clinical outcomes. We hypothesized that hemodynamic profiling using a cardiac index (CI)-systemic vascular resistance (SVR) plot could characterize clinical features and predict the prognosis of post-Fontan patients. Methods: We included post-Fontan patients who underwent cardiac catheterization at age < 10 years. Patients were classified into four categories: A, CI ≥ 3, SVR index (SVRI) ≥ 20; B, CI < 3, SVRI ≥ 20; C, CI ≥ 3, SVRI < 20; and D, CI < 3, SVRI < 20. The primary outcome was freedom from the combined endpoint: new onset of protein-losing enteropathy or plastic bronchitis, heart transplant, and death. Clinical and hemodynamic variables and freedom from the endpoint were compared between the hemodynamic categories and outcome predictors were evaluated. Results: Eighty-three patients were included. Median follow-up was 5.3 years. Category A/B/C/D consisted of 4/15/53/11 patients, respectively. All the patients in category A were New York Heart Association I/II and had a significantly lower pulmonary vascular resistance index (PVRI). Patients in category C had lower pulmonary/systemic blood flow. Patients in category D had a higher PVRI and had the poorest freedom from the endpoint (44% at 5 years). Elevated FP and category D were outcome predictors. Conclusions: CI-SVR plots was a novel adjunctive method for Fontan hemodynamic profiling.Graphic Abstract
Keywords
Although the short-term mortality rate following the Fontan procedure has significantly improved over time, the long-term morbidity and mortality remain suboptimal [1]. Patients may suffer from Fontan-associated diseases, such as protein-losing enteropathy (PLE), plastic bronchitis (PB), liver disease, thrombosis, renal insufficiency, and arrhythmias, which may lead to Fontan failure over time [1,2]. Elevated Fontan pressure (FP) is a risk factor for poorer outcomes in patients with Fontan circulation [1,3,4]. However, Fontan failure without elevated FP has also been reported [5].
On the other hand, symptomatic post-Fontan patients have reduced systemic vascular resistance (SVR) with a preserved cardiac index (CI) [6]. Accordingly, SVR and the CI could be additional important hemodynamic variables along with FP in order to evaluate Fontan circulation. By focusing on the CI and the systemic vascular resistance index (SVRI), perfusion pressure (PP), which reflects systemic arterial pressure and FP, can be evaluated because PP is the product of the CI and SVRI. In this study, the CI and SVRI of each patient were charted on a CI-SVR plot and we investigated the patient’s clinical features and outcome of each area of the plot. We hypothesized that hemodynamic profiling using the CI-SVR plot in addition to FP may give further comprehension of the post-Fontan condition.
This retrospective study was conducted at the Children’s Hospital of Michigan. Patients who underwent the Fontan procedure and a post-Fontan hemodynamic evaluation via cardiac catheterization from 1993 to 2018 were included in the study. To eliminate the influence of age on the SVR, the patients were divided into two groups by their age at catheterization, ≥10 years and <10 years, and the latter was chosen as the study population. Eligible patients were identified via a search of the cardiac surgery and cardiac catheterization databases. Catheterization data within 3 months after the Fontan procedure and patients with insufficient data to calculate the CI and SVRI were excluded from the study. For patients who underwent cardiac catheterization multiple times, data from the first catheterization were used for analysis. This study was approved by the Wayne State University Institutional Research Board and the Detroit Medical Center Research Review and was conducted according to the Declaration of Helsinki.
Data on patient demographics; operative history; PLE/PB/death/heart transplant (Htx) events; clinical variables at the timing of cardiac catheterization, including the New York Heart Association (NYHA) classification; medications; pacemaker use; laboratory and echocardiographic findings; and duration from the Fontan procedure to the cardiac catheterization were collected from medical records. Patients with moderate-to-severe atrioventricular regurgitation (AVVR) on echocardiography were considered AVVR positive. Ventricular dysfunction was considered positive if systemic ventricular systolic dysfunction was moderate or worse. Coarctation of the aorta and subaortic stenosis were considered positive when the pressure gradient (PG) was >30 mmHg. When a fenestration was identified, the recorded mean PG at the fenestration was analyzed. Hemodynamic data collected via cardiac catheterization before and after the Fontan procedure were reviewed. Cardiac output was calculated using the Fick technique, with the assumed oxygen consumption by the LaFarge’s formula, and was indexed by the body surface area [7]. The SVRI (WU·m2) was calculated as: (mean systemic arterial pressure−FP)/CI. Pulmonary blood flow (Qp) was calculated using an assumed pulmonary vein saturation of 97% or directly measured pulmonary venous saturation in the same fashion as CI. The pulmonary vascular resistance index (PVRI) (WU·m2) was calculated as: (mean pulmonary artery pressure–pulmonary capillary wedge pressure)/Qp).
The primary study endpoint was freedom from the combined endpoint at follow-up, which consisted of new-onset PLE or PB, Htx, and death. PLE was defined as at least one clinical symptom (peripheral edema, diarrhea, abdominal pain, or effusions within the pericardial or pleural space) and one laboratory abnormality, such as elevated fecal alpha-1 antitrypsin clearance (>50 mL/24 h, elevated spot fecal alpha-1 antitrypsin concentration [>100 mg/mL]), or serum albumin <3.0 g/dL [8]. PB was defined as the identification of casts in the airway.
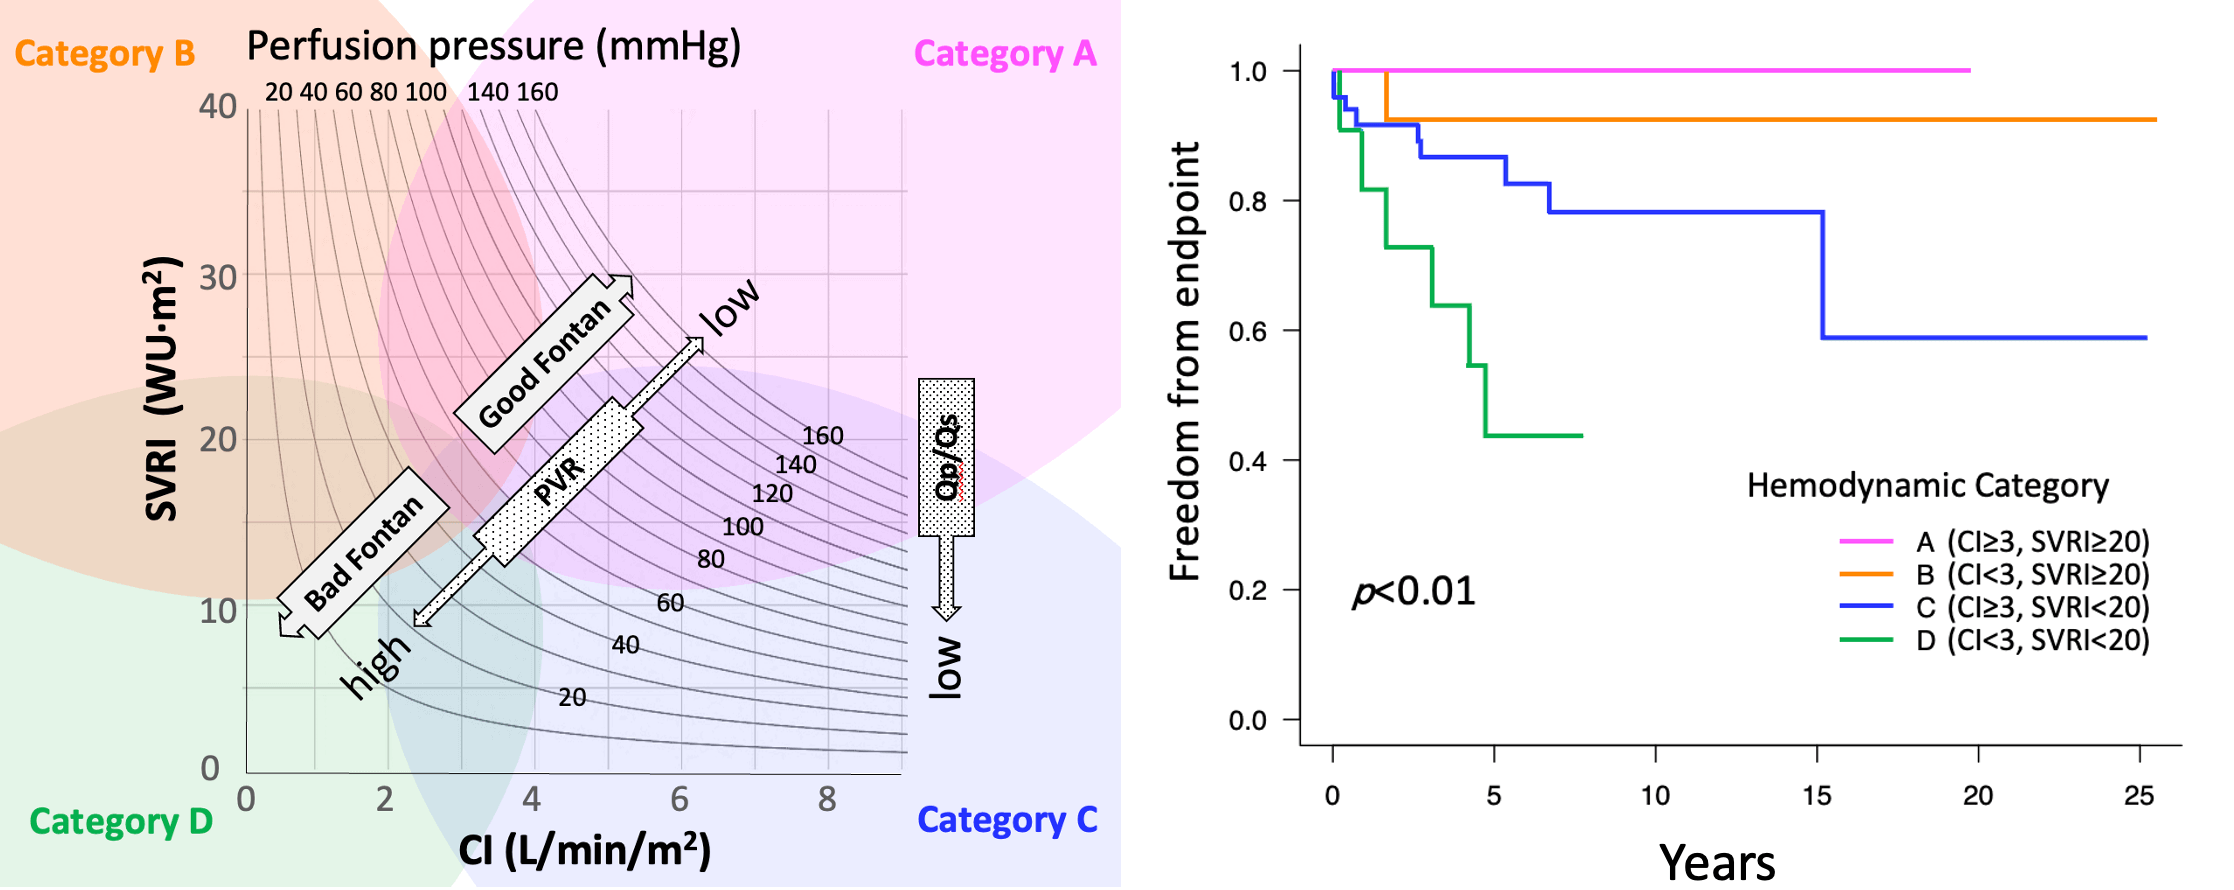
Hemodynamic data were charted on a CI-SVR plot for each patient (Supplementary Fig. S1). In the systemic circulation, the same PP level was described as the curved lines on the scatter plot. The lower left quadrant of the plot represents a lower PP.
Patients were classified into four categories according to their CI and SVRI. In a study of 387 number of patients by Ohuchi et al., the cut-off value for CI was set as 3 (L/min/m2) [3]. In the same paper, the SVRI border between the groups with and without increased cardiac output seemed to be approximately 20; hence, these cutoff values were selected for categorization. Patient categories were as follows: category A, CI ≥ 3, SVRI ≥ 20; category B, CI < 3, SVRI ≥ 20; category C, CI ≥ 3, SVRI < 20; and category D, CI < 3, SVRI < 20 (Supplementary Fig. S1).
Clinical and hemodynamic variables and freedom from the endpoint were compared between the categories (A-D). Clinical variables, including the hemodynamic category, were analyzed to identify predictors of the endpoint. All statistical analyses were conducted using EZR (Saitama Medical Center, Jichi Medical University, Saitama, Japan), which is a graphical user interface for R (The R Foundation for Statistical Computing, Vienna, Austria) [9]. Categorical variables were presented as percentages and were compared with the chi-square or Fisher’s exact test. Continuous variables were presented as median (range) and were compared using the Mann–Whitney U and Kruskal–Wallis test.
The Kaplan–Meier product-limit method and a log-rank test were used to analyze the freedom from the endpoints between the four hemodynamic categories. The time of cardiac catheterization was defined as time zero. The Cox proportional hazards model was used to identify significant risk factors for the endpoints. Due to the small number of patients who reached the study endpoint, the duration from the Fontan procedure to cardiac catheterization; FP, which has been reported to influence the outcome; and the hemodynamic category were included in the multivariate analysis of model 1. In model 2, heterotaxy instead of the duration from the Fontan procedure to cardiac catheterization was included [10]. The risk for each variable was expressed as a hazard ratio and 95% confidence interval. Statistical significance was set at p < 0.05.
Of the total 289 Fontan operations performed at the Children’s Hospital of Michigan, 153 patients underwent 483 cardiac catheterizations. In patients < 10 years old, 96 cardiac catheterization cases were identified, and 13 cases were excluded because of short duration from the Fontan operation or insufficient hemodynamic data. Thus, a total of 83 cardiac catheterization cases were included in this study.
Indications for cardiac catheterization were: regular evaluation in 37 patients (45%), cyanosis in 15 (18%), PLE/PB in 12 (14%), fatigue in 13 (16%), and pleural effusion in 6 (7%). The median follow-up period was 5.3 years (range: 0.1–25.3 years). A total of 16 (19%) patients reached the primary endpoint, including 7 with new-onset PLE/PB and 9 with Htx/death.
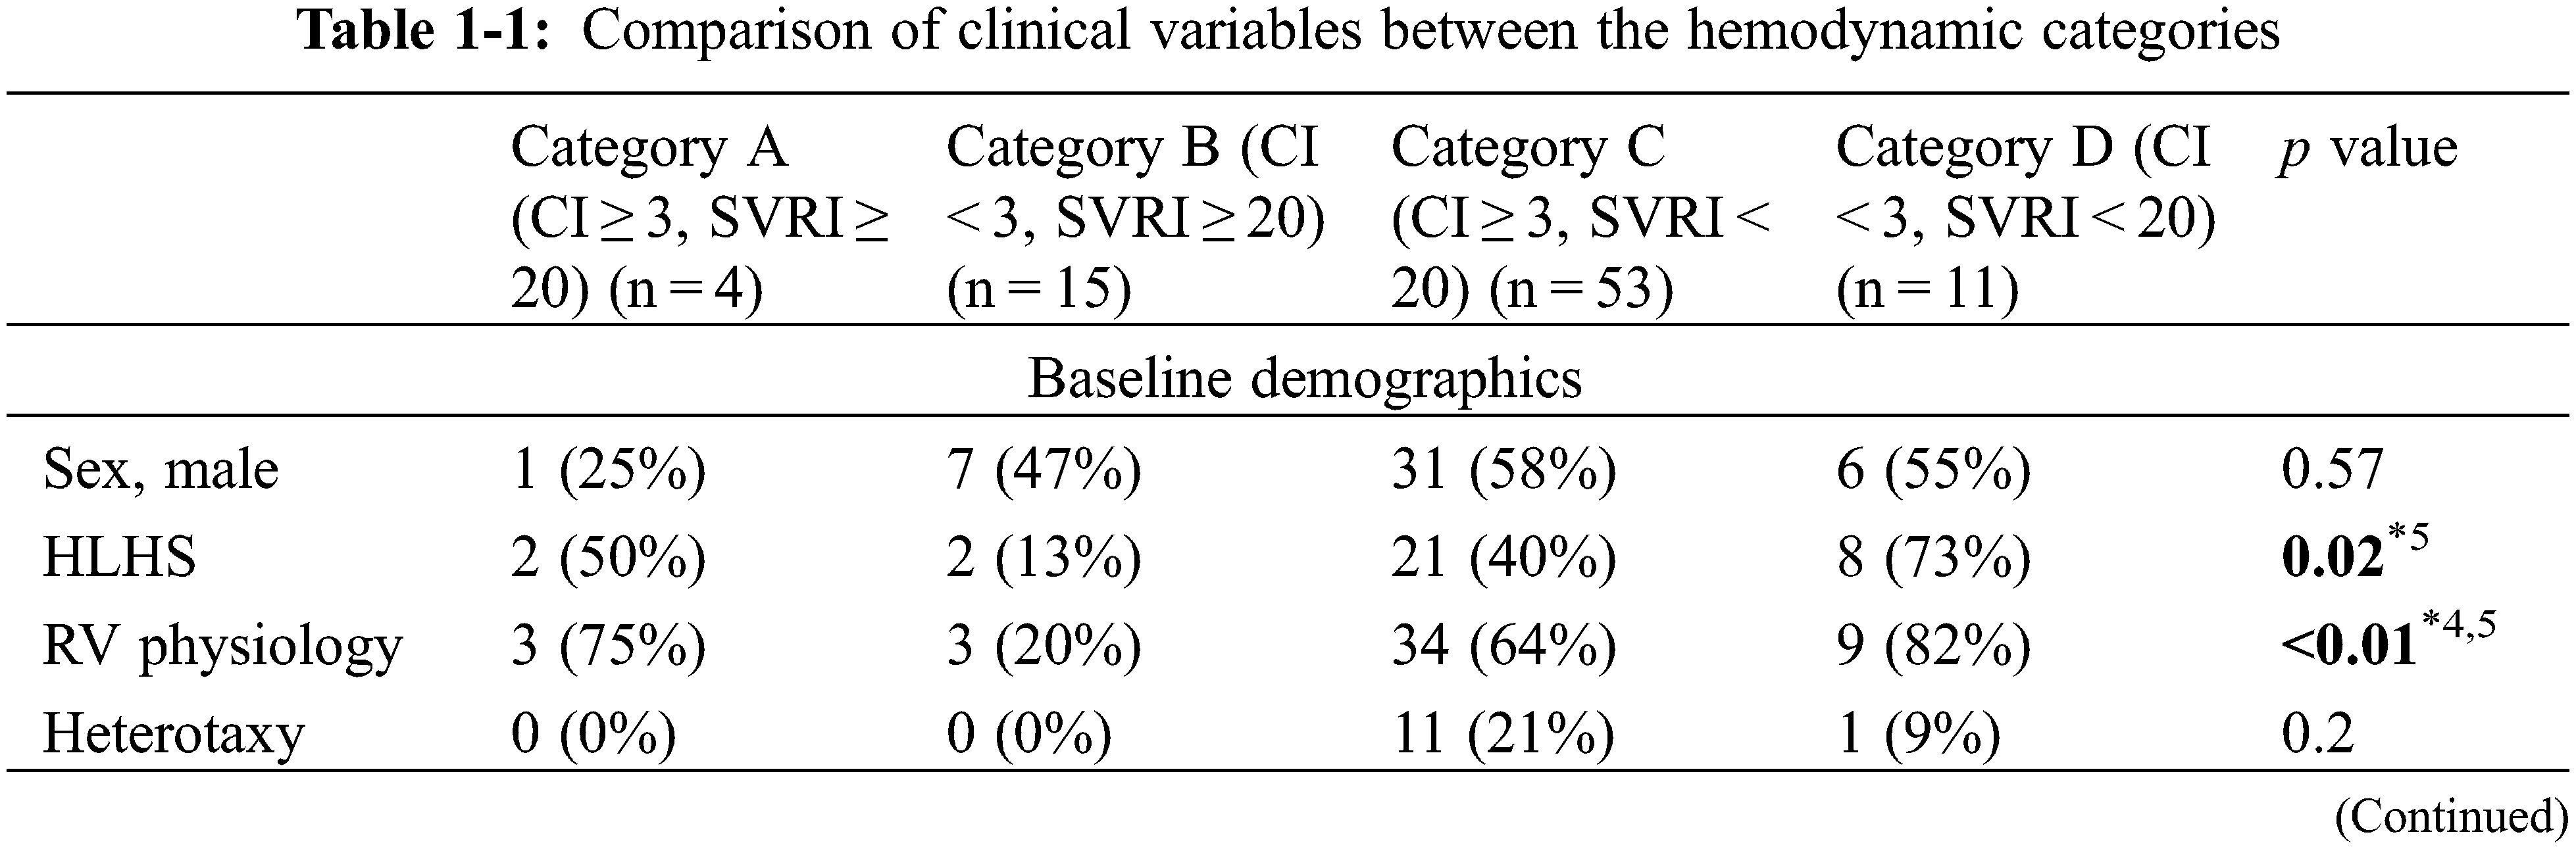
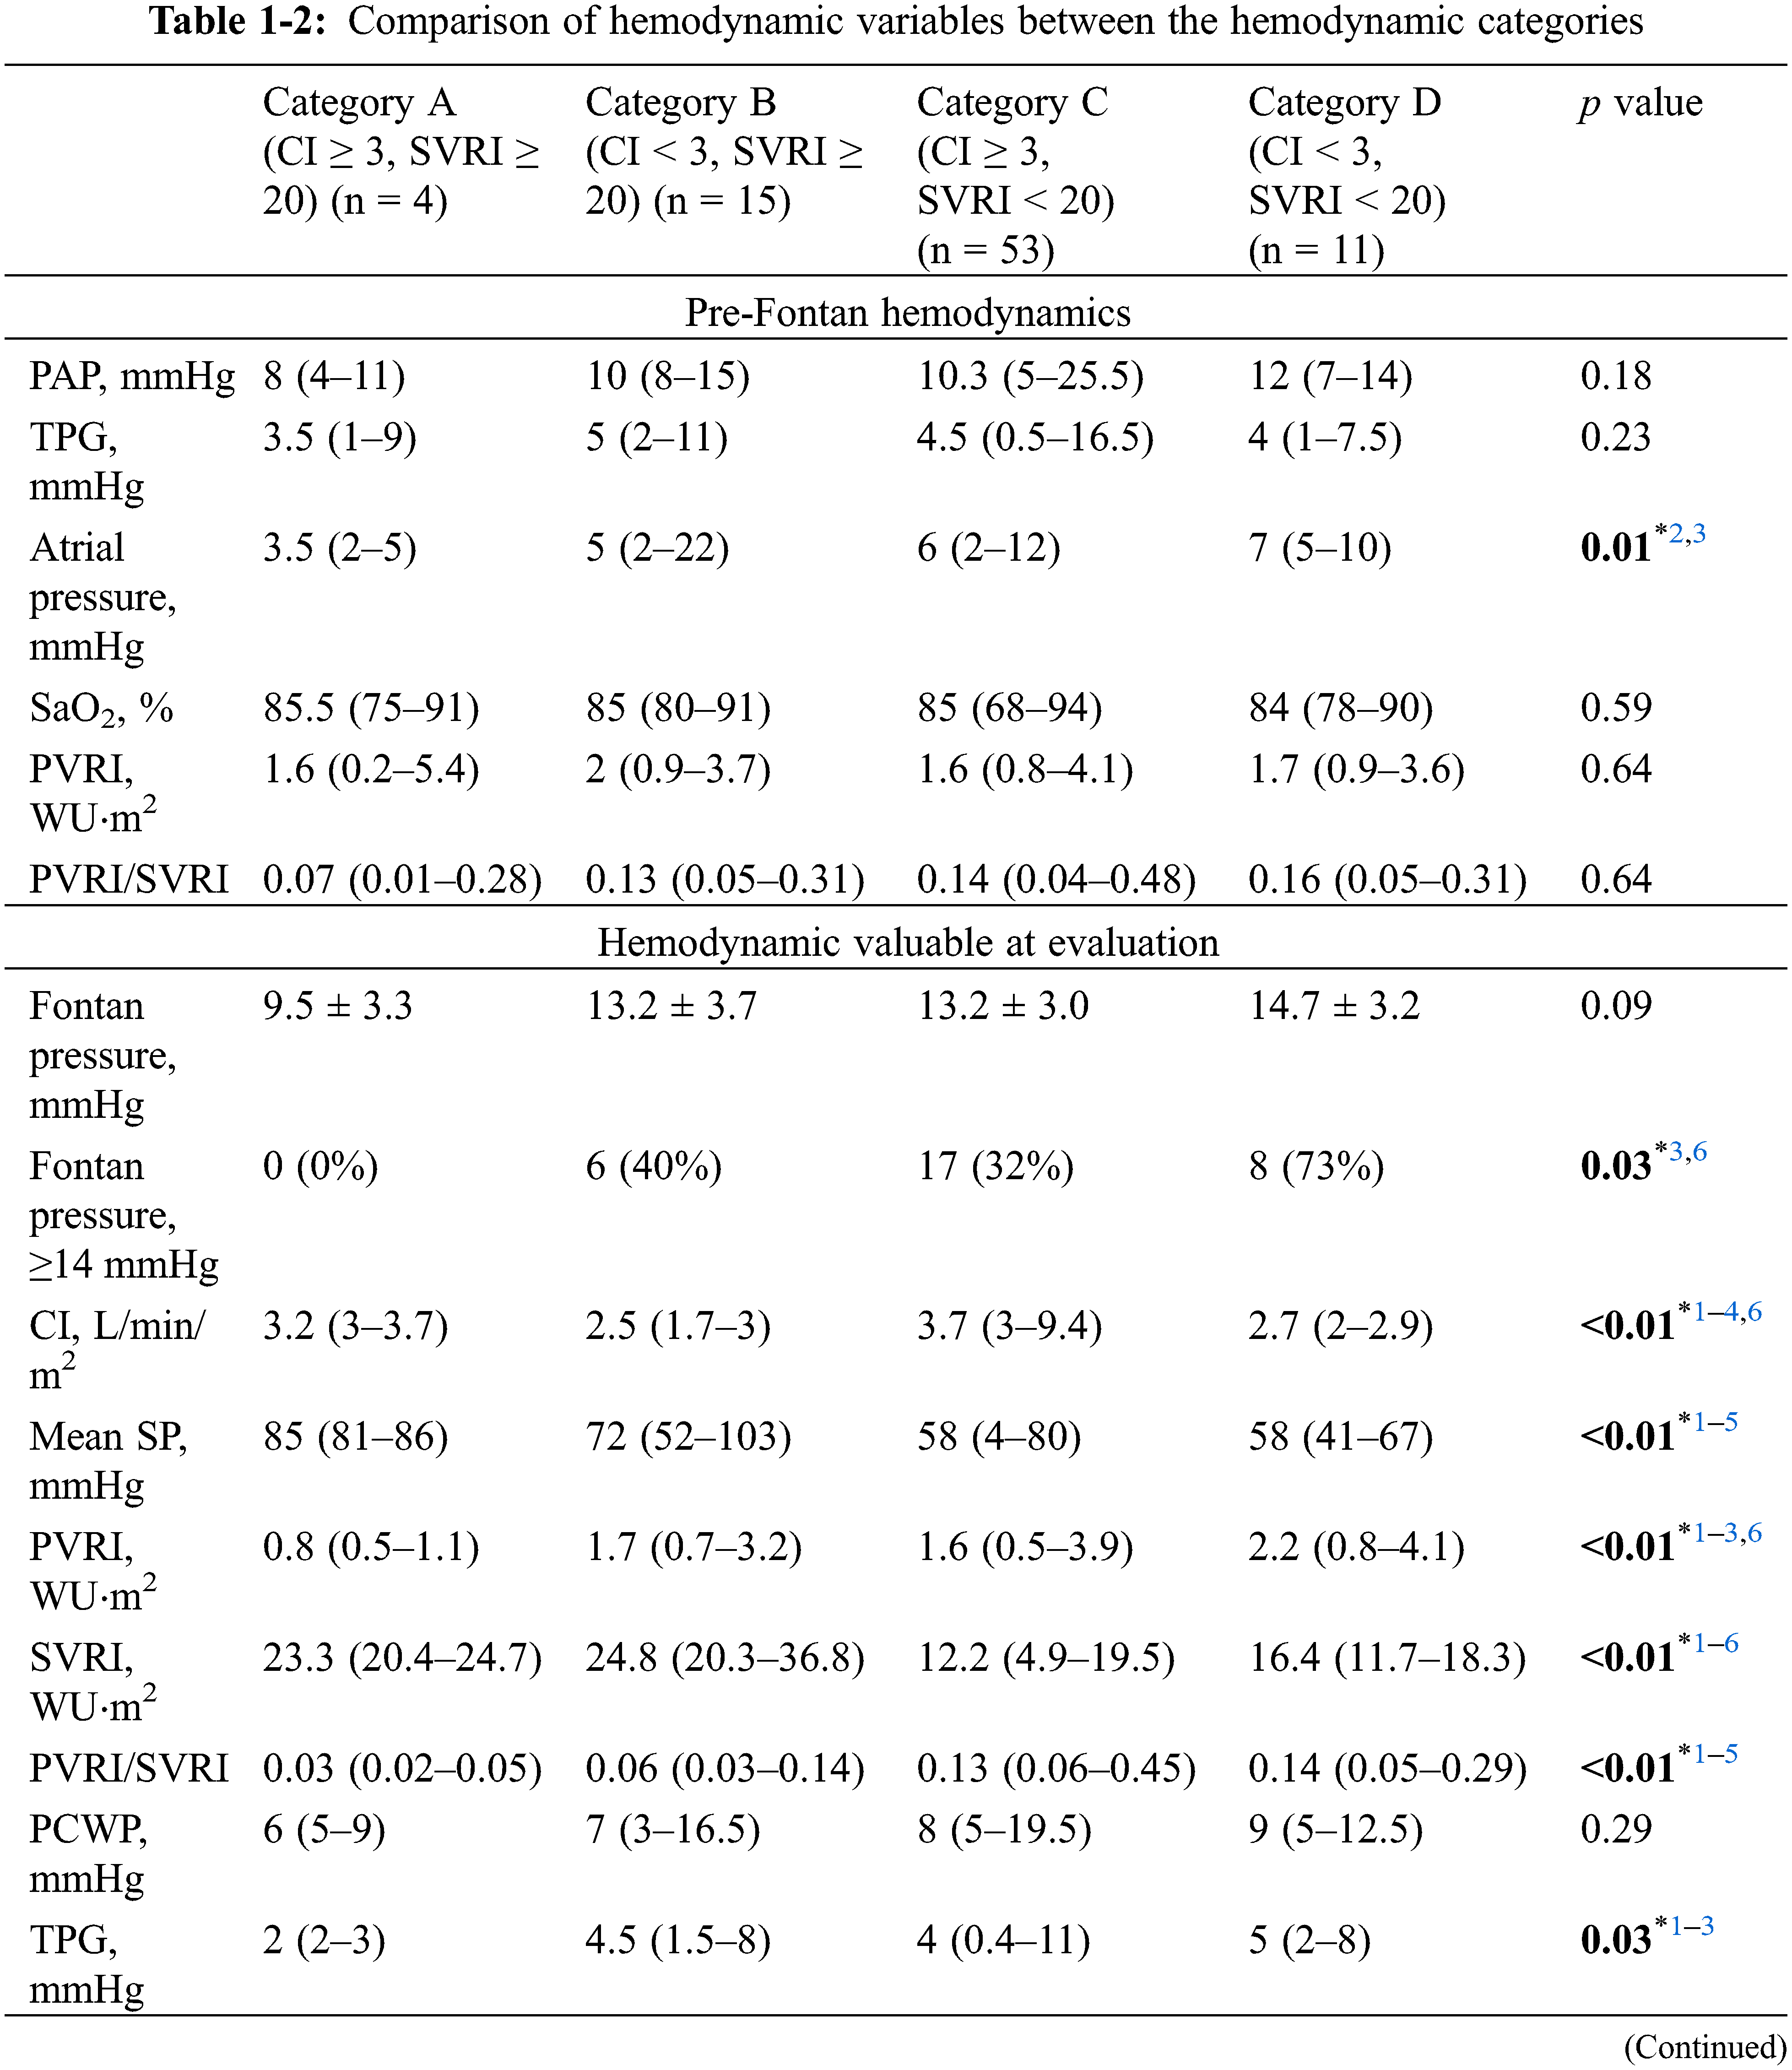
Comparison of clinical and hemodynamic variables between the four hemodynamic categories showed that no patients in category A had patent fenestration, NYHA III/IV, or PLE/PB (Tables 1-1, 2). Patients in category A had significantly lower atrial pressure during pre-Fontan catheterization compared to category C and D. In contrast, 73% of patients in category D had patent fenestration and 45% were classified as NYHA III/IV.
Major hemodynamic differences are shown in Fig. 1. FP was not significantly different between the groups, but patients with FP ≥ 14 mmHg were significantly frequent in category D compared to A and C (Tables 1-2). Mean systemic pressure was significantly high in category A, followed by category B, and category C/D. Accordingly, PP was significantly higher in category A, followed by category B, and category C/D. Interestingly, the pulmonary vascular resistance index was significantly lower in category A and higher in category D. The Qp/systemic flow (Qs) of category C was significantly lower compared to category B.
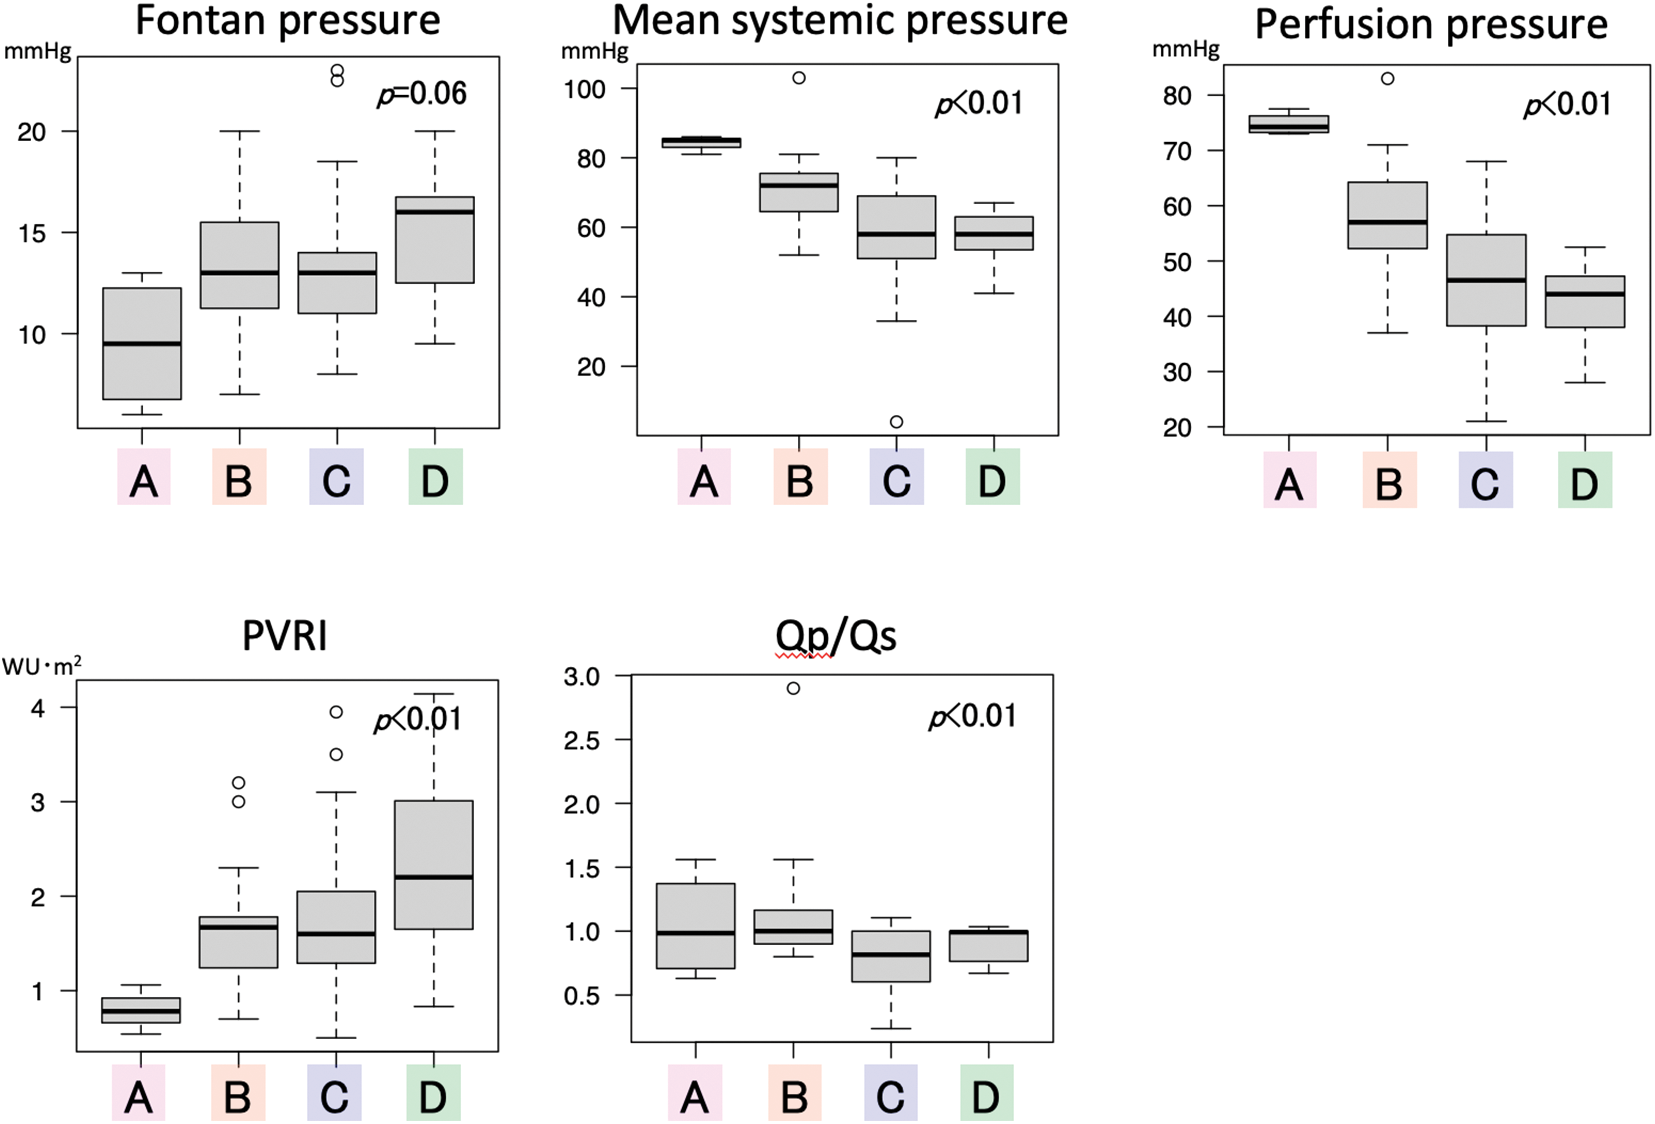
Figure 1: Comparison of hemodynamic variables between the four categories PVRI pulmonary vascular resistance index; Qp/Qs pulmonary flow/systemic flow
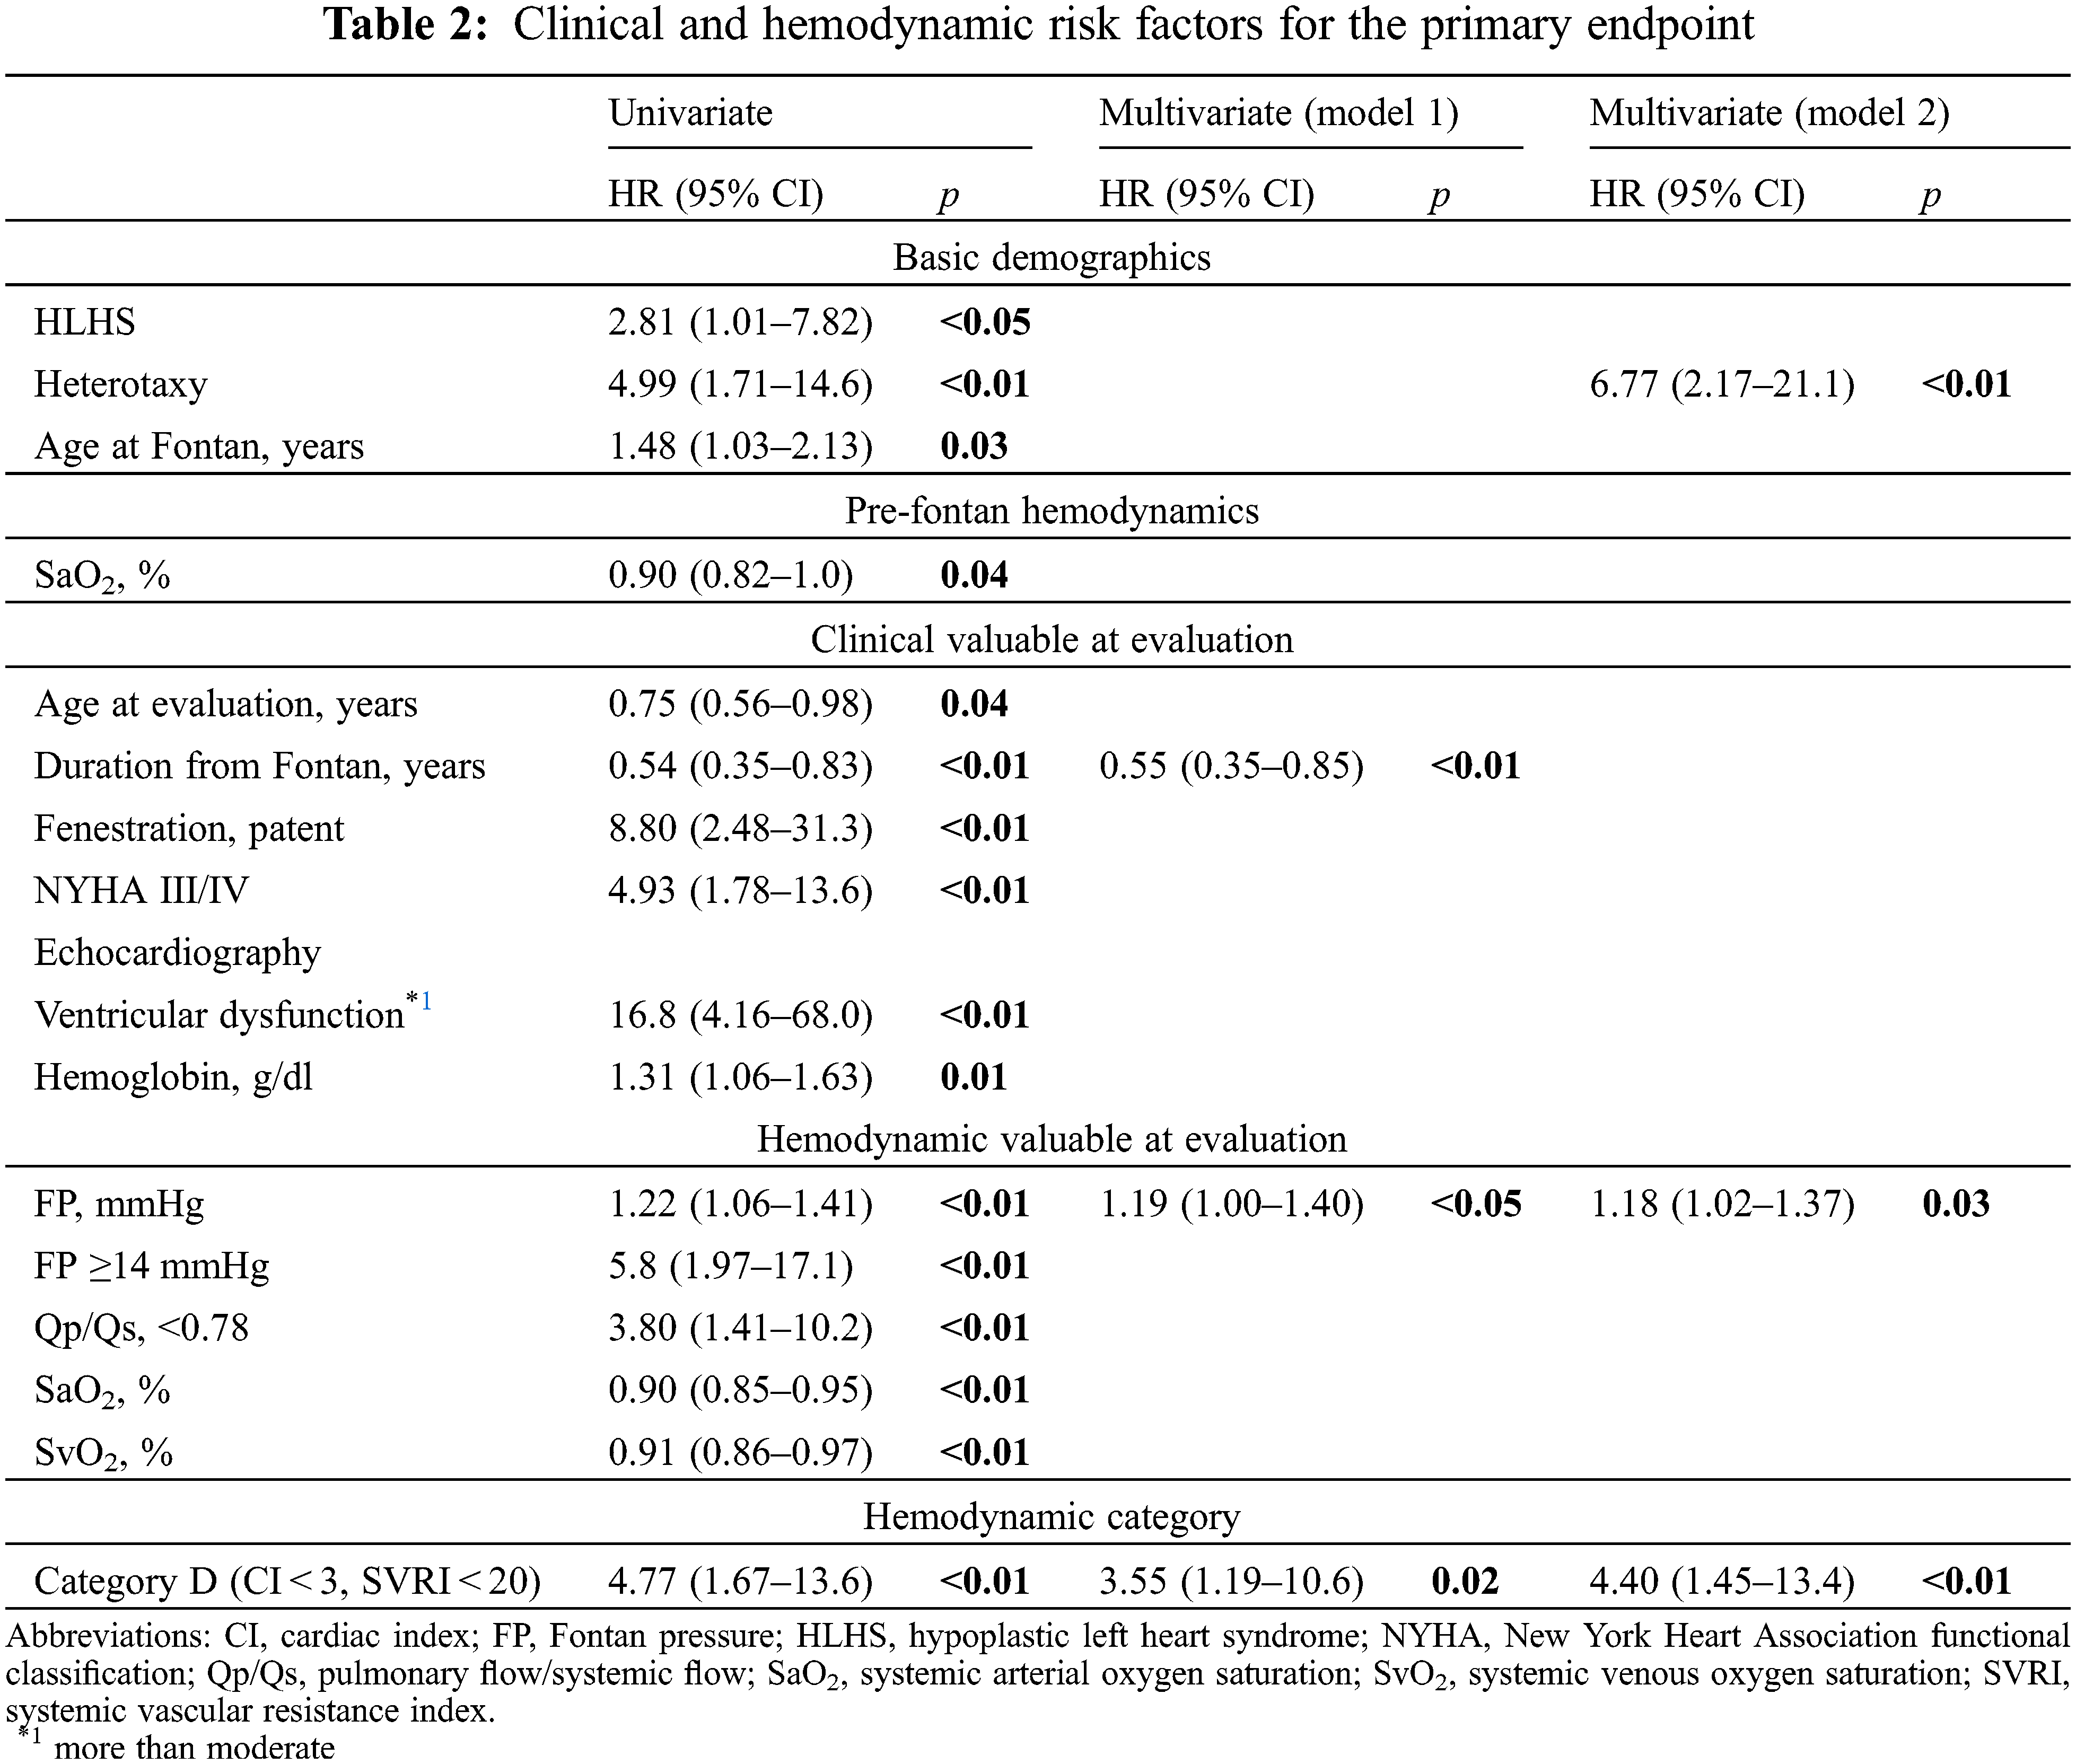
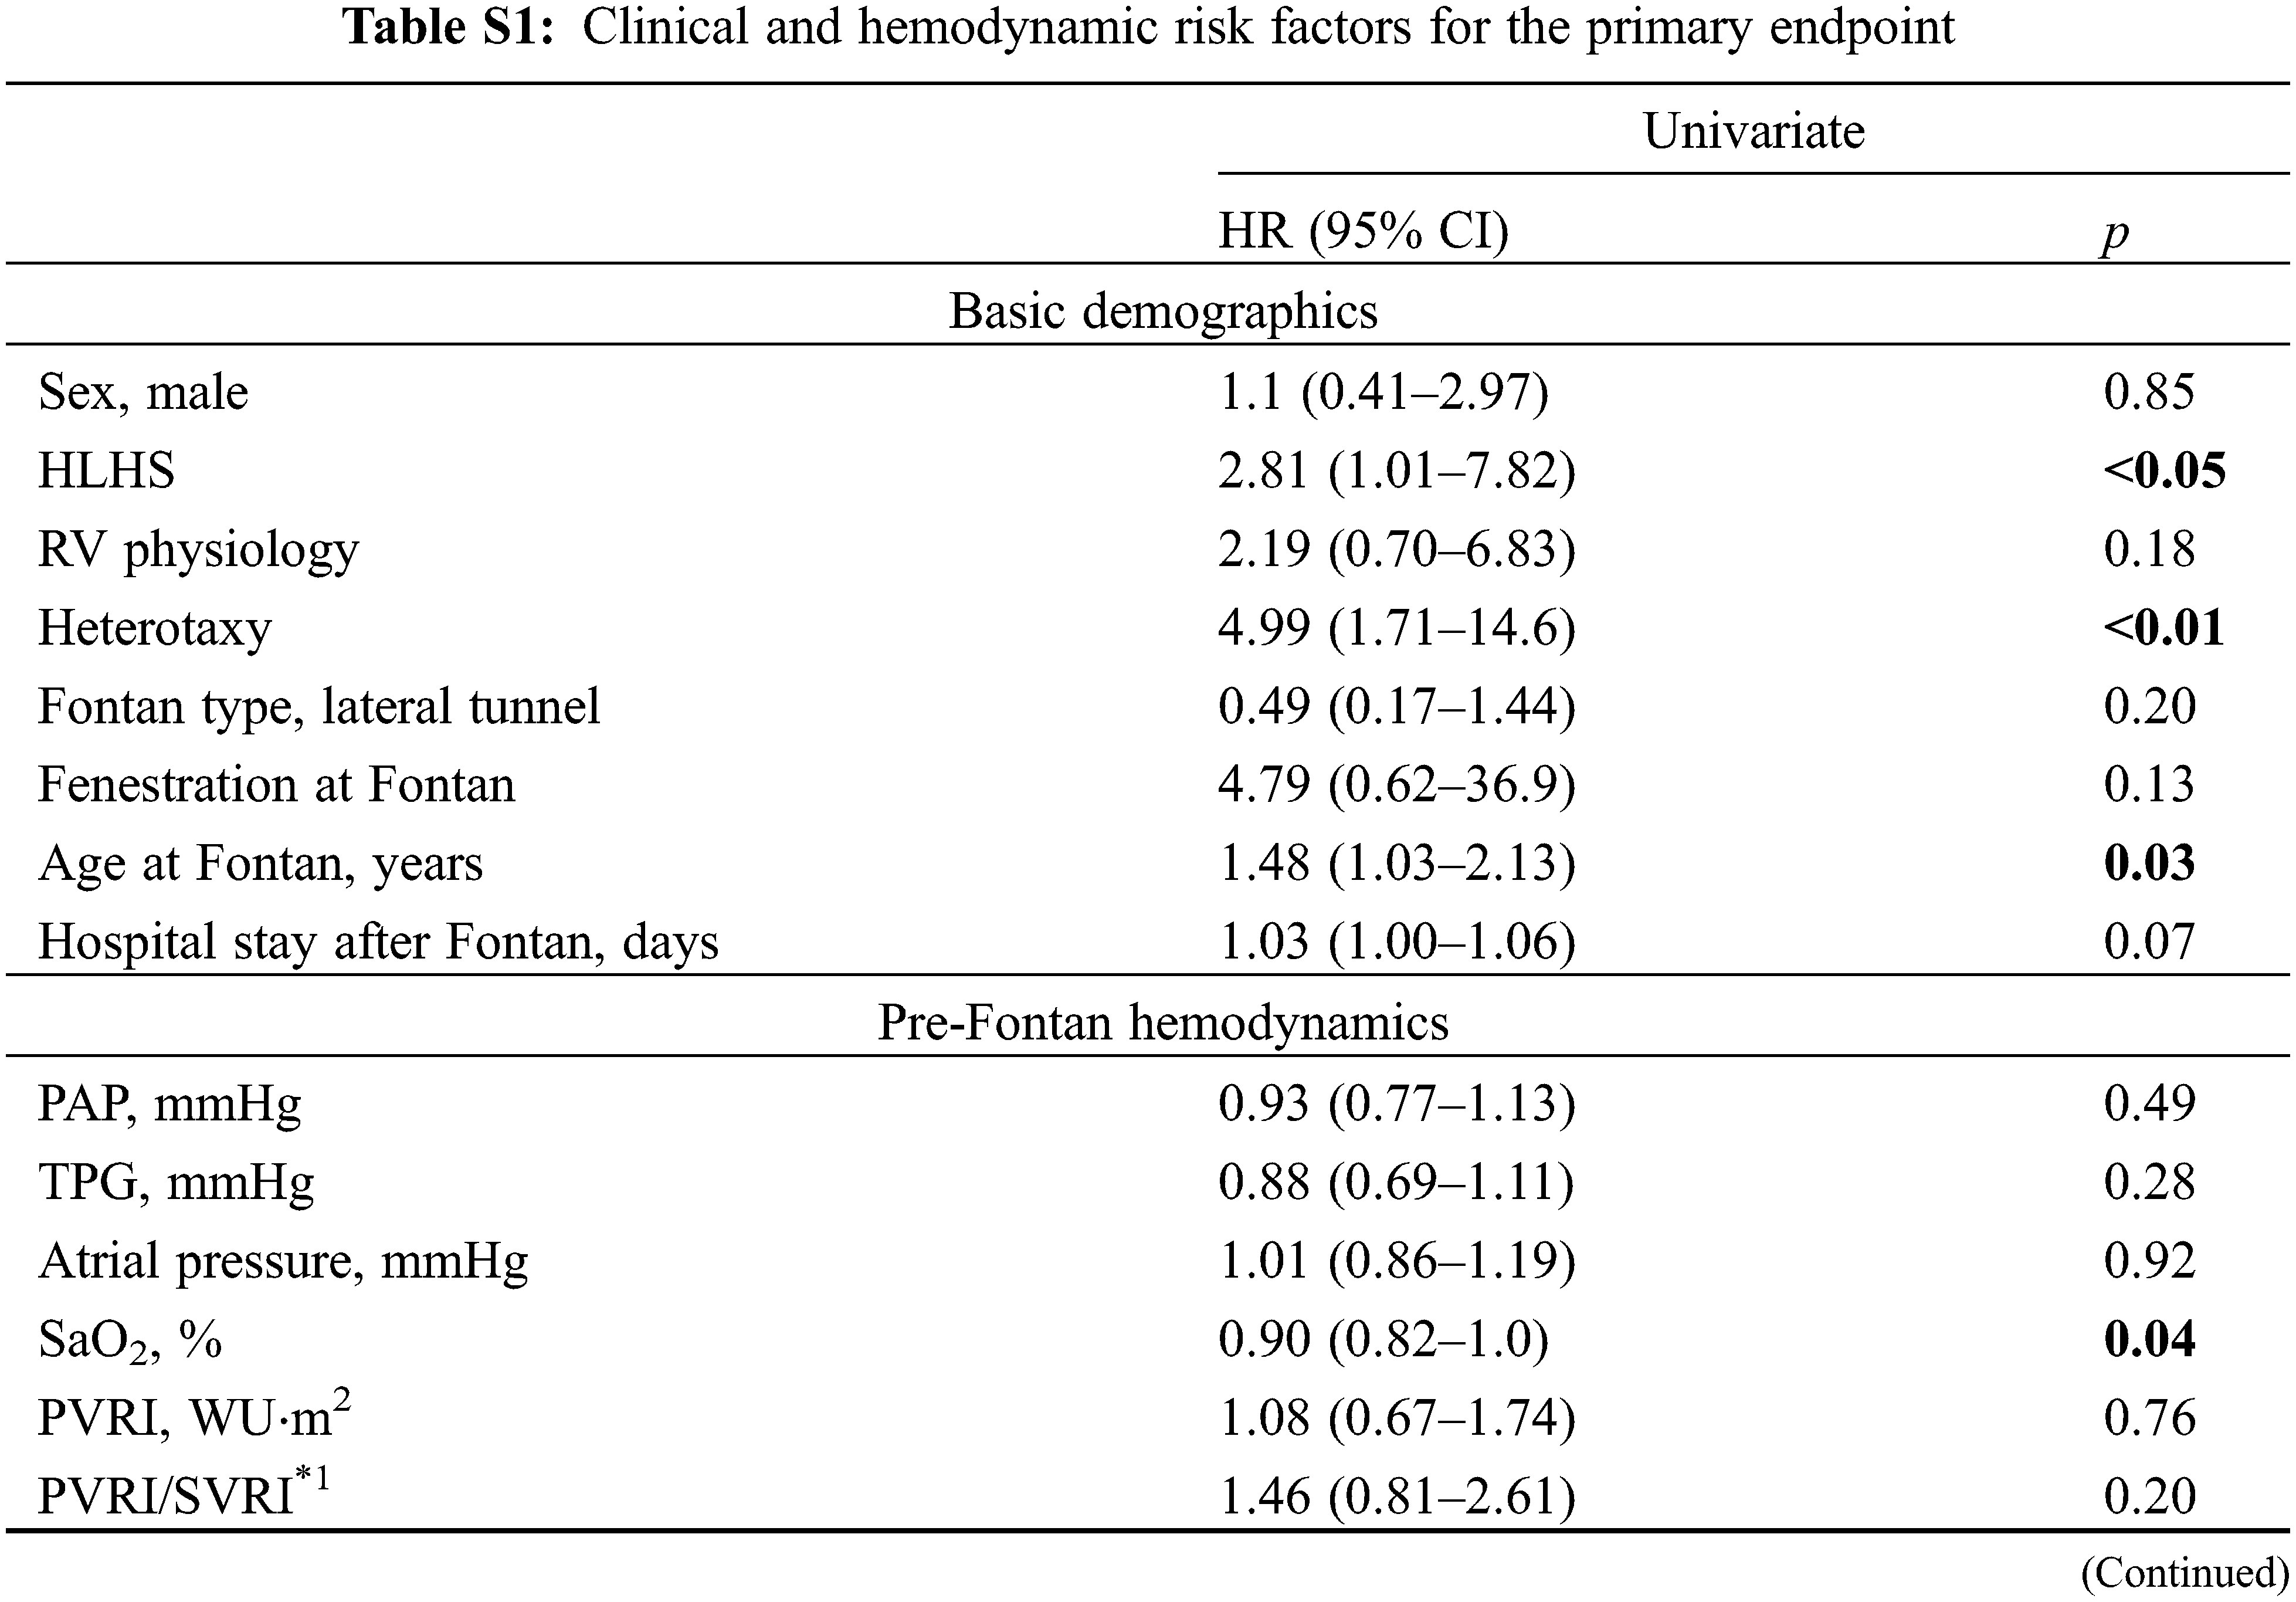
The Kaplan–Meier survival method demonstrated that freedom from the endpoint was significantly shorter in patients in category D (p < 0.01) (Fig. 2). The estimated 5-year freedom from the endpoint was 100% in category A, 92% in category B, 87% in category C, and 44% in category D. Category C showed the second poorer freedom from the endpoint, although it was not significant. Univariate analysis identified multiple factors associated with shorter freedom from the endpoint (Table 2) (full data shown in Supplementary Table S1). In models 1 and 2 of the multivariate analysis, not only FP, but also category D were identified as independent predictors of shorter freedom from the endpoint (Table 2).
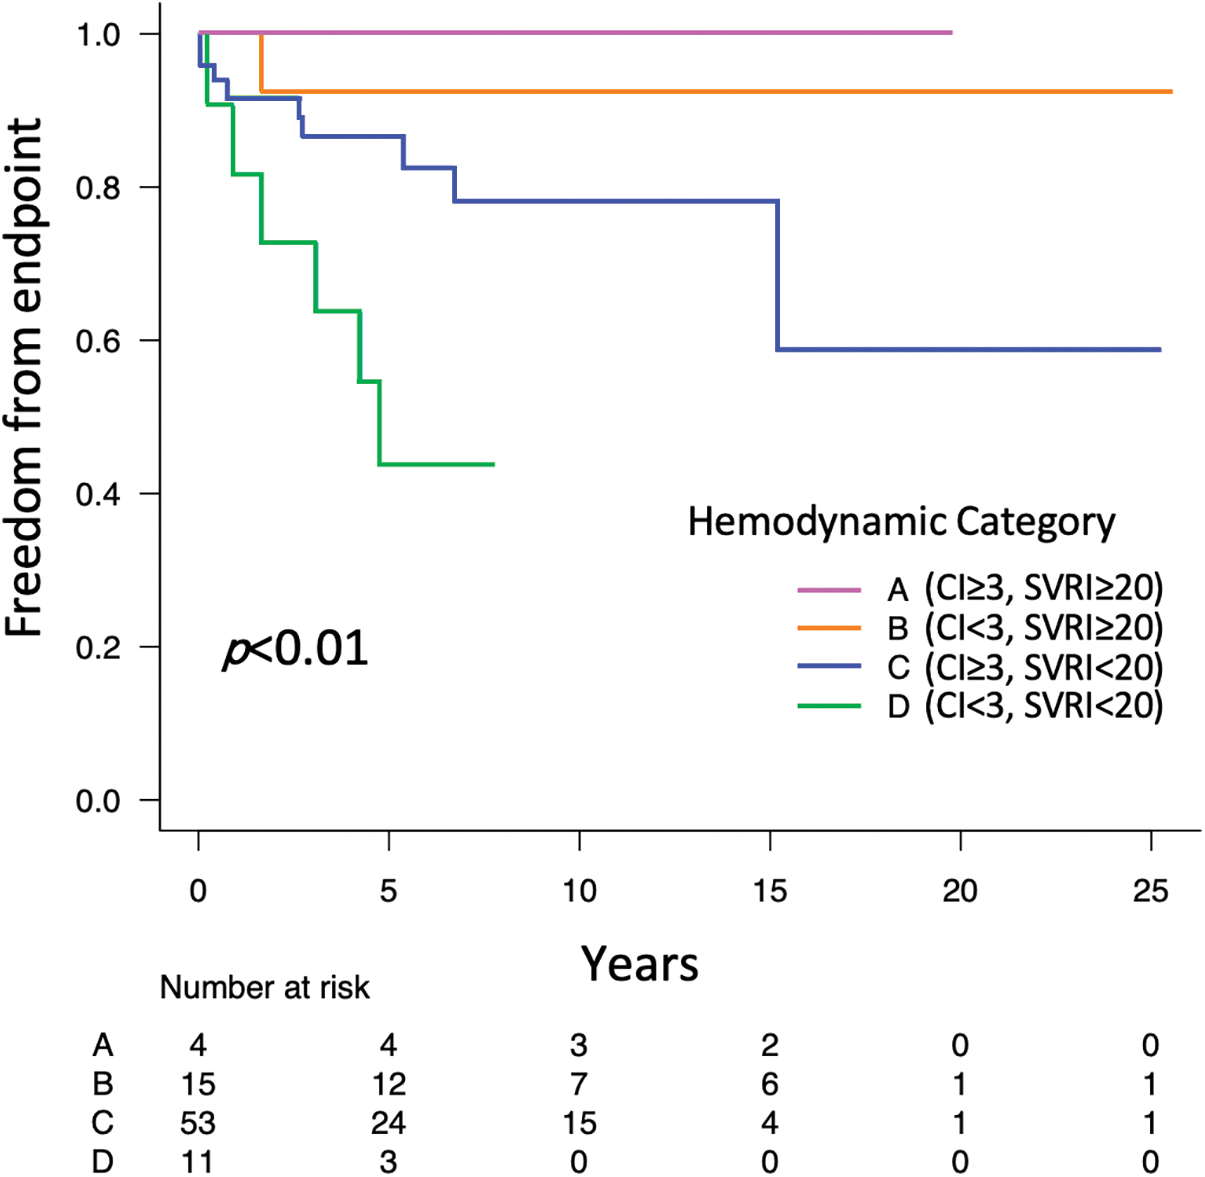
Figure 2: Kaplan–Meier curves comparing freedom from the combined endpoint of new-onset PLE/PB and Htx/death between the four hemodynamic categories
Note: CI cardiac index; Htx, heart transplant; PB, plastic bronchitis; PLE, protein losing enteropathy; SVRI, systemic vascular resistance index.
In this study, patients in the hemodynamic categories on a CI-SVR plot showed different clinical and hemodynamic tendencies. Category A had the best and category D had the poorest prognosis. Some clinical and hemodynamic variables were identified as predictors of poorer outcomes. Most importantly, not only FP, but also the hemodynamic category D were the independent predictors of poorer outcomes.
Although elevated FP has been identified as a risk factor for mortality, FP alone does not fully predict the outcome of patients with Fontan circulation [1,3,5,11–13]. Identification of additional hemodynamic variables, along with FP, that predict Fontan outcomes is needed. Therefore, this study provided further understanding of Fontan hemodynamics using a CI-SVR plot.
Systemic blood pressure or SVR and the CI are additional important hemodynamic variables along with FP in order to evaluate post-Fontan conditions. Hebson et al. [6] reported that SVRI in adult symptomatic post-Fontan patients was lower compared with asymptomatic pediatric post-Fontan patients (1,680 ± 368 vs. 1,960 ± 550 dyn s/cm5/m2, p = 0.02). Systemic artery vasoconstrictor therapy may prevent the rapid deterioration of the hemodynamics in patients with Fontan failure characterized by a high cardiac output [14]. On the CI-SVR plot, the PP between 20 and 160 mmHg is shown as a curved line, indicating each patients’ systemic blood pressure and FP (Fig. 3). The CI-SVR plot can visualize every important hemodynamic variable.
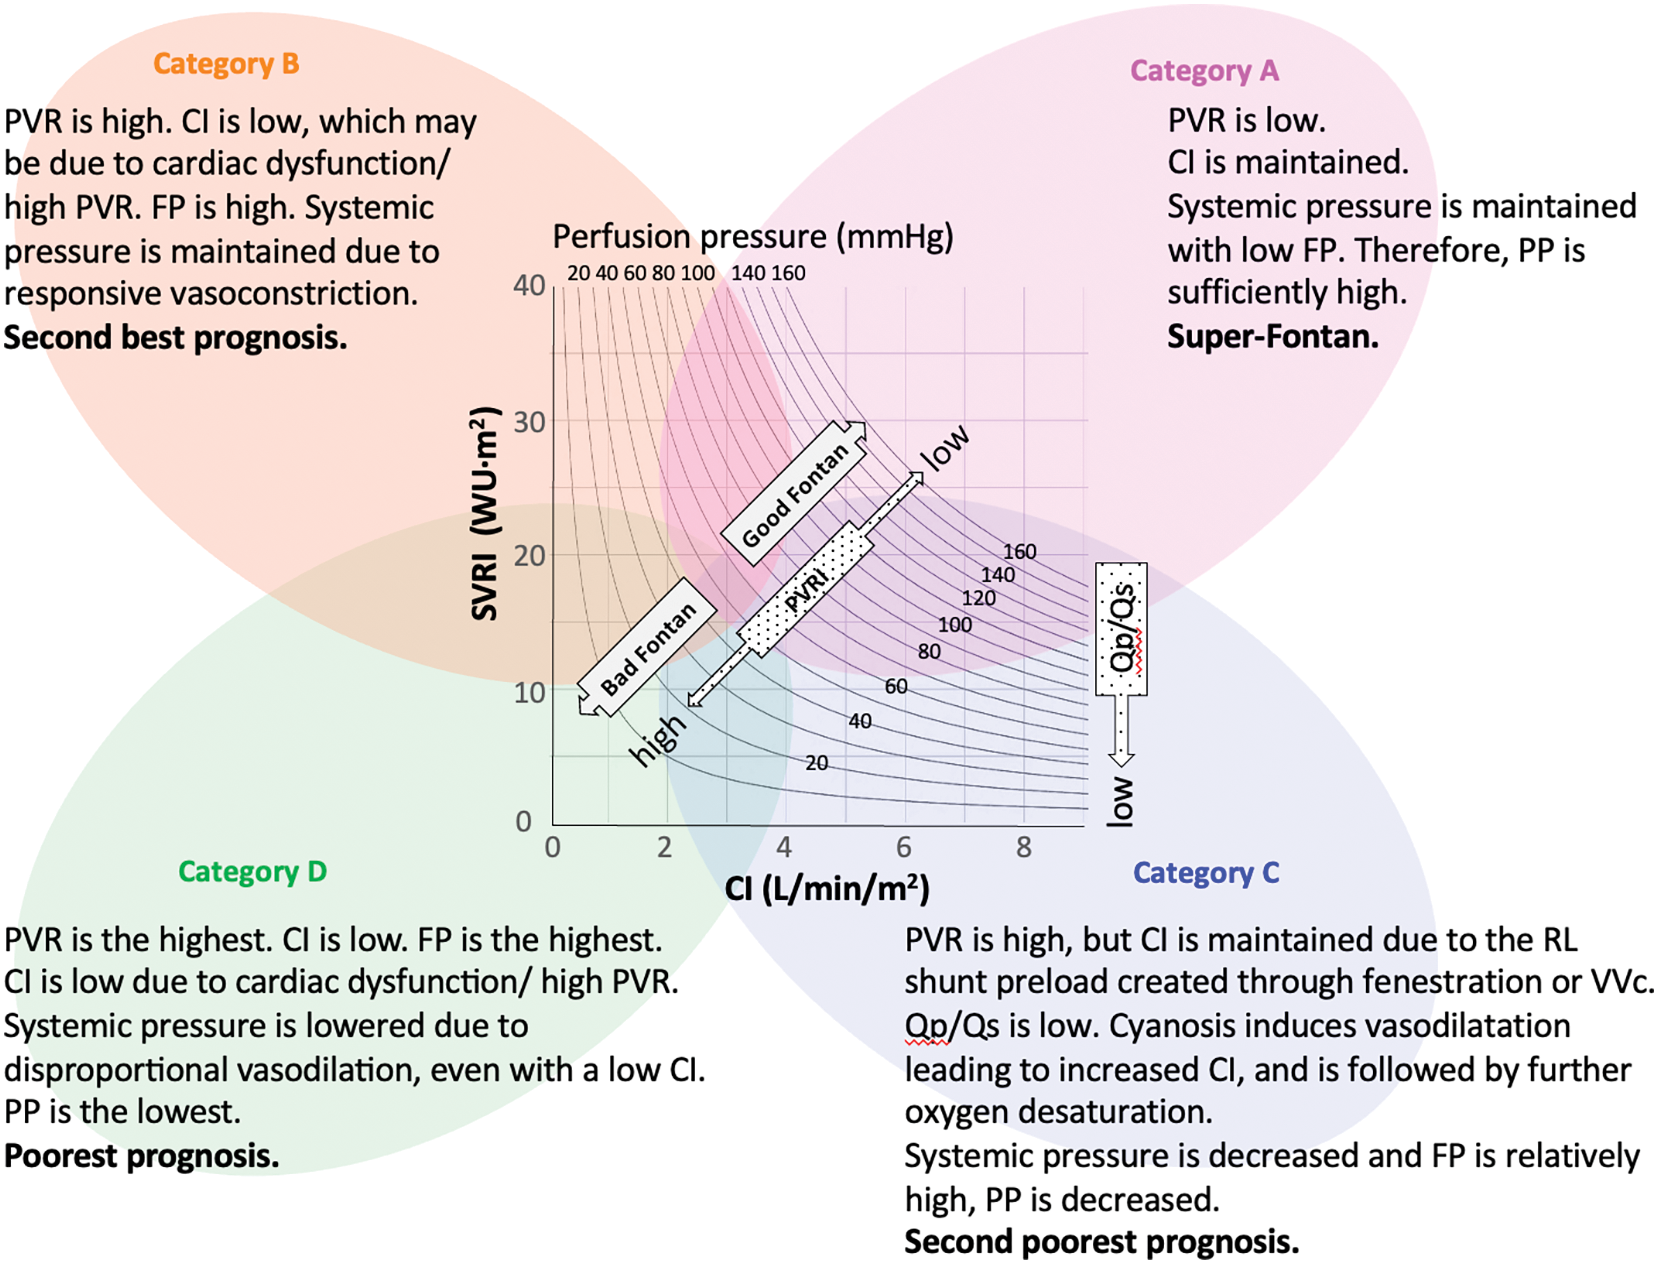
Figure 3: CI–SVR plot: speculation of hemodynamic characteristics and prognosis
Note: CI, cardiac index; FP, Fontan pressure; PVR, pulmonary vascular resistance; PVRI, pulmonary vascular resistance index; PLE, protein losing enteropathy; PP, perfusion pressure; Qp/Qs, pulmonary flow/systemic flow; RL, right to left; SVRI, systemic vascular resistance index; VVc, veno-venous collaterals.
We classified the CI-SVR plots into four categories to identify the post-Fontan clinical condition of the patients of each area. From the results, category A (CI ≥ 3, SVRI ≥ 20) consisted of patients who had excellent clinical conditions and a good prognosis. They may display the so-called “super-Fontan” phenotype. Their FP was low and the mean systemic pressure was high, resulting in high PP (Fig. 1). Their pulmonary vascular resistance (PVR) was lower than that of patients in other categories.
Patients in category B (CI < 3, SVRI ≥ 20) showed the second best outcome. Their higher PVRI, compared to the “super-Fontan” group, may have resulted in a low CI and high FP. However, their mean systemic pressure was maintained, possibly due to responsively increased vasoconstriction, as their SVR and PP were significantly higher than category D [15]. Impaired cardiac function may be the other cause for a low CI [3], although it was not statistically verified in the current study. This may be because a low CI in Fontan circulation is induced multi-factorially.
Patients in category C (CI ≥ 3, SVRI < 20) had the second poorest prognosis. Even with a higher PVR, compared to the “super-Fontan” group, their CI was maintained or increased. We speculated that the right-to-left shunt at fenestration or veno-venous collaterals complemented the CI. Their lower Qp/Qs could support this speculation. Their mean systemic pressure and PP was significantly low compared to category A, even though their CI was high. Systemic arteries dilate in response to hypoxia, although the mechanism is not fully understood [16]. Additionally, liver cirrhosis or a porto-systemic shunt may cause systemic vasodilatation [17,18]. Thus, the patients in category C were in a vasodilating stage.
Patients in category D had the significantly poorest prognosis (CI < 3, SVRI < 20). Their PVRI was higher than that in the other hemodynamic categories, resulting in a lowered CI and the highest FP (Fig. 1) [13]. Despite a lowered CI, their SVR was low. Systemic vasoconstriction cannot maintain blood pressure. It is understandable that low systemic pressure and high FP, resulting in low PP, is related to the poorest prognosis. A PP deficit is significantly correlated with impaired renal function [19]; impaired renal function is a significant risk factor for poorer outcomes in patients with Fontan circulation [5,20]. Overall, the speculated hemodynamic profiling categories are summarized in Fig. 3. There may be overlapping features between the categories, but their approximate location on the CI-SVR plot could indicate the hemodynamic status and prognosis.
In the clinical variables, hypoplastic left heart syndrome, heterotaxy, patent fenestration, NYHA III/IV, and ventricular dysfunction were identified as risk factors by univariate analysis, which is consistent with the results of a previous report [11,21,22]. Shorter duration after the Fontan operation was associated with poorer outcomes. This study may be biased as some of the patients may have been sicker and, thus, required cardiac catheterization at a younger age.
In the hemodynamic variables, the CI or SVRI itself was not associated with the prognosis. However, Category D, which is combination of a low CI and a low SVRI, was identified as an independent predictor of prognosis, in addition to the elevated FP. Book et al. [5] maintained that the phenotype of Fontan failure with reduced ejection fraction is more common in the pediatric population. It is reported that reduced ejection fraction and increased end-diastolic ventricular volume is associated with increased mortality in the early post-Fontan period only, not the late [3]. In the present pediatric cohort, we observed that the patients with reduced ejection fraction were likely be included in categories with low CI. The current study gave further evidence that a low CI (reduced ejection fraction), if accompanied by low SVR, as in category D, is the predictor for poor prognosis. Focusing not only on FP, but also on the combination of the CI and SVR, enabled the identification of post-Fontan patients with poor prognosis.
It has been shown that there is a pediatric post-Fontan patient phenotype with high FP and high cardiac output and that it is also related to increased mortality [3]. The patients with that phenotype were included in category C in this study because no patients in category A had high FP (≥ 14). Category C had the second poorest outcome, although the differences were not significant. An analysis including a larger patient population may reveal that category C is also a risk factor for poorer outcomes.
The PVRI is one of the determinants of FP [13]. Fontan-associated diseases are linked with slight elevations of the PVRI [13,23]. In contrast, PVRI was not a significant risk factor in the present study. In the present cohort, the PVRI was positively correlated to FP (Spearman’s rank correlation coefficient: 0.40, p < 0.01) and elevated FP was identified as a risk factor. A larger sample size may reveal high PVRI as a risk factor.
Patients in categories C and D, which included patients with a low SVRI in this study, had poorer clinical outcomes. Low SVR should be controlled to improve patients’ prognoses. Miike et al. [14] reported that systemic artery vasoconstrictor therapy may elevate systemic blood pressure, SVR, and arterial oxygen saturation without significant changes in FP or the CI, which means that the point on the CI-SVR plot moves up with elevated PP (Fig. 3). Systemic vasoconstrictor therapy modifies SVR, improving the PP if cardiac function can be sustained to maintain the CI against an increased SVR. However, end-diastolic ventricular pressure and FP will be elevated inversely if the cardiac function may become worsened by elevated SVR. These patients would have no improvement in PP (moving up and left on the plot). Thus, the CI-SVR plot can give an overall grasp of hemodynamic conditions, including FP, systemic arterial pressure, PP, SVR, and CI, and may be helpful for comprehending the changes in hemodynamic status so that the optimal treatment target can be identified.
This study has some limitations. This was a single-center, retrospective study. The small patient population rendered the study unable to identify the significant differences of the clinical variables between the categories. For example, category A consisted of only 4 patients, which means that only a few patients could be identified as “Super-Fontan”. Larger sample sizes will help clarify the characteristics of the four hemodynamic categories more precisely and identify the best border value of the CI and SVRI for categorization. In the Cox proportional hazards model, a multivariate analysis was performed using only a few variables due to the small number of patients with endpoints. Furthermore, Fontan-associated liver disease, renal function, thrombotic events, and exercise capacity were not analyzed in the current study. The characteristics of these variables require further analysis. The longitudinal observation of each patient’s hemodynamic categories may reveal the hemodynamic transition over time in patients with Fontan circulation. This may help determine the optimal hemodynamic adjustment at the most ideal time-point for maintaining good Fontan circulation.
Hemodynamic profiling of post-Fontan patients using the CI-SVR plot allowed for the elucidation of post-Fontan clinical features. In addition to elevated FP, category D was identified as an independent hemodynamic predictor of subsequent clinical deterioration. Hemodynamic profiling using the CI-SVR plot has the potential to be a predictive adjunctive method for modifying the medical management of post-Fontan patients.
Acknowledgement: We would like to thank all of the medical doctors and co-workers’ kindness and support at the Children’s Hospital of Michigan.
Funding Statement: The authors received no specific funding for this study.
Author Contributions: The authors confirm contribution to the paper as follows: conceptualization, methodology, data curation: writing-original draft preparation: Y. Kawasaki; conceptualization, writing-reviewing and editing: T. Sasaki; supervision, validation, writing-reviewing and editing: D. Kobayashi. All authors reviewed the results and approved the final version of the manuscript.
Availability of Data and Materials: The datasets used in the current study are available from the corresponding author upon reasonable request.
Ethics Approval: This study was approved by the Wayne State University Institutional Research Board and the Detroit Medical Center Research Review and was conducted according to the Declaration of Helsinki.
Conflicts of Interest: The authors declare that they have no conflicts of interest to report regarding the present study.
References
1. Pundi, K. N., Johnson, J. N., Dearani, J. A., Pundi, K. N., Li, Z. et al. (2015). 40-year follow-up after the Fontan operation long-term outcomes of 1052 patients. The Journal of the American College of Cardiology, 66, 1700–1710. [Google Scholar] [PubMed]
2. Ohuchi, H. (2016). Adult patients with Fontan circulation: What we know and how to manage adults with fontan circulation? Journal of Cardiology, 68(3), 181–189. [Google Scholar] [PubMed]
3. Ohuchi, H., Miyazaki, A., Negishi, J., Hayama, Y., Nakai, M. et al. (2017). Hemodynamic determinants of mortality after Fontan operation. American Heart Journal, 189, 9–18. [Google Scholar] [PubMed]
4. Miranda, W. R., Borlaug, B. A., Hagler, D. J., Connolly, H. M., Egbe, A. C. (2019). Haemodynamic profiles in adult Fontan patients: Associated haemodynamics and prognosis. European Journal of Heart Failure, 21, 803–809. [Google Scholar] [PubMed]
5. Book, W. M., Gerardin, J., Saraf, A., Marie Valente, A., Rodriguez 3rd, F. (2016). Clinical phenotypes of Fontan failure: Implications for management. Congenital Heart Disease, 11(4), 296–308. [Google Scholar] [PubMed]
6. Hebson, C. L., McCabe, N. M., Elder, R. W., Mahle, W. T., McConnell, M. et al. (2013). Hemodynamic phenotype of the failing Fontan in an adult population. The American Journal of Cardiology, 112(12), 1943–1947. [Google Scholar] [PubMed]
7. LaFarge, C. G., Miettinen, O. S. (1970). The estimation of oxygen consumption. Cardiovascular Research, 4(1), 23–30. [Google Scholar] [PubMed]
8. John, A. S., Johnson, J. A., Khan, M., Driscoll, D. J., Warnes, C. A. et al. (2014). Clinical outcomes and improved survival in patients with protein-losing enteropathy after the Fontan operation. Journal of the American College of Cardiology, 64(1), 54–62. [Google Scholar] [PubMed]
9. Kanda, Y. (2013). Investigation of the freely available easy-to-use software “EZR” (Easy R) for medical statistics. Bone Marrow Transplant, 48, 452–458. [Google Scholar] [PubMed]
10. Bartz, P. J., Driscoll, D. J., Dearani, J. A., Puga, F. J., Danielson, G. K. et al. (2006). Early and late results of the modified fontan operation for heterotaxy syndrome 30 years of experience in 142 patients. Journal of the American College of Cardiology, 48(11), 2301–2305. [Google Scholar] [PubMed]
11. Poh, C. L., d’Udekem, Y. (2018). Life after surviving Fontan surgery: A meta-analysis of the incidence and predictors of late death. Heart, Lung & Circulation, 27(5), 552–559. [Google Scholar]
12. Ohuchi, H., Yasuda, K., Miyazaki, A., Kitano, M., Sakaguchi, H. et al. (2013). Haemodynamic characteristics before and after the onset of protein losing enteropathy in patients after the Fontan operation. European Journal of Cardio-Thoracic Surgery, 43(3), e49–57. [Google Scholar] [PubMed]
13. Egbe, A. C., Reddy, Y. N. V., Khan, A. R., Al-Otaibi, M., Akintoye, E. et al. (2018). Venous congestion and pulmonary vascular function in Fontan circulation: Implications for prognosis and treatment. International Journal of Cardiology, 271, 312–316. [Google Scholar] [PubMed]
14. Miike, H., Ohuchi, H., Hayama, Y., Isawa, T., Sakaguchi, H. et al. (2021). Systemic artery vasoconstrictor therapy in Fontan patients with high cardiac output-heart failure: A single-center experience. Pediatric Cardiology, 42(3), 700–706. [Google Scholar] [PubMed]
15. Saiki, H., Kuwata, S., Iwamoto, Y., Ishido, H., Taketazu, M. et al. (2019). Fenestration in the Fontan circulation as a strategy for chronic cardioprotection. Heart, 105(16), 1266–1272. [Google Scholar] [PubMed]
16. Waypa, G. B., Schumacker, P. T. (2010). Hypoxia-induced changes in pulmonary and systemic vascular resistance: Where is the O2 sensor? Respiratory Physiology & Neurobiology, 174(3), 201–211. [Google Scholar]
17. Møller, S., Bendtsen, F. (2018). The pathophysiology of arterial vasodilatation and hyperdynamic circulation in cirrhosis. Liver International, 38(4), 570–580. [Google Scholar]
18. Nagata, H., Sakamoto, I., Fukuoka, S., Ishikita, A., Uike, K. et al. (2021). Portosystemic venous shunt in the patients with Fontan circulation. Heart and Vessels, 36(2), 285–290. [Google Scholar] [PubMed]
19. Saito, S., Uchino, S., Takinami, M., Uezono, S., Bellomo, R. (2016). Postoperative blood pressure deficit and acute kidney injury progression in vasopressor-dependent cardiovascular surgery patients. Critical Care, 20(1), 74. [Google Scholar] [PubMed]
20. Ohuchi, H., Negishi, J., Hayama, Y., Miyazaki, A., Shiraishi, I. et al. (2017). Renal resistive index reflects fontan pathophysiology and predicts mortality. Heart, 103(20), 1631–1637. [Google Scholar] [PubMed]
21. d’Udekem, Y., Iyengar, A. J., Galati, J. C., Forsdick, V., Weintraub, R. G. et al. (2014). Redefining expectations of long-term survival after the Fontan procedure: Twenty-five years of follow-up from the entire population of Australia and New Zealand. Circulation, 130(11 Suppl 1), S32–38. [Google Scholar] [PubMed]
22. Alsaied, T., Bokma, J. P., Engel, M. E., Kuijpers, J. M., Hanke, S. P. et al. (2017). Factors associated with long-term mortality after Fontan procedures: A systematic review. Heart, 103(2), 104–110. [Google Scholar] [PubMed]
23. Egbe, A. C., Connolly, H. M., Miranda, W. R., Ammash, N. M., Hagler, D. J. et al. (2017). Hemodynamics of fontan failure: The role of pulmonary vascular disease. Circulation. Heart Failure, 10(12), e004515. [Google Scholar] [PubMed]
Supplementary Materials
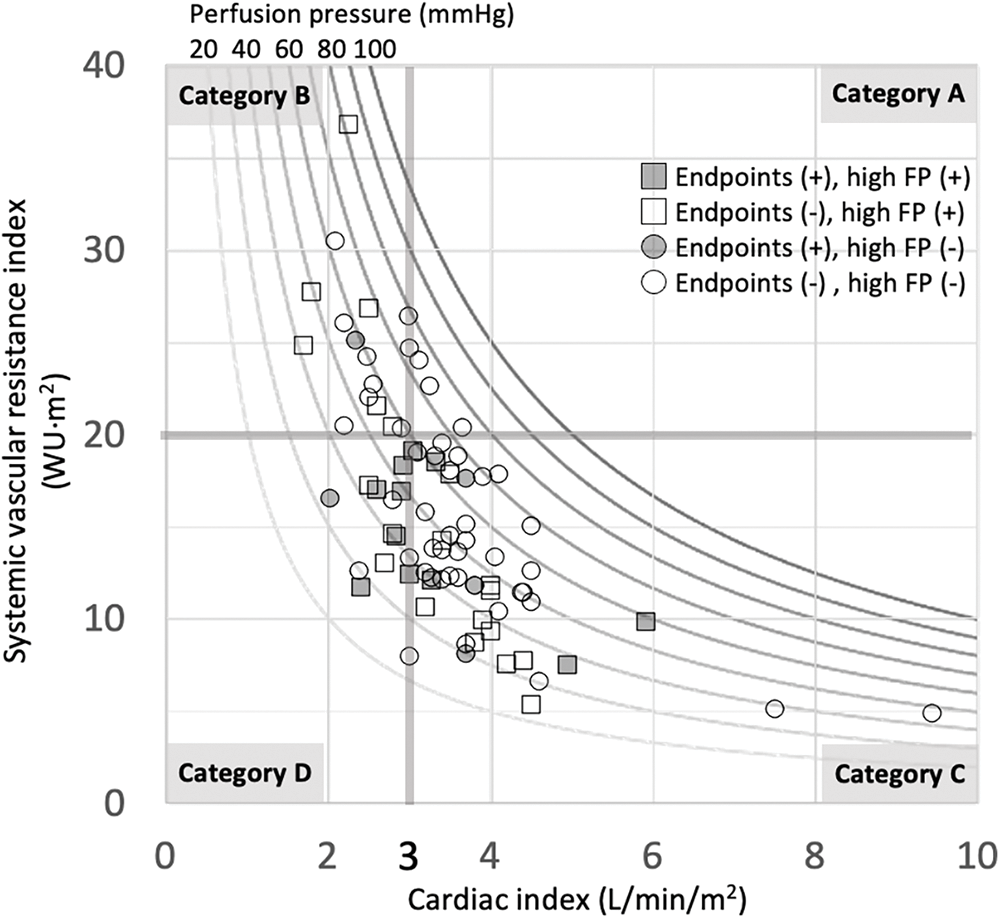
Figure S1: CI-SVR plot for all patients
Note: Different perfusion pressures from 20 to 100 mmHg are described by the curve lines per 10 mmHg. White dots indicate no endpoints. Grey dots indicate positive endpoints. Circle dots indicate Fontan pressure (FP) < 14 mmHg. Square dots indicate FP ≥ 14 mmHg.
Cite This Article
 Copyright © 2023 The Author(s). Published by Tech Science Press.
This work is licensed under a Creative Commons Attribution 4.0 International License , which permits unrestricted use, distribution, and reproduction in any medium, provided the original work is properly cited.
 Downloads
 Citation Tools