 Open Access
ARTICLE
Query Optimization Framework for Graph Database in Cloud Dew Environment
1 Department of Computer Science, Lahore Garrison University, Lahore, Pakistan
2 Faculty of Computer Science and Information Systems Islamic University Madinah, Madinah, 42351, Saudi Arabia
3 Networks and Communications Department, College of Computer Science and Information Technology, Imam Abdulrahman Bin Faisal University, P.O. Box 1982, Dammam, 31441, Saudi Arabia
4 Department of Computer Science, Virtual University of Pakistan, Lahore, Pakistan
* Corresponding Author: Nadia Tabassum. Email:
Computers, Materials & Continua 2023, 74(1), 2317-2330. https://doi.org/10.32604/cmc.2023.032454
Received 18 May 2022; Accepted 12 July 2022; Issue published 22 September 2022
Abstract
The query optimizer uses cost-based optimization to create an execution plan with the least cost, which also consumes the least amount of resources. The challenge of query optimization for relational database systems is a combinatorial optimization problem, which renders exhaustive search impossible as query sizes rise. Increases in CPU performance have surpassed main memory, and disk access speeds in recent decades, allowing data compression to be used—strategies for improving database performance systems. For performance enhancement, compression and query optimization are the two most factors. Compression reduces the volume of data, whereas query optimization minimizes execution time. Compressing the database reduces memory requirement, data takes less time to load into memory, fewer buffer missing occur, and the size of intermediate results is more diminutive. This paper performed query optimization on the graph database in a cloud dew environment by considering, which requires less time to execute a query. The factors compression and query optimization improve the performance of the databases. This research compares the performance of MySQL and Neo4j databases in terms of memory usage and execution time running on cloud dew servers.Keywords
Compression and query optimization are the most two factors for performance development. Compression decreases data length, and optimizing queries minimize runtime. To compact the database, a dictionary solution with the improved use of several small dictionaries instead of a massive dictionary [1]. Graph databases must be able to implement business rules specific to an application domain, just like any other database system. There are currently just a few techniques for implementing business rules in Graph Database Management, aside from integrity restrictions. There is no explicit notation on the underlying property graph in the data model [2].
Query optimization depends upon the following components
• Query parsing
• Query transformation
• Cost estimation
• Plan generation
• Data Dictionary
All components of the query optimizer need acknowledgement at the individual level, and the result will be sent back to the query as shown in Fig. 1. Compression is the process used to reduce the volume of the database. Many compression schemes are divided into two main types: the first one is known as a lossy compression scheme, and the second one is called a lossless compression scheme. By compromising quality, we can get a higher compression ratio in lossy compression schemes. In contrast, we can get the same copy of input data in lossless compression schemes, but a lesser compression ratio is achieved [3].
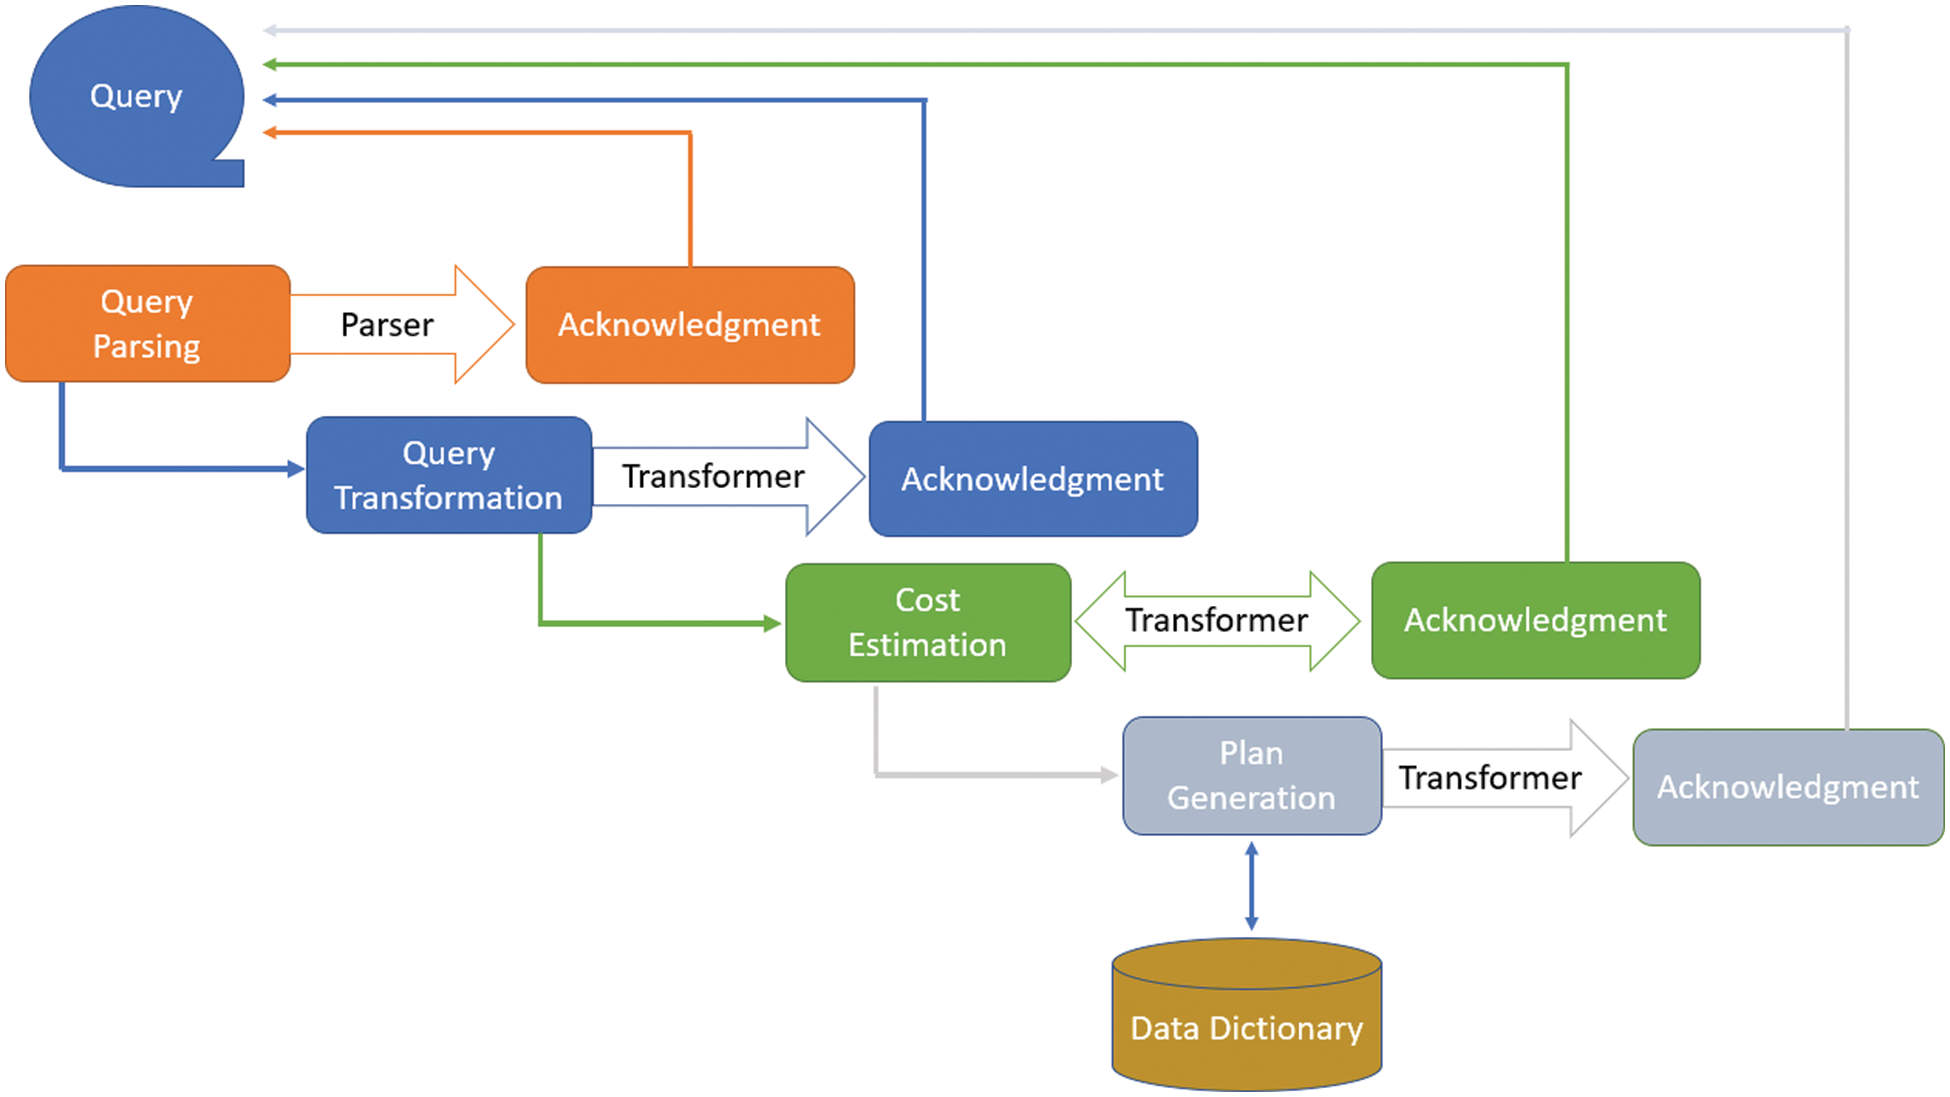
Figure 1: Components of query optimizer
Due to the wide range of potential applications, graph databases have attracted much interest recently (e.g., social networks, biomedical networks, data stemming from the web). Graph data are no different from other public data in that they frequently have issues with quality. The problem of handling quality data when searching graph databases required such a framework that enables the inclusion of fuzzy quality preferences in graph pattern queries. The model is the set of rules to get the code for the input symbol depending upon the probabilities defined in the model for a symbol. The coder is the program that generates the code for an input symbol according to probabilities defined in a model. The statistical model used probabilities for code, and the dictionary-based model produced code for a string instead of a single character. This scheme uses two approaches, such as Static and adaptive. The static approach requires scanning whole data for statistics. The static compression schemes are the bit reduction algorithm, Huffman Coding, Run Length Encoding, Shannon Fano Coding, and arithmetic algorithm. In contrast, adaptive schemes do not require whole scanning data to produce code [4].
To more effectively manage the Analysis of this type of data, our method relies on pre-aggregation techniques. A conceptual model is proposed to represent the original resource description framework (RDF) data with aggregates in a multidimensional structure. The proposed conceptual model is then translated into a rule for a popular multidimensional RDF modelling vocabulary. Six different data stores—two RDF triple stores, one graph-oriented NoSQL database, one column-oriented data store, and two relational databases are used to implement the conceptual model (MySQL and PostgreSQL). It takes transformed queries and their costs and selects a plan for execution [5].
Hence, query optimizer does their functionality, such as converting high-level SQL queries into equivalent algebraic queries that produce the same results, cost estimation, and execution plan with minimum cost. Fig. 2 shows the complete flow of queries from submission to execution that retrieve data from the compressed corpus.
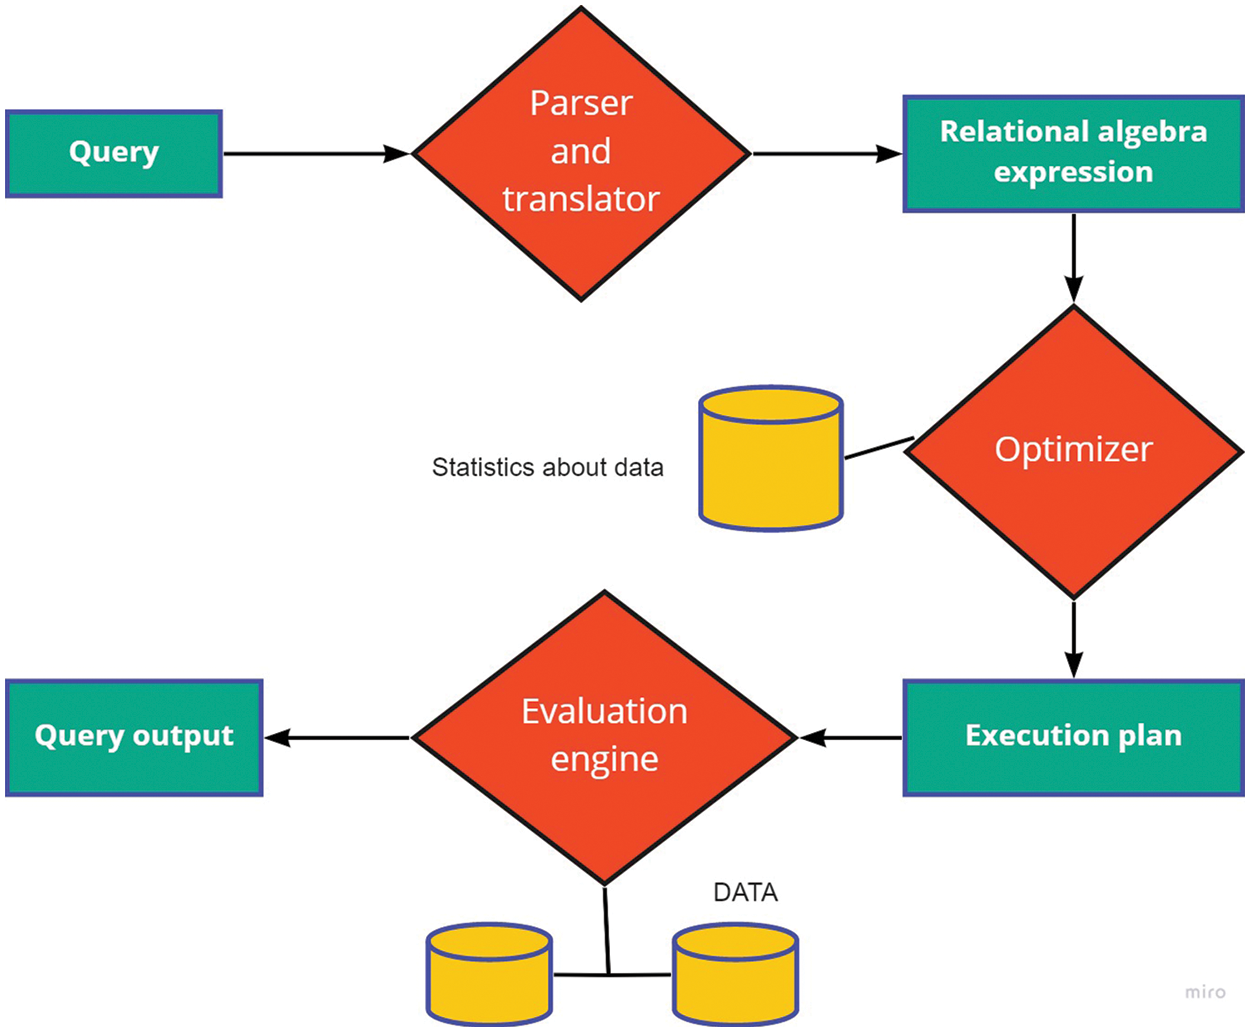
Figure 2: Query processing
The deterministic algorithm used dynamic programming, whose processing time grows exponentially. In the Genetic algorithm, one relation becomes prominent and dominates others. Traditional databases have had difficulty coping with these huge amounts of data and complex data because enterprise social networks are valued and used by businesses more and more. As a result, social networking platforms’ data capacities are growing, and the relationships between data are becoming more and more complex. This study proposes [6] an unstructured data model that can convert structured data into graph data, move hive data to neo4j, and make it simple for individuals to discover relationships between data and consider the potential value of visual data.
This work [7] investigates the flexible job scheduling problem with additional task precedence restrictions, time constraints, and stock constraints to address the demand for scheduling complicated fabricated items manufactured. Neo4j is creatively introduced to address this issue as a potent graph database that works with corresponding data and welcomes relationships in flexible graphs.
The query processing process consist of a parser and translator to optimize the relational algebra expression and store the statistics about the data [8]. It solves the problem of a high-cost local minimum. Query optimization is not as easy as in typical databases because it is unaware of the compression and decompression, so it does not work on the compressed domain [9]. When we use a typical query and optimizer in a consolidated database, it requires decompression. Decompression increases execution time. Decompression degrades the performance, there are many solutions to this problem [10].
Highly connected data and complicated queries over this data are managed using graph databases, also known as graph-oriented databases. Queries involve not just data values but also graph topologies. By traversing the graph and gathering data from nodes and edges, it is feasible to achieve good performance for local reads by defining a pattern and a set of beginning points [11].
The author proposed [12] that data remains compressed in memory, and compressed query predicates operate on a compressed database. We use row compression up to the attribute level. We use a dictionary-based scheme to compress data. Usually, one big dictionary takes more time loading and scanning, degrading performance. Because of this problem, we use many small dictionaries instead of one big dictionary. Only those dictionaries are loaded into memory, which is required. We use a Randomized algorithm with Iterative Improvement, which suffers in a high-cost local minimum [13].
Information Graph depends on triples (two substances and their connection). Over the past few decades, with the advent of more semantic information, the volume of semantic information sources has increased and connected open information has filled the size. Various explorations have suggested procedures for securing some adaptable information for constructing comprehensive scope information Graphs in the constructing comprehensive scope information Graphs in knowledge graphs [14].
Big Data & Digital technology with the advent of digital technology, big data and the Internet of things (IoT) using cloud software are expected to generate a lot of information across websites worldwide. IoT-based ecosystems can cost a lot of money to maintain. The author highlighted heterogeneous devices’ energy and performance requirements in this research. Data processing applications over IoT and big data using machine learning algorithms for data processing through network cost and increased processing demand using devices raspberry Pi and intel-based server. Both devices can process the data more efficiently during the evaluation to achieve better energy and performance using machine-learning algorithms [15].
Geospatial data is essential for creating citizen-centred services for the sustainable growth of society in the age of smartphones, including disaster management services, the creation of smart cities, and finding basic facilities like banks, schools, hospitals, and train stations. Due to collecting the three key characteristics of big data—volume, diversity, and velocity—people are creating geotagged data on numerous social media platforms, such as Facebook, Twitter, and others [16].
Numerous sources produce large amounts of heterogeneous data that cannot fit into a predetermined format. Furthermore, the applications that use this data need a faster throughput rate. It might be quite challenging to manage such a large volume of data. Instead of the more conventional Relational Database Management System, large data management approaches like No SQL must be used to handle this geotagged data. Before creating any Geographic Information System-based application, it is crucial to choose the right kind of No SQL database. This research sought to identify an appropriate No SQL data source for GIS use [17].
Although blog-based information the executives model possesses end-less points of interest that serve to help the informal learning and the board in the association, there are a few issues. The development of networks and individual connections could encourage the progression of implied information and the portrayal of implicit information is a crucial measurement for information creation. A coordinated non-cyclic diagram is the suggested stockpiling structure for information provenance data, regardless of whether the MySQL social information base and Neo4j [18].
There are numerous sorts of diagram programming that store and question the graph. These social applications utilized Graph information bases to store their associated and huge measure of information. Displaying object connections can be effectively overseen through Graph information bases. NoSQL diagram data set would be a solid and suitable decision for the provenance framework [19].
Graph data in significant medical care frameworks and the advantages of using graphical information to speak to and break down wellbeing-related information. Substances, which can be ideas or cases, are a reflection on a graph for information terms, with which one can simply say how to associate vertices with connecting edges. Such a mapping is equivalent to the most existing procedure in low-dimensional, which simply illuminates the semantic ratios of substances and does not consider the compact descriptions of the elements [20].
It explains the use of imaging information in large medical systems and considers the benefits of using imaging data to represent and analyze health-related data. It explains the use of imaging information in large medical systems and considers the benefits of using imaging data to represent and analyze health-related data. Data type databases are best suited for areas where data or topology is more important than data, i.e., data and relationships between data are often of the same degree. To recuperate adaptability inside excessively synchronous outstanding tasks at hand, Neo4j utilizes two phases of storing. Scaling inside may perfect through scaling vertically [21].
Over the past decade, with the release of so much semantic data, the number of semantic sources has grown and the number of open-source data has grown exponentially. Various research [22] has been devoted to extensive knowledge acquisition techniques in constructing large graphs. The Knowledge graph structure depicts the relation between structured data and their type. According to the structure category, the data process is batch processing or text processing. The knowledge graph or table is based on three (two entities and their relationships). The degree of general Knowledge has been developed from the ground up. Field degrees are often adapted from the top down to the ontology definition to organize the knowledge structure [23].
SQL information is direct information and can handle a specific measure of information. While various associations structure countless assorted and associated informational collections. New advances, strategies, and techniques are kept up with the leftover, enormous, associated informational collections. In this way, NoSQL information bases can handle such huge information precisely [24].
The proposed research implements the efficient algorithm in which the relational model is mapped to a graph, and the same node is minimally copied. This helps keep the most frequently visited objects nearby, significantly reducing data collection time. The following text explains the implementation methodology and algorithm used in detail for a manufacturing query solver; the connectivity can be shown as the graph to explain the relational diagram between problems, Knowledge and knowledge matching. Modern applications face the challenge of handling large amounts of interconnected data, and you must pick an efficient technology to cope with it. Therefore, the proposed framework for knowledge reusability and easy retrieval, as shown in Fig. 3.
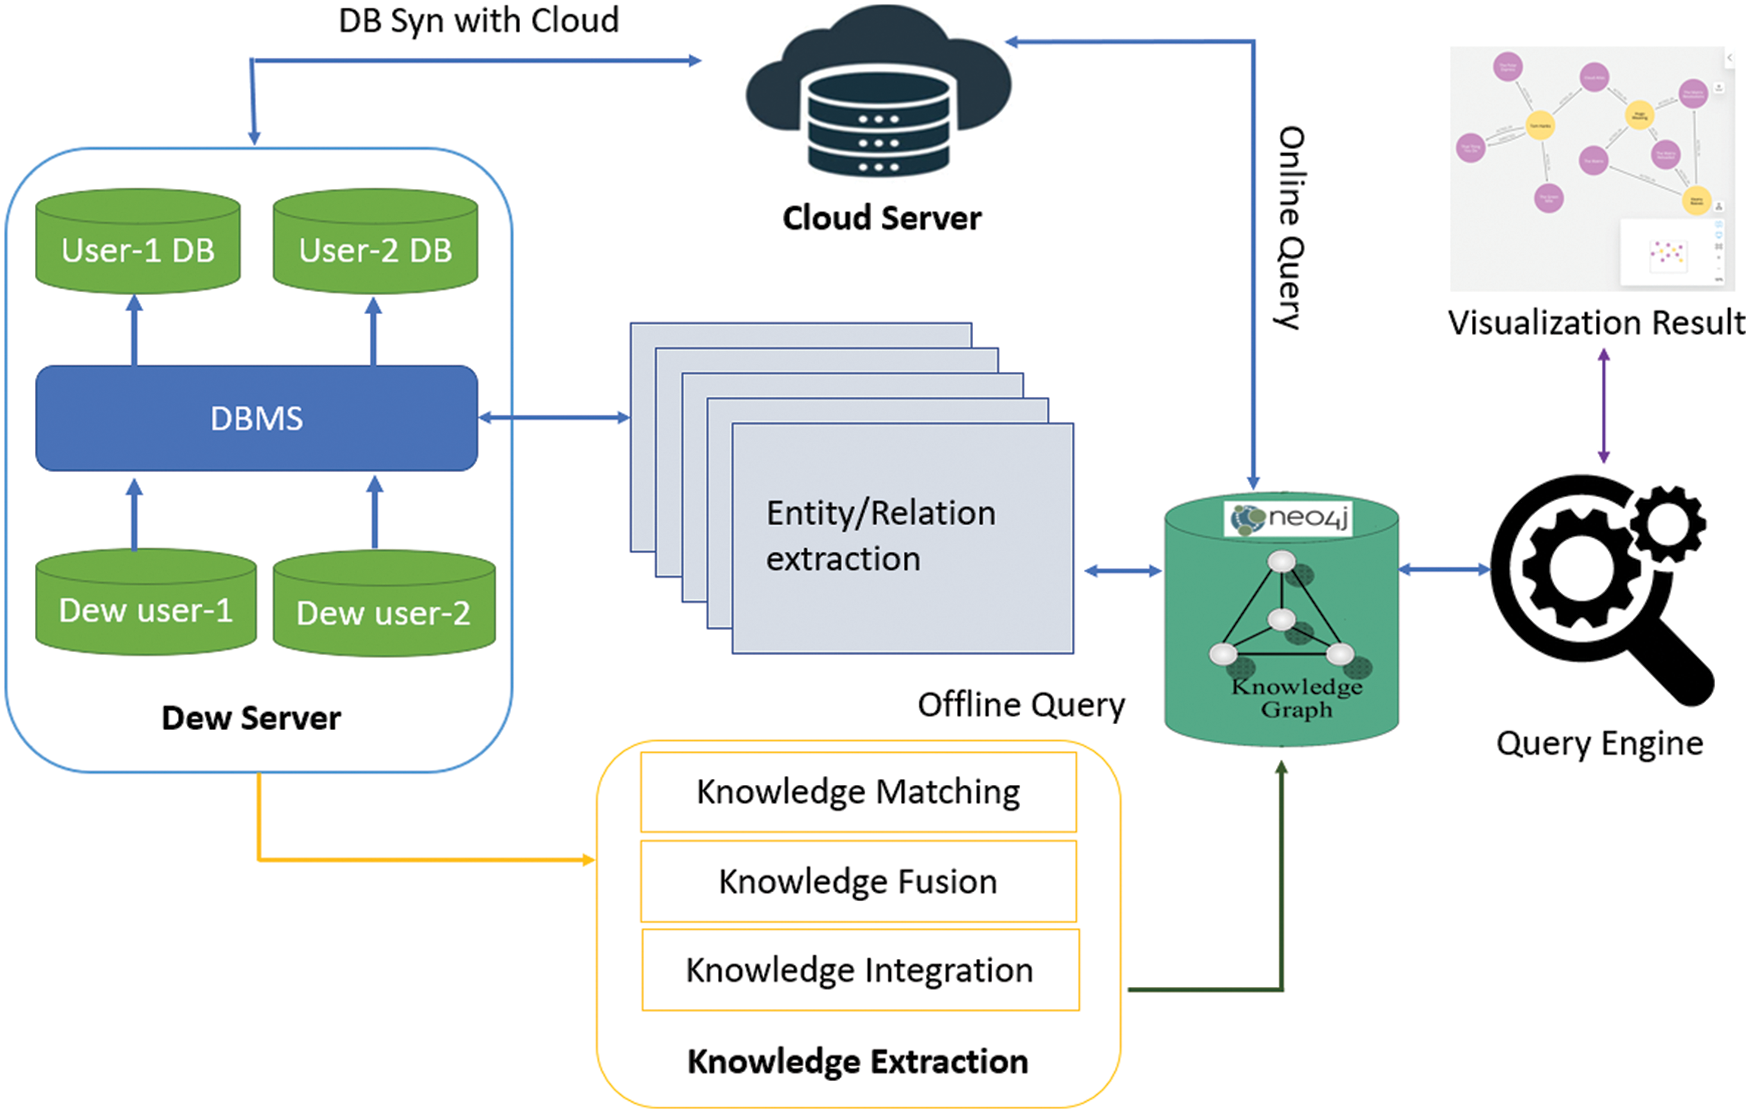
Figure 3: Proposed system model
Semantic Analysis is performed to gather all kinds of Knowledge, including information, principles, values and academic Knowledge, industrial research and self-reflection. Another critical point is to use knowledge matching to convey this Knowledge to business problem solvers. In the semantic analysis process, the required data needs to be collected from data sources. In this phase, associated data from other tables will be collected for certain records using foreign keys. Obsessed with investigating current reality problems, the primary purpose of information coordination is to obtain information relevant to Query solvers.
The process of synthesizing multiple knowledge models into one is knowledge integration. When all nodes and relationships among a single knowledge model are created. When the whole cycle is completed, main Knowledge is achieved with minimum duplication of existing nodes. The information Graph at different can be associated with the structure of a total progressive information diagram. Various layers speak to various information, and there is an informal connection between various information deposits. It establishes the theoretical framework for the progressive association of the information diagram. The proposed system model consists of a Dew server connected with Cloud server, in case of if the cloud server is down then the dew server can deal the offline queries. The dew server is connected with knowledge extraction to create the different types of knowledge match, fusion, and Knowledge integration. The query engine is used to visualize the query results after the results are processed on the knowledge graph.
The query processor produces different plans for executing a query and forms the query graph. In the query graph, plans are connected through edges. This technique improves the quality of the result, runs the query in less time, and enhances performance.
We have used the ERP dataset of educational institutes and the dataset consists of four Tables with respective no. of records and file size as shown in Tab. 2. Data from the conventional database have been converted into graph databases using Neo4j as shown in Fig. 4 with student enrollment.
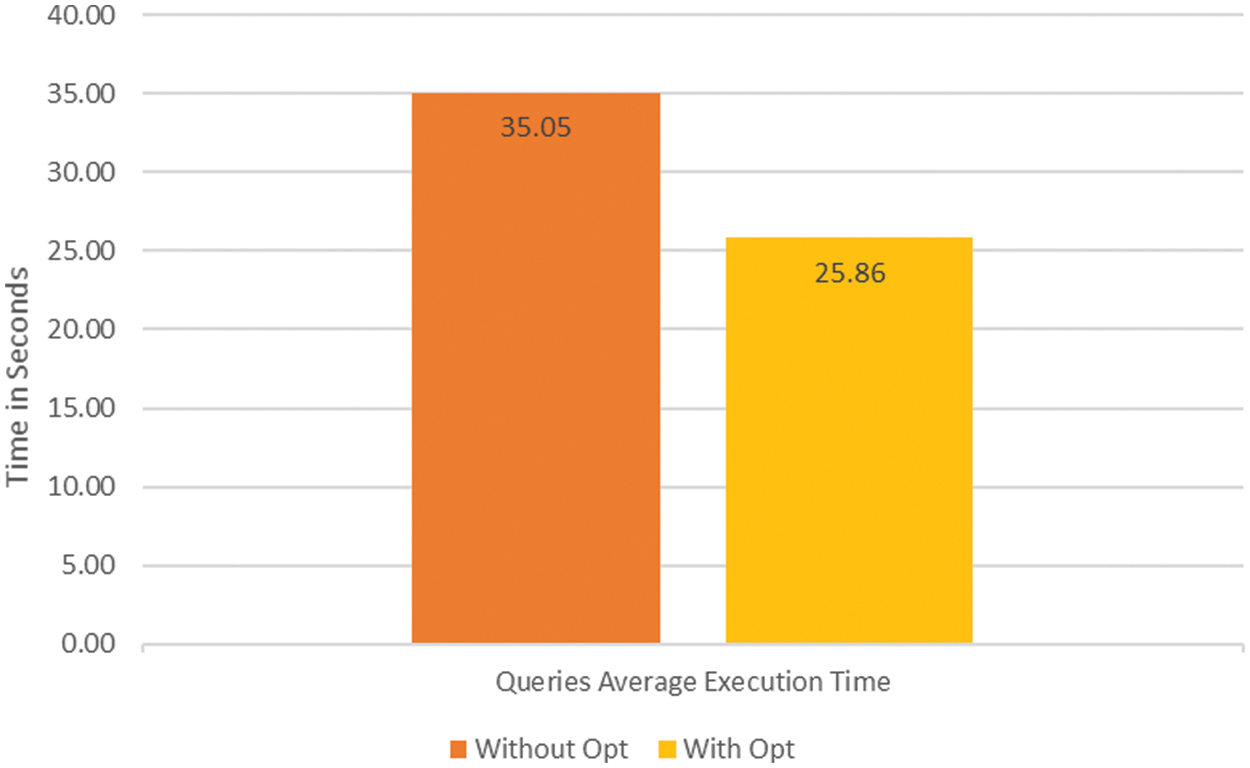
Figure 4: Average execution time
The effectiveness of both data is evident in our desired results. The schema ERP services case study comprises of the accompanying things: student table, courses table, attendance table, student table, and student registration table. The information in the referenced tables and the information base is refreshed yearly. The benchmarkbenchmark utilizes the accompanying structures utilizes the accompanying structures:
• Measurement Features
• Disk Space Requirements
• Predefined questions Set.
Because of an expanding inclination of interfacing gadgets through the correspondence organization and the expanding number of produced information that should be put away and prepared for sometime later and information investigations, the subject of picking an appropriate information base is raised. Information is as yet put away in social data sets since are as of now in an organized frame and can be effectively put away, controlled and investigated in data sets—comparison of two different query text as shown in Tab. 1.


SQL configuration with virtual information creation measure with Neo4j in Local System. The Neo4j graph database works in a way that is better than the Oracle traditional database identified with the initial five queries presented in Tab. 3.

The graphical database Neo4j has done well with a large and connected data environment. System tables on the best way to deal with an information base increment the preparing time for each query produced SQL data set. Neo4j graph database performance improves as data size and the number of joints increase. The intensity of the Neo4j graph database keeps up the records and their connections between them, While the SQL-related data set covers the number of joints at the hour of the query.
Additional joining prompts greater unpredictability, and more excellent complexity nature prompts more execution time for queries on the SQL-related database. About 50% of the increase in performance is reflected in the information related to the Tablespaces process than in the non-archiving process. Therefore, our experimental tests have shown that apart from the SQL data processing table, Neo4j performance is better in all cases.
In Tab. 3 expresses that Neo4j has performed well in all the desired conditions. By applying, the physical data processing process can extend the duration of each query up to 7 cycles. Tab. 4 shows the consequence of ten comparative queries in both databases. The database arrangement measure (Table spaces) is utilized for the SQL-related database.

Table spaces are one of the most mechanical approaches to putting together data. Besides the visual data editing framework, the Neo4j, NoSQL graphical data set performs superior to the SQL related database. Tab. 5 shows the average results of SQL and Neo4j of different settings and performance times. In Tab. 4 clarifies that SQL query time has been improved from SQL query time for Tab. 3 because of SQL table stockpiling territories.

Fig. 5 shows the minimum improvement threshold value that is 10. However, in our case, the improvement percentage is 32. So, our results are batter in performance shows the average data rate reduced from 4.34 to 2.78 due to data processing technology (SQL tablespaces). Approximately, table locations have in-creased approximately 50% performance of related data. Also, the Neo4j table sets have performed well in all of our proposed SQL related databases.
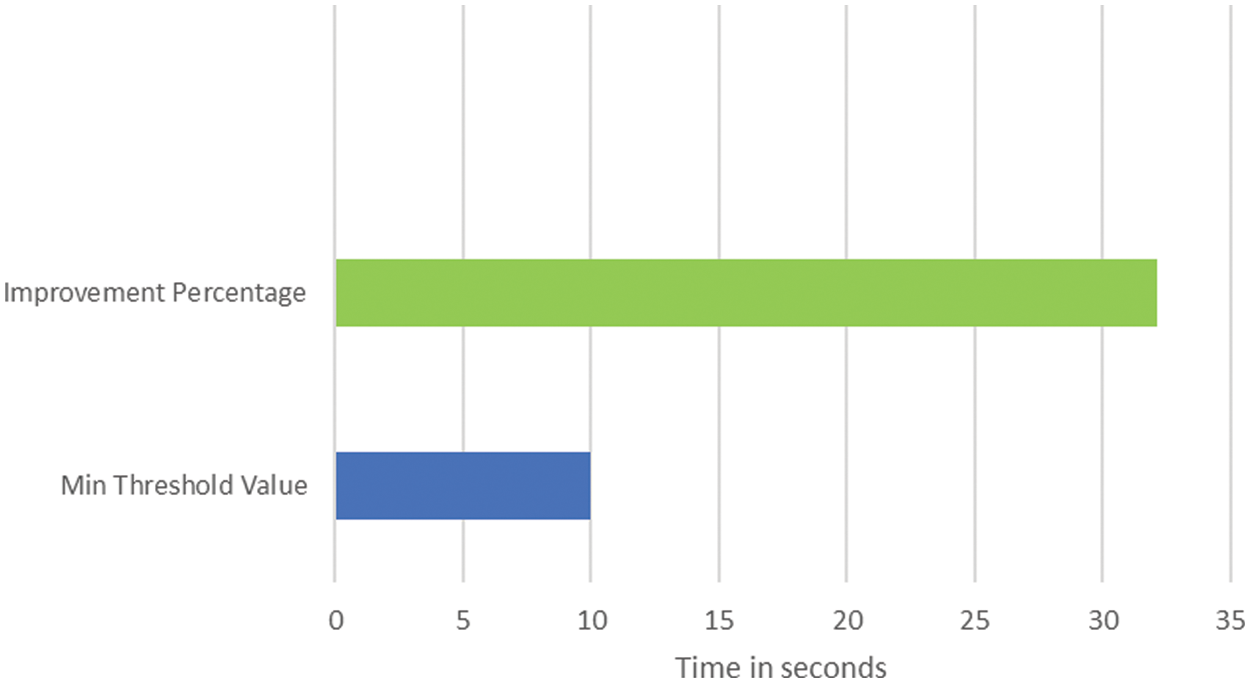
Figure 5: Threshold value
In Fig. 6 SQL Server database with Neo4j and no physical database optimization approach. The X-axis shows the number of performed queries, while the Y-axis shows the amount of time each executed query takes in seconds. In Fig. 7 SQL database with Neo4j and Physical database optimization approach. The X-axis shows the number of performed queries, while the Y-axis shows the amount of time each executed query took in seconds.
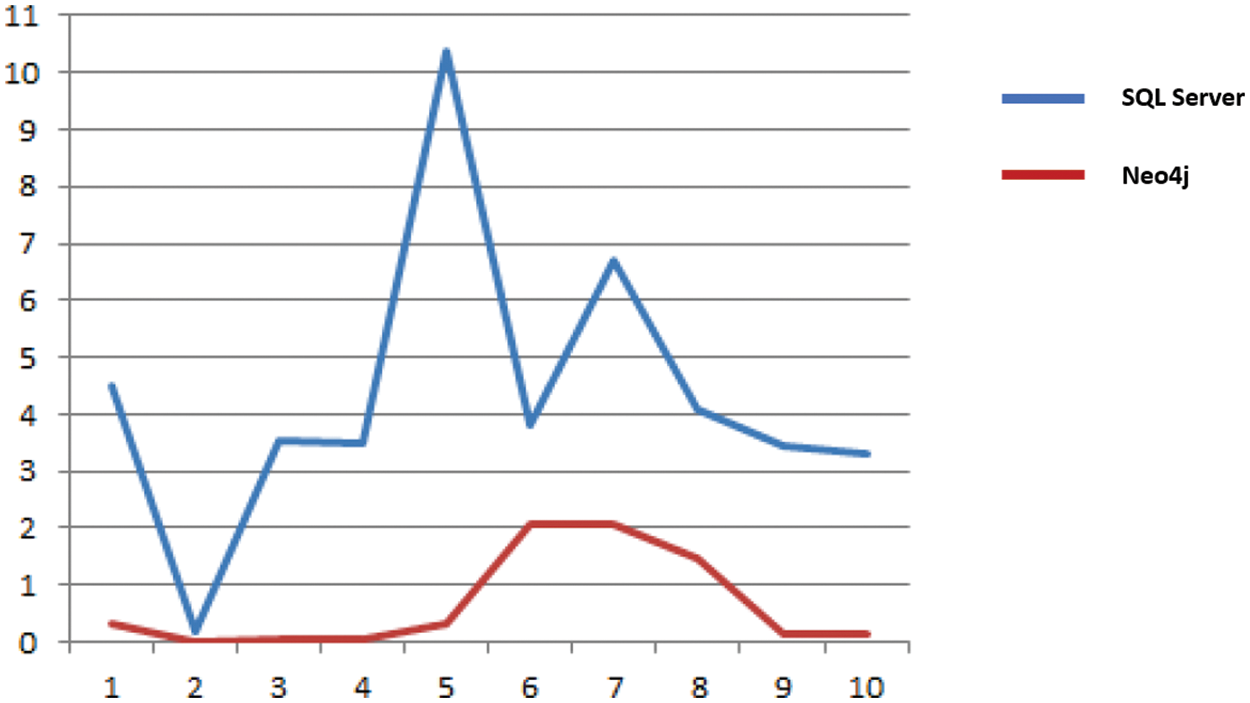
Figure 6: SQL Server database without physical database tuning technique
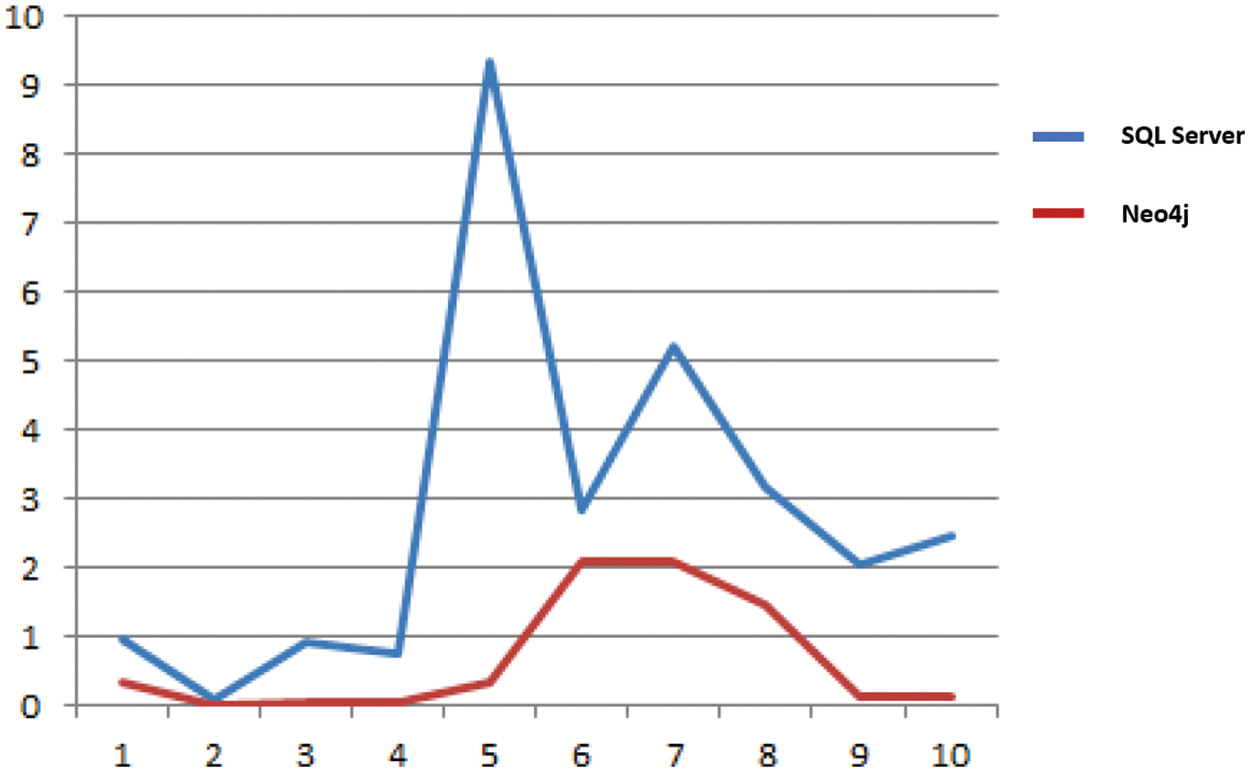
Figure 7: Number of Queries vs. time executed
Figs. 8 and 9 shows the the realistic portrayals of execution time. The X-axis speaks to the queries made while the Y-axis speaks to the time in seconds of the quires executed.
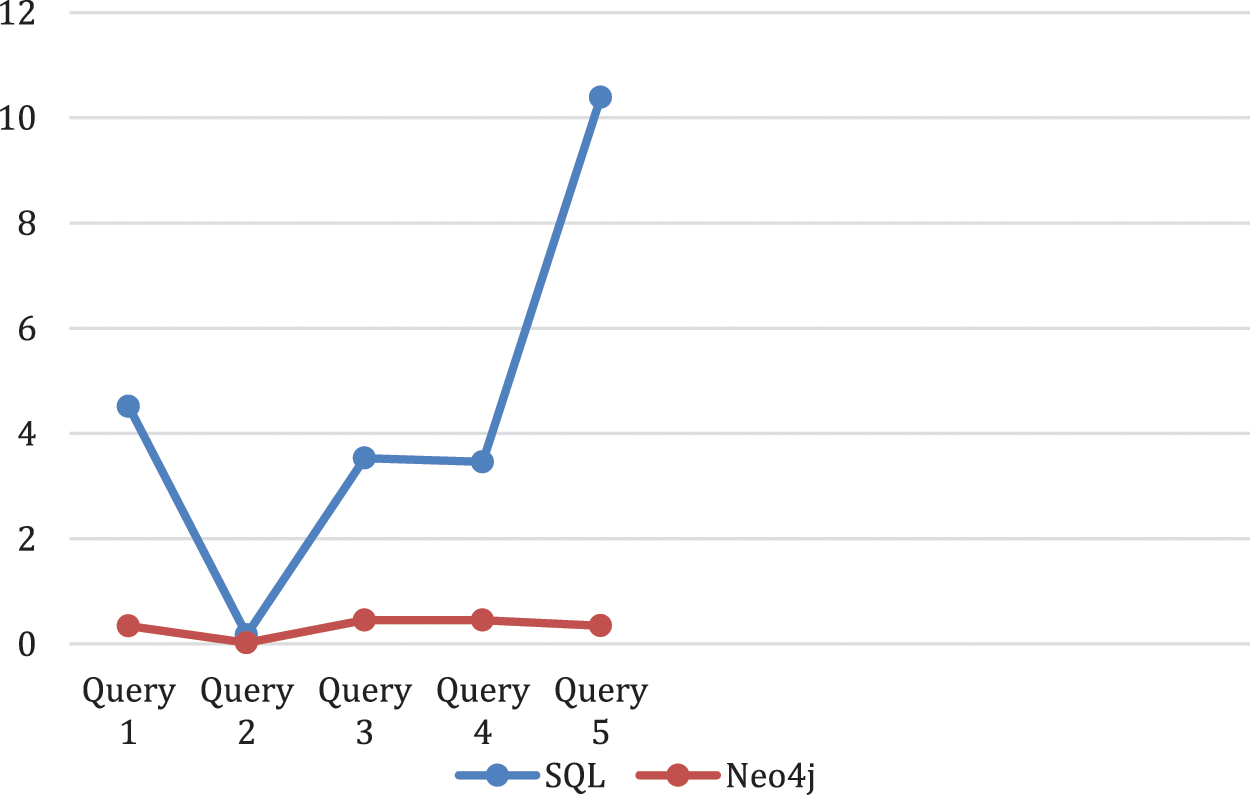
Figure 8: SQL data base and Neo4j without physical data base setting
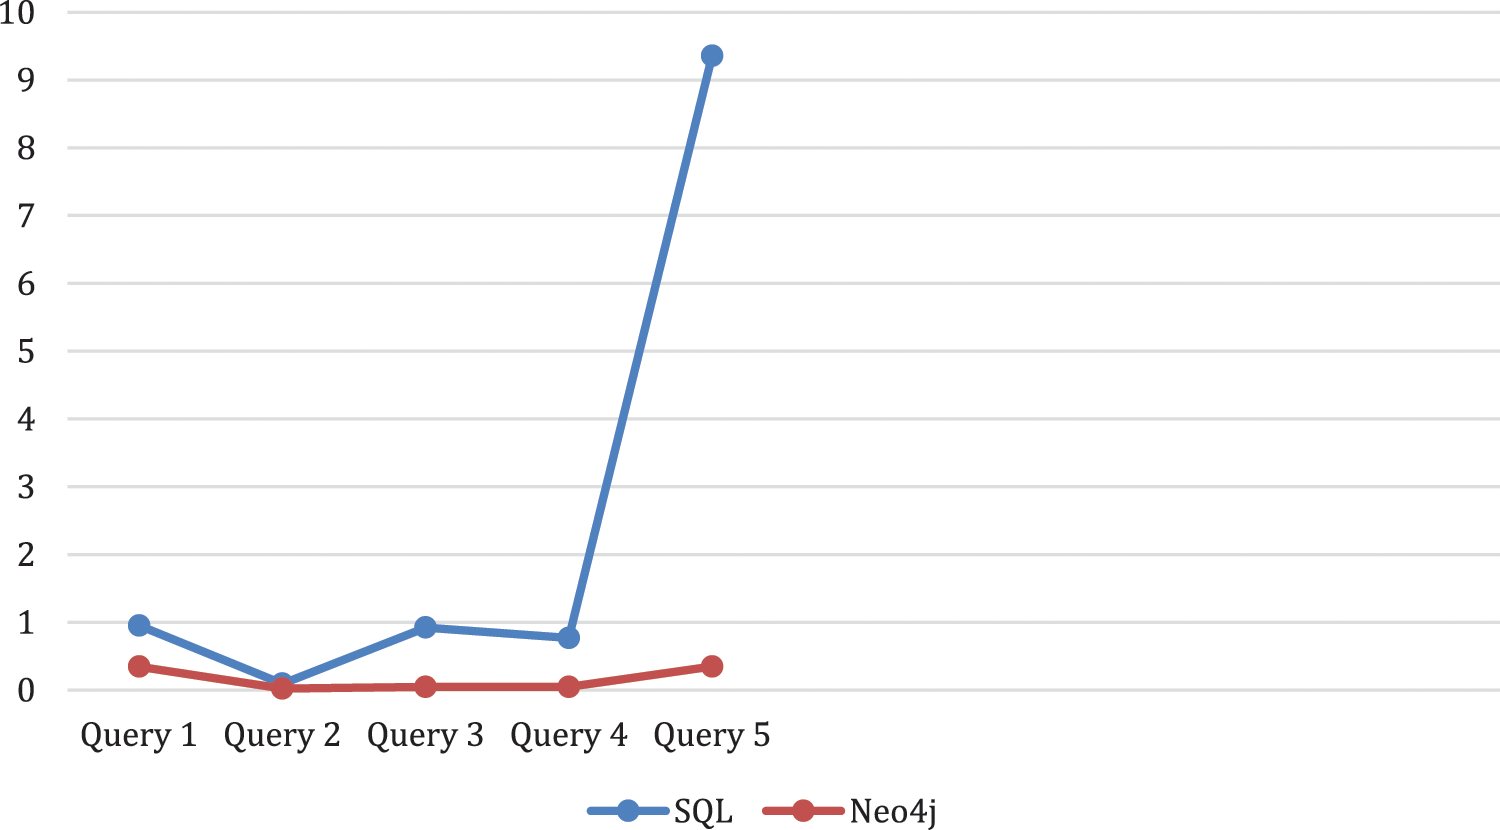
Figure 9: SQL data base and Neo4j with physical data base setting
Neo4j graph database features have been presented, and several approaches for building graph databases based on neo4j importing data have been contrasted. The “neo4j” technique has been compared with relational databases. By utilizing graph schema design, distributed storage, and parallel computing, the graph database can significantly improve the “massive” data storage and processing efficiency. There are situations when a better choice for data storage exists, even though relational databases are robust and effective. The graph databases are a good option for applications that need many connections between data. Such initiatives may be social media apps, team-based platforms, or libraries of any type, including collections of different fields. When deciding on the best database to employ, one must first do some research, read, and—most importantly—conduct tests on their apps with a large amount of records to foresee how they will operate in the future. When an application is complicated, deployed, and being used by people, making modifications along multiple development cycles and stages necessitates data migration from one database to another, which is a challenging, time-consuming, and high-risk process.
Acknowledgement: Thanks to our teachers and families who provided moral support.
Funding Statement: The authors received no specific funding for this study.
Conflicts of Interest: The authors declare that they have no conflicts of interest to report regarding the present study.
References
1. N. Iqbal, S. Abbas, M. A. Khan, T. Alyas, A. Fatima et al., “An RGB image cipher using chaotic systems, 15-puzzle problem and DNA computing,” IEEE Access, vol. 7, pp. 174051–174071, 2019. [Google Scholar]
2. T. Alyas, I. Javed, A. Namoun, A. Tufail, S. Alshmrany et al., “Live migration of virtual machines using a mamdani fuzzy inference system,” Computers, Materials & Continua, vol. 71, no. 2, pp. 3019–3033, 2022. [Google Scholar]
3. M. I. Sarwar, M. W. Iqbal, T. Alyas, A. Namoun, A. Alrehali et al., “Data vaults for blockchain-empowered accounting information systems,” IEEE Access, vol. 9, pp. 117306–117324, 2021. [Google Scholar]
4. L. M. Vaquero and L. Merino, “Finding your way in the fog: Towards a comprehensive definition of fog computing,” Computer Communication Review, vol. 44, no. 5, pp. 27–32, 2014. [Google Scholar]
5. M. Tao, K. Ota and M. Dong, “Ontology-based data semantic management and application in IoT- and cloud-enabled smart homes,” Future Generation Computer System, vol. 76, no. 6, pp. 528–539, 2017. [Google Scholar]
6. P. Bellini, D. Cenni and P. Nesi, “Smart cloud engine and solution based on knowledge base,” Procedia Computer Science, vol. 68, no. 3, pp. 3–16, 2015. [Google Scholar]
7. P. Bellini, I. Bruno, D. Cenni and P. Nesi, “Managing cloud via smart cloud engine and knowledge base,” Future Generation Computer System, vol. 78, no. 1, pp. 142–154, 2018. [Google Scholar]
8. L. Heilig, E. Ruiz and S. Vob, “Modeling and solving cloud service purchasing in multi-cloud environments,” Expert System Application, vol. 147, no. 20, pp. 540–555, 2020. [Google Scholar]
9. B. Vu, Y. Wv and H. Afli, “A metagenomic content and knowledge management ecosystem platform,” in IEEE Int. Conf. on Bioinformatics and Biomedicine (BIBM), USA, vol. 7, pp. 1–8, 2020. [Google Scholar]
10. H. Zeng, B. Wang, W. Deng and W. Zhang, “Measurement and evaluation for docker container networking,” in Int. Conf. on Cyber-Enabled Distributed Computing and Knowledge Discovery, China, vol. 18, pp. 105–108, 2017. [Google Scholar]
11. V. Sassone, F. Paolo and L. Nicoletti, “The cloud federation-as-a-service solution for the public sector,” Springer, vol. 3, no. 64, pp. 61–80, 2020. [Google Scholar]
12. J. Lindman, T. Kinnari and M. Rossi, “Business roles in the emerging open-data ecosystem,” IEEE Software, vol. 33, no. 5, pp. 54–59, 2016. [Google Scholar]
13. N. Tabassum, A. Ditta, T. Alyas, S. Abbas, H. Alquhayz et al., “Prediction of cloud ranking in a hyperconverged cloud ecosystem using machine learning,” Computers, Materials & Continua, vol. 67, no. 3, pp. 3129–3141, 2021. [Google Scholar]
14. M. Benedictis and A. Lioy, “Integrity verification of Docker containers for a lightweight cloud environment,” Future Generation Computer System, vol. 97, pp. 236–246, 2019. [Google Scholar]
15. Y. Cui, S. Kara and K. C. Chan, “Manufacturing big data ecosystem: A systematic literature review,” Robotics and Computer-Integrated Manufacturing, vol. 62, no. 19, pp. 101861–101870, 2020. [Google Scholar]
16. S. Sharma, “Expanded cloud plumes hiding big data ecosystem,” Future Generation Computer System, vol. 59, no. 2, pp. 63–92, 2016. [Google Scholar]
17. N. Tabassum, T. Alyas, M. Hamid, M. Saleem, S. Malik et al., “Semantic analysis of urdu english tweets empowered by machine learning,” Intelligent Automation & Soft Computing, vol. 30, no. 1, pp. 175–186, 2021. [Google Scholar]
18. T. Alyas, N. Tabassum, M. Waseem Iqbal, A. S. Alshahrani, A. Alghamdi et al., “Resource based automatic calibration system (rbacs) using kubernetes framework,” Intelligent Automation & Soft Computing, vol. 35, no. 1, pp. 1165–1179, 2023. [Google Scholar]
19. W. Pan and C. Chai, “Structure-aware mashup service clustering for cloud-based internet of things using genetic algorithm based clustering algorithm,” Future Generation Computer System, vol. 87, pp. 267–277, 2018. [Google Scholar]
20. S. Yin, D. Chen and J. Le, “Deep neural network based on translation model for diabetes knowledge graph,” in Fifth Int. Conf. on Advanced Cloud and Big Data (CBD), Shanghai, China, pp. 318–323, 2017. [Google Scholar]
21. N. Tabassum, T. Alyas, M. Hamid, M. Saleem, S. Malik et al., “Qos based cloud security evaluation using neuro fuzzy model,” Computers, Materials & Continua, vol. 70, no. 1, pp. 1127–1140, 2022. [Google Scholar]
22. N. Tabassum, T. Alyas, M. Hamid, M. Saleem and S. Malik, “Hyper-convergence storage framework for ecocloud correlates,” Computers, Materials & Continua, vol. 70, no. 1, pp. 1573–1584, 2022. [Google Scholar]
23. J. Nazir, M. Waseem Iqbal, T. Alyas, M. Hamid, M. Saleem et al., “Load balancing framework for cross-region tasks in cloud computing,” Computers, Materials & Continua, vol. 70, no. 1, pp. 1479–1490, 2022. [Google Scholar]
24. S. Malik, N. Tabassum, M. Saleem, T. Alyas, M. Hamid et al., “Cloud-iot integration: Cloud service framework for m2m communication,” Intelligent Automation & Soft Computing, vol. 31, no. 1, pp. 471–480, 2022. [Google Scholar]
Cite This Article
 Copyright © 2023 The Author(s). Published by Tech Science Press.
This work is licensed under a Creative Commons Attribution 4.0 International License , which permits unrestricted use, distribution, and reproduction in any medium, provided the original work is properly cited.


 Submit a Paper
 Propose a Special lssue
 View Full Text
 Download PDF
 Downloads
 Citation Tools