
 Submit a Paper
 Propose a Special lssue
 Open Access
ARTICLE

Novel Computer-Aided Diagnosis System for the Early Detection of Alzheimer’s Disease
Department of Computer Science, College of Computer Engineering and Sciences, Prince Sattam Bin Abdulaziz University, Al Kharj, Saudi Arabia
* Corresponding Author: Shabana R. Ziyad. Email:
Computers, Materials & Continua 2023, 74(3), 5483-5505. https://doi.org/10.32604/cmc.2023.032341
Received 14 May 2022; Accepted 15 September 2022; Issue published 28 December 2022
 View Full Text
 Download PDF
Abstract
Aging is a natural process that leads to debility, disease, and dependency. Alzheimer’s disease (AD) causes degeneration of the brain cells leading to cognitive decline and memory loss, as well as dependence on others to fulfill basic daily needs. AD is the major cause of dementia. Computer-aided diagnosis (CADx) tools aid medical practitioners in accurately identifying diseases such as AD in patients. This study aimed to develop a CADx tool for the early detection of AD using the Intelligent Water Drop (IWD) algorithm and the Random Forest (RF) classifier. The IWD algorithm an efficient feature selection method, was used to identify the most deterministic features of AD in the dataset. RF is an ensemble method that leverages multiple weak learners to classify a patient’s disease as either demented (DN) or cognitively normal (CN). The proposed tool also classifies patients as mild cognitive impairment (MCI) or CN. The dataset on which the performance of the proposed CADx was evaluated was sourced from the Alzheimer’s Disease Neuroimaging Initiative (ADNI). The RF ensemble method achieves 100% accuracy in identifying DN patients from CN patients. The classification accuracy for classifying patients as MCI or CN is 92%. This study emphasizes the significance of pre-processing prior to classification to improve the classification results of the proposed CADx tool.Keywords
Dementia is a progressive neurological disorder resulting in the deterioration of memory capability, cognitive skills, reasoning, understanding, judgment, emotions, personality, and behavior; in elderly patients, it affects their ability to perform daily activities [1]. Dementia is commonly diagnosed in the elderly, although it is not a common feature of the aging process. Dementia proceeds in three stages: early-stage, middle-stage, and late-stage. In early-stage dementia, patients show symptoms such as forgetfulness, losing track of time, and forgetting their way even in familiar places. Middle-stage dementia includes more severe symptoms such as repeating questions, forgetting recent events and the names of familiar individuals, wandering aimlessly, difficulty communicating, and behavioral changes. Late-stage dementia is characterized by an inability to recognize friends and relatives, difficulty in walking, and being unaware of place and time [2]. Overall, dementia is currently the seventh leading cause of death globally [3]. Dementia leads to AD or stroke. AD is a form of dementia and may account for 60%–70% of dementia cases. AD is a progressive disorder that causes the death of brain cells over time. Those over 80 years old are at substantial risk of being affected by AD. One in six individuals over the age of 80 years old is at an elevated risk of being affected by AD; one in fourteen aged between 65–80 years old is affected by AD [4]. AD detected in patients at an early age improves their prognosis. Medications can slow down the progression of AD symptoms. The early detection of AD helps the patient’s family to plan for the patient’s future. To improve clinicians’ ability to detect the onset of AD at an early stage, the present study aimed to develop and evaluate a CADx tool to enable the early and precise detection of AD. Previous related studies have shed light on techniques to classify patients with AD from CN patients and patients with MCI from CN patients using patient data extracted from neuroimaging techniques such as Magnetic Resonance Imaging (MRI), Functional Magnetic Resonance Imaging (fMRI), Fluorodeoxyglucose (FDG), Positron Emission Tomography (PET), and Diffusion Tensor Imaging [5]. FDG-PET provides a qualitative measurement of the brain’s metabolic activity and is an effective imaging modality for AD detection [6]. One study showed that the identification of asymmetrical brain features can provide a useful basis for the classification of disease conditions such as AD, early MCI (EMCI), and CN. The Quantum-enhanced Support Vector Machine (Q-SVM) and cost-sensitive SVM (C-SVM) provide better classification accuracy than the convolution neural network (CNN) method. The accuracy of SVM for CN and EMCI is 92.5% and 75.0%, respectively, whereas CNN achieves an accuracy of 93.0% and 90.5% for CN and AD, respectively [7]. Another study emphasized the importance of non-amyloid proteins as a deterministic feature for use in the early detection of AD. For the classification of AD, the SVM classifier achieved a sensitivity of 85%, a specificity of 70%, and an area under the curve (AUC) of 0.88 [8]. Principal component analysis (PCA) reduced the feature dimension of the fMRI resting-state images. The support vector regression (SVR) method classifies AD and MCI datasets with an accuracy of 98.53% [9]. The XG-Boost classifier on the ADNI dataset achieved an accuracy of 85.92% [10]. When using CAD-based approaches to detect AD, the genetic package GALGO for feature selection and classifiers such as RF, logistic regression (LR), SVM, and artificial neural networks (ANN) achieved better results compared to state-of-the-art methods with an AUC of 0.842 [11]. A RF-based feature selection model featuring a Gaussian-inspired algorithm achieved a higher classification accuracy of 78.8% over the SVM classifier and a classification accuracy of 75.6% for determining between patients with CN vs. EMCI [12]. Ensemble learning approaches featuring soft-voting classification are a reliable method in healthcare-related prediction tasks, especially for enhancing classification results [13]. The hybrid feature selection framework (using the significance analysis of microarray (SAM) filter) identifies the most deterministic biomarkers for AD detection and achieved an accuracy of 87% [14]. All the research studies discussed in this section are diagnosis systems developed to aid the effective early detection of AD by using machine learning or feature selection methods. In the above-discussed literature, the AD dataset mainly consists of medical images. There is an urgent need to develop a CADx tool that accurately classifies a patient’s condition as either DN or non-demented (NDN). To address this need, the present study provides a novel methodology that leverages the IWD algorithm for feature reduction and the RF classifier ensemble method. To the best of our knowledge, this study is the first of its kind to use clinical test data and medical features to classify the most deterministic features leading to a diagnosis of AD. The proposed CADx tool classifies patient data samples accurately into AD, MCI, and CN using a four-stage process: (i) acquiring patient data, (ii) feature reduction, (iii) classification, and (iv) performance evaluation. The patient data was acquired from the ADNI dataset [15]. Feature selection was performed by using the IWD algorithm to perform preprocessing before classification, which plays a major role in improving the performance of the proposed model. Compared to the state-of-the-art methods, our proposed RF classifier achieves better classification accuracy and a higher F1 score.
Artificial Intelligence (AI) models feature built-in knowledge and perform inductive reasoning to predict data missing from a given dataset. Machine learning (ML) (a form of AI that makes predictions from data patterns) uses computational algorithms that enable models to perform clustering, classification, and prediction depending on the problem domain. Furthermore, ML algorithms can provide accurate pattern discovery in datasets and make interesting predictions about likely outcomes. These predictions aid decision-making and predicting values for any model [16]. ML algorithms are classified as unsupervised, supervised, and semi-supervised. Unsupervised ML algorithms cluster data in an unlabeled dataset, whereas supervised ML algorithms classify or predict target features in a labeled dataset. CADx tools leverage the decision-making capability of supervised algorithms to predict likely disease outcomes, which is helpful for aiding radiologists to diagnose a patient’s condition [17]. Datasets for supervised learning algorithms comprise a set of input features and a labeled output for every data sample.
2.1 Biomarkers of Alzheimer’s Disease
AD is caused by the formation of highly toxic soluble amyloid β (Aβ) in high concentrations. Soluble Aβ is difficult to assess due to the unavailability of clinical assessment tests [18]. The rate of solubility of Aβ and the quantity of Aβ in different pools are major factors that affect the disease state of AD. The two essential biomarkers for the diagnosis of AD are deposits of β-amyloid peptide (Aβ) and the flame-shaped neurofibrillary tangles of the microtubule-binding protein tau. There is a correlation between Aβ and the Apolipoprotein E (ApoE): the latter interacts with the former resulting in neuronal cell death [19]. ApoE is a lipid transporter in the cerebrospinal fluid that contributes to neuronal repair; it is also a gene that causes the onset of sporadic and familial AD. The ApoE 4 gene increases the probability of the onset of AD [20]. Inflammation, neurodegeneration, glial activation, and neurodegenerative proteins increase in beta-positive individuals, resulting in cognitive decline [21–23]. Researchers suggest that further comparative research on biomarkers is essential to establish that plasma Aβ is a potential biomarker for the detection of AD [24]. The presence of tau tangles in the brain is detected by using the radioactive probe, Flortaucipir, which adheres to the fibrillar tau in multiple areas and can be detected via PET imaging [25]. The Clinical Dementia Rating (CDR) is a global assessment technique that generates Sum of Boxes (SOB) scores. The CDR-SOB score is a quantitative index that can be compared to global CDR-SOB scores. It was hypothesized that CDR-SOB scores offer high prediction accuracy in identifying patients with MCI or AD. The Alzheimer’s Disease Assessment Scale (ADAS) provides an assessment of cognitive dysfunction in AD patients by estimating the severity of cognitive dysfunction. The modified ADAS rating scale for the ADAS-Cog test provides a more prominent biomarker of AD. ADAS assesses executive function, daily functioning, and delayed recall to detect the early cognitive changes characteristic in patients deteriorating from MCI to dementia [26]. Rey’s Auditory Verbal Learning Test (RAVLT) is a neuropsychological assessment tool to determine patients’ episodic memory. Episodic memory plays a vital role in the cognitive assessment of dementia symptoms. RAVLT is one of the most effective biomarkers for the detection of AD in patients with memory issues [27]. The Functional Activities Questionnaire (FAQ) is a measure of patient independence in performing functional activities. The extent of the atrophy of the medial temporal lobe of the brain predicts the occurrence of AD. The medial temporal lobe is responsible for normal cognitive function and is adversely affected by AD. The size of the temporal lobe is smaller in patients with dementia compared to that of patients without dementia and stands out as one of the most critical biomarkers of dementia [28]. The Logical Memory Delayed Recall Total (LDELTOTAL) score also provides a measure of AD.
2.2 CADx for the Detection of Alzheimer’s Disease
As previously mentioned, our proposed CADx tool for the detection of AD involves four stages: (i) data acquisition, (ii) feature selection, (iii) classification, and (iv) performance evaluation. In the first phase, researchers acquire patient data from a suitable dataset. By integrating data from cognitive tests, imaging, and clinical results, ADNI [15] makes an important contribution to the acquisition and validation of data drawn from medical images. The second phase, feature selection, entails a preprocessing technique that aims to identify feature interactions and reveal the most deterministic features for the prediction of early-onset AD [29]; it aims to select feature sets that collectively provide a high degree of accuracy in the classification of the data sample into labels. A previous work achieved a significant increase in classification accuracy due to the use of feature selection [30]. Feature selection broadly consists of the filter, wrapper, and embedded methods. In the filter method, features are filtered based on their ranking within a certain threshold. The wrapper method is based on the optimal feature subset search [31]. The embedded method may be used with any feature selection technique; the efficiency of the method is validated via classifiers such as SVM or decision tree. In the final phase of our proposed CADx tool, the classification stage classifies the test sample based on the training dataset. Compared to conventional supervised algorithms where a single model performs the data fitting, ensemble methods integrate multiple weak learners to improve the performance of the model [32]. LR is an extended version of linear regression [33]. Fig. 1 illustrates the proposed architecture of our CADx tool along with the ML algorithms. In the second phase, the proposed CADx IWD algorithm performs feature selection on the ADNI dataset to identify the features correlated with the labelled data. In the third phase, the RF classifier is adopted to allocate patients as either DN or CN. RF is an ensemble-based ML algorithm that integrates the classification results of multiple weak learners based on a majority voting scheme. Random samples and random features from the dataset provide the inputs to multiple decision trees. Random sampling with replacement allows the same samples to be inputted into more than one decision tree. This ensures that the data samples are trained by multiple decision trees and accurately classify the test data sample. The last phase of the proposed model is performance evaluation. The metrics of accuracy, F1 score and ROC are used to evaluate the model.
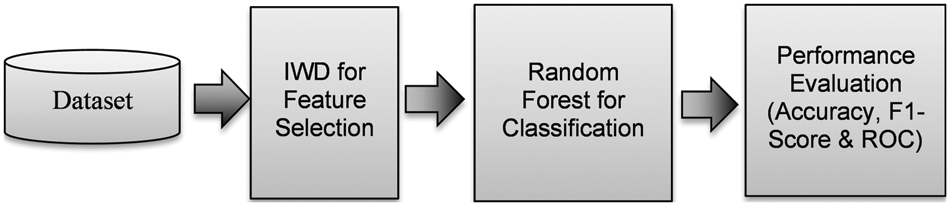
Figure 1: Proposed CADx for AD detection
3 Proposed Methodology for Alzheimer’s Disease Detection
This section describes the methodology used to develop and test the proposed AD detection CADx tool.
The dataset obtained from ADNI (sample size: N = 1900) included 96 features [5] that represent patient data from the MRI medical imaging modality accompanied by clinical diagnosis. A 1.5 Tesla MRI scan device was used for most patients. The labeled feature classifies patient data as CN, diagnosed with dementia, and diagnosed with MCI. The Open Access Series of Imaging Studies (OASIS) dataset is a crisp dataset with highly influential features [34]. Python was used to implement our proposed CADx tool. The data set consisted of 96 features including the target feature. The original dataset was split into two: (i) DN vs. CN patients, and (ii) MCI vs. CN patients.
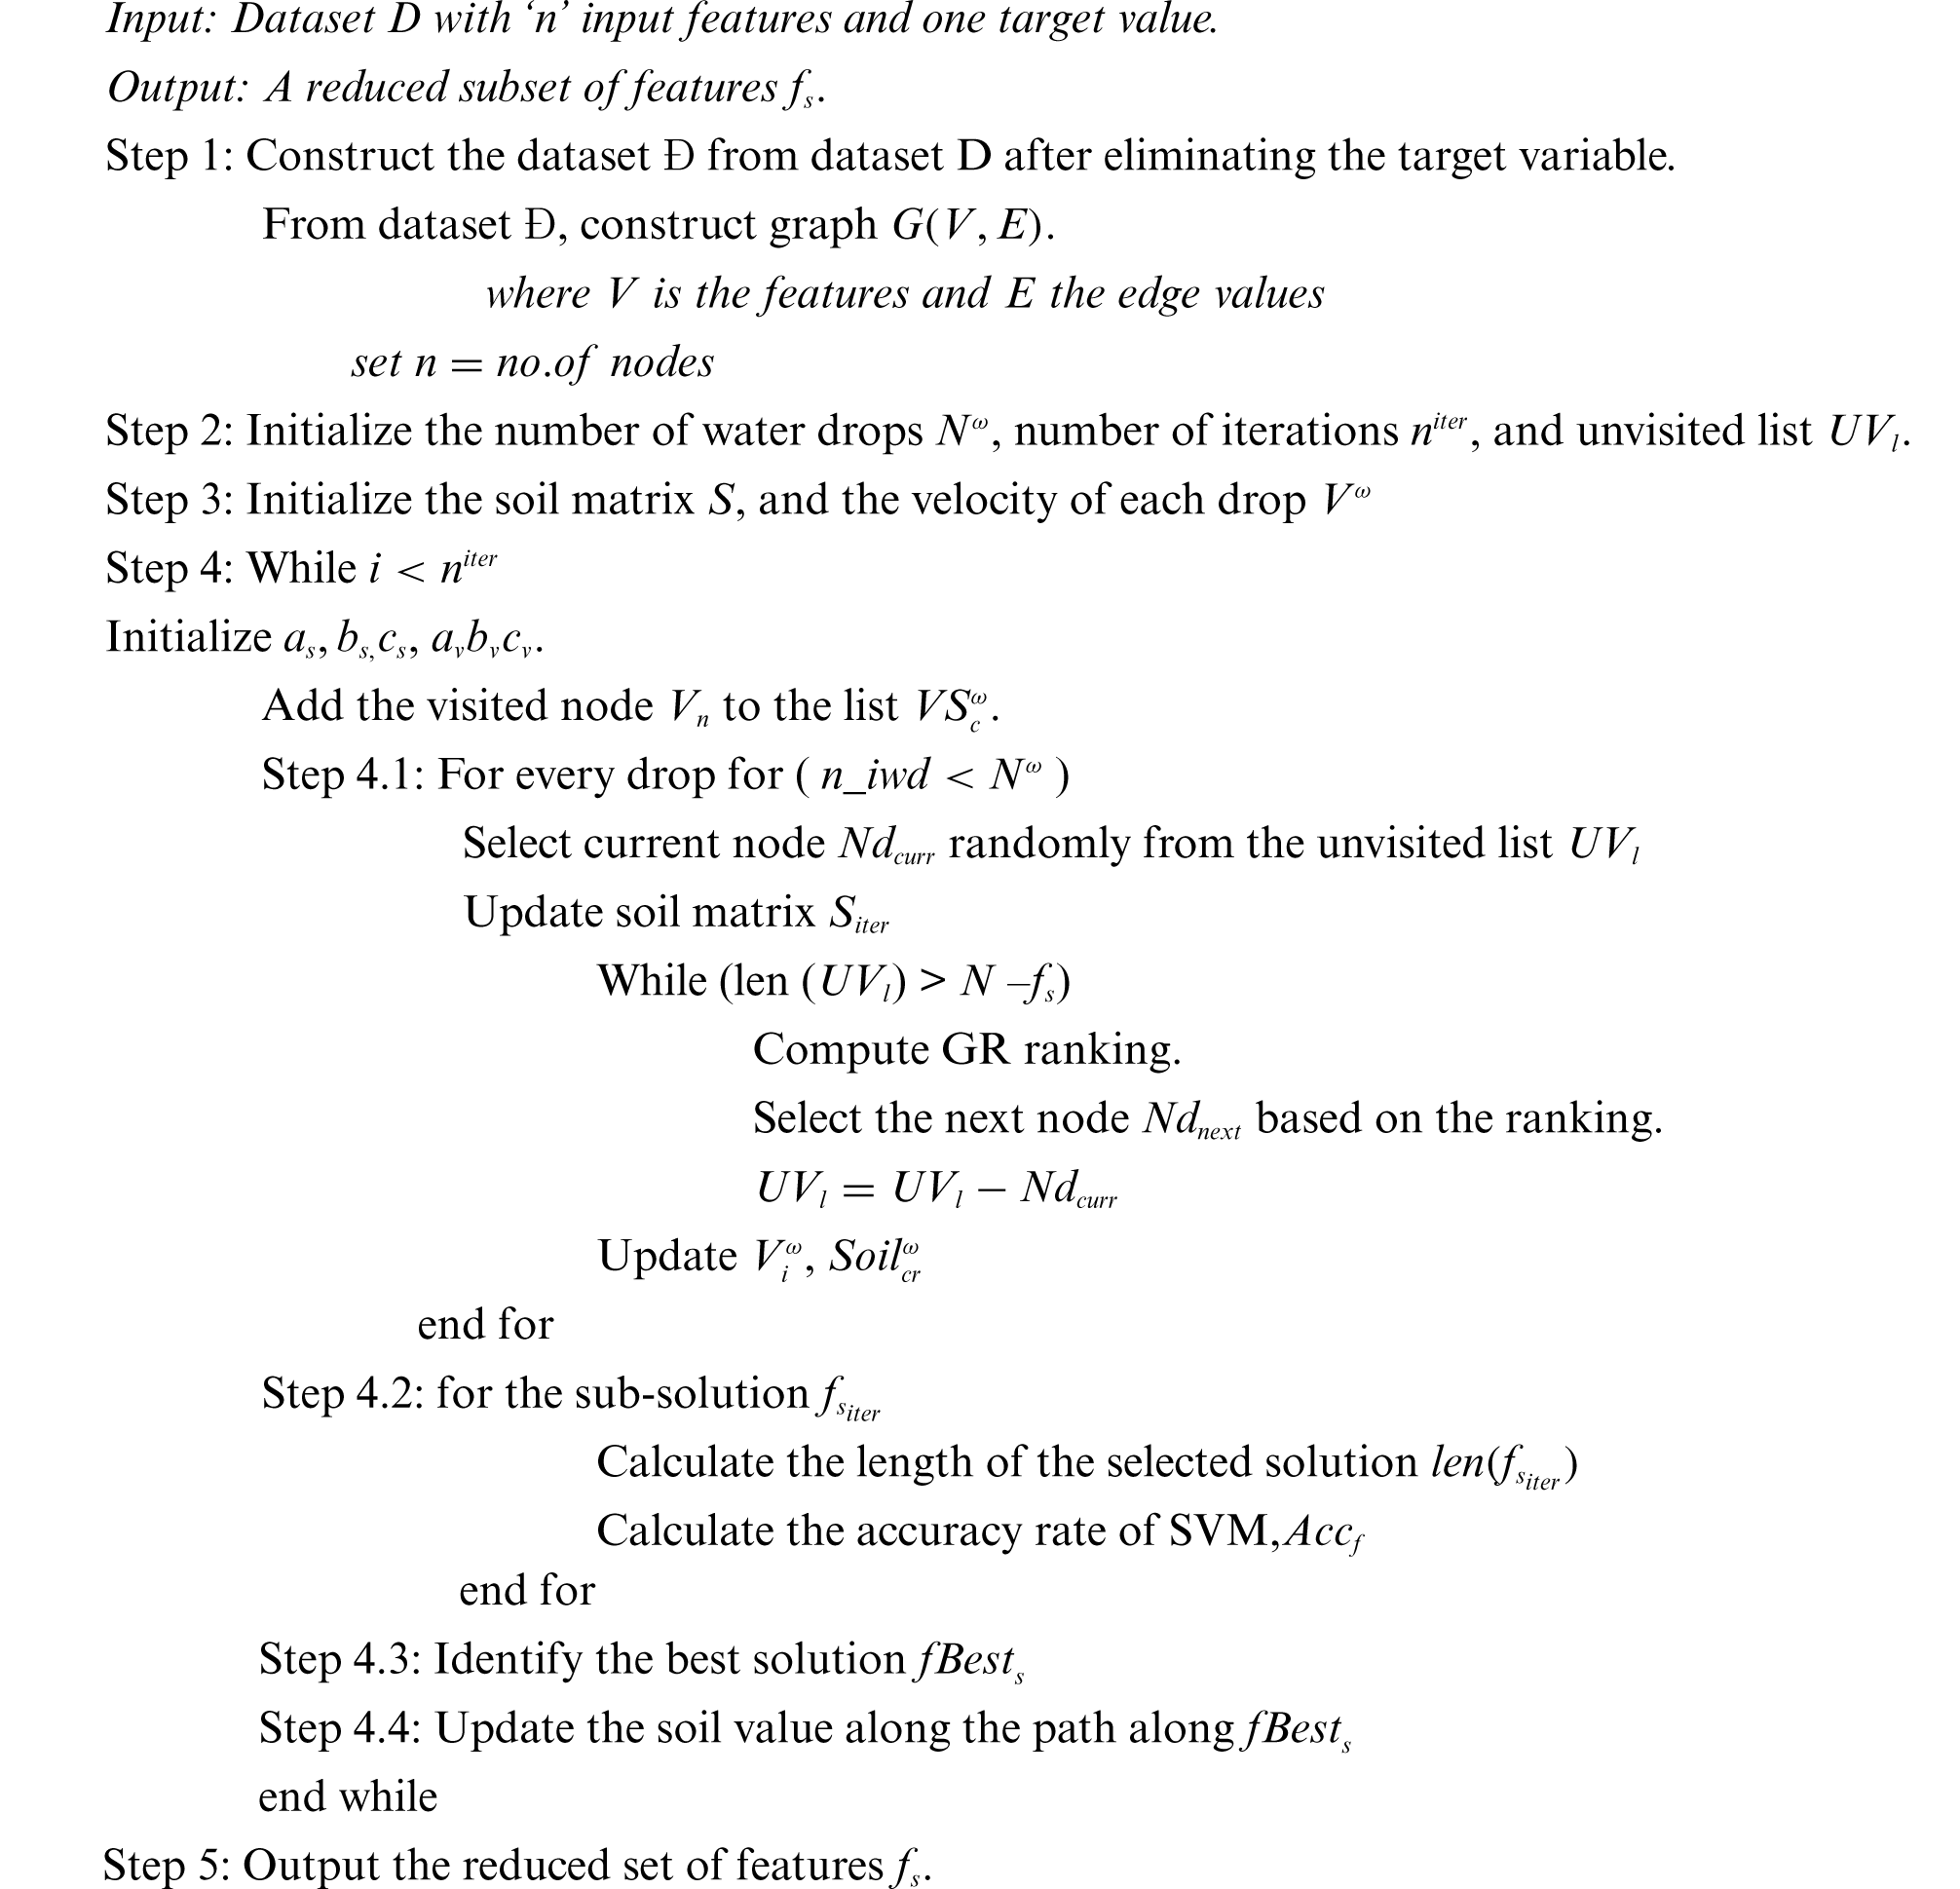
The IWD algorithm (a heuristic optimization algorithm) was developed in 2009 [35] and proposed as an efficient feature selection method for the detection of breast cancer [36]. It is based on water finding its way through the soil and draining into a larger body such as a river, sea, or ocean. Water flows through the soil as a swarm of water droplets that then amalgamate with the main water body. The path of a single water droplet was analyzed and modeled as the basis for IWD. In our proposed model, feature selection is performed by the IWD algorithm. The water droplet starts with an initial velocity and soil content of zero. The prime objective of IWD is to find the minimal cost path in a graph. IWD is suitable for feature selection as it selects the best features and removes the redundant and least significant features. In this study, IWD was selected as a feature selection algorithm based on previous research where IWD was proven to improve the model performance [37]. The main components of water drop
Step 1: Convert the dataset into a graph of features and edge values. Static variables include the number of water drops
Step 2: The water drops
The soil eroded
Step 3: The optimal solution
On finding the best solution, the path through the soil that provides the best solution is updated as
Step 4: Steps 2 & 3 are repeated for the maximum number of iterations.
3.2.1 Proposed Algorithm for Feature Selection
Classification in this proposed CADx framework is performed via the ensemble method, bagging, which is a bootstrap aggregation-based ensemble technique [39]. In bagging, the classifier model classifies the sample dataset with multiple weak learners working in parallel. The training data for these weak learners is generated by random sampling with replacement. The training data sample for each weak learner is not mutually exclusive. Hence, the probability of any data sample being part of the dataset is equal for all weak learners. The data distribution phase for weak learners is known as the bootstrap. After the weak learners are trained with the random data samples, the test data samples are then classified individually by each weak learner. The final classification result of the test data is based on majority voting. This subsequent phase to bootstrapping is the aggregation phase. RF was chosen as a classifier for the ADNI dataset. The final classification result of the test data is based on majority voting from the output of all weak learners. This subsequent phase to bootstrapping is the aggregation phase. In the present study, RF was chosen as the classifier for the ADNI dataset. The sample datasets
The performance of the proposed CADx method is evaluated by measures of accuracy and F1 score. The measures of true positive (TP), true negative (TN), false positive (FP), and false negative (FN) for both datasets, ADNI and OASIS, are computed for accuracy and F1 score.
The popular metric, receiver operating characteristic curve (ROC), is used to evaluate medical diagnostic expert systems. The ROC curve displays the trade-off between the true positive rate (TPR) and the false positive rate (FPR). This plot of TPR and FPR features the different cutoff results in the ROC curve. The ROC curve is based on measures of sensitivity and specificity. The efficiency of the model increases with the progressing concave curve. The AUC determines the classification capability of the model. The AUC value indicates the location of the ROC curve [44].
The feature sets selected by the IWD algorithm are tabulated in this section. This section provides a detailed discussion of the significance of the features selected by the IWD algorithm for AD diagnosis. The performance metrics of accuracy and F1 score for the RF, KNN, LR, and DT classifiers are evaluated experimentally and tabulated in this section, as well as the data visualization graphs depicting the interaction among features of the dataset, and the ROC curves for the classifiers.
In the proposed CADx tool, setting the attributes to optimal values in the IWD algorithm leads to favorable results. The attributes for the IWD feature selection algorithm are set depending on the work carried out by [35,36]. The number of water drops is set to a constant value of 100. The number of iterations for the IWD algorithm is set as 40. The initial velocity of the waterdrop
4.2 Results and Discussion of the Feature Selection Phase
The IWD algorithm effectively performs the feature reduction, and the key feature set is selected. The feature set selected for DN vs. CN is included in Table 1 and the feature set selected by IWD for MCI vs. CN is included in Table 2. The reduced feature set for OASIS is given in Table 3.


This section discusses the features selected by the feature selection algorithm IWD and the validity of the features according to medical theory. As mentioned in the introduction, the risk of patients being affected by dementia drastically increases with age. The feature selection algorithm selected the age feature as one of the deterministic features that improves the model’s classification accuracy for DN/CN samples in the OASIS dataset. The advantage of CDR-SOB scores is increased precision in the detection of the stages of dementia in support of the hypothesis of the medical study stating that CDR-SOB is a strong predictor of AD in patients; the IWD algorithm selected the same feature in both the datasets of ADNI [45]. The ADAS scale is an important biomarker that differentiates patients with MCI from those with DN, which supports the early detection of AD. The feature selection algorithm IWD also selected the feature ADASQ4 as a critical feature for dementia patients, but not an essential feature for MCI patients [46]. The Mini-Mental State Exam (MMSE) score was used to directly predict the occurrence of dementia in the patients. A severely demented score is <12 out of 30, a moderately demented score is 13–20, and a mildly demented score is 20–24 [47]. The MMSE score is a critical feature for diagnosing DN. The FAQ questionnaire score is considered a significant feature for DN/CN datasets. The FAQ is a questionnaire for dementia patients that identifies activities that can be performed dependently or independently on a 5-point scale. Aiding the medical theory, the proposed algorithm selected FAQ as a deterministic feature for detecting DN but not MCI. RAVLT, a neuropsychological assessment tool for assessing episodic memory was selected as a critical feature for the MCI/CN dataset. There is an excellent correlation between AD and excess whole-brain volume loss. A study on the potential biomarkers of AD progression showed a correlation between excess whole-brain volume loss and AD [48]. MRI imaging results are an excellent modality to compute whole-brain atrophy rates. The brain boundary shift integral is used to calculate brain atrophy rates. An investigation revealed a linear relationship between the atrophy rate and coincident change in each neuropsychiatric score [49]. Changes in neuropsychiatric scores have an impact on patients’ dementia status. The experimentally proven biomarker, whole-brain volume, is also selected as a biomarker by the proposed feature selection algorithm. The pathological changes that have occurred in the selected areas of the brain in the final stages of dementia are found to be critical. The entorhinal cortex of the ventromedial temporal lobe draws significant attention in AD patients as its layers become altered. Research findings indicate that this cortex area is heavily damaged by AD [50]. A neuroanatomical study of mammals discovered that the entorhinal cortex stimulates the axons that interconnect the hippocampal formation bidirectionally with the other parts of the cortex. The degeneration of this part of the cortex could result in the onset of AD and affect the progress of the disease in due course [51]. The selected feature set for AD includes the features that medical practitioners also investigate as the most discriminating features such as CDR-SOB, MMSE, FAQ, RAVLT, and whole-brain atrophy rates. These features are validated by medical references in this section.
4.3 Results and Discussion of Classification Phase
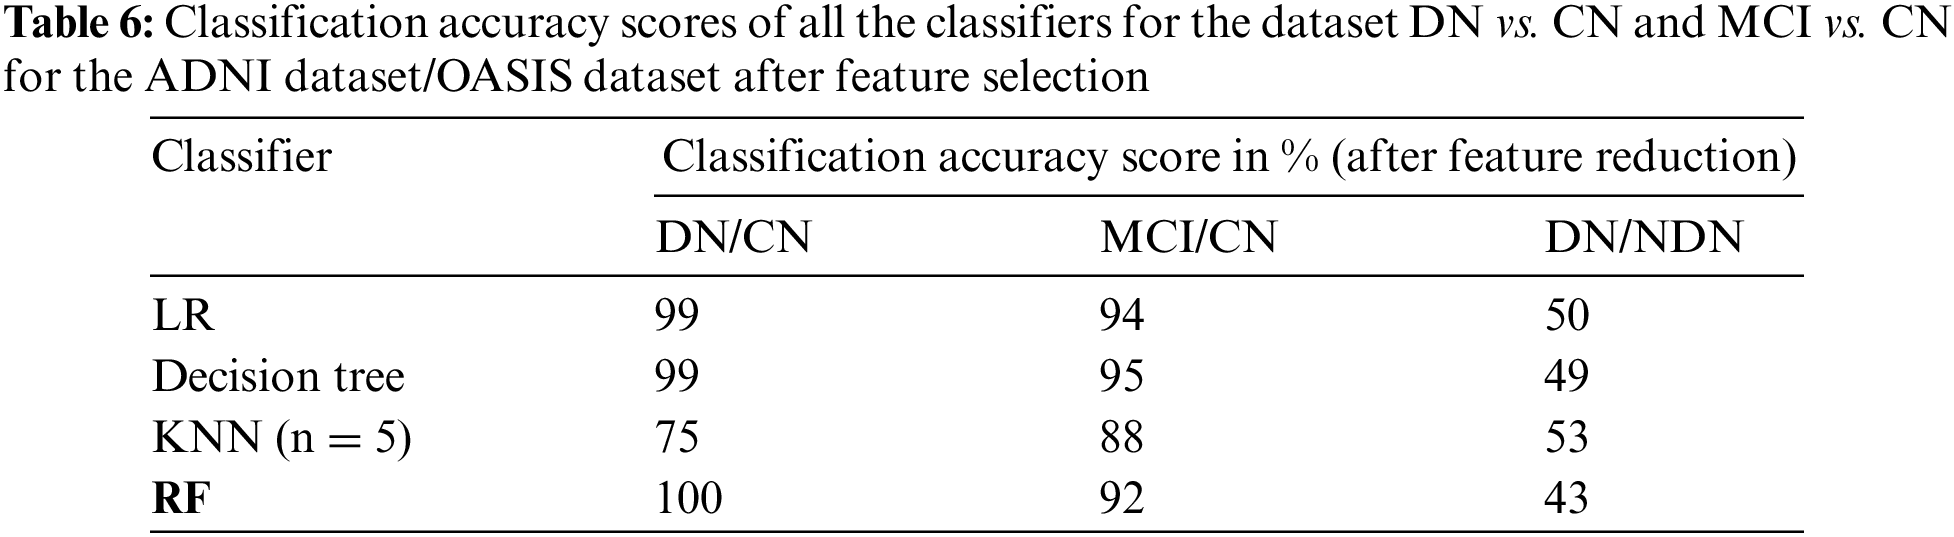
The classification of the proposed CADx model is performed by using the ensemble method RF. The performance evaluation of the proposed CADx model is performed by comparing the classification accuracy of the proposed model with other common classifiers including logistic regression, decision trees, and KNN. The proposed model was implemented using Python. The classification accuracy scores of all the classifiers for the datasets DN/CN and MCI/CN for the ADNI dataset are listed in Table 4. The classification accuracy score for DN/NDN using the OASIS dataset is also included in Table 4. The F1 scores for the classification of DN/CN and the classification of MCI/CN using the ADNI dataset are shown in Table 5. The classification accuracy of the model for the selected features from the ADNI dataset is tabulated in Table 6. The F1 score for the selected key features from the ADNI dataset is provided in Table 7.

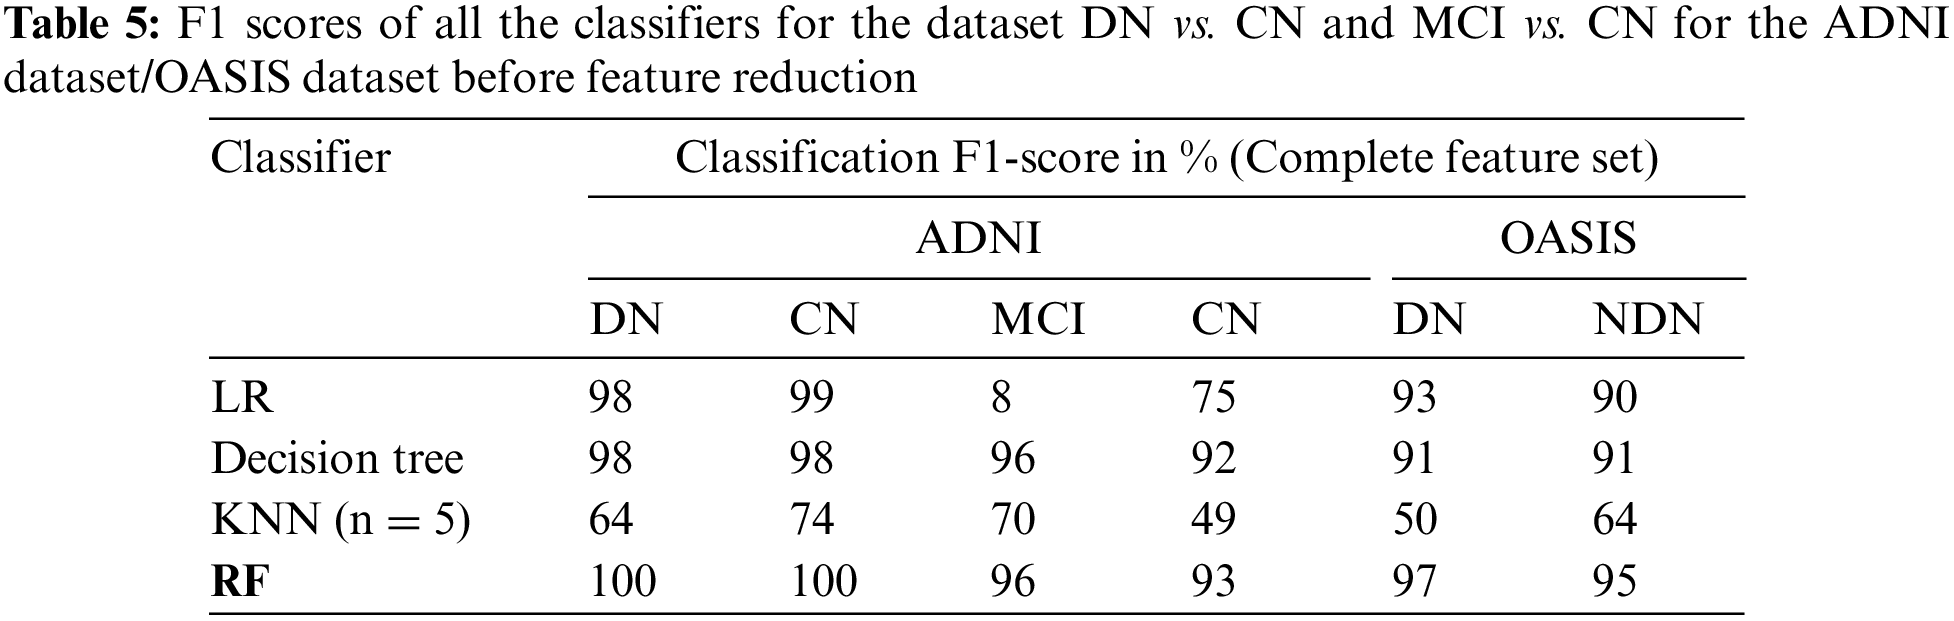
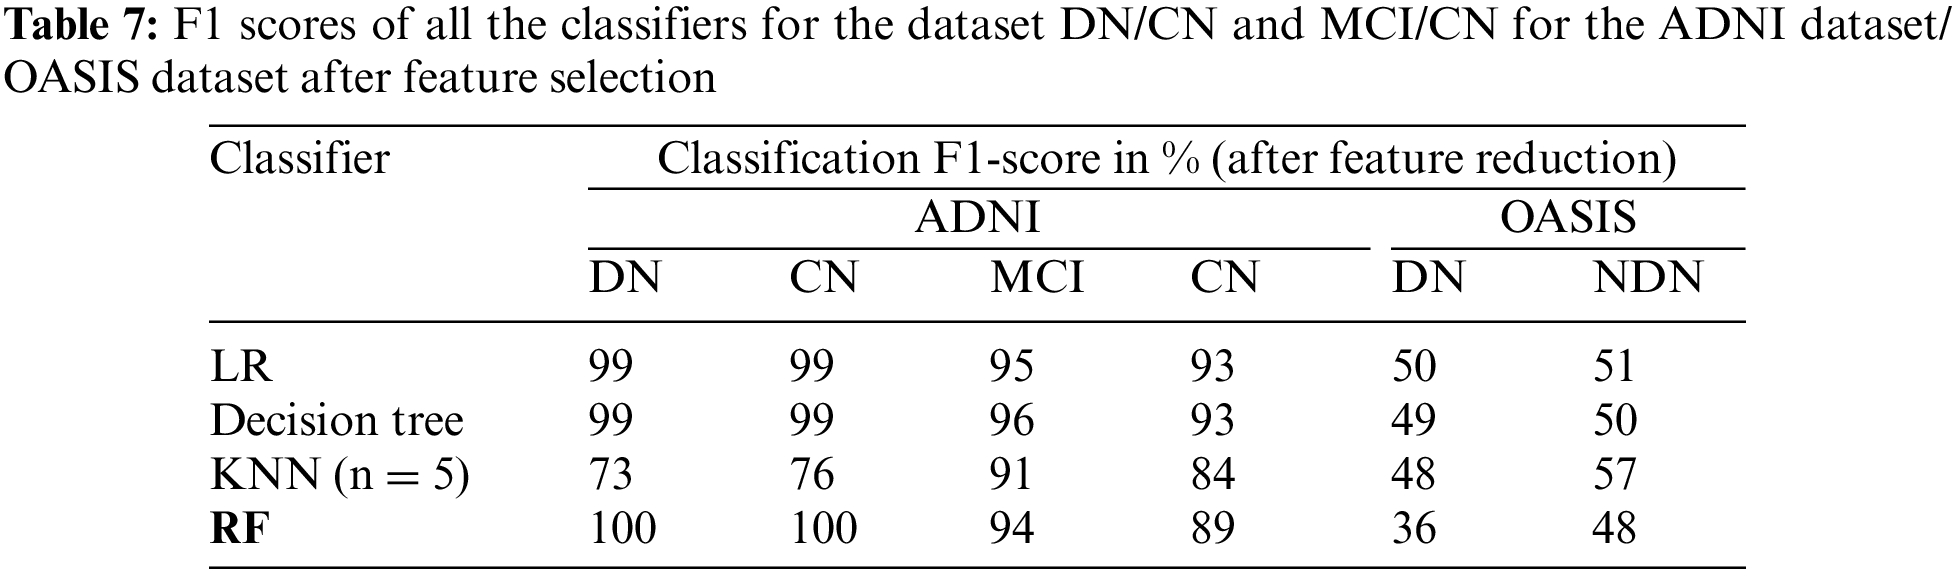
The CADx model proposed in the present study for the diagnosis of AD is intended to assist medical practitioners in the diagnosis of the disease. In this vein, the model must exhibit high performance in terms of evaluation metrics. Tables 4 and 5 show that the performance of the LR and decision tree classifiers for the selected feature set is comparable. The RF ensemble method achieves 100% classification accuracy for the dataset DN/CN. The F1 score is 100% for CN and DN with a feature-reduced dataset.
The performance of the LR model is on par with RF as the dataset is linearly separable. For large datasets, computing the distance between data points is costly, which degrades the performance of the KNN algorithm. The KNN model shows degradation in performance for high-dimensional datasets. Feature scaling resulting in a dataset with reduced features improves the KNN model performance.
The decision tree classifier is a single tree that is built to full length taking into consideration all the features in the reduced dataset. RF has multiple decision trees; each tree considers random samples and features for training. The bootstrap and aggregation phases improve the classifying power of the model significantly. When the feature set is limited to the most deterministic features in the DN/CN dataset, the RF ensemble classifier improves classification accuracy. This method provides a remarkable increase in classification accuracy when feature selection is performed for the dataset MCI/CN. In conclusion, all the classifiers show improved performance with the selected features compared to the complete feature set in the ADNI dataset. Three optimal features were selected for the OASIS dataset. This minimum feature set does not possess the deterministic quality to classify the target variable and provide improved results. The original dataset with all features provides better results compared to the selected feature dataset. The classifiers in this study show a deterioration in classification performance when the dataset is reduced to just three features. This study’s most crucial finding was that all the classifiers, including RF, demand the use of the optimal feature dataset to achieve improved classification results. The optimal feature dataset significantly improves the performance of the classification model. Therefore, the researchers recommend the ensemble method RF as the optimal classifier for the ADNI dataset. From the experimental results, we can conclude that the methodology implemented in this study is promising for assisting medical practitioners in the diagnosis of AD. The following section presents data visualizations of the OASIS and ADNI datasets.
Table 8 provides details of recent papers that discuss some of the latest research. From the tabulated data it can be concluded that the RF ensemble method with feature selection as a preprocessing phase achieves higher accuracy and F1 scores compared to the state-of-the-art methods.
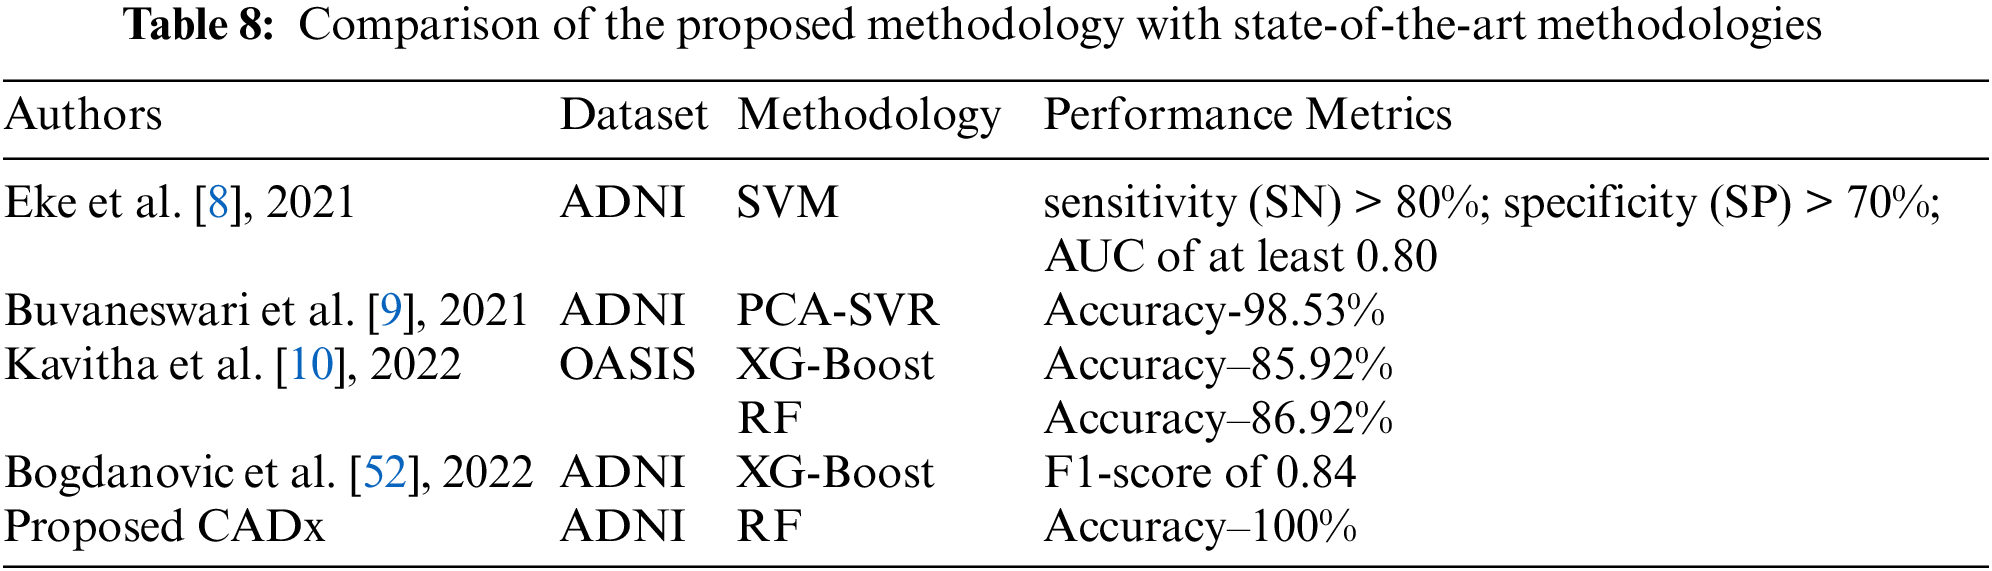
Table 9 provides data visualization of the OASIS dataset. Fig. 2.1 represents age vs. brain volume. In dementia patients, brain volume decreases with the worsening of the disease. The graph represents how age affects the whole-brain volume. Fig. 2.2 shows the mapping of clinical dementia rating vs. age. The graph indicates that the clinical dementia rate is higher in patients > 65 years old. This supports the notion that dementia is widely prevalent in patients in the >65 age group. Fig. 2.3 represents the distribution of MMSE scores among DN and CN patients. The inference is that the MMSE score is low for DN patients and high for CN patients. Fig. 2.4 represents how dementia is related to patients’ educational levels. The graph shows that while dementia is prevalent among the educated population, dementia is less prevalent in patients with more than 20 years of education.
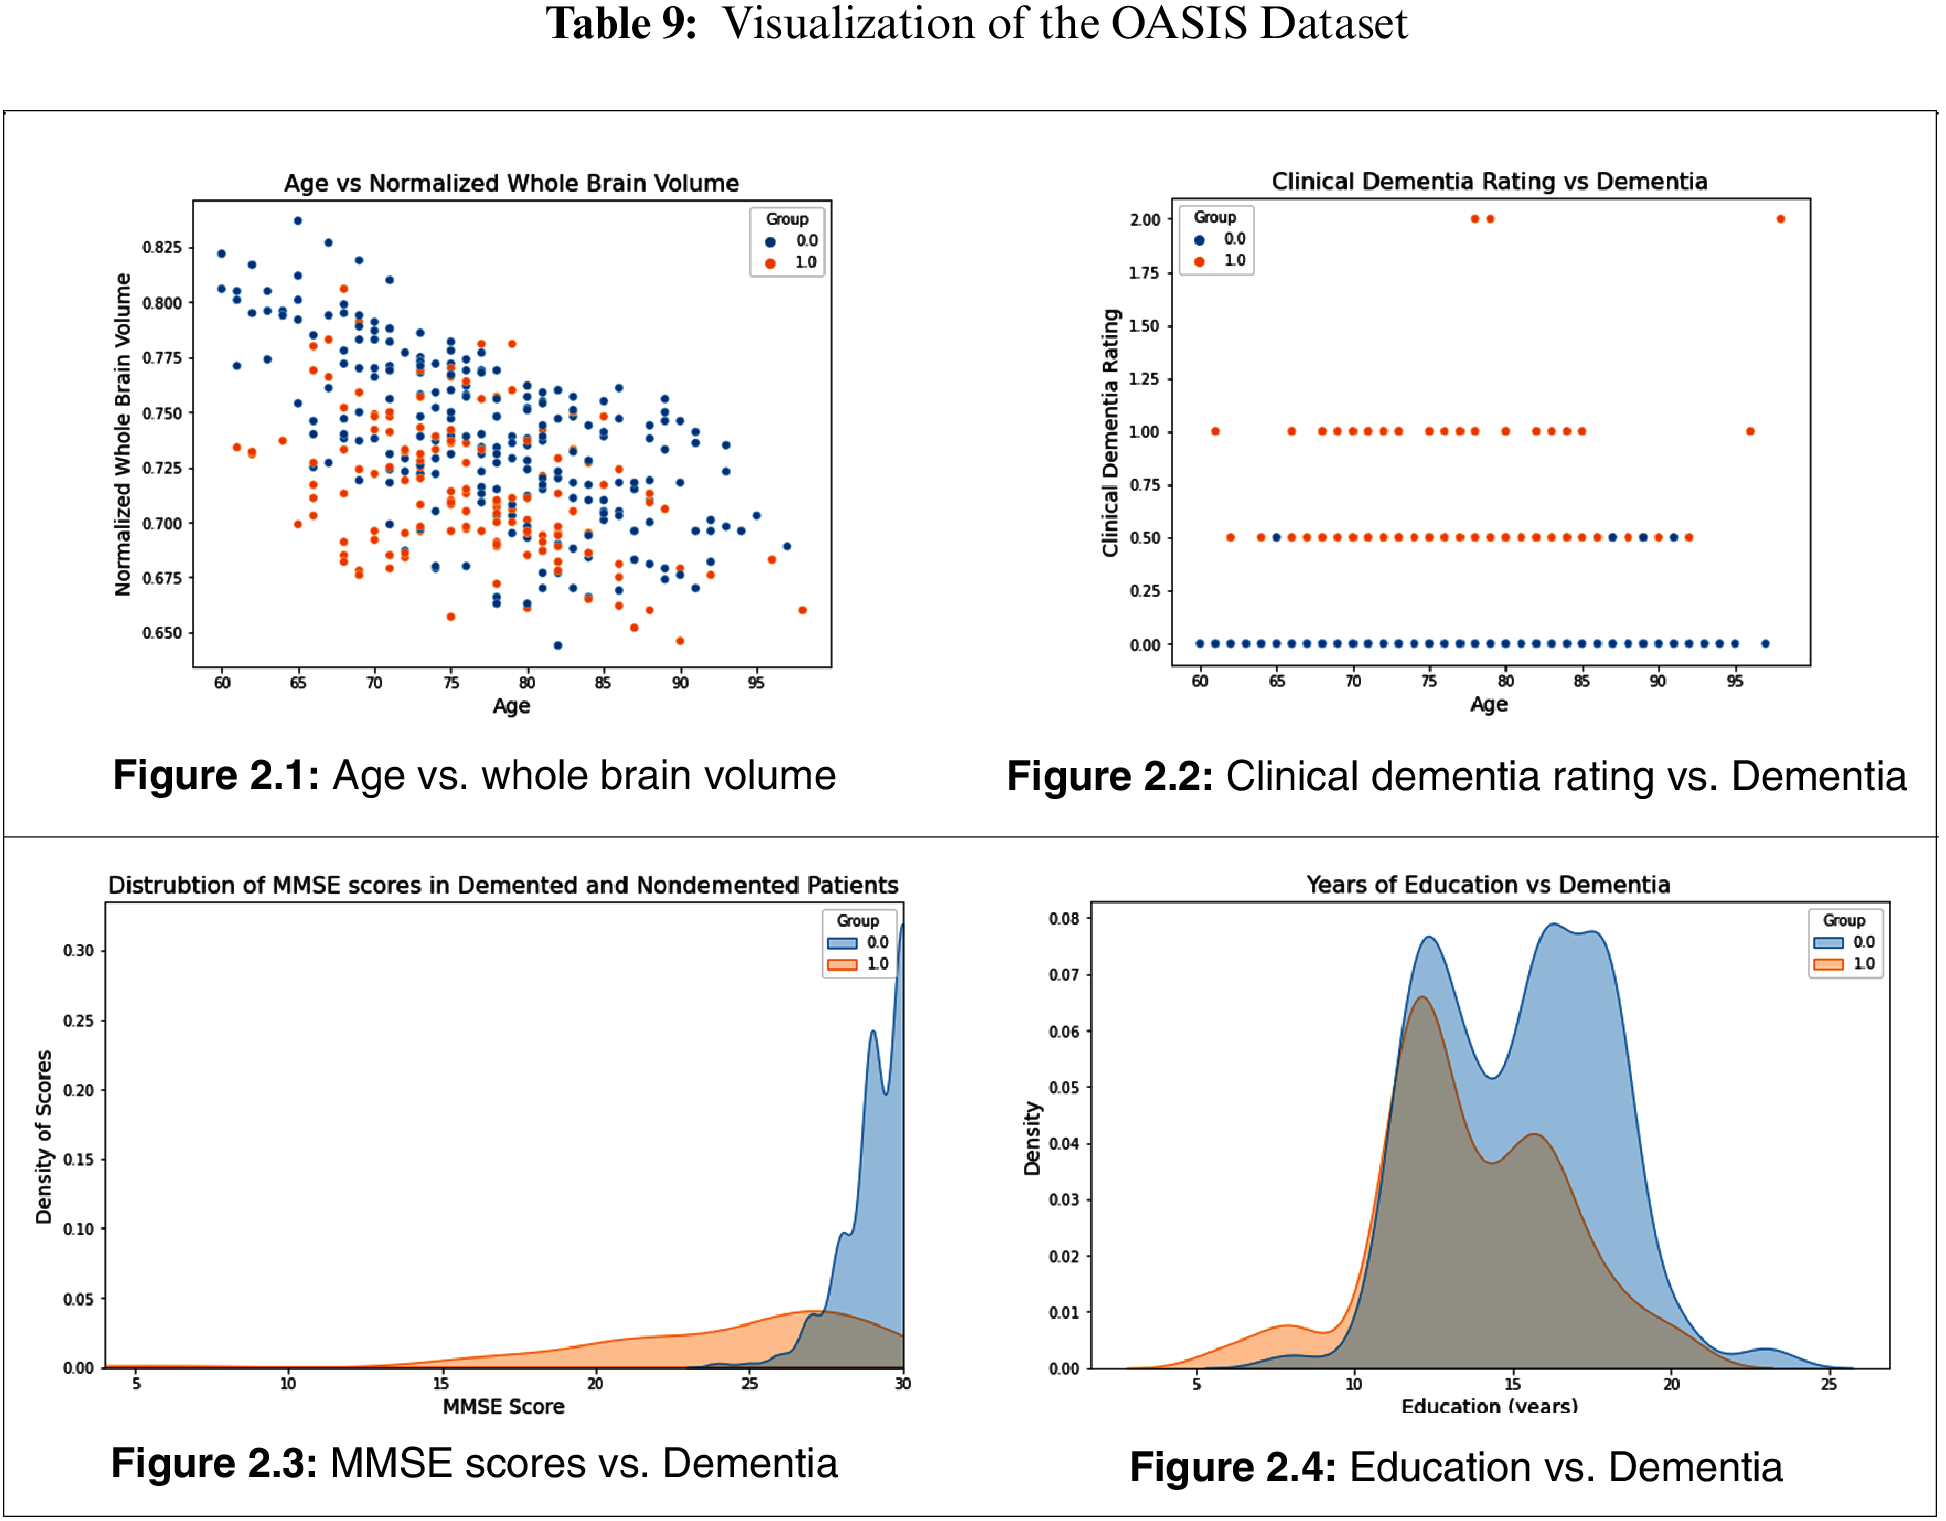
Fig. 3.1 provides a heat map for feature interaction in the OASIS dataset. Fig. 3.2 provides a heat map for the DN/CN ADNI dataset. Fig. 3.3provides a heat map for the ADNI dataset MCI/CN.
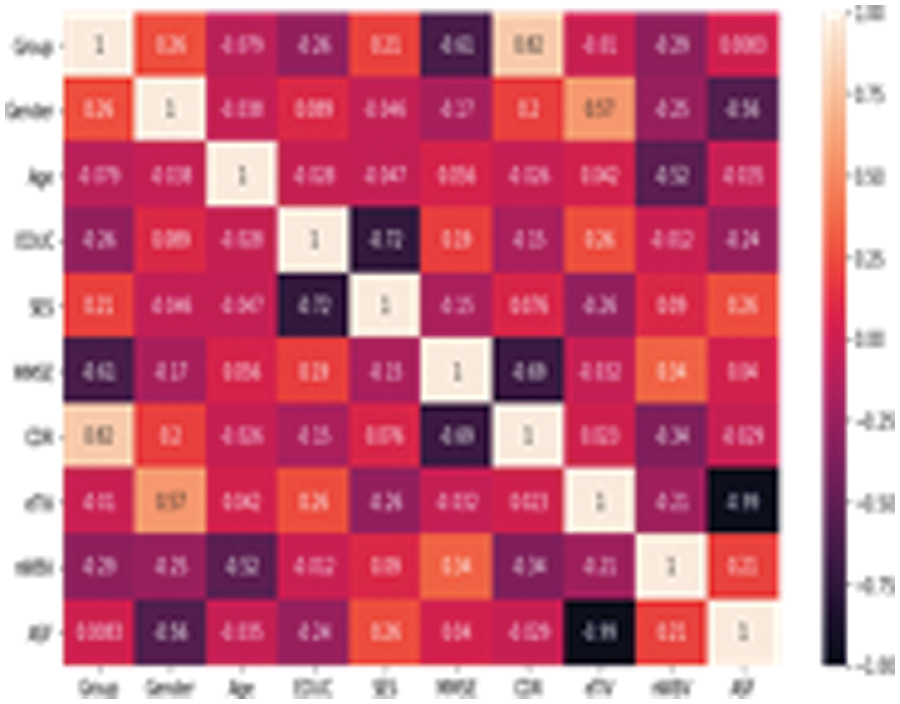
Figure 3.1: Heat map for the OASIS dataset
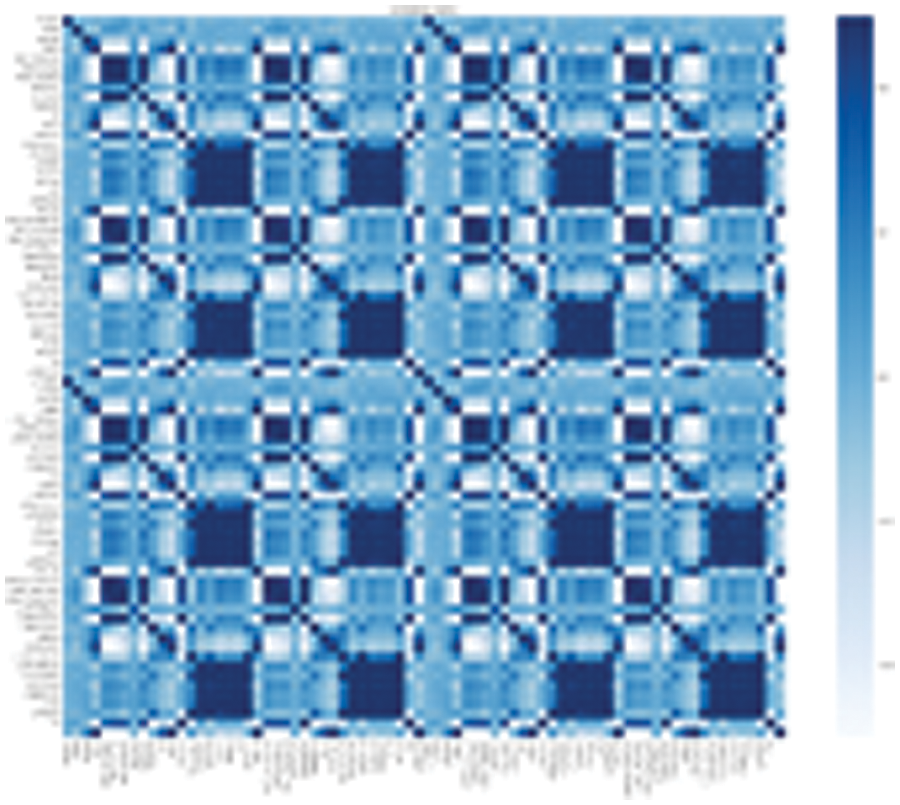
Figure 3.2: Heat map for the ADNI DN/CN dataset

Figure 3.3: Heat map for the ADNI MCI /CN dataset
Fig. 4.1 provides a visualization of gender and marital status for DN and CN patients in the ADNI dataset; it shows that the dementia rate is higher among divorced and widowed patients than among married patients. A recent study investigated the link between depression and dementia; it found that patients with prolonged depression are at a high risk of being affected by dementia [53]. Depression is more prevalent in non-married individuals than in married individuals of both sexes [54]. Fig. 4.2 shows the gender vs. marital status visualization for MCI and CN patients using the ADNI dataset. Married patients are less likely to be affected by MCI compared to unmarried patients of both sexes.
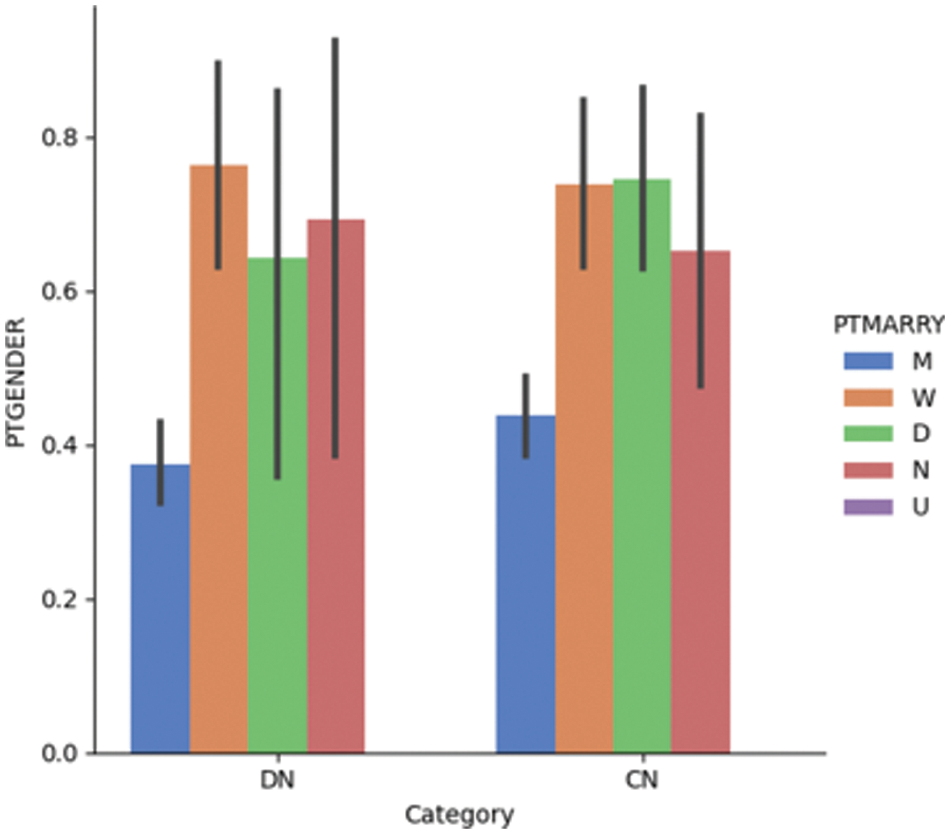
Figure 4.1: Dementia vs. gender vs. marital status for the DN/CN dataset
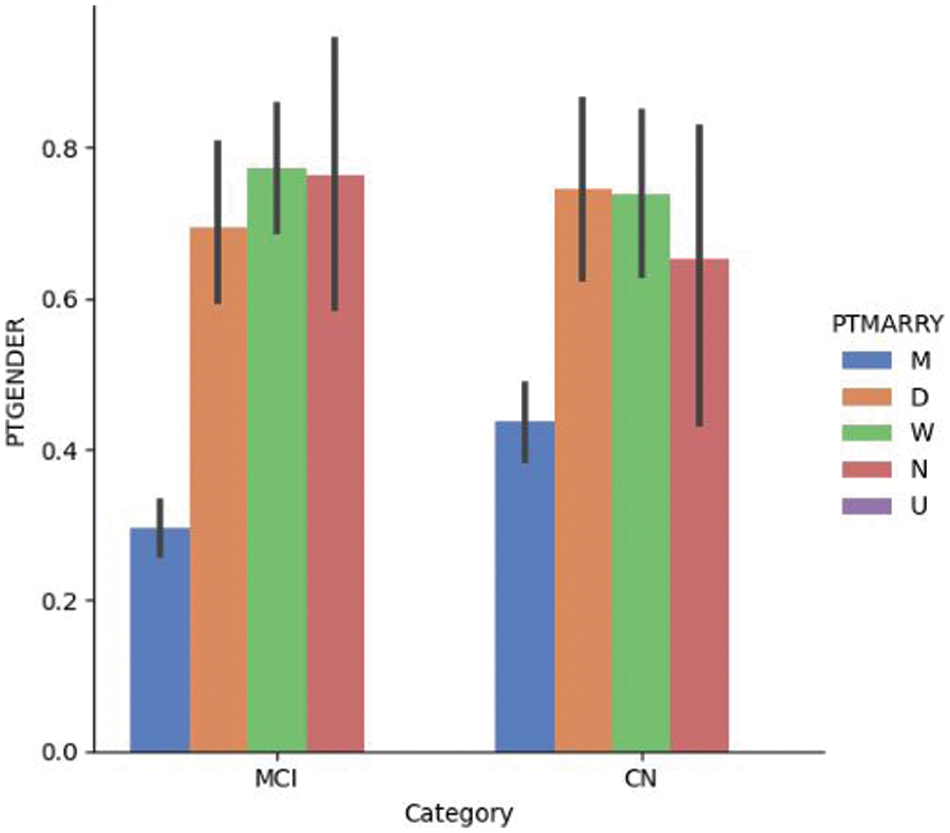
Figure 4.2: Dementia vs. gender vs. marital status for the MCI/CN dataset
Fig. 5.1 shows the LDELTOTAL feature with the entorhinal feature for DN/CN. The entorhinal feature has a direct correlation with the prediction of AD onset [55]. The figure shows that for male patients with DN, the LDELTOTAL feature value is in the range of 0–15, whereas for female patients it is in the range of 0–25. The entorhinal value occupies a higher range for female DN patients compared to male DN patients. Fig. 5.2 shows the relationship between the LDELTOTAL feature with the FAQ feature for DN/CN. CN patients had lower FAQ values compared to DN patients. The two classes of DN and CN can be classified perfectly with the FAQ scores.
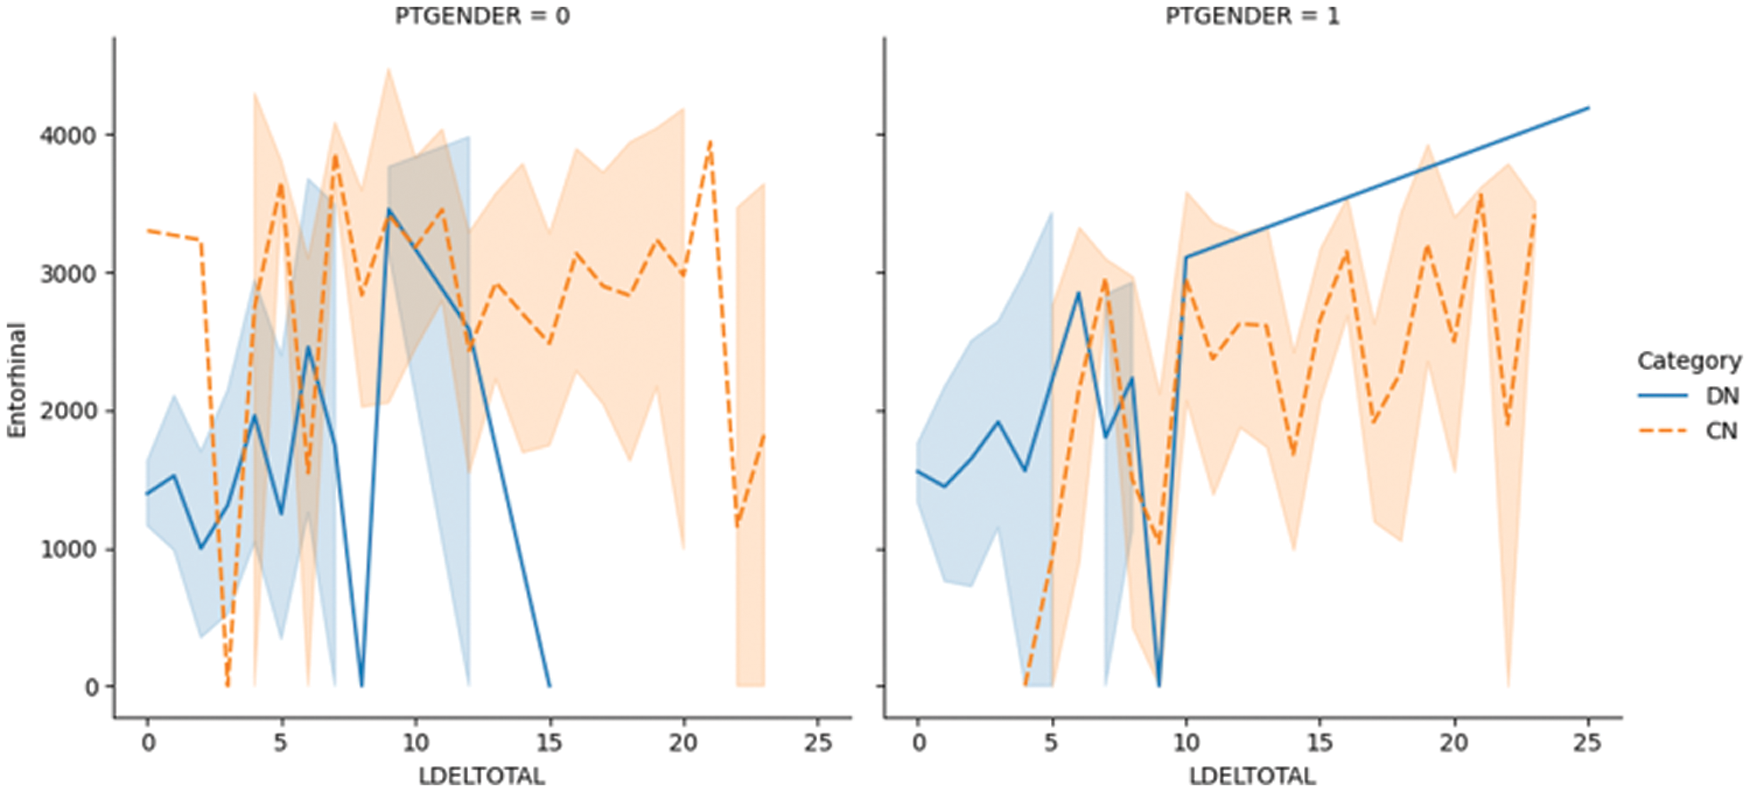
Figure 5.1: The LDELTOTAL feature with entorhinal feature for DN/CN
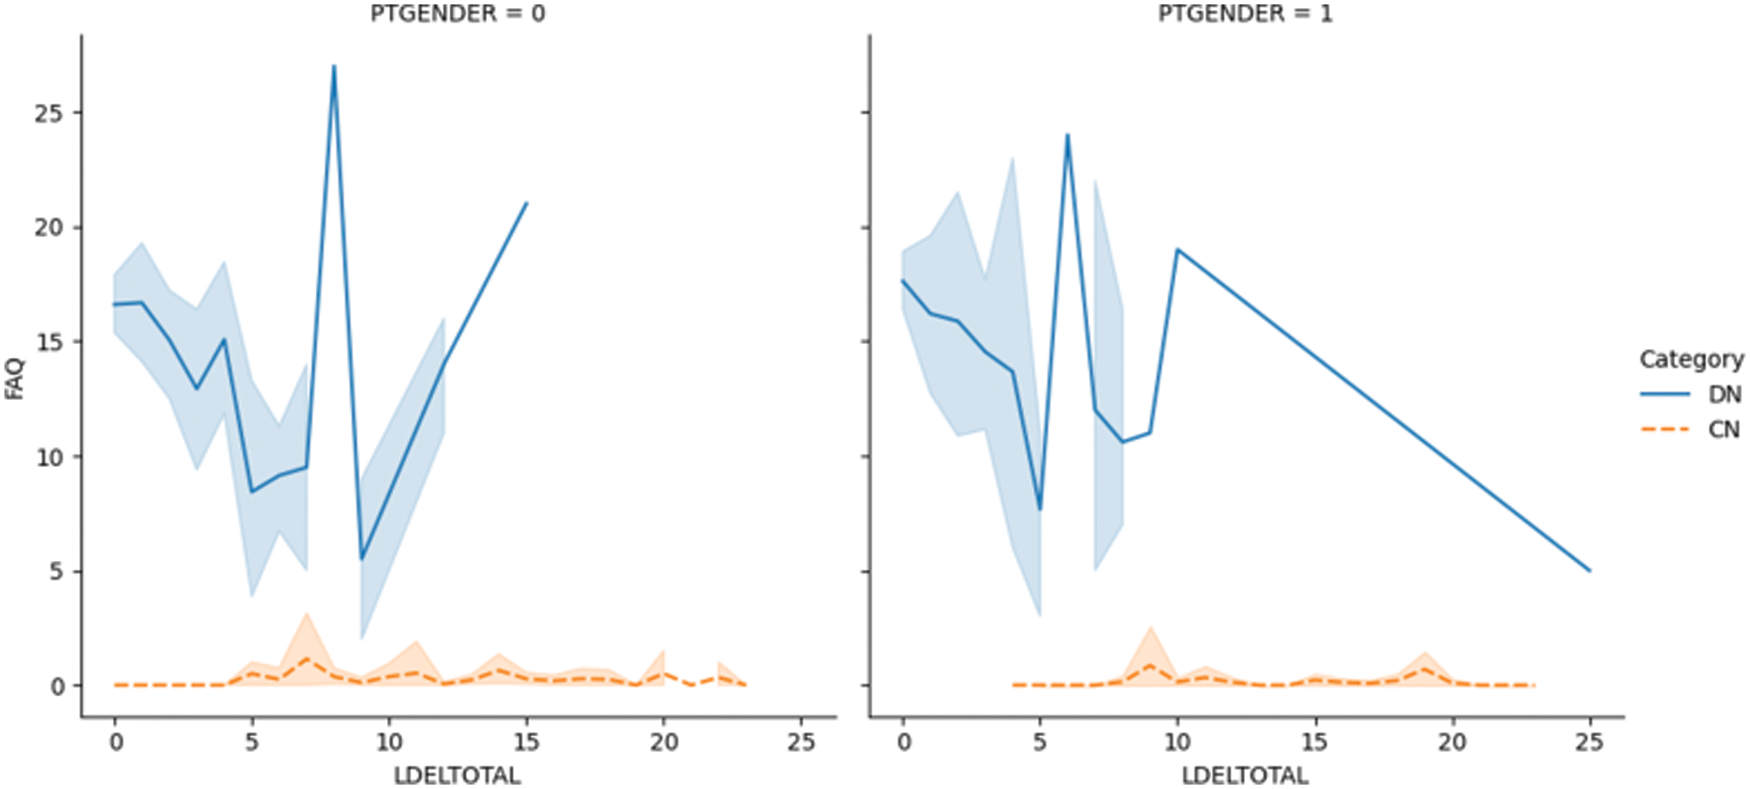
Figure 5.2: The LDELTOTAL feature with FAQ feature for DN/CN
Fig. 6.1 shows the plotting of the LDELTOTAL feature with the entorhinal feature for MCI/CN. The entorhinal value was between 0–4000 for CN male and female patients. However, the entorhinal value was between 1500–4500 for male MCI patients and 0–4000 for female MCI patients. Fig. 6.2 shows the LDELTOTAL feature with the FAQ feature for DN/CN. The FAQ feature is a significant deterministic feature that perfectly classifies the MCI and CN classes.
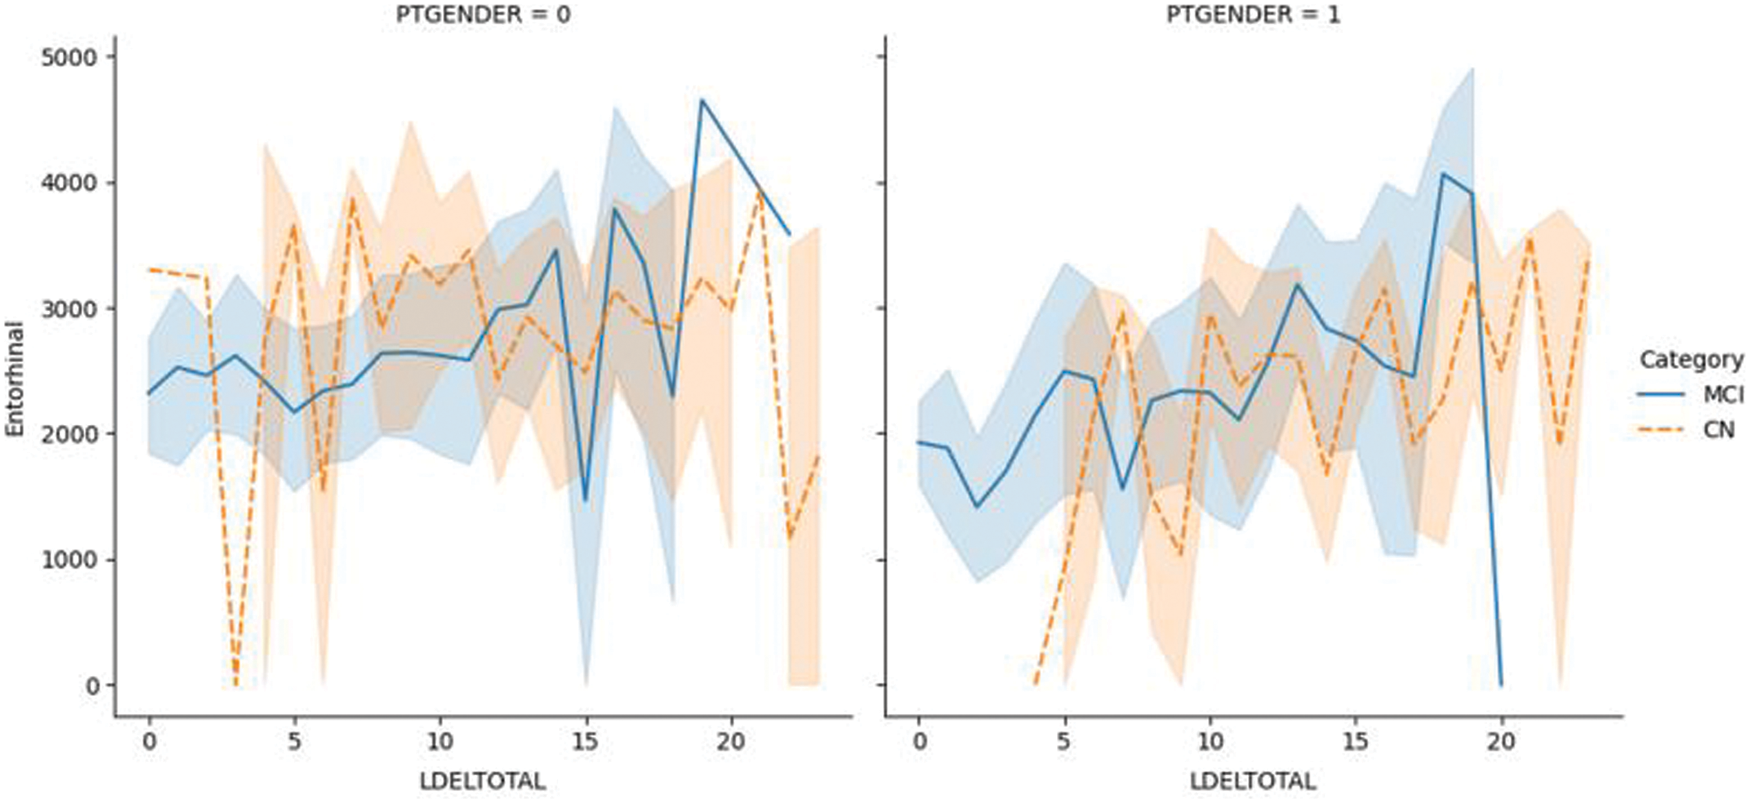
Figure 6.1: The LDELTOTAL feature with the entorhinal feature for the MCI/CN dataset
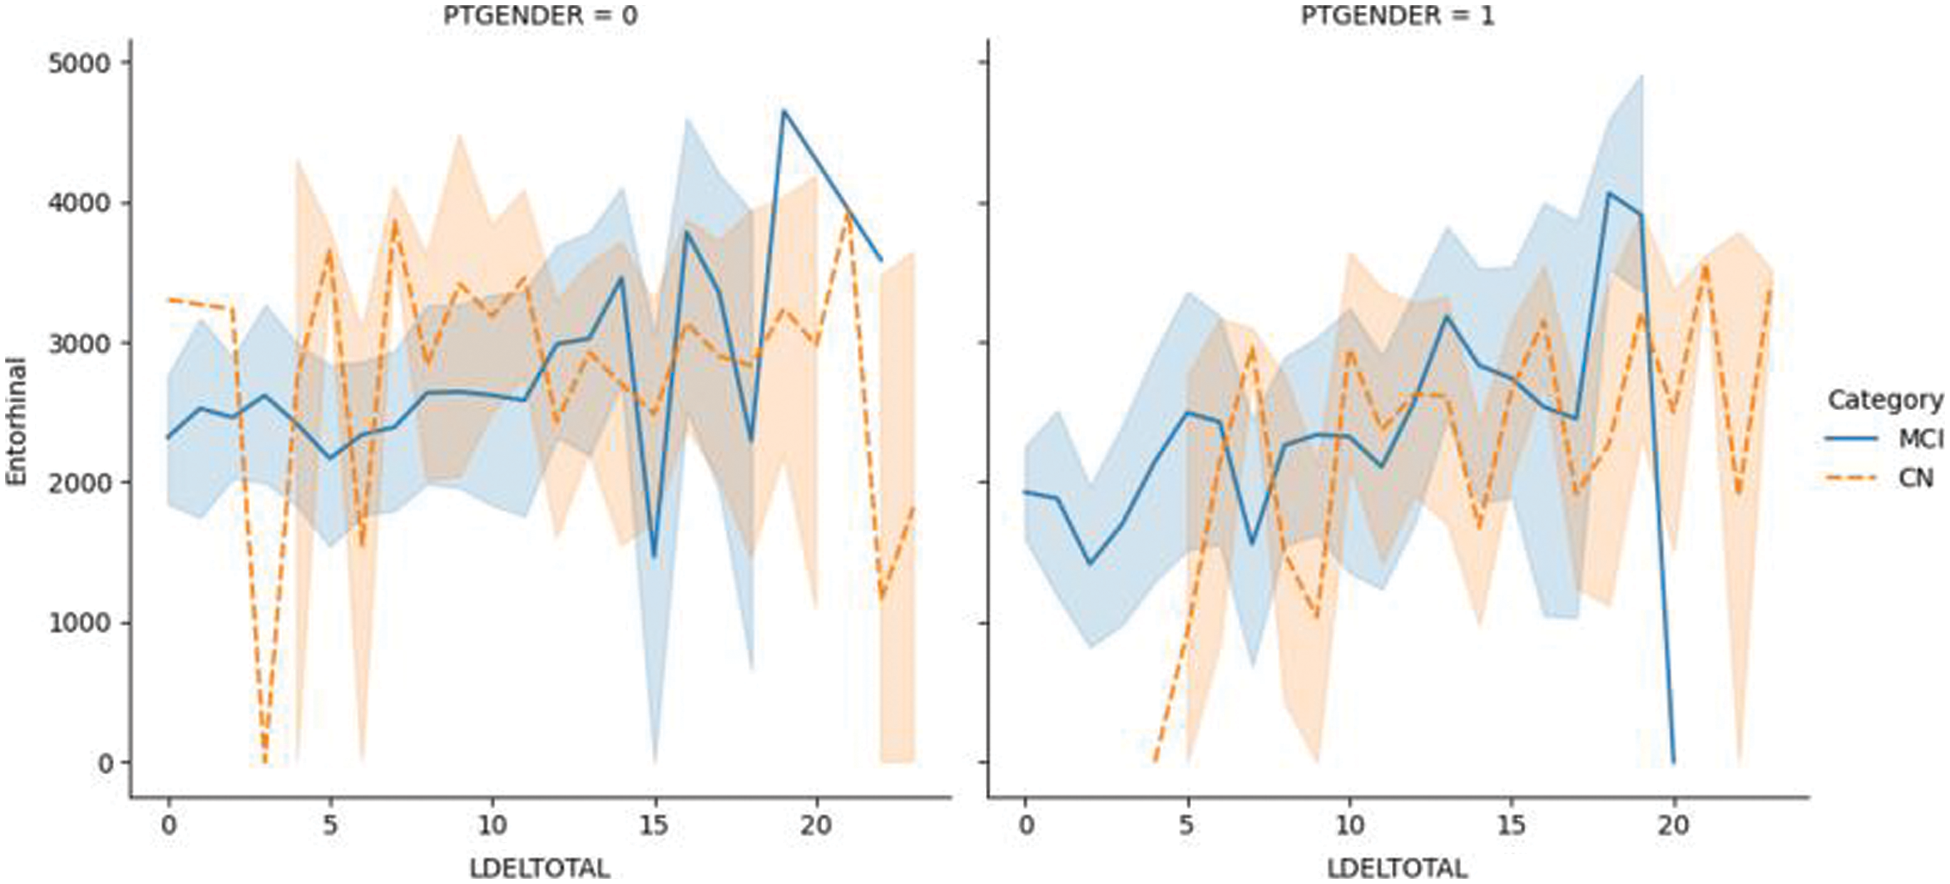
Figure 6.2: The LDELTOTAL feature with FAQ feature for the MCI/CN dataset
Fig. 7.1 illustrates the ROC for DN/CN, which is the measure of the performance of the classification model. This is the optimal ROC curve, with an AUC of 1. The highest AUC value indicates that the classes of DN and CN are perfectly classified with no errors. There is no overlap between the distribution of the results. The graph shows a complete separation of the DN and CN classes. Fig. 7.2 illustrates the ROC curve for MCI/CN with the RF classifier, with an AUC of 0.90 AUC. In this case, the classifier detects more TPs and TNs.
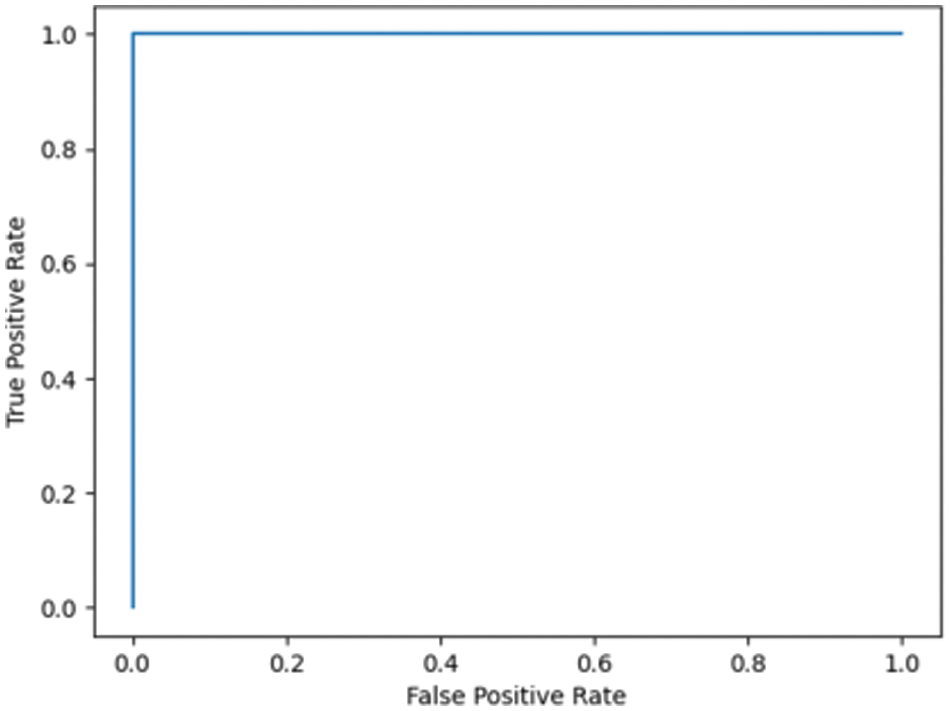
Figure 7.1: ROC for the DN/CN ADNI dataset with RF classifier
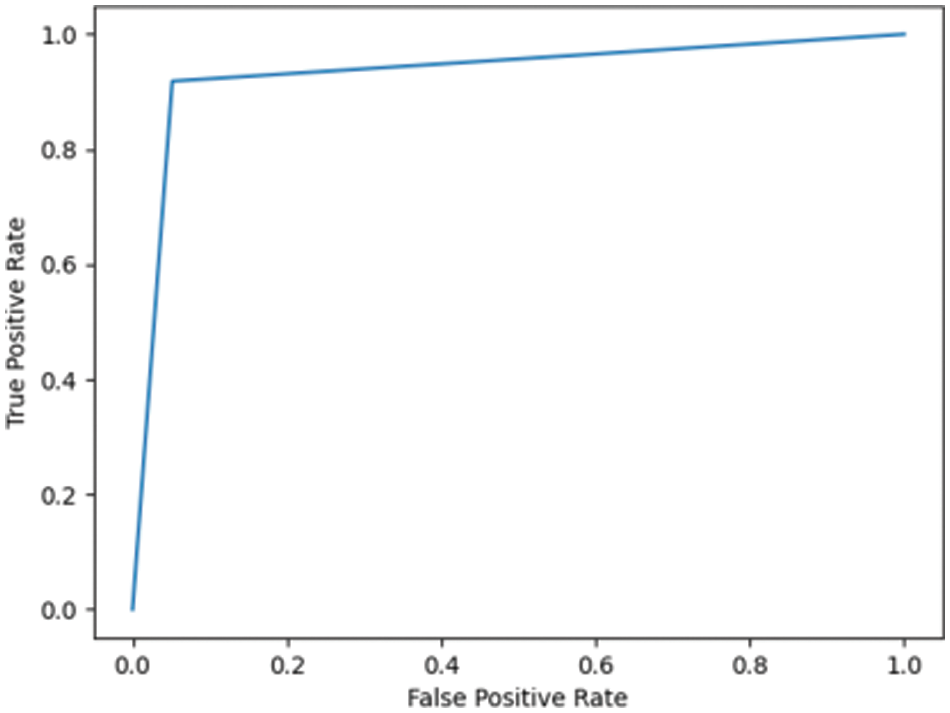
Figure 7.2: ROC for the MCI/CN ADNI dataset with RF classifier
Fig. 7.3 shows the ROC for DN/CN was highly positive, with an AUC of 0.99. This high AUC value indicates that the classifier is as good as the RF classifier in classifying the data as CN or DN. Fig. 7.4 shows the ROC for the ADNI dataset has an AUC of 0.93.
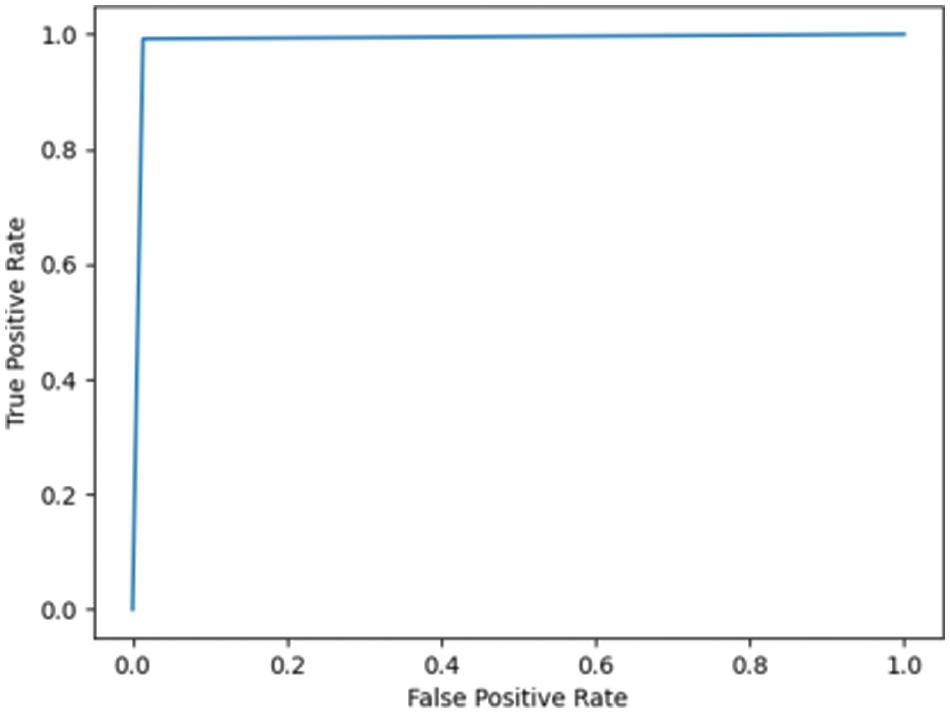
Figure 7.3: ROC for DN/CN ADNI dataset with LR classifier

Figure 7.4: ROC for MCI/CN ADNI dataset with LR classifier
Fig. 7.5 shows the ROC for the DN/CN dataset using a decision tree classifier with an AUC of 0.97, which can be considered a good classifier for real-time medical data. Fig. 7.6 shows the ROC for the MCI/CN dataset with a decision tree classifier, with a relatively low AUC of 0.91. The performance of the decision tree classifier was lower compared to the other classifiers examined.

Figure 7.5: ROC for DN/CN ADNI dataset with decision tree classifier
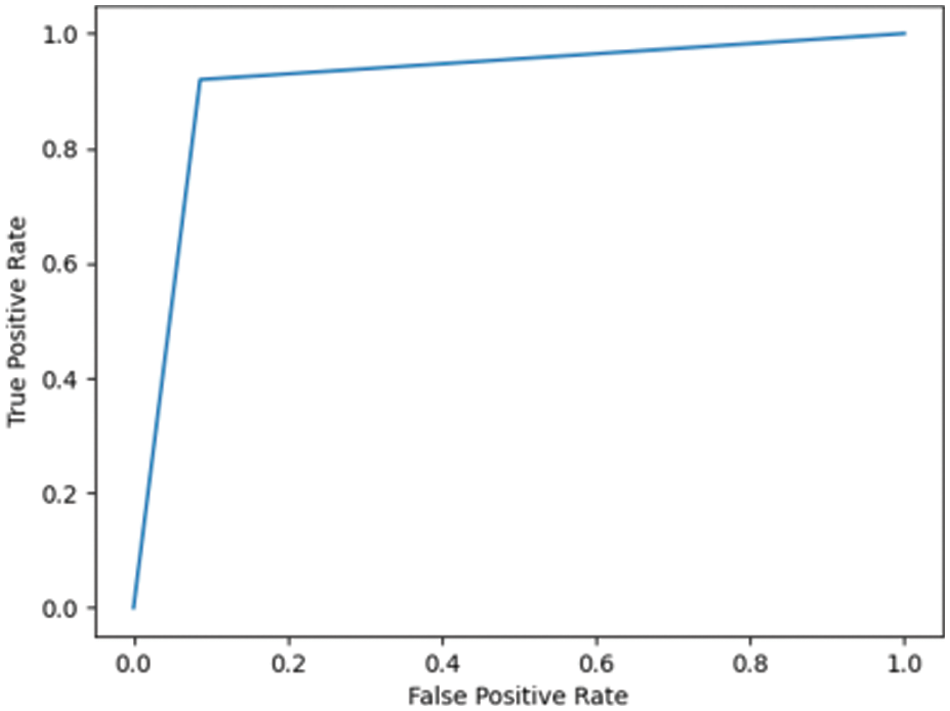
Figure 7.6: ROC for MCI/CN ADNI dataset with decision tree classifier
This study compared different classifiers (LR, DT, KNN, and the RF ensemble method) for predicting the onset of AD for the ADNI and OASIS datasets. The results indicate that the RF ensemble method gives better results compared to the use of a single classifier. These results study strongly emphasize the importance of feature selection as a preprocessing step in the classification of AD patient data samples. This study furnishes the classification accuracy and F1 scores of the respective classifiers before and after feature selection. One significant finding was that feature selection inevitably enhanced the performance of the classification model for the voluminous multi-feature dataset. The study does not recommend feature selection for a crisp dataset with a few highly deterministic features because feature selection of a dataset with very few features drastically deteriorates the model’s performance. Therefore, optimization of the feature set is recommended for high-dimensional datasets to achieve good classification results. The limitation of the current research work is that a large dataset is required to train the model. Future work could investigate working with deep learning techniques on MRI images for the classification of patient data samples as either DN or CN. CNN can be customized to classify the MRI images as either DN or CN.
Acknowledgement: We would like to extend our sincere thanks to Mr. Armaan Ziyad of the Yara International School, Riyadh, for his assistance in programming and data visualization, and his valuable support for this research project. We would like to thank ADNI for providing access to the Alzheimer’s Disease dataset. This publication is part of a funded project supported by the Deanship of Scientific Research at Prince Sattam bin Abdulaziz University, Al Kharj, Saudi Arabia.
Funding Statement: The authors extend their appreciation to the Deputyship for Research & Innovation, Ministry of Education in Saudi Arabia for funding this research work through the project number (IF-PSAU-2021/01/18596).
Conflicts of Interest: The authors declare that they have no conflicts of interest to report regarding the present study.
References
1. “Alzheimer’s Disease Fact Sheet,” National Institute on Aging, 2022. [Online]. Available: http://www.nia.nih.gov/health/alzheimers-disease-fact-sheet. [Google Scholar]
2. “Stages of Alzheimer’s,” Alzheimer’s Disease and Dementia, 2022. [Online]. Available: https://alz.org/alzheimers-dementia/stages. [Google Scholar]
3. “Dementia,” World Health Organization, 2021. [Online]. Available: https://www.who.int/news-room/fact-sheets/detail/dementia. [Google Scholar]
4. Alzheimer’s disease, “NHS,” 2022. [Online]. Available: https://www.nhs.uk/conditions/alzheimers-disease. [Google Scholar]
5. D. Chitradevi and S. Prabha, “Analysis of brain sub-regions using optimization techniques and deep learning method in Alzheimer disease,” Applied Soft Computing, vol. 86, no. 4, pp. 105857, 2020. [Google Scholar]
6. D. Lu, K. Popuri, G. W. Ding, R. Balachandar and M. F. Beg, “Multimodal and multiscale deep neural networks for the early diagnosis of Alzheimer’s disease using structural MR and FDG-PET images,” Scientific Reports, vol. 8, no. 1, pp. 5697, 2018. [Google Scholar]
7. N. J. Herzog and G. D. Magoulas, “Brain asymmetry detection and machine learning classification for diagnosis of early dementia,” Sensors, vol. 21, no. 3, pp. 778, 2021. [Google Scholar]
8. C. S. Eke, E. Jammeh, X. Li, C. Carroll, S. Pearson et al., “Early detection of Alzheimer’s disease with blood plasma proteins using support vector machines,” IEEE Journal of Biomedical and Health Informatics, vol. 25, no. 1, pp. 218–226, 2021. [Google Scholar]
9. P. R. Buvaneswari and R. Gayathri, “Detection and classification of Alzheimer’s disease from cognitive impairment with resting-state fMRI,” Neural Computing and Applications, vol. 1, no. 4, pp. a006189, 2021. [Google Scholar]
10. C. Kavitha, M. Vinodhini, S. R. Srividhya, K. O. Ibrahim and T. R. Carlos Andrés, “Early-stage alzheimer’s disease prediction using machine learning models,” Front Public Health, vol. 10, 2022 [Online]. Available: https://www.frontiersin.org/articles/10.3389/fpubh.2022.853294/full. [Google Scholar]
11. A. G. Sanchez-Reyna, C. H. Espino-Salinas, P. C. Rodriguez, J. D. Salinas-Gonzales and L. A. Zanella-Calzada, “Feature selection and machine learning applied for Alzheimer’s disease classification,” in Proc. of Int. Federation for Medical and Biological Engineering, Cham, Switzerland, pp. 121–128, 2020. [Google Scholar]
12. P. Forouzannezhad, A. Abbaspour, C. Li, C. Fang, U. Williams et al., “A Gaussian-based model for early detection of mild cognitive impairment using multimodal neuroimaging,” Journal Neuroscience Methods, vol. 333, pp. 108544, 2020. [Google Scholar]
13. E. Lella, A. Pazienza, D. Lofu, R. Anglani and F. Vitulano, “An ensemble learning approach based on diffusion tensor imaging measures for Alzheimer’s disease classification,” Electronics, vol. 10, no. 3, pp. 249, 2021. [Google Scholar]
14. V. Thavavel and M. Karthiyayini, “Hybrid feature selection framework for identification of Alzheimer’s biomarkers,” Indian Journal of Science and Technology, vol. 11, no. 22, pp. 1–10, 2018. [Google Scholar]
15. “ADNI | Alzheimer’s Disease Neuroimaging Initiative,” Alzheimer’s Disease Neuroimaging Initiative, 2021. [Online]. Available: http://adni.loni.usc.edu/. [Google Scholar]
16. W. Maass and V. C. Storey, “Pairing conceptual modeling with machine learning,” Data & Knowledge Engineering, vol. 134, no. 5, pp. 101909, 2021. [Google Scholar]
17. S. R. Ziyad, V. Radha and T. Vayyapuri, “Overview of computer aided detection and computer aided diagnosis systems for lung nodule detection in computed tomography,” Current Medical Imaging Reviews, vol. 16, no. 1, pp. 16–26, 2020. [Google Scholar]
18. D. Yanagisawa, N. F. Ibrahim, H. Taguchi, S. Morikawa, T. Tomiyama et al., “Fluorine-19 magnetic resonance imaging for detection of amyloid β oligomers using a keto form of curcumin derivative in a mouse model of Alzheimer’s disease,” Molecules, vol. 26, no. 5, pp. 1362, 2021. [Google Scholar]
19. A. M. Saunders, W. J. Strittmatter, D. Schmechel, P. H. George-Hyslop, M. A. Pericak-Vance et al., “Association of apolipoprotein E allele epsilon 4 with late-onset familial and sporadic Alzheimer’s disease,” Neurology, vol. 43, no. 8, pp. 1467–1472, 1993. [Google Scholar]
20. S. Chakraborty, A. Joardar, S. Roy, G. Gangopadhyay and A. Biswas, “ApoE ε4 and IL-6-174G/C Polymorphism may lead to early onset of Alzheimer’s disease with atypical presentation,” Neurology India, vol. 69, no. 5, pp. 1228–1233, 2021. [Google Scholar]
21. D. J. Irwin, V. M. Y. Lee and J. Q. Trojanowski, “Parkinson’s disease dementia: Convergence of α-synuclein, tau and amyloid-β pathologies,” Nature Reviews Neuroscience, vol. 14, no. 9, pp. 626–636, 2013. [Google Scholar]
22. M. Milà-Alomà, G. Salvado, J. D. Gispert, N. V. Tajedor, O. G. Rivera et al., “Amyloid beta, tau, synaptic, neurodegeneration, and glial biomarkers in the preclinical stage of the Alzheimer’s continuum,” Alzheimer’s and Dementia, vol. 16, no. 10, pp. 1358–1371, 2020. [Google Scholar]
23. D. Aarsland, K. Andersen, J. P. Larsen, A. Lolk and P. Kragh-Sørensen, “Prevalence and characteristics of dementia in Parkinson disease: An 8-year prospective study,” Arch Neurology, vol. 60, no. 3, pp. 387–392, 2003. [Google Scholar]
24. K. Lui, S. M. Laws, Q. X. Li, V. L. Villemagne and D. Ames, “Plasma amyloid-beta as a biomarker in Alzheimer’s disease: The AIBL study of aging,” Journal of Alzheimer’s Disease, vol. 20, no. 4, pp. 1233–1242, 2010. [Google Scholar]
25. “First tau biomarker approved as an Alzheimer’s disease diagnostic tool,” National Institute on Aging, 2021. [Online]. Available: http://www.nia.nih.gov/news/first-tau-biomarker-approved-alzheimers-disease-diagnostic-tool. [Google Scholar]
26. J. K. Kueper, M. Speechley and M. Montero-Odasso, “The Alzheimer’s disease assessment scale-cognitive subscale (ADAS-CogModifications and responsiveness in pre-dementia populations. A narrative review,” Journal of Alzheimer’s Disease, vol. 63, no. 2, pp. 423–444, 2018. [Google Scholar]
27. E. Moradi, I. Hallikainen, T. Hänninen and J. Tohka, “Rey’s auditory verbal learning test scores can be predicted from whole brain MRI in Alzheimer’s disease,” Neuroimage: Clinical, vol. 13, no. 4, pp. 415–427, 2017. [Google Scholar]
28. A. D. Smith, K. A. Jobst, M. Szatmari, A. Jaskowski and E. King, “Detection in life of confirmed Alzheimer’s disease using a simple measurement of medial temporal lobe atrophy by computed tomography,” Lancet, vol. 340, no. 8829, pp. 1179–1183, 1992. [Google Scholar]
29. M. Zhu, J. Xia, M. Yan, G. Cai, J. Yan et al., “Dimensionality reduction in complex medical data: Improved self-adaptive niche genetic algorithm,” Computational and Mathematical Methods in Medicine, vol. 2015, Art. no. 794586, no. 2, pp. 1–12, 2015. [Google Scholar]
30. S. R. Ziyad, V. Radha and T. Vayyapuri, “Classification of benign and malignant pulmonary nodules in LDCT images using radiomic features,” Journal of Engineering Science and Technology, vol. 16, pp. 3250–3266, 2021. [Google Scholar]
31. J. Pirgazi, M. Alimoradi, T. E. Abharian and M. H. Olyaee, “An efficient hybrid filter-wrapper metaheuristic-based gene selection method for high dimensional datasets,” Science Reports, vol. 9, no. 1, pp. 88, 2019. [Google Scholar]
32. A. Sarica, A. Cerasa and A. Quattrone, “Random forest algorithm for the classification of neuroimaging data in Alzheimer’s disease: A systematic review,” Frontiers in Aging Neuroscience, vol. 9, pp. 736, 2017. [Google Scholar]
33. P. Schober and T. R. Vetter, “Logistic regression in medical research,” Anesthesia & Analgesia, vol. 132, no. 2, pp. 365–366, 2021. [Google Scholar]
34. D. S. Marcus, T. H. Wang, J. Parker, J. G. Csernansky, J. C. Morris et al., “Open access series of imaging studies (OASISCross-sectional MRI data in young, middle aged, nondemented, and demented older adults,” Journal of Cognitive Neuroscience, vol. 19, no. 9, pp. 1498–1507, 2007. [Google Scholar]
35. H. S. Hosseini, “The intelligent water drops algorithm: A nature-inspired swarm-based optimization algorithm,” International Journal of Bio-Inspired Computation, vol. 1, no. 2, pp. 71–79, 2010. [Google Scholar]
36. D. J. Kalita, V. P. Singh and V. Kumar, “Two-way threshold-based intelligent water drops feature selection algorithm for accurate detection of breast cancer,” Soft Computing, vol. 26, no. 5, pp. 2277–2305, 2022. [Google Scholar]
37. N. Acharya and S. Singh, “An IWD-based feature selection method for intrusion detection system,” Soft Computing, vol. 22, pp. 4407–4416, 2018. [Google Scholar]
38. H. Wang, A. Parrish, R. K. Smith and S. Vrbsky, “Improved variable and value ranking techniques for mining categorical traffic accident data,” Expert Systems with Applications, vol. 29, no. 4, pp. 795–806, 2005. [Google Scholar]
39. P. Y. Taser, “Application of Bagging and Boosting approaches using decision tree-based algorithms in diabetes risk prediction,” Proceedings, vol. 74, no. 1, pp. 1– 6, 2021. [Google Scholar]
40. M. Savargiv, B. Masoumi and M. R. Keyvanpour, “A new Random forest algorithm based on learning automata,” Computational Intelligence and Neuroscience, vol. 2021, Art no. e5572781, 2021. [Google Scholar]
41. A. R. Javed, L. G. Fahad, A. A. Farhan, S. Abbas, G. Srivastava et al., “Automated cognitive health assessment in smart homes using machine learning,” Sustainable Cities and Society, vol. 65, no. 9, Art no. 102572, 2021. [Google Scholar]
42. A. R. Javed, M. U. Sarwar, S. Rehman, H. U. Khan, Y. D. Al Otaibi et al., “PP-SPA: Privacy preserved smartphone-based personal assistant to improve routine life functioning of cognitive impaired individuals,” Neural Process Lett, 2021. https://doi.org/10.1007/s11063-020-10414-5. [Google Scholar]
43. M. K. Islam, C. Kaushal, M. A. Amin, A. D. Algarni, N. Alturki et al., “A secure framework toward IoMT-assisted data collection, modeling, and classification for intelligent dermatology healthcare services,” Molecular Imaging, vol. 2022, Art no. 6805460, 2022. [Google Scholar]
44. K. Hajian-Tilaki, “Receiver operating characteristic (ROC) curve analysis for medical diagnostic test evaluation,” Caspian Journal of Internal Medicine, vol. 4, no. 2, pp. 627–635, 2013. [Google Scholar]
45. S. E. O'Bryant, S. C. Waring, C. M. Cullum, J. Hall, L. Lacritz et al., “Staging dementia using clinical dementia rating scale sum of boxes scores: A Texas Alzheimer’s research consortium study,” JAMA Neurology, vol. 65, no. 8, pp. 1091–1095, 2008. [Google Scholar]
46. D. M. Kaufman, H. L. Geyer and M. J. Milstein, “Dementia,” in Kaufman’s Clinical Neurology for Psychiatrists, 8th ed., USA: Elsevier, pp. 105–149, 2017. [Google Scholar]
47. “Medical Tests for Diagnosing Alzheimer’s,” Alzheimer’s Association, 2021. [Online]. Available: https://alz.org/alzheimers-dementia/diagnosis/medical_tests. [Google Scholar]
48. N. J. M. Schott, S. J. Crutch, C. Frost, E. K. Warrington, M. N. Rossor et al., “Neuropsychological correlates of whole brain atrophy in alzheimer’s disease,” Neuropsychologia, vol. 46, no. 6, pp. 1732–1737, 2008. [Google Scholar]
49. P. F. Cardoso, M. J. Leung, K. K. Cash, D. M. Modat, M. Fox et al., “Measuring brain atrophy with a generalized formulation of the boundary shift integral,” Neurobiology of Aging, vol. 36, pp. S81–S90, 2015. [Google Scholar]
50. B. C. Dickerson, A. Bakkour, D. H. Salat, F. Eric, J. Pacheco et al., “The cortical signature of Alzheimer’s disease: Regionally specific cortical thinning relates to symptom severity in very mild to mild AD dementia and is detectable in asymptomatic amyloid-positive individuals,” Cerebral Cortex, vol. 19, no. 3, pp. 497–510, 2009. [Google Scholar]
51. “Medical Tests,” Alzheimer’s Disease and Dementia, 2022. [Online]. Available: https://alz.org/alzheimers-dementia/diagnosis/medical_tests. [Google Scholar]
52. B. Bogdanovic, T. Eftimov and M. Simjanoska, “In-depth insights into Alzheimer’s disease by using explainable machine learning approach,” Science Reports, vol. 12, no. 6508, pp. 137, 2022. [Google Scholar]
53. “Light Shed on Link Between Depression, Dementia,” WebMD, 2014. [Online]. Available: https://www.webmd.com/depression/news/20140730/scientists-shed-light-on-link-between-depression-dementia. [Google Scholar]
54. “Depression predicts single relationship status in later adulthood, study finds,” PsyPost, 2022. [Online]. Available: https://www.psypost.org/2021/04/depression-predicts-single-relationship-status-in-later-adulthood-study-finds-60430. [Google Scholar]
55. G. W. Van Hoesen, B. T. Hyman and A. R. Damasio, “Entorhinal cortex pathology in Alzheimer’s disease,” Hippocampus, vol. 1, no. 1, pp. 1–8, 1991. [Google Scholar]
Cite This Article
 Copyright © 2023 The Author(s). Published by Tech Science Press.
This work is licensed under a Creative Commons Attribution 4.0 International License , which permits unrestricted use, distribution, and reproduction in any medium, provided the original work is properly cited.
 Downloads
 Citation Tools