
 Submit a Paper
 Propose a Special lssue
 Open Access
ARTICLE

Infrared Spectroscopy-Based Chemometric Analysis for Lard Differentiation in Meat Samples
1 Department of Electrical and Electronic Engineering, Universiti Teknologi Petronas, Seri Iskandar, 32610, Malaysia
2 College of Engineering, Al Ain University, Al Ain, 64141, United Arab Emirates
3 High Performance Cloud Computing Centre (HPC), Universiti Teknologi Petronas, Seri Iskandar, 32610, Malaysia
* Corresponding Author: Muhammad Aadil Siddiqui. Email:
Computers, Materials & Continua 2023, 75(2), 2859-2871. https://doi.org/10.32604/cmc.2023.034164
Received 07 July 2022; Accepted 11 October 2022; Issue published 31 March 2023
 View Full Text
 Download PDF
Abstract
One of the most pressing concerns for the consumer market is the detection of adulteration in meat products due to their preciousness. The rapid and accurate identification mechanism for lard adulteration in meat products is highly necessary, for developing a mechanism trusted by consumers and that can be used to make a definitive diagnosis. Fourier Transform Infrared Spectroscopy (FTIR) is used in this work to identify lard adulteration in cow, lamb, and chicken samples. A simplified extraction method was implied to obtain the lipids from pure and adulterated meat. Adulterated samples were obtained by mixing lard with chicken, lamb, and beef with different concentrations (10%–50% v/v). Principal component analysis (PCA) and partial least square (PLS) were used to develop a calibration model at 800–3500 cm−1. Three-dimension PCA was successfully used by dividing the spectrum in three regions to classify lard meat adulteration in chicken, lamb, and beef samples. The corresponding FTIR peaks for the lard have been observed at 1159.6, 1743.4, 2853.1, and 2922.5 cm−1, which differentiate chicken, lamb, and beef samples. The wavenumbers offer the highest determination coefficient R2 value of 0.846 and lowest root mean square error of calibration (RMSEC) and root mean square error prediction (RMSEP) with an accuracy of 84.6%. Even the tiniest fat adulteration up to 10% can be reliably discovered using this methodology.Keywords
Food authenticity is an important problem in the global food market. With the plethora of processed foods on the market and a long supply chain, food fraud is always a worry. First coined by Spink et al. [1], food fraud is defined as altering the correct labeling of food ingredients in which cheaper and accessible alternatives substitute expensive, less accessible raw materials. Some of these adulterations may merely have a financial impact on the public, while others may have a more significant impact, such as food allergies [2–4], food poisoning, religious beliefs [5,6], and so on. Although food tampering is not a new problem, some of the tampering’s were quite harmful. For example, in 1981 in Spain, sawdust was added to white bread [7,8], formula milk was adulterated with melamine [9,10], and motor oil was mixed with oil for human consumption [11]. Not only is it harmful to one’s health, but some incidents also entail misrepresenting food components, such as the adulteration of beef with horse flesh in the United Kingdom in 2013. Muslims and Jews, for example, have dietary limitations because they follow halal and kosher regulations, respectively. Although there are certain parallels between halal and kosher regulations, such as prohibiting the consumption of pig and derivatives, blood, and so on, there are also some distinctions. Despite the fact that halal and kosher are not the same, both regulations strictly prohibit the ingestion of pig and its byproducts, such as lard [12]. But due to the price difference between pork and other red meats, halal and kosher consumers are always concerned with the authentication of halal and kosher foods [12]. In 2019, the worldwide halal industry was valued at $1.17 trillion, and it is expected to grow to $1.38 trillion by 2024 [13,14]. Therefore, the industry is very interested in strengthening consumers’ trust in the halal brand. Market confidence is necessary to protect this [14–16]. To guarantee that halal and kosher brand food items meet the regulations, a variety of food authentication procedures can be used [17]. However, majority of these methods still need extensive sample preparation. Furthermore, some are extremely sensitive to contaminants and are prone to producing ambiguous findings if all processes are not strictly followed.
The simplicity of sample preparation, as well as the relatively rapid and non-destructive character of this technology, has prompted an increased study on vibrational spectroscopy-based food verification procedures [18]. FTIR spectroscopy can simply and accurately differentiate food adulteration. Some of the research includes pork meat and fat in meatball broth [19,20], imported chocolate [21], vegetable oils [22], and others. Near-infrared (NIR) spectroscopy has been a focus for several researchers, partly because of its applicability and portability for food authentication instruments [23–26]. However, the research on this reported lower accuracy in the discrimination of adulterants. Although FTIR is a rapid and relatively affordable method that allows for easier sample preparation and a non-destructive procedure, it is not without its drawbacks [27,28], it is still limited in portability due to its bulky equipment. This research paper aims to improve the accuracy of the FTIR spectrometer utilizing optimizing post-processing analysis and quantifying the lard adulteration level in different mixtures.
1.1 Food Authentication Based on Vibrational Spectroscopy
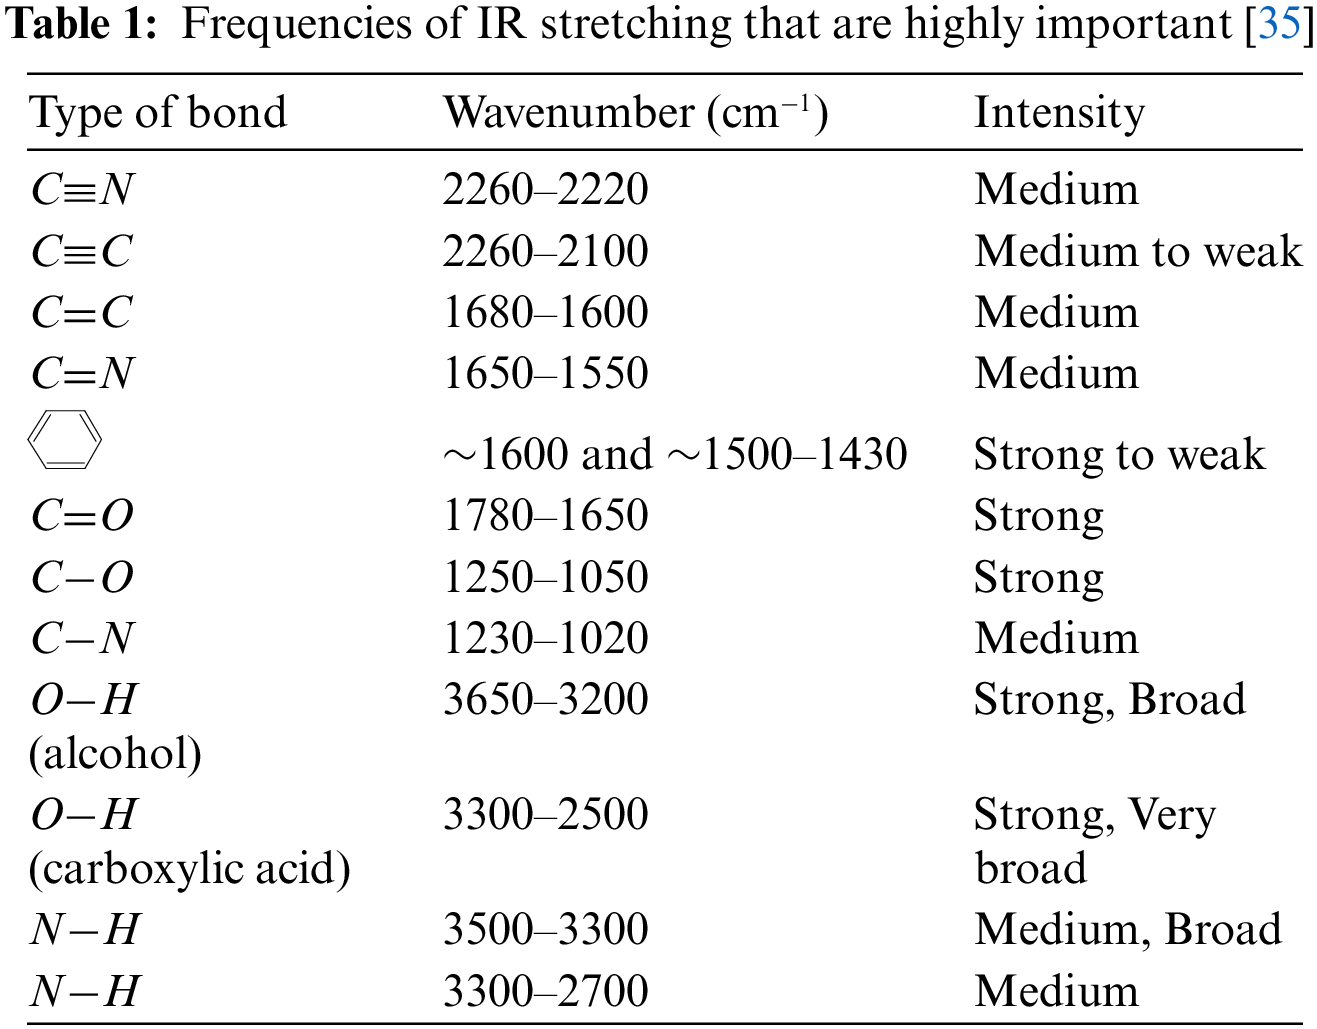
Food authentication development is necessary for food control because this is the process that will validate whether a particular food complies with its label description, origin of the food (species, gene, geographical), production method (conventional, organic, free-range, etc.), and processing method (frozen, etc.) [29–31]. The spectroscopic methods are fast becoming popular [32,33]. These approaches yield chemical fingerprints that are unique to each food and may be used to differentiate between them or to validate them. The idea behind vibrational spectroscopy is that atom-to-atom links inside molecules vibrate at frequencies that can be represented by physical laws and that can be calculated [34]. Using the assumption that bond energy comes from the vibrations of a diatomic harmonic oscillator and that they satisfy Hooke’s Law, it is possible to estimate the lowest fundamental frequencies of any two atoms joined by a chemical bond, as shown in Eq. (1).
The vibrational frequency is v, the classical force constant is k, and the decreased mass of the two atoms is
where
Alternatively, the equation may be simplified by employing the quantum term v.
When it comes to polyatomic compounds, there are a lot of different energy levels to choose from. To a first approximation, such a molecule may be thought of as a collection of diatomic, independent, harmonic oscillators. This case's equation may be generalized as
When an energy level transitions from 0 to 1 in any of the vibrational states v-1, v-2, v-3,..., the transition is deemed basic and is allowed under selection criteria. The overtone is the transition from the ground state to v-i. = 1, 2, 3..., while all the others are zero. Transitions from the ground state to a state for which combinations such as
When a quick and objective study is required, absorption and fluorescence spectroscopies in the visible and infrared range are acceptable possibilities.
1.2 Fourier Transform Infrared (FTIR) Spectroscopy
One of the most widely used infrared spectroscopy technology is FTIR spectroscopy. Using Michelson interferometer Fig. 1a, interferograms of both the sample and the background can be collected. The interferograms collected can be passed through the fast Fourier transform algorithm to produce single beam spectra as shown in Fig. 1b, which then passes the spectrum after transforming it as transmittance spectrum for analysis.
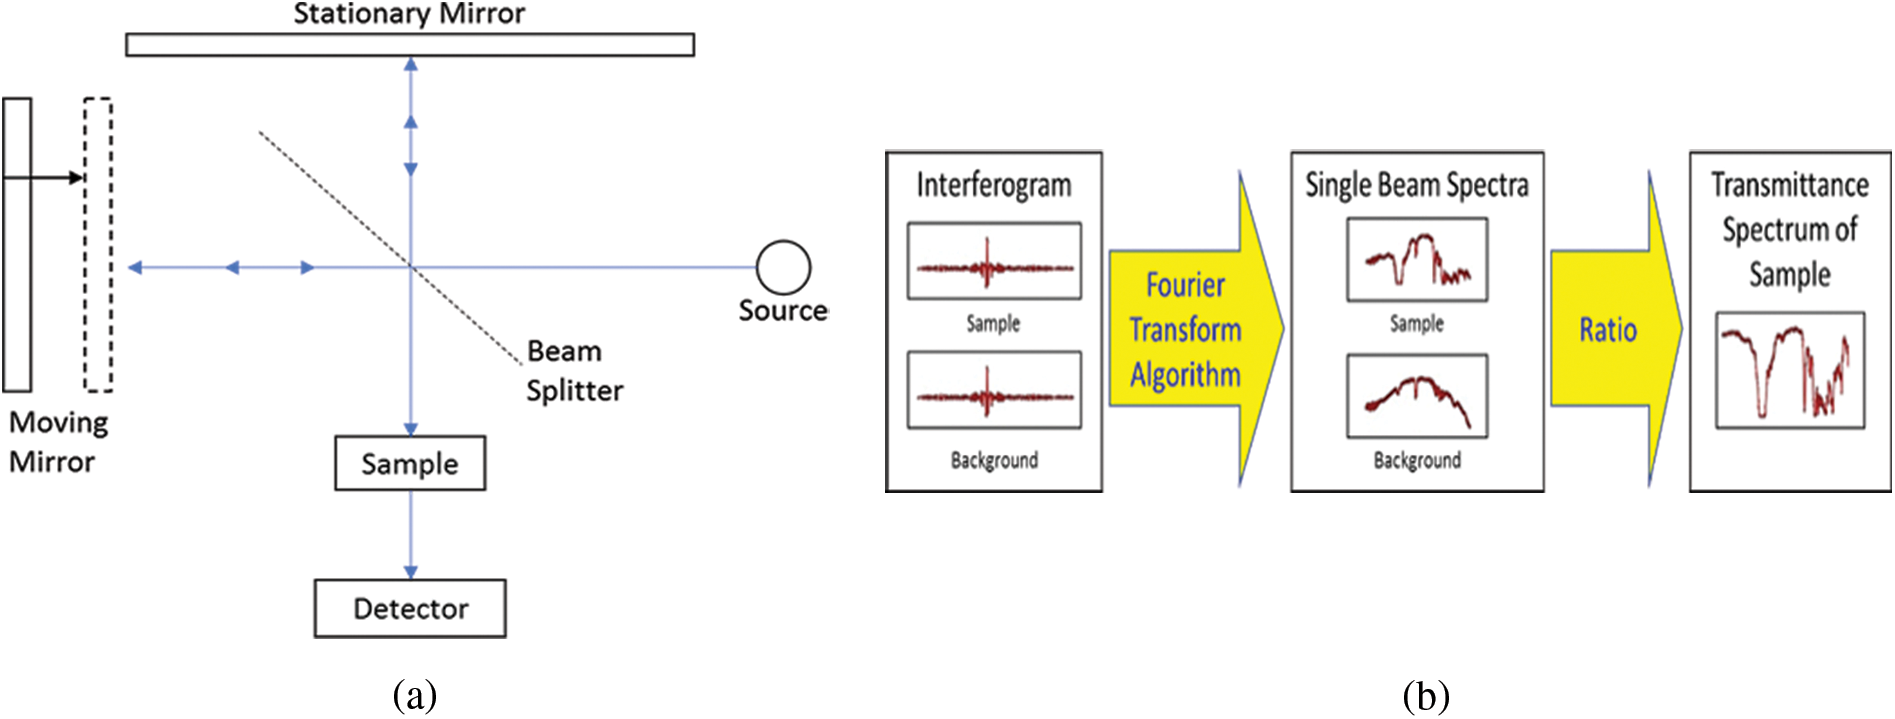
Figure 1: (a) Schematic of a Michelson interferometer showing the internal working of FTIR. (b) Principle of a FTIR Spectroscopy and transformation of the spectrum samples
Principal component analysis (PCA) is a traditional statistical method for changing the characteristics of a dataset into an uncorrelated collection of points known as principal components. Chemometrics approaches are founded on statistical transformation techniques such as PCA, which are used to change the characteristics of a dataset into an uncorrelated collection known as principal components. The concept is that by removing some principal components (PCs), the data may be reduced to a lower number of dimensions with minimal information loss. Each PC is a linear combination of the original inputs, and each PC is orthogonal, therefore collinearity isn’t an issue. The most extensively used chemometric classification approach is Soft Independent Modeling of Class Analogy (SIMCA). SIMCA builds a distinct PCA model for each set of data in both classes in binary classification; in prediction, the test sample’s distance to either model is determined. The test sample is then put through statistical testing to see if it belongs to one of the two classes [36]. Aside from that, the chemometric method known as Partial Least Squares (PLS) is commonly employed for quantitative analysis. When doing multivariate regression, PLS reduces data via PCA (using concentration information to produce PC scores) before using linear regression to the PC scores. The examination of method linearity was carried out in PLS calibration models to demonstrate a proportionate connection between absorbance and adulterated concentrations of the samples. Some characteristics, such as the regression coefficient (R2), root mean standard error of estimation (RMSEE), and root mean standard error of prediction (RMSEP), were analyzed in order to select the optimum calibration model (RMSEP). The PLS techniques were utilized to calculate the FTIR spectra filters, which included normal and other spectra filters such as its derivatives, multiplicative signal correction (MSC), and standard normal variate (SNV), among others.
The experiment design flow starts with preparing meat samples, then analyzing the samples using spectroscopic techniques, followed by chemometrics and multivariate analysis. All meat samples were obtained from a local slaughterhouse in Seri Iskander’s meat market (pasar) and rinsed in distilled water. After that, the meat was sliced into small elements (1 cm × 1 cm), the slices are then stored at −20°C.
According to Che Man et al., lard and other animal body fats from meat, such as chicken fat, beef fat, and mutton fat, were extracted from the flesh by rendering the fatty tissues in the meat processing process with slight variation. All of the substances used in this experiment were of the highest analytical quality. Spectroscopy was then used to examine the pure lipids. The purified samples are made from the pure fats obtained after the extraction operation, as shown in Fig. 2.
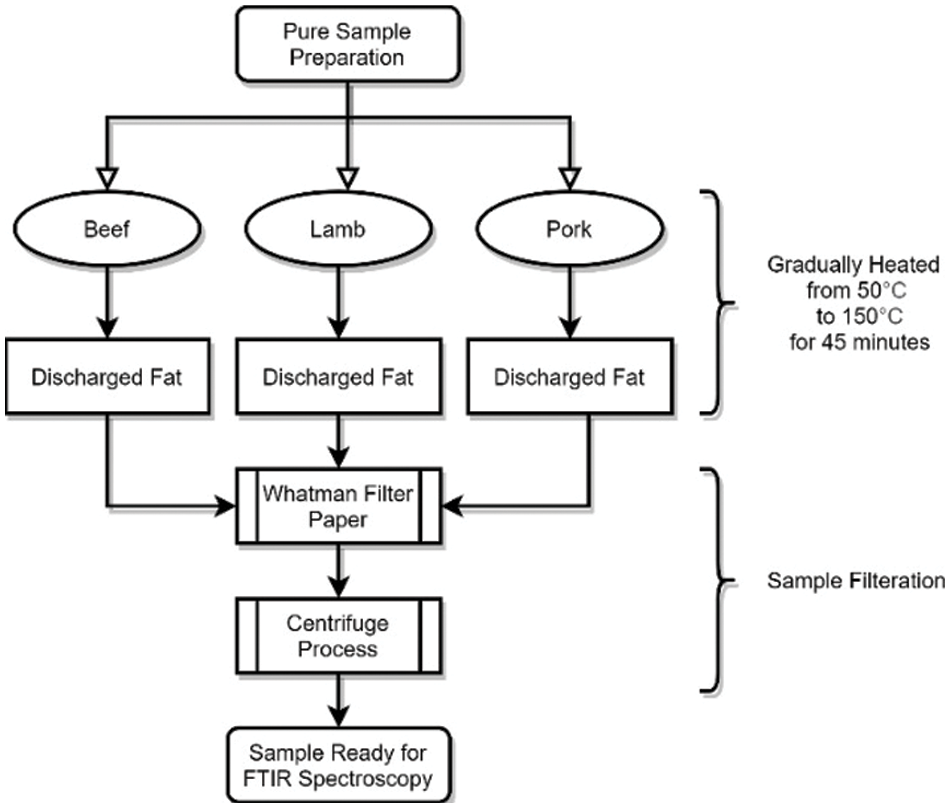
Figure 2: Fat extraction procedure for the samples collected using simple fat extracting method
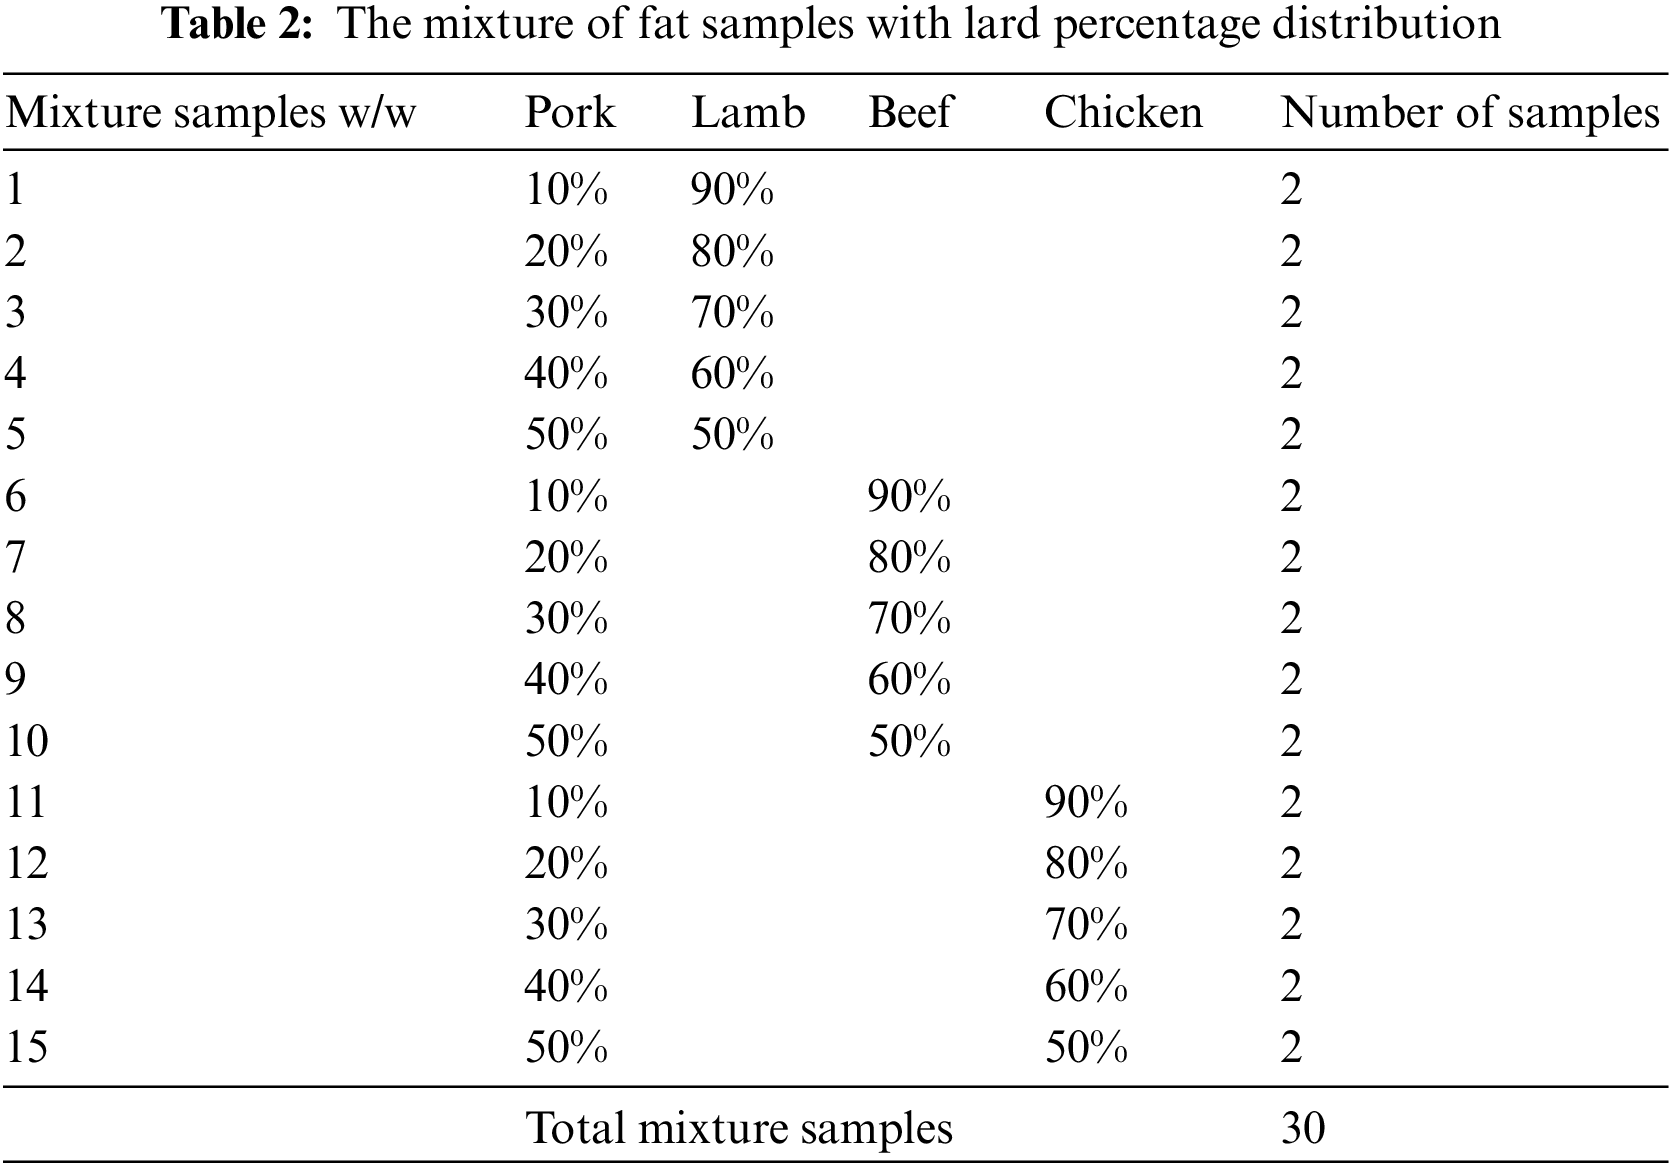
Lamb, beef, and chicken body fats were blended with lard to produce a set of 10 pure samples and 30 samples with 10–50 percent weight-weight ratio of lard in the lamb, beef, and chicken samples. This method follows Rohman et al.
Two programs were used to post-process the data: Spectrograph 1.1 and MATLAB R2017b. Spectrograph 1.1 was used to extract information from the spectrum, and the data was pre-processed as needed. The findings of the pre-processing were further analyzed using MATLAB R2017b. The quality of lard adulteration was assessed using Principal Components Analysis (PCA), whereas the amount of lard adulteration was assessed using Partial Least Square (PLS). The instrument used in this study is from Frontier FT-IR by PerkinElmer. The adulterated samples and their percentage composition is shown in Table 2.
The FTIR Spectra of pure fats are shown in Fig. 3. Each of these spectra is separated into four regions: the first covers the range from 4000 to 2500 cm−1, the second covers the range from 2500 to 2000 cm−1, the third covers the range from 2000 to 1500 cm−1, and the fourth covers the range between 1500 and 800 cm−1. Initially, we have values of transmittance of each sample. Then, by taking the reciprocal transmittance, we get the absorbance of the material at different wavelengths. The table shows ten samples of lamb, chicken, and beef with a predetermined proportion of lard combination.
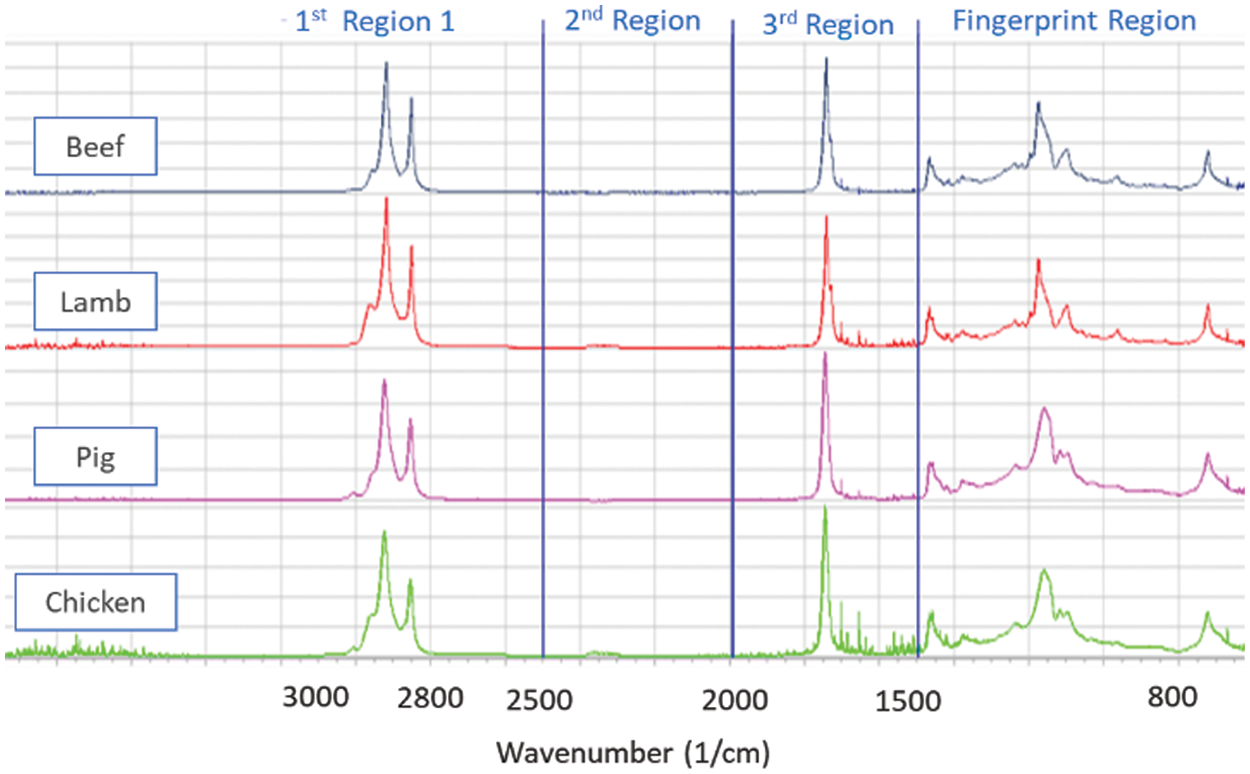
Figure 3: Beef, lamb, pig, and chicken, a spectrogram from FTIR encompassing 3500–650 cm−1 represents fingerprint and functional group areas for each of the four species for pure samples
With the wavelength spectrum starting from 4000–650 cm−1, we get each sample’s absorbance value. Our primary dataset consists of all the beef, chicken, lamb, and pork values, as shown in Fig. 3. Three regions are identified along with fingerprint region in the spectrum. 2nd region (2500–2000 cm−1) is omitted out of analyses due to its unchanging absorbance value for all the species. For classification purposes, we have detached the dataset into four different data sets, as we have only one meat in the category of haram (Lard). In contrast, all three meats lie in the variety of halal classification (Chicken, lamb and beef). The FTIR Spectra from all samples are represented by the absorbance value; in the fingerprint area, all models have different patterns of peaks and shoulders. In both spectra, the absorption of individual peaks is somewhat different, hence the chosen fingerprint region differs slightly. In contrast to pork, the difference in absorbance is indicated individually for beef, chicken, and lamb.
The chemometric of principal component analysis was used to classify the pure pork meat as well as other beef, chicken, and lamb samples. PCA’s wavenumber regions were also improved. Finally, because of their capacity to offer adequate separation among the analyzed samples, the same wavenumbers employed for quantitative analysis, ranges between 4000–650 cm−1, were chosen for PCA modeling. The classification was performed using SIMCA with PLS and SIMCA with PCA. Due to the presence of zeros in our data set, we performed baseline correction to make zeros attain positive values. Cross-validation is done before PCA classification; along with this, we have done grouping based on scores plot.
PCA method divided the problem into four principal components. Component PC-1 holds an 83% score while 11% score is kept by PC-2, as shown in Fig. 8. The distribution of loading values using the PCA method shown in Fig. 4 separates samples of Lamb (L1-L10), Chicken (C1-C10), and Pork (P1-P10); however, the score plots of Beef (B1-B4) and Beef (B5-B10) scatters along the line, while chicken sample score is far away from pork and below the zero scores of PC-2.
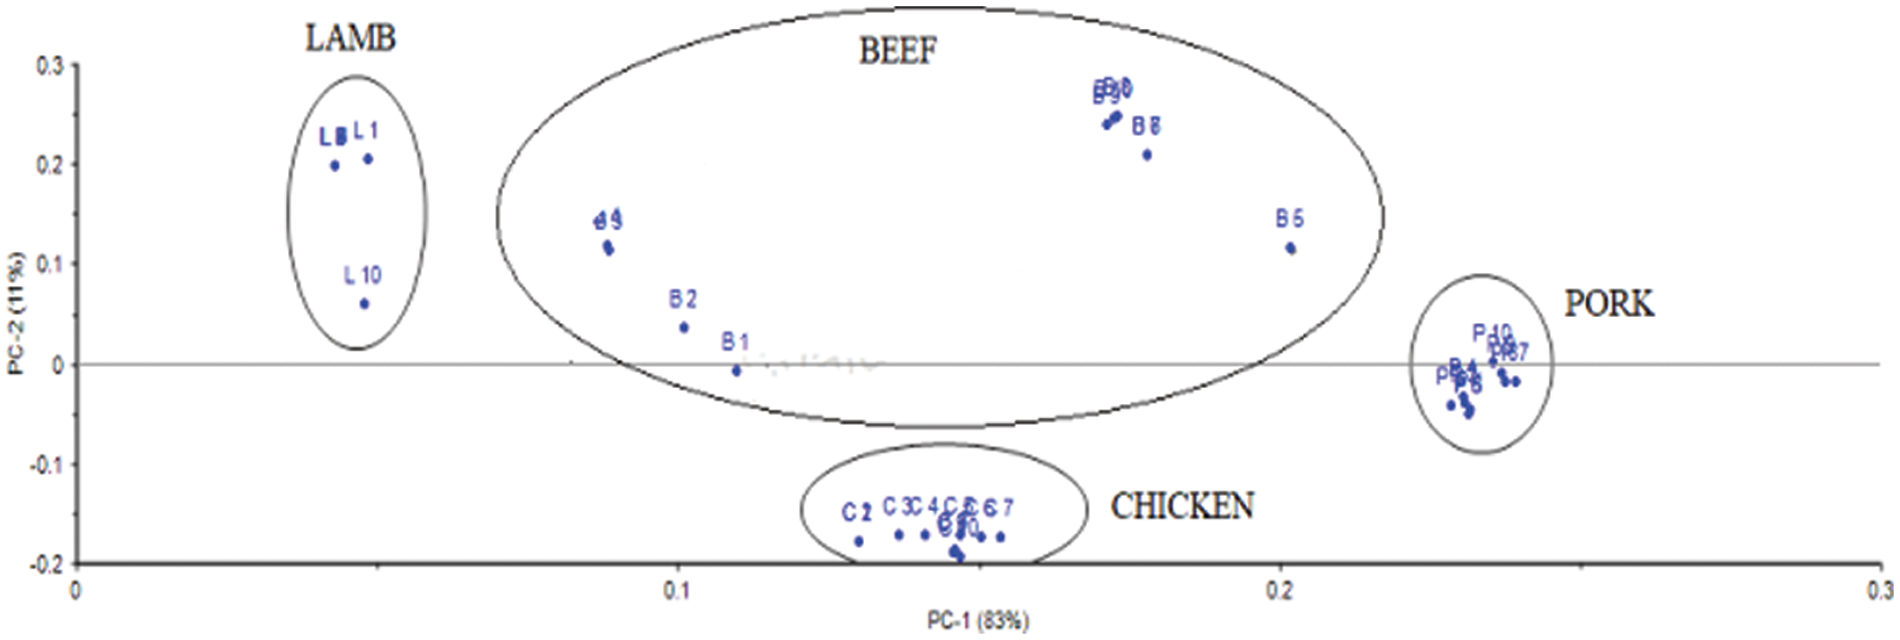
Figure 4: Distribution of values of loadings using PCA classification method
Meanwhile, the lamb and chicken samples distinguish by separating the total pieces below and above the score line. In contrast, only pure pork samples are concentrated on the zero scores’ line axis. Moreover, the variable contribution plot shown in Fig. 5 indicates the beef and chicken samples contribution along with pork variables, whereas only lamb is a highly correlated feature which stipulates the similarity of pork and lamb variables as presented in Fig. 5.
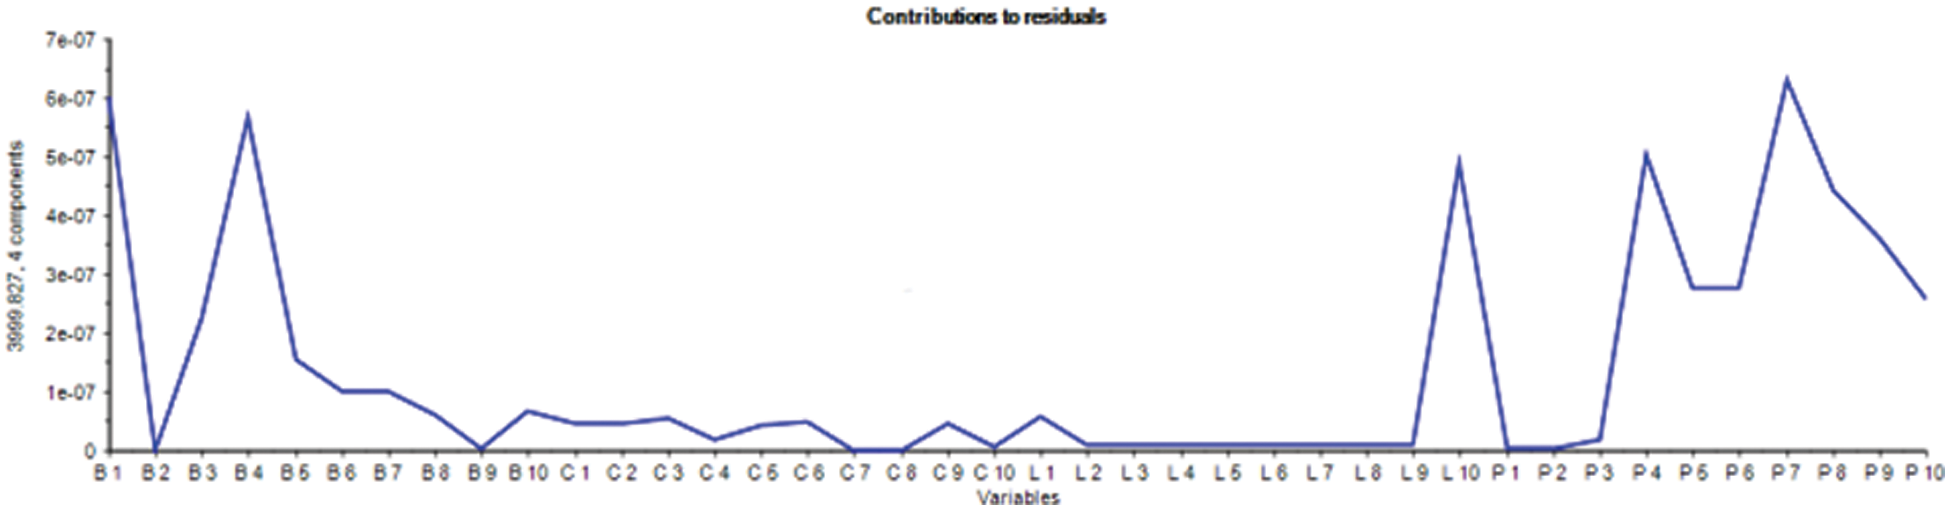
Figure 5: Variable contribution to model using PCA classification method
3.2 PCA Results at 1st Region (3000–2500 cm −1), 3rd Region (2000–1500 cm −1) and Fingerprint Region (1500–800 cm −1)
PCA results at 1st region indicate that some of the chicken and pork samples are clustered together, even though there is still overlap between specimens of different species as presented in Fig. 6.
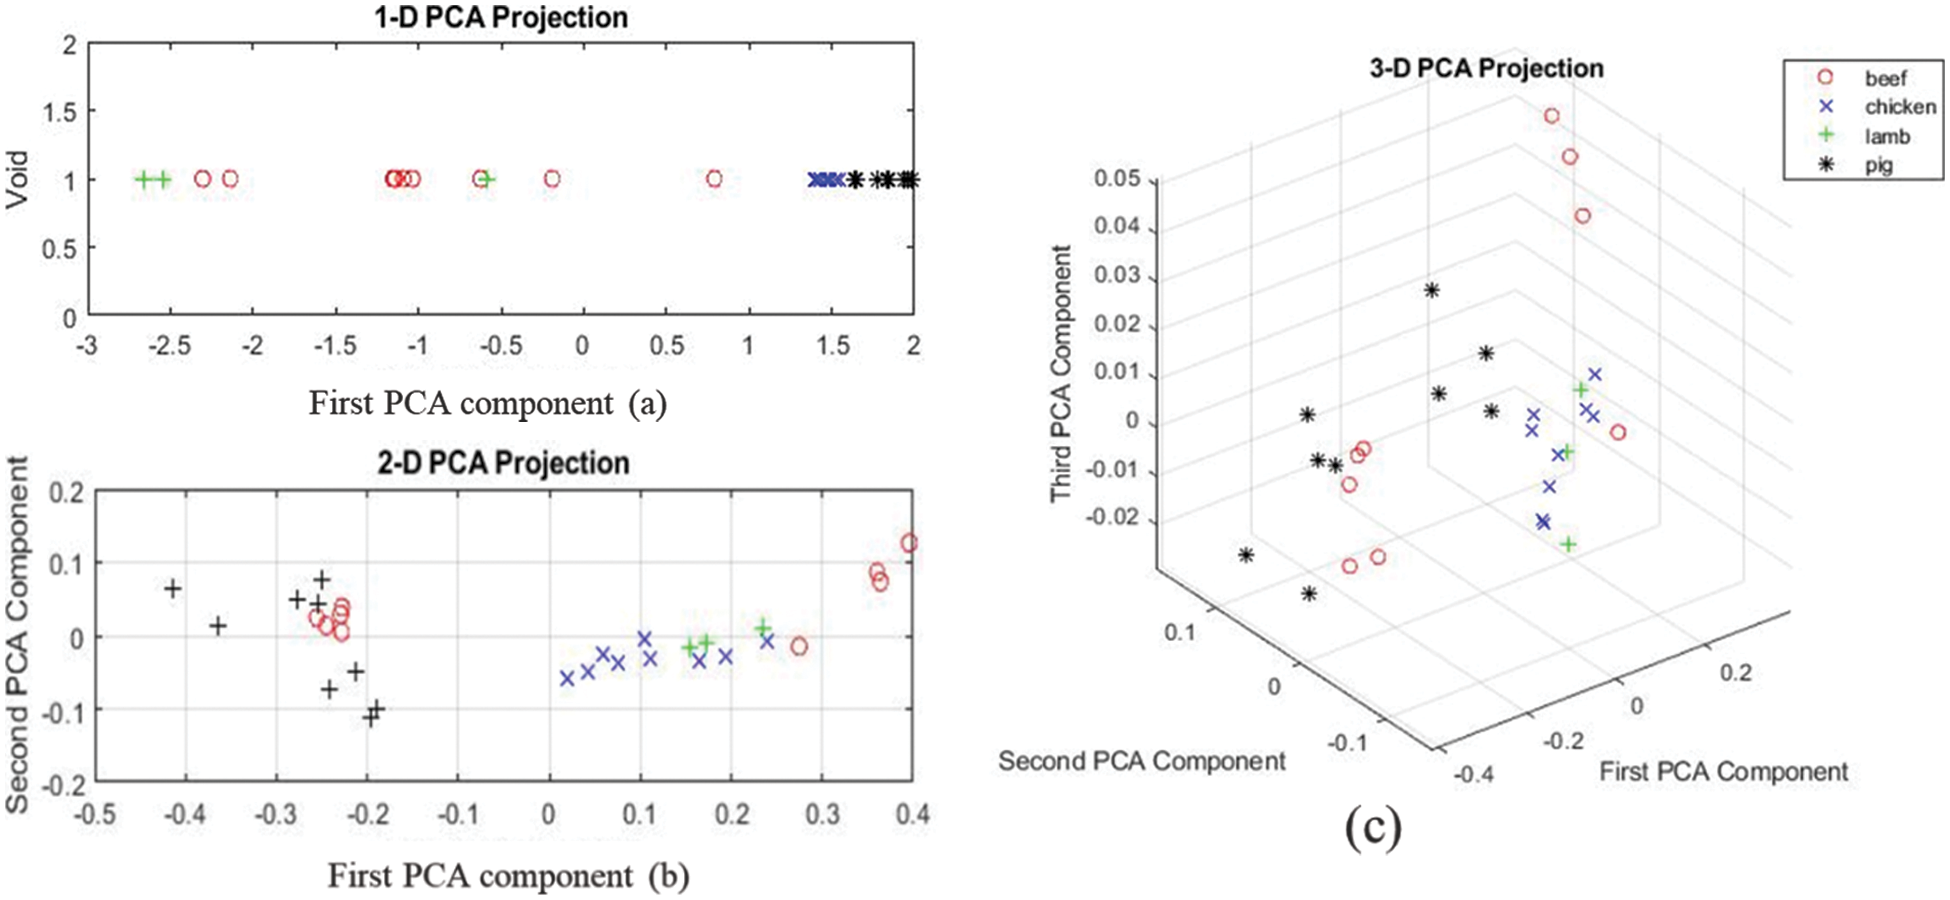
Figure 6: (a–c) One, two, and three-dimension projection for the first region of the spectrum for all the samples
PCA results at the 3rd region show that chicken and pork samples clustered together without overlap, lamb samples have one outlier. However, the beef samples proved challenging since the results are still scattered. The three-dimension PCA shows better results, though with all-beef samples lined around the first PCA component as shown in Fig. 7.
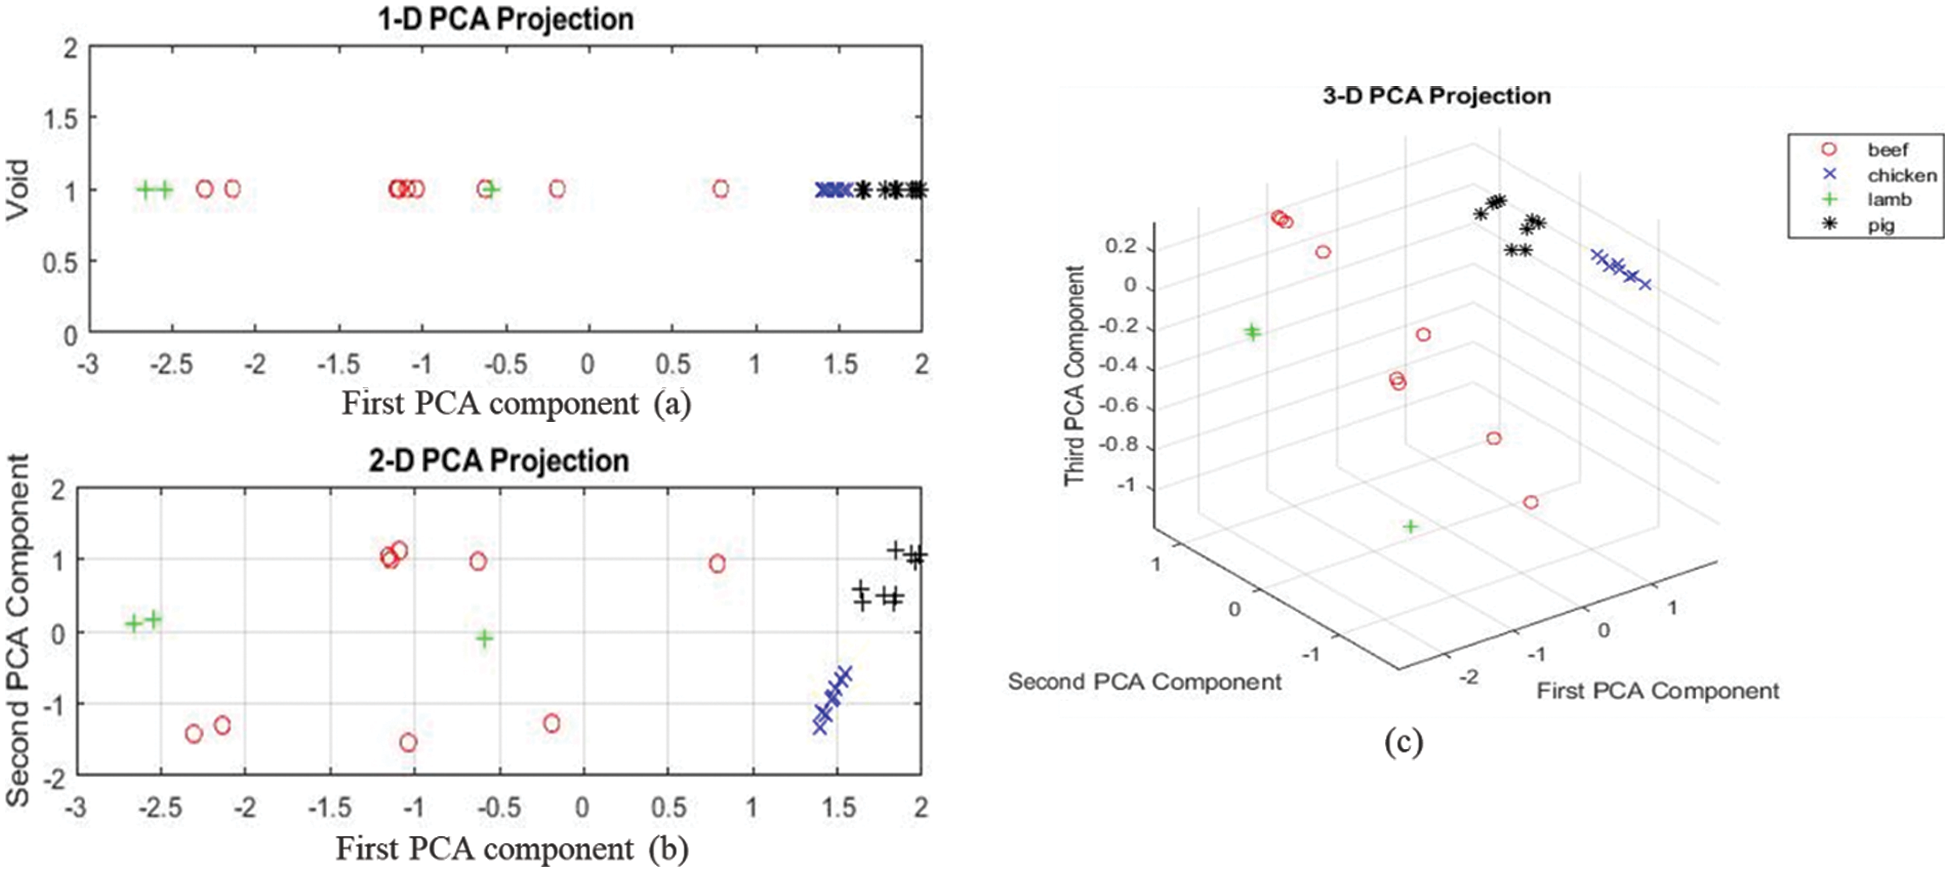
Figure 7: (a–c) showing the three-dimensional projection of the first, second and third principal components for all the samples for mid-region
As the fingerprint region, PCA results show that chicken and pork samples clustered together without overlap. Lamb samples have one outlier, but the beef samples are scattered as shown in Fig. 8. This region is the most significant region as all the samples are separated without overlapping the PCA mapping.
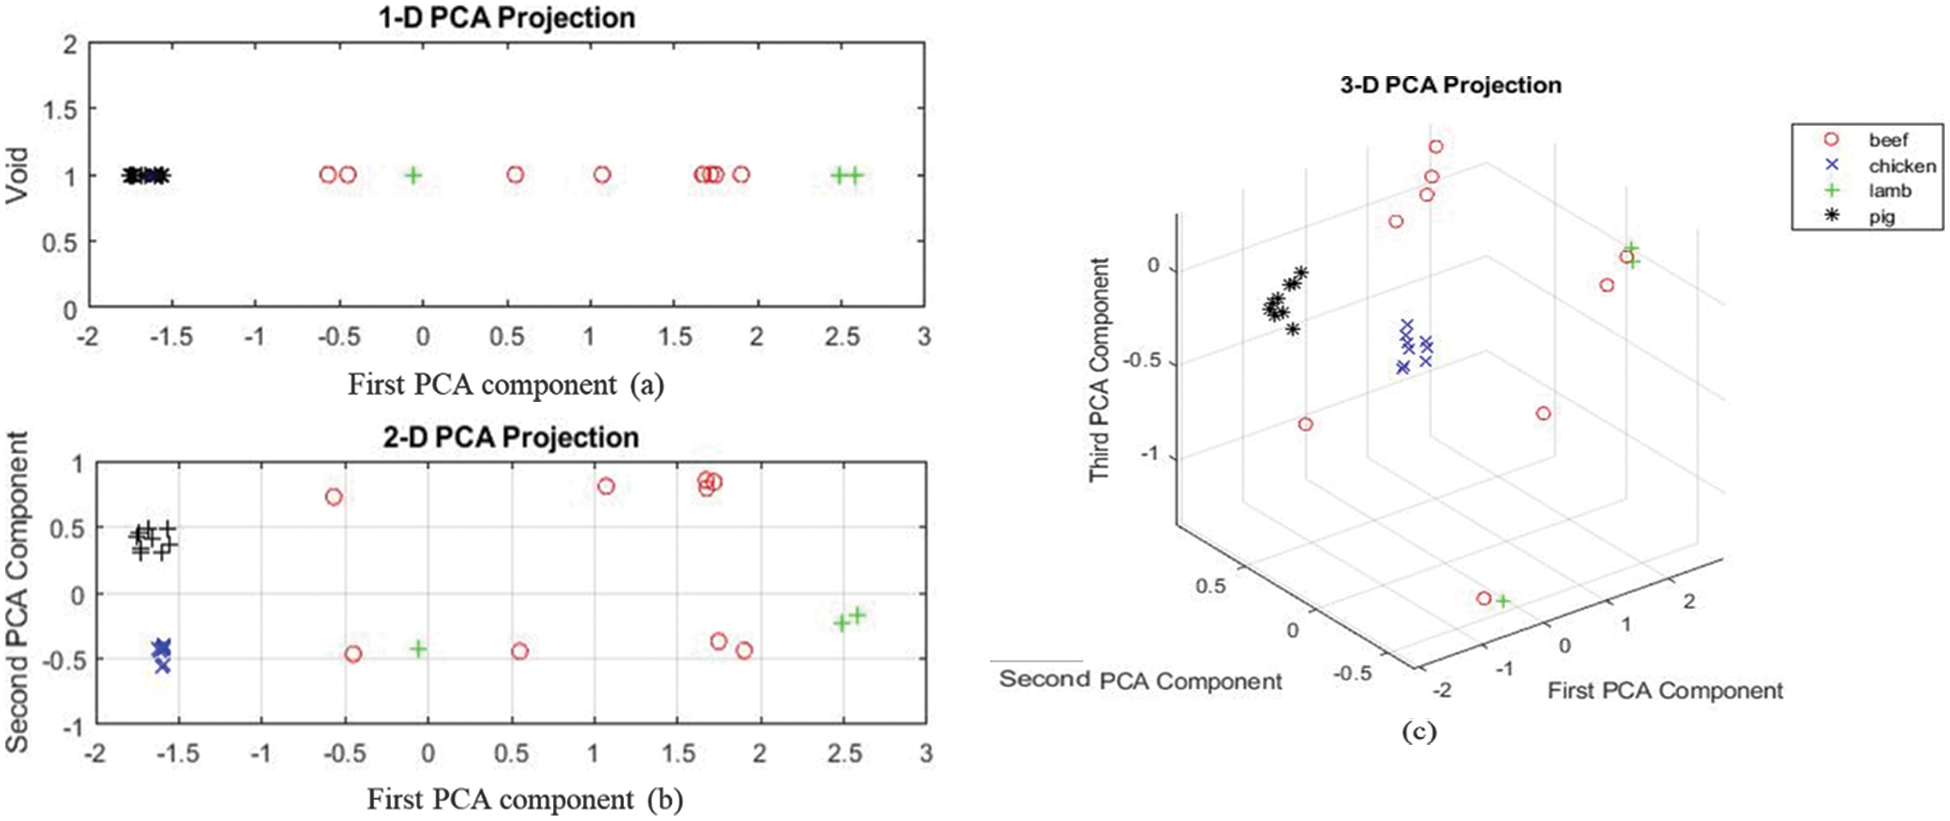
Figure 8: (a–c) shows one-two- and three-dimension projection for the last region of the spectrum for all the sample
It is shown in this research that lard can be distinguished from other types of fats such as cow, chicken, and lamb fats in meat mixes. With the use of Principal Component Analysis (PCA) and Partial Least Square (PLS), it has been shown that lard fat has distinct peaks at wavenumbers 1159.6, 1743.4, 2853.1, and 2922.5 cm−1, but the other fats do not exhibit any rise at these wavenumbers. The fingerprint region and 1st region are the most useful regions for identification of lard, whereas 2nd region provides no information for differentiation as confirmed by PCA analysis. In addition, lard showed shoulder peaks in the wavenumber range of 2950–2990 cm−1, whereas cow and lamb fats showed a fast increase, and chicken fats showed double peaks. The coefficient of determination (R2) for the calibration model is 0.846, with an accuracy percentage of 84.6 percent error prediction and an accuracy percentage of 84.6 percent error prediction. Developing this quick and easy chemometric model for authenticity and determination of lard in meat samples could lead to the better understanding of the material in the consumer market and can save time and cost.
Funding Statement: This work was a part of research collaboration between the Institute of Transport Infrastructure, Universiti Teknologi PETRONAS and College of Engineering, Al Ain University, UAE. This research was funded by the ADEK Award for Research Excellence (AARE19-245) 2019.
Conflicts of Interest: The authors declare that they have no conflicts of interest to report regarding the present study.
References
1. J. Spink and D. C. Moyer, “Defining the public health threat of food fraud,” Journal of Food Science, vol. 76, no. 9, pp. 157–163, 2011. [Google Scholar]
2. T. Guardian, “Allergic teenager’s death after eating kebab was accidental, rules coroner,” The Guardian, 2017. [Online]. Available: https://www.theguardian.com/uk-news/2017/jun/16/teenager-with-dairy-allergy-died-accidentally-rules-coroner [Google Scholar]
3. D. K. Li, “Toddler allergic to dairy dies after pre-school serves him grilled cheese,” in New York Post, 2017. [Google Scholar]
4. T. Barlass, “Child aged 10 dies after drinking coconut drink as importer admits label charges,” in The Sydney Morning Herald, 2015. [Online]. Available: https://www.smh.com.au/healthcare/child-aged-10-dies-after-drinking-coconut-milk-as-importer-admits-label-charges-20150925-gjvakb.html [Google Scholar]
5. F. S. Agency, Timeline on horse meat issue. 2018. [Online]. Available: http://webarchive.nationalarchives.gov.uk/20150403184406/http://www.food.gov.uk/enforcement/monitoring/horse-meat/timeline-horsemeat [Google Scholar]
6. A. Rohman and Y. B. Che Man, “Analysis of Pig derivatives for halal authentication studies,” Food Reviews International, vol. 28, no. 1, pp. 97–112, 2012. [Google Scholar]
7. S. Tähkäpää, R. Maijala, H. Korkeala and M. Nevas, “Patterns of food frauds and adulterations reported in the EU rapid alert system for food and feed and in Finland,” Food Control, vol. 47, no. 10, pp. 175–184, 2015. [Google Scholar]
8. H. Gremaud, S. Karlen and K. Hulliger, “Analytical methods for the authentication of meat and meat products: Recent developments,” Mitteilungen aus Lebensmitteluntersuchung und Hygiene, vol. 93, no. 5, pp. 481–501, 2002. [Google Scholar]
9. N. Guan, Q. Fan, J. Ding, Y. Zhao, J. Lu et al., “Melamine-Contaminated powdered formula and urolithiasis in young children,” New England Journal of Medicine, vol. 360, no. 11, pp. 1067–1074, 2009. [Google Scholar] [PubMed]
10. C. Jia and D. Jukes, “The national food safety control system of China, a systematic review,” Food Control, vol. 32, no. 1, pp. 236–245, 2013. [Google Scholar]
11. I. Abaitua Borda, R. M. Philen, M. Posada de la Paz, A. Gomez de la Camara, M. Diez Ruiz-Navarro et al., “Toxic oil syndrome mortality: The first 13 years,” International Journal of Epidemiology, vol. 27, no. 6, pp. 1057–1063, 1998. [Google Scholar] [PubMed]
12. J. M. Regenstein, M. M. Chaudry and C. E. Regenstein, “The Kosher and Halal food laws,” Comprehensive Reviews in Food Science and Food Safety, vol. 2, no. 3, pp. 111–127, 2003. [Google Scholar] [PubMed]
13. L. -O. Chuah, X. B. He, M. E. Effarizah, Z. A. Syahariza, A. K. Shamila-Syuhada et al., “Mislabelling of beef and poultry products sold in Malaysia,” Food Control, vol. 62, no. 10, pp. 157–164, 2016. [Google Scholar]
14. T. Reuters, An inclusive ethical economy, “State of the global islamic economy report,” 2019. [Online]. Available: https://www.thomsonreuters.com/en.html [Google Scholar]
15. J. Barnett, F. Begen, S. Howes, A. Regan, A. McConnon et al., “Consumers’ confidence, reflections and response strategies following the horsemeat incident,” Food Control, vol. 59, no. 4, pp. 721–730, 2016. [Google Scholar]
16. M. Schmutzler, A. Beganovic, G. Böhler and C. W. Huck, “Methods for detection of pork adulteration in veal product based on FT-NIR spectroscopy for laboratory, industrial and on-site analysis,” Food Control, vol. 57, no. 8, pp. 258–267, 2015. [Google Scholar]
17. A. Vlachos, I. S. Arvanitoyannis and P. Tserkezou, “An updated review of meat authenticity methods and applications,” Critical Reviews in Food Science and Nutrition, vol. 56, no. 7, pp. 1061–1096, 2016. [Google Scholar] [PubMed]
18. G. P. Danezis, A. S. Tsagkaris, F. Camin, V. Brusic and C. A. Georgiou, “Food authentication: Techniques, trends & emerging approaches,” TrAC Trends in Analytical Chemistry, vol. 85, no. 2, pp. 123–132, 2016. [Google Scholar]
19. E. Kurniawati, A. Rohman and K. Triyana, “Analysis of lard in meatball broth using Fourier transform infrared spectroscopy and chemometrics,” Meat Science, vol. 96, no. 1, pp. 94–98, 2014. [Google Scholar] [PubMed]
20. O. G. Meza-Márquez, T. Gallardo-Velázquez and G. Osorio-Revilla, “Application of mid-infrared spectroscopy with multivariate analysis and soft independent modeling of class analogies (SIMCA) for the detection of adulterants in minced beef,” Meat Science, vol. 86, no. 2, pp. 511–519, 2010. [Google Scholar]
21. H. Rahmania, Sudjadi and A. Rohman, “The employment of FTIR spectroscopy in combination with chemometrics for analysis of rat meat in meatball formulation,” Meat Science, vol. 100, pp. 301–305, 2015. [Google Scholar] [PubMed]
22. A. Rohman, Y. B. Che Man, P. Hashim and A. Ismail, “FTIR spectroscopy combined with chemometrics for analysis of lard adulteration in some vegetable oils Espectroscopia FTIR combinada con quimiometría para el análisis de adulteración con grasa de cerdo de aceites vegetales,” CyTA-Journal of Food, vol. 9, no. 2, pp. 96–101, 2011. [Google Scholar]
23. A. Rohman and Y. B. Che Man, “FTIR spectroscopy combined with chemometrics for analysis of lard in the mixtures with body fats of lamb, cow and chicke,” International Food Research Journal, vol. 17, pp. 519–527, 2010. [Google Scholar]
24. W. S. Suparman, E. Sundhani and S. D. Saputri, “The use of Fourier transform infrared spectroscopy (FTIR) and gas chromatography mass spectroscopy (GCMS) for Halal authentication in imported chocolate with various variants,” Analysis, vol. 2, pp. 03, 2015. [Google Scholar]
25. L. Xu, C. B. Cai, H. F. Cui, Z. H. Ye and X. P. Yu, “Rapid discrimination of pork in Halal and non-Halal Chinese ham sausages by Fourier transform infrared (FTIR) spectroscopy and chemometrics,” Meat Science, vol. 92, no. 4, pp. 506–510, 2012. [Google Scholar] [PubMed]
26. H. Yang, J. Irudayaraj and M. M. Paradkar, “Discriminant analysis of edible oils and fats by FTIR, FT-NIR and FT-Raman spectroscopy,” Food Chemistry, vol. 93, no. 1, pp. 25–32, 2005. [Google Scholar]
27. Y. B. Che Man, Z. A. Syahariza, M. E. S. Mirghani, S. Jinap and J. Bakar, “Analysis of potential lard adulteration in chocolate and chocolate products using Fourier transform infrared spectroscopy,” Food Chemistry, vol. 90, no. 4, pp. 815–819, 2005. [Google Scholar]
28. I. J. Alfar, K. Aida, R. Akmeliawati and J. Irwandi, “Towards authentication of beef, chicken and lard using micro near-infrared spectrometer based on support vector machine classification,” ARPN Journal of Engineering and Applied Sciences, vol. 11, pp. 4130–4136, 2016. [Google Scholar]
29. C. Alamprese, J. M. Amigo, E. Casiraghi and S. B. Engelsen, “Identification and quantification of turkey meat adulteration in fresh, frozen-thawed and cooked minced beef by FT-NIR spectroscopy and chemometrics,” Meat Science, vol. 121, no. 3, pp. 175–181, 2016. [Google Scholar] [PubMed]
30. D. F. Barbin, D. -W. Sun and C. Su, “NIR hyperspectral imaging as non-destructive evaluation tool for the recognition of fresh and frozen-thawed porcine longissimus dorsi muscles,” Innovative Food Science & Emerging Technologies, vol. 18, no. 2, pp. 226–236, 2013. [Google Scholar]
31. N. Morsy and D. -W. Sun, “Robust linear and non-linear models of NIR spectroscopy for detection and quantification of adulterants in fresh and frozen-thawed minced beef,” Meat Science, vol. 93, no. 2, pp. 292–302, 2013. [Google Scholar] [PubMed]
32. N. N. Ahmad Nizar, J. M. Nazrim Marikkar and D. M. Hashim, “Differentiation of lard, chicken fat, beef fat and mutton fat by GCMS and EA-IRMS techniques,” Journal of Oleo Science, vol. 62, no. 7, pp. 459–464, 2013. [Google Scholar] [PubMed]
33. J. M. N. Marikkar, H. M. Ghazali, Y. B. Che Man, T. S. G. Peiris and O. M. Lai, “Distinguishing lard from other animal fats in admixtures of some vegetable oils using liquid chromatographic data coupled with multivariate data analysis,” Food Chemistry, vol. 91, no. 1, pp. 5–14, 2005. [Google Scholar]
34. D. A. Burns and E. W. Ciurczak, Handbook of Near-Infrared Analysis, 3rd ed., Japan: Taylor & Francis, pp. 151–207, 2007. [Google Scholar]
35. P. Y. Bruice, Organic Chemistry, 8th ed., US: PEARSON, pp. 550–630, 2017. [Google Scholar]
36. J. Penn, Spectroscopy: Advanced Concepts, 1st ed., US: NY Research Press, pp. 80–96, 2015. [Google Scholar]
37. M. Tasumi and A. Sakamoto, Introduction to Experimental Infrared Spectroscopy: Fundamentals and Practical Methods, 1st ed., Japan: John Wiley & Sons, 2014. [Google Scholar]
38. J. Penn, Spectroscopy: Modern Concepts, 1st ed., US: NY Research Press, 2015. [Google Scholar]
Appendix:
A. Principal Component Analysis
A statistical approach for reducing observations with numerous dimensions. This method converts a dataset’s dimensions into a new collection of uncorrelated dimensions called principal components (PCs). For example, a dataset array qij is first normalized using the equation below.
where Xij is the element of our new matrix, qij is the array element data corresponding to the ith measurement variable j,
or
The rjj value is a standard covariance between −1 and 1. This matrix is symmetric in the case of actual variables, and the elements along the main diagonal of the correlation matrix correspond to the variance of the variable qj. Because R is symmetric, its eigenvalues are positive and orthogonal.
This method produces two sets of data: eigenvectors V, vectors made up of a new base that represents the direction and sense in which the initial dataset tends to change, and eigenvalue K, which represents the weight or importance of each of the eigenvector's principles. The eigenvalues are shown in matrix K.
Each λi in the K matrix represents the weight of each set of eigenvectors. The principal components that explain the greatest amount of dataset can be determined with these eigenvalues.
where S is the Score matrices, V the eigenvectors, and Q the original array data. The matrices S, Score, now reflect the data, with each column representing the starting data, Q, projected onto an eigenvector. This base change will significantly reduce the information in which the data is analyzed [37]. One of the advantages of using the principal component approach in calibrating NIR spectrums is that there is no need to perform a wavelength search.
B. Partial Least Square Regression
PLS regression is a multivariate modeling technique created from iterative fitting bilinear models in blocks of variables. This approach is used in multivariate calibration to get insight and predictability. The following equations express the PLS regression concept:
where
One of the advantages of using PLS in analyzing noisy spectra is that PLS calibration is corrected by using the concentration information [38].
Cite This Article
 Copyright © 2023 The Author(s). Published by Tech Science Press.
This work is licensed under a Creative Commons Attribution 4.0 International License , which permits unrestricted use, distribution, and reproduction in any medium, provided the original work is properly cited.
 Downloads
 Citation Tools