
 Submit a Paper
 Propose a Special lssue
 Open Access
ARTICLE

COVID-19 Classification from X-Ray Images: An Approach to Implement Federated Learning on Decentralized Dataset
1 Department of Telecommunication Engineering, Sir Syed University of Engineering & Technology, Karachi, 75300, Pakistan
2 Department of Information Technology, College of Computer and Information Sciences, Princess Nourah bint Abdulrahman University, P.O. Box 84428, Riyadh, 11671, Saudi Arabia
3 Security Engineering Lab, Computer Science Department, Prince Sultan University, Riyadh, 11586, Saudi Arabia
4 Department of Electronics and Electrical Communications Engineering, Faculty of Electronic Engineering, Menoufia University, Menouf, 32952, Egypt
* Corresponding Author: Naglaa F. Soliman. Email:
Computers, Materials & Continua 2023, 75(2), 3883-3901. https://doi.org/10.32604/cmc.2023.037413
Received 03 November 2022; Accepted 08 February 2023; Issue published 31 March 2023
 View Full Text
 Download PDF
Abstract
The COVID-19 pandemic has devastated our daily lives, leaving horrific repercussions in its aftermath. Due to its rapid spread, it was quite difficult for medical personnel to diagnose it in such a big quantity. Patients who test positive for Covid-19 are diagnosed via a nasal PCR test. In comparison, polymerase chain reaction (PCR) findings take a few hours to a few days. The PCR test is expensive, although the government may bear expenses in certain places. Furthermore, subsets of the population resist invasive testing like swabs. Therefore, chest X-rays or Computerized Vomography (CT) scans are preferred in most cases, and more importantly, they are non-invasive, inexpensive, and provide a faster response time. Recent advances in Artificial Intelligence (AI), in combination with state-of-the-art methods, have allowed for the diagnosis of COVID-19 using chest x-rays. This article proposes a method for classifying COVID-19 as positive or negative on a decentralized dataset that is based on the Federated learning scheme. In order to build a progressive global COVID-19 classification model, two edge devices are employed to train the model on their respective localized dataset, and a 3-layered custom Convolutional Neural Network (CNN) model is used in the process of training the model, which can be deployed from the server. These two edge devices then communicate their learned parameter and weight to the server, where it aggregates and updates the global model. The proposed model is trained using an image dataset that can be found on Kaggle. There are more than 13,000 X-ray images in Kaggle Database collection, from that collection 9000 images of Normal and COVID-19 positive images are used. Each edge node possesses a different number of images; edge node 1 has 3200 images, while edge node 2 has 5800. There is no association between the datasets of the various nodes that are included in the network. By doing it in this manner, each of the nodes will have access to a separate image collection that has no correlation with each other. The diagnosis of COVID-19 has become considerably more efficient with the installation of the suggested algorithm and dataset, and the findings that we have obtained are quite encouraging.Keywords
During the last three months of 2019, the novel coronavirus known as COVID-19 was first discovered in Wuhan, China. Since then, it has developed into a worldwide problem and has caused people worldwide to alter their way of life [1]. COVID-19 was declared a pandemic by the World Health Organization (WHO) and was named SARS-CoV-2. The virus has spread in more than 200 countries all over the world, and there have been more than 440 million confirmed cases, of which there have been 6.015 million fatalities as of February 2022 [2]. It ranked 2nd most lethal among all documented pandemics; the previous one was the flu pandemic (H1N1) back in 1918 [3]. The genetic material of the COVID-19 virus is ribonucleic acid, and the virus belongs to the coronavirus family (RNA). Because of this, it is a virus composed of a single strand of positive-sense RNA, and it may be recognized in a number of different ways, such as by the detection of viral RNA or antibodies that are generated by the patient’s immune system. On the other hand, the procedure for collecting samples may be somewhat challenging, and RT-PCR detection initially has a poor level of sensitivity.
On the other hand, a chest Computerized Vomography (CT) scan may reveal pneumonia owing to inflammation of the air sacs in the lungs if the patient has it. As a direct consequence of this, early signs of COVID-19 infection become apparent. One of them is ground-glass opacity (GGO). Because CT scans are able to provide a three-dimensional image of the lungs and because the state of pulmonary consolidation only becomes apparent in the latter stages of the disease, CT imaging is the diagnostic method that is used the most often for the COVID-19 diagnosis. After that, the temporal changes and linkages found between the various kinds of CT slices may then be extensively analyzed to provide essential information for the diagnosis of COVID-19 [4]. Both chest X-rays and CT scans are routinely used to diagnose pneumonia. In addition, CT scans are often used as diagnostic screening tools for diseases [5]. This is due to the fact that the denotative properties of COVID-19 are simpler to notice in a 3D picture. Coughing, exhaustion, loss of smell, and fever are major symptoms of the current pandemic. If a person is infected with the COVID-19 virus and already has a chronic health condition, such as diabetes, cardiovascular disease, high blood pressure, or respiratory illness, they are at a much-increased risk for catastrophic consequences, some which may even result in death [6]. Polymerase Chain Reaction (PCR) test is used to detect COVID-19 in a person by analyzing his upper respiratory specimen, but it requires a person’s physical presence to take the specimen; this may be dangerous for the person taking the specimen as well [7]. It is a human-based detection procedure that requires an experienced physician. These methods are outdated and, most importantly, prone to human error, which may result in the misdiagnosis of a certain disease. A common way to diagnose a respiratory illness like COVID-19 is a chest X-ray, it is the most effective tool utilized by healthcare personnel or doctors. Other more advanced diagnostic tools, such as Computed Tomogram (CT) and High-Resolution Computed Tomography (HRCT), are also available, providing better resolution and high precision. These advanced techniques are expensive and time-consuming [8,9].
Recent advances in Artificial Intelligence have enabled researchers in the field of medicine to introduce tools and techniques that help radiologists to overcome human errors [10]. Since the recent COVID-19 pandemic, researchers worldwide have invested a lot of time and resources to find probable ways to diagnose it [11–14]. Many researchers around the globe have introduced numerous approaches to distinguish and differentiate between viral Pneumonia and COVID-19 by using the CT and X-ray image dataset acquired by people who have unfortunately contracted the disease [15,16]. CT and X-ray scans are also investigated to identify the relationship between them. The findings highlighted common characteristics in COVID-19 instances, allowing researchers to use Artificial Intelligence (AI) based algorithms in image processing on chest X-rays and CT scans in COVID-19 patients [17]. The CT scans of infected COVID-19 patients are defined by the presence of characteristic hallmarks such as consolidative opacities, ground-glass opacities, and crazy-paving pattern [18]. To locate ground-glass opacities in CT scans of COVID-19-infected patients convolutional neural network (CNN) architecture are widely utilized [19]. X-ray scans are also used to link illness severity with patients’ sex and age [20]. CNN models like VGG-16, VGG-19, Xception, AlexNet, ResNet50V2, CoroNet, LeNet-5, ResNet-18, and ResNet-50 are the most frequently applied AI models in the literature for evaluating COVID-19 infections based on CT or X-ray images [21–23]. The coupling of machine learning tools with such Meta-Heuristic (MH) optimization techniques is also used for detecting illness [24]. To diagnose COVID-19 infections, a hybrid deep convolutional neural network incorporating metaheuristic optimizers was also widely used. The network is trained using a dataset that includes three different types of X-ray images: normal, pneumonia, and COVID-19, and the contrast-enhancing strategy was also used to process and analyze the images [25]. The two optimizers, grey wolf and particle swarm optimizer, were used to do so. After suitable feature selection using optimizers, they were trained using Support Vector Machine (SVM) [26,27].
Other metaheuristic optimizers include the Henry gas solubility optimizer, slime mold optimizer, whale optimization optimizer, particle swarm optimizer, genetic algorithm, grey wolf optimizer, Harris hawks optimizer, and standalone marine predators optimizer were compared to the results obtained by the proposed approach [28]. Compared to existing methods, the suggested methodology in [28] performed exceptionally well in terms of high detection accuracy and cheap computing cost. For picture segmentation of COVID-19 instances, a hybrid metaheuristic optimizing technique was applied, in which the marine predators’ optimizer was combined with the moth-flame optimizer [29]. Other sophisticated optimizers include the Harris hawk’s optimizer, the grey wolf optimizer, particle swarm optimization, the grasshopper algorithm, the cuckoo search optimizer, and the spherical search optimizer, moth-flame optimizer, and solo marine predator’s optimizer fared worse than the suggested technique [30].
The classification procedure, which is carried out using the k-nearest neighbors’ approach, is aided by identifying key features and rejecting irrelevant features [31]. This approach has been used as a support tool in medical exploratory and decision-making analyses. An early screening strategy was established to map COVID-19 pneumonia compared to other lung-based opacities based on the limited detection of RT-PCR during COVID-19 early phases. This finding was reached using a 3-dimensional image collection and a location-attention classifier model [32,33].
COVID-19 image classification algorithms proposed in the literature have issues that influence classification accuracy. This may be caused due to the technique used to extract the features or the method utilized to decrease the number of chosen features. In order to categorize COVID-19 in an X-ray image, this paper proposes a Federated Learning scheme and uses a 2-layered custom Convolutional Neural Network (CNN) model as a base model that can be transferred or deployed to the edge devices connected to a server. The strategy that has been suggested uses the Custom CNN model to its fullest potential, a type of Deep learning methodology. To compare the outcomes of the proposed model, we have used VGG-16 and ResNet-50 models. Batch normalization and dropout layers in the convolution and fully connected layers are added to minimize overfitting in order to use both transfer learning approach and fine-tuning on the preceding pre-trained models. The dataset for this study was compiled from Kaggle and contains more than 13,000 images in total, including 10,000 images of healthy patients and 3616 X-ray scans for COVID-19. We used 3616 images from the Kaggle COVID-19 image database and added an additional 1384 images through augmentation, for a total of 4500 images. Similar to what we did with Normal images, with the exception that we employed all 4,500 collected from 10,000 images of normal patients without any augmentation. The contribution that this work is said to make is listed below.
• A three-layered CNN model was is introduced to act as the server’s base model.
• Employed Federated Learning scheme to classify decentrilized COVID-19 image dataset, and provinf that it works better than conventional deep learning algotihm.
2 Dataset Used for Training and Testing
The diagnosis of COVID-19 was made using pulmonary (chest) X-ray scans in this research. COVID-19 and normal were the two main classes used to classify the data. A total of 9000 images were used in this study to train and test the proposed model. Out of a total of 9000 images, 6750 are used to train the model, accounting for 75% of the total, and 2250 are used to test the model, accounting for 25% of the total. Because the data in federated learning is decentralized and cannot have any association between the different sets, the dataset has been split into two sets, each of which is completely unique and has no correlation with the other set. A few examples of COVID-19 and Normal images, as well as augmented COVID-19 images, are exhibited in Figs. 1–3, respectively, before being split in two and moved to their corresponding edge nodes. These figures were taken before the images were divided in half. On the gathered dataset, image augmentation was performed by rotating 90 degrees, flipping 180 degrees, and further rotating 270 degrees. The COVID-19 and Normal image dataset distribution are displayed in Table 1, which is used for training, testing, and validation. Table 2 displays the distributed dataset to two separate edge devices and their corresponding test and train data. The reason for selecting different dataset for the two nodes is to display that it is capable of catering different edge nodes with different size of datasets.


Figure 1: Sample image dataset of COVID-19 patients
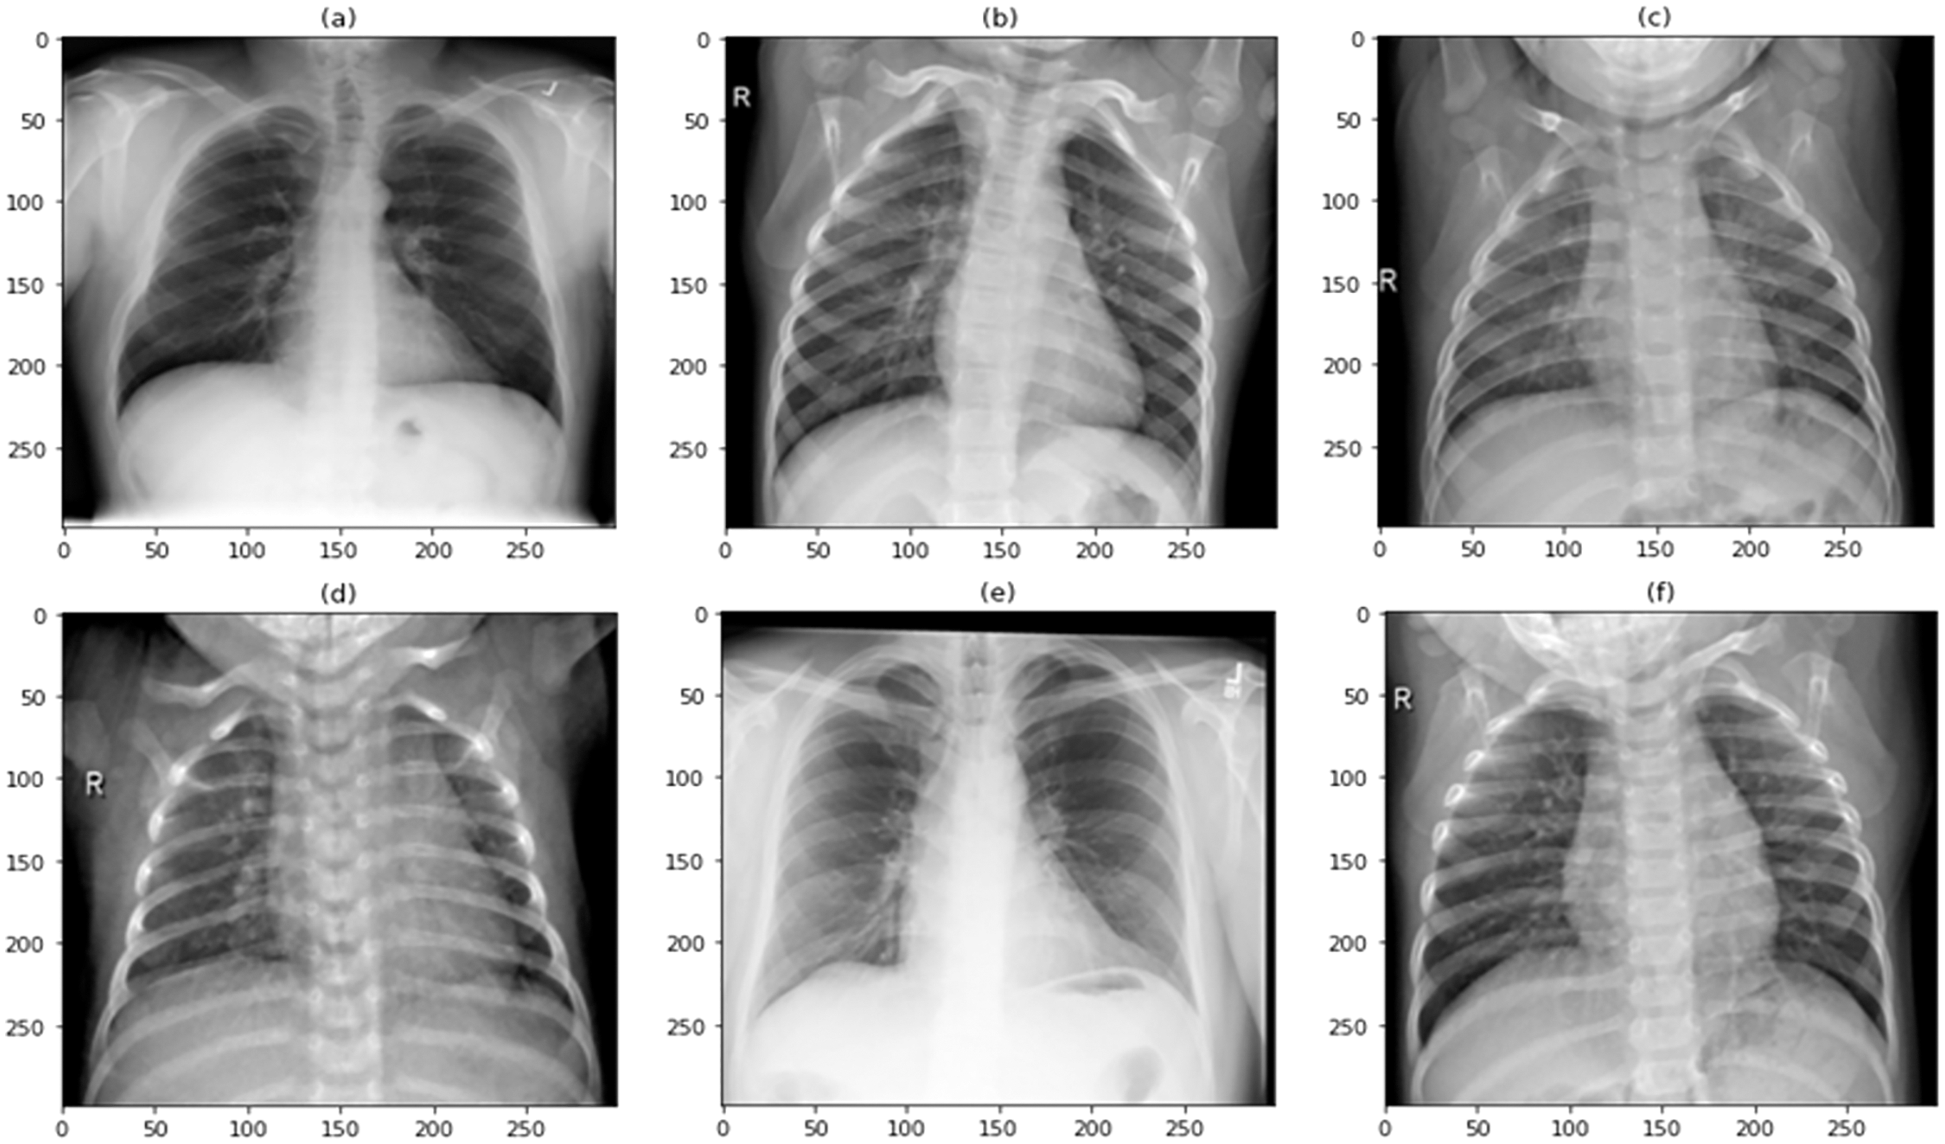
Figure 2: Sample image dataset of normal patients
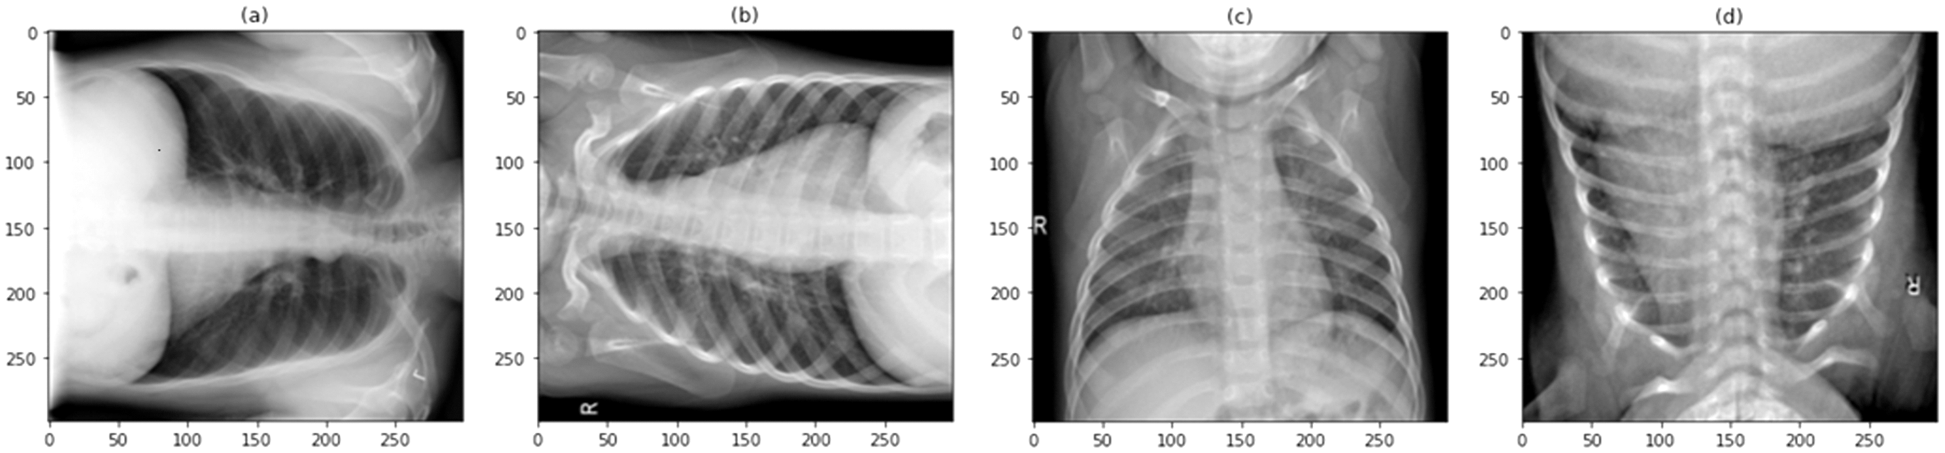
Figure 3: Sample images of the augmented COVID-19 image dataset


3 Transfer Learning Technique and its Components
Fig. 4 depicts the methods used for transfer learning in identifying and classifying COVID-19. The main purpose was to segregate chest X-ray images into two categories: normal and COVID-19. The preprocessing stage, which includes normalization and data augmentation, and the classification stage, which includes the use of transfer learning on pre-trained models and prediction, are the model’s two essential phases. 0 to 1 was employed as the normalized range [34]. In the acquired images, rescaling is conducted, and each pixel is multiplied by a factor of 1/255. The display of intermediate activations in a CNN model during training helps better comprehend the segmentation and feature extraction process, particularly for a dataset of images [35]. The output of a layer, or the outputs of the various pooling and convolution layers, is referred to as activation layers in this context and, in most cases, termed as a feature map. As a result, the goal of displaying the intermediate activations was to show these feature maps in order to better comprehend the process of decomposing an input image into distinct filters learned by the network. These filters reflect several image-based criteria that aid in discovering significant and unique features of the input images. These features are employed by the classifier to accurately predict the output.
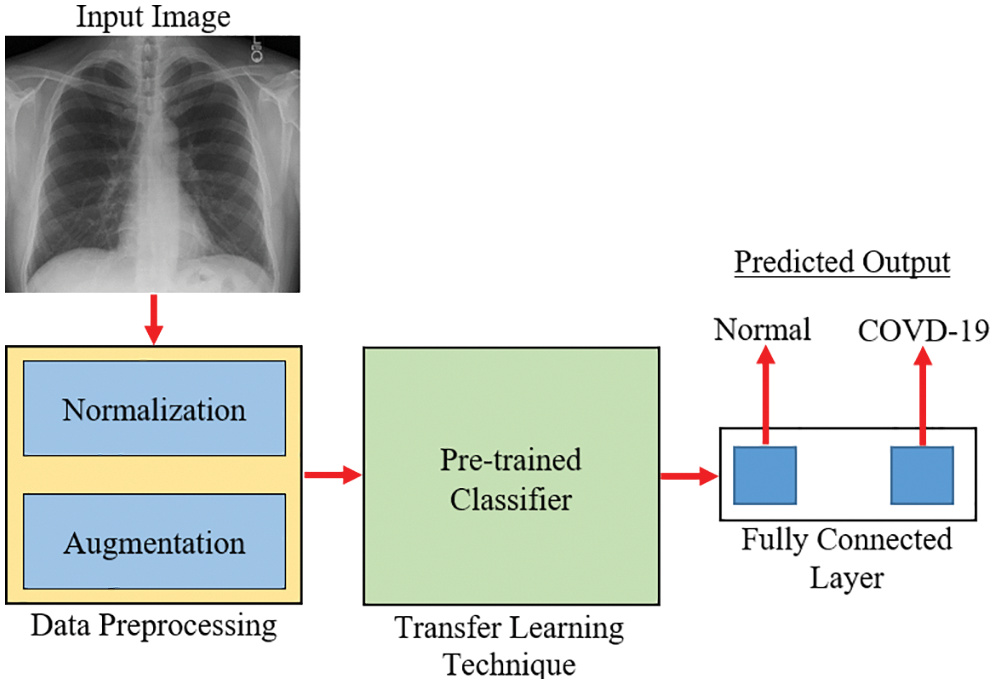
Figure 4: An overview of the transfer learning approach for COVID-19 diagnosis [35]
4 A Brief Overview of the Pre-Trained Classifiers
For the purposes of this investigation, a custom CNN model serves as the foundational model. This model is made available by the server to the connected edge devices whenever they make a request for it. Its performance is compared to that of some other well-known pre-trained models, including VGG-16 and ResNet-50 for the suggested application.
VGG-16 is made up of 13 convolutional layers and three fully linked dense layers. Instead of a large number of hyper-parameters, it focuses on having convolution layers of 3 × 3 filter with stride 1 and always uses the same padding and max pool layer of 2 × 2 filter with stride 2. This mix of convolution and max pool layer combination is consistent throughout the architecture. Lastly, it has two FC (fully connected layers) and a SoftMax output. The quantity 16 in VGG-16 corresponds to the number of weighted layers it comprises. With an estimated 138 million parameters, this network is rather large [36]. Fig. 5 shows the basic architecture of the VGG-16 model.
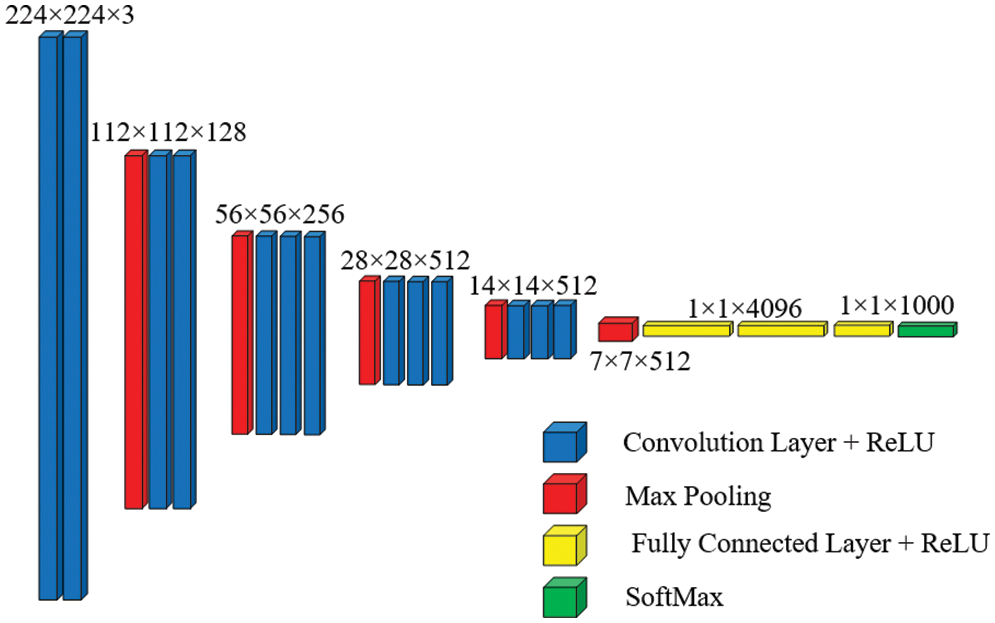
Figure 5: Basic architecture of VGG-16 [37]
The ResNet50 architecture requires an input of 224 × 224 × 3 resolution image dataset. Convolution layer 1 comprises 64 filters with a kernel size of 7 × 7, resulting in a matrix of 112 × 112. For simplicity, the model of ResNet-50 shown in Fig. 6 does not include pooling layers, although they are included in the coded model. There is a 1 × 1, 64 kernels in the next convolution, followed by a 3 × 3, 64 kernels, and lastly a, 1 × 1, 256 kernels. These three layers yield a batch that is repeated three times for a total of nine convolutional layers. Following that, we observe a kernel of 1 × 1, 128 followed by a kernel of 3 × 3, 128, and finally a kernel of 1 × 1, 512. This phase was performed four times, providing us with a total of 12 layers in this stage. Next, there is a kernel of 1 × 1, 256, followed by two additional kernels of 3 × 3, 256 and 1 × 1, 1024, which are repeated six times for a total of 18 layers. Then 1 × 1, 512 kernels, followed by two additional kernels of 3 × 3, 512, and 1 × 1, 2048 sizes, which were repeated three times, providing nine layers for this batch. Following that, we do an average pool and conclude with a fully linked layer having 1000 nodes and a SoftMax function, yielding the output layer [38].
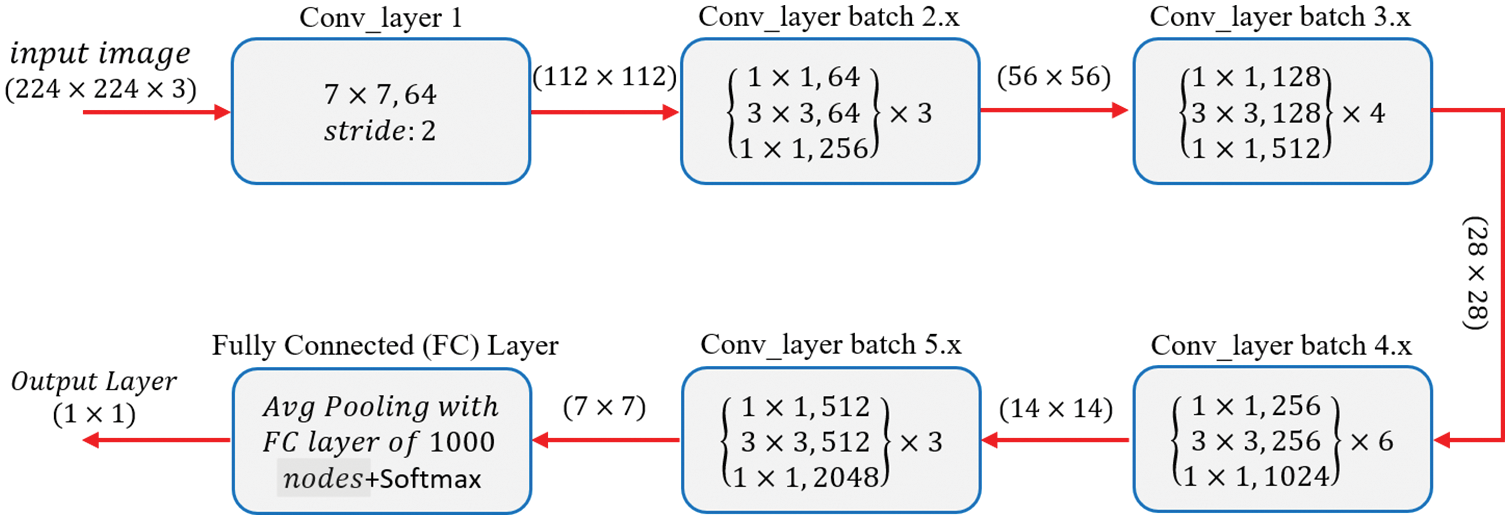
Figure 6: Basic architecture of ResNet-50 from [38]
5 Three-Layered Initial Base Model Employed for Federated Learning
The parameters of the proposed 3-layered CNN model are shown in Table 3. In response to a request, this model will serve as the basis for future models that a server will send to its associated edge device. It has three convolutional layers with a total of 128 filters, 32 filters, and 64 filters on each of those layers, respectively. Each of the three layers that make up CNN uses ReLU as an activation function. As soon as the edge nodes are connected, the server begins authenticating and validating them for the appropriate dataset. Once the dataset has been authenticated, the model is trained on the localized dataset. The proposed model calls for the use of a grayscale image with a resolution of 224 × 224 pixels as the input. Modifications are made to the X-ray picture captured to get the model ready for training or testing. The model makes use of a total of 1420290 trainable parameters in its construction.

Accuracy, Sensitivity/Recall, Precision, and F1 score were the four distinct performance measures used to validate the trained model’s predictions. The performance of the proposed model could be different for other applications or for any other dataset that might be varied depending on the application; the performance of the models is compared based on the X-ray image dataset that was used to train them. The equations for the aforementioned performance parameters are presented in the form of (1)–(4). The Layered flowchart of the model that is utilized by the server for deployment is shown in Fig. 7.
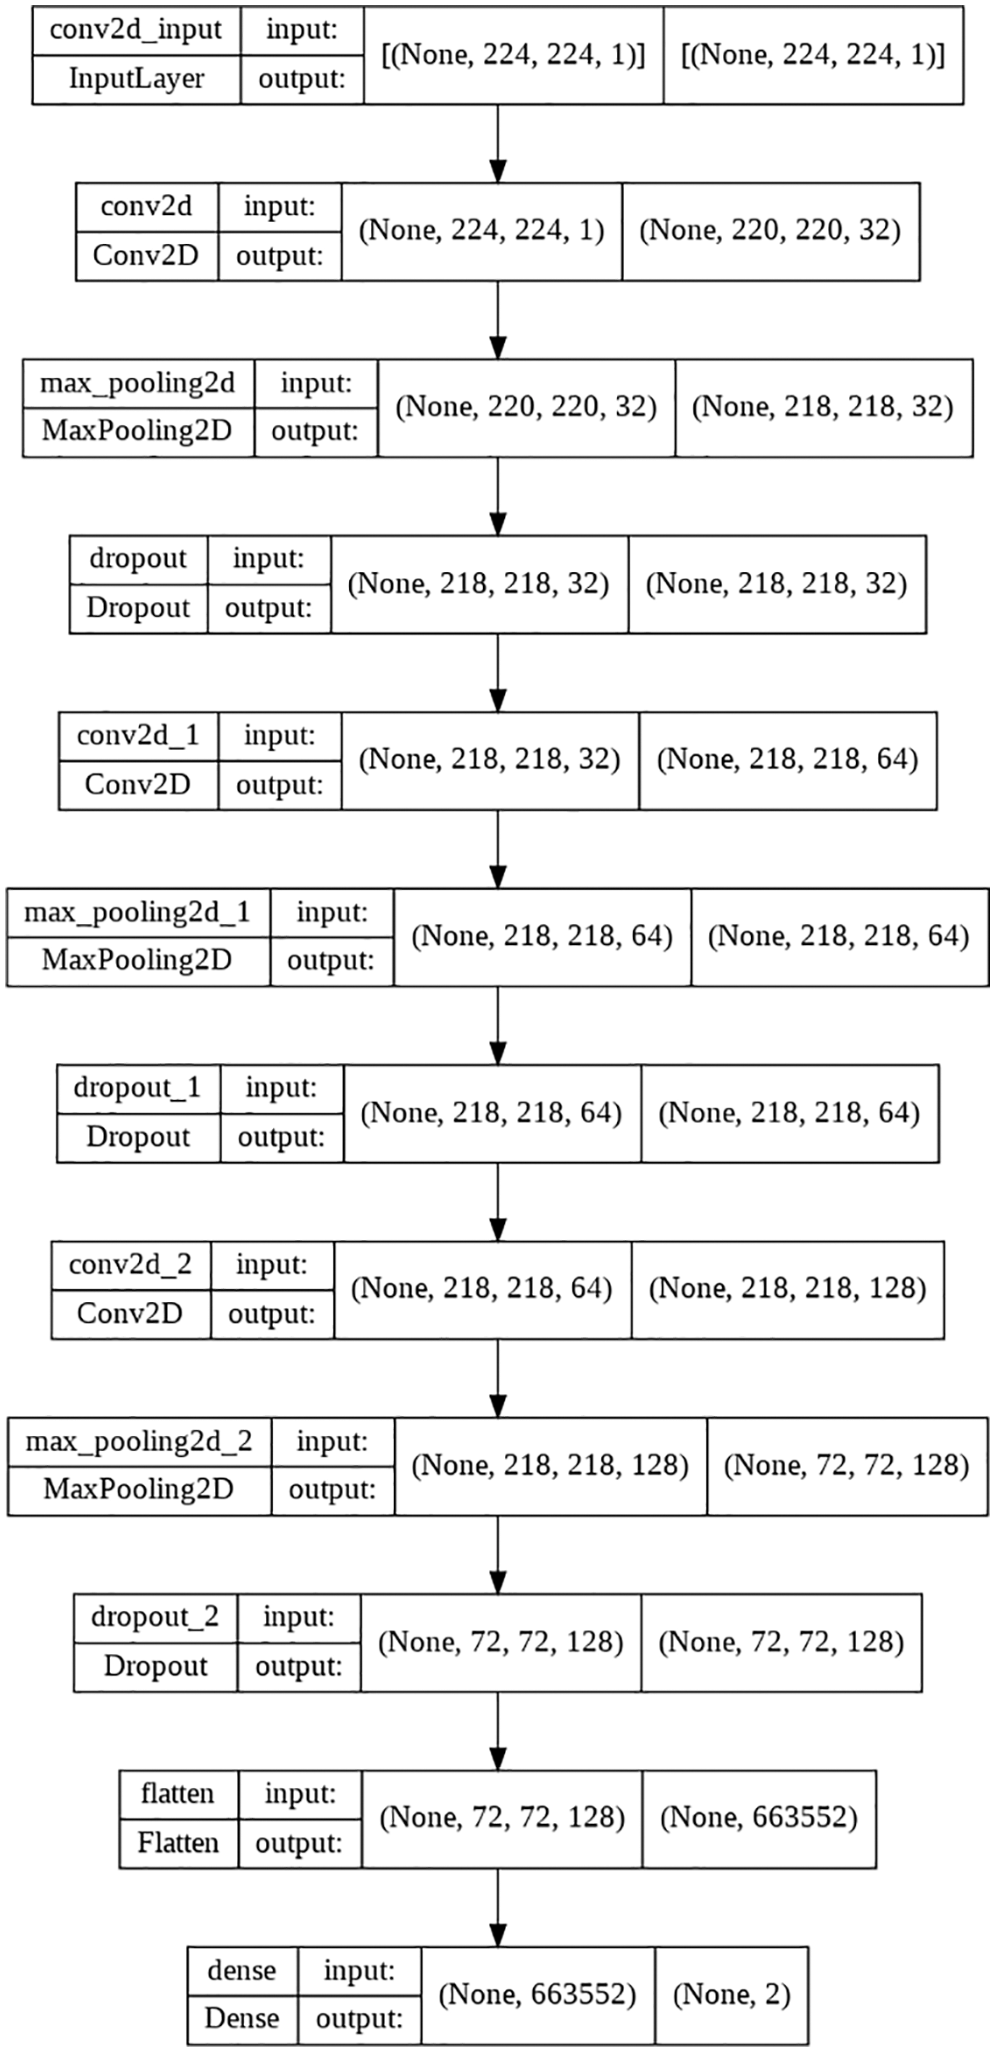
Figure 7: 3-layered flow chart of the used model
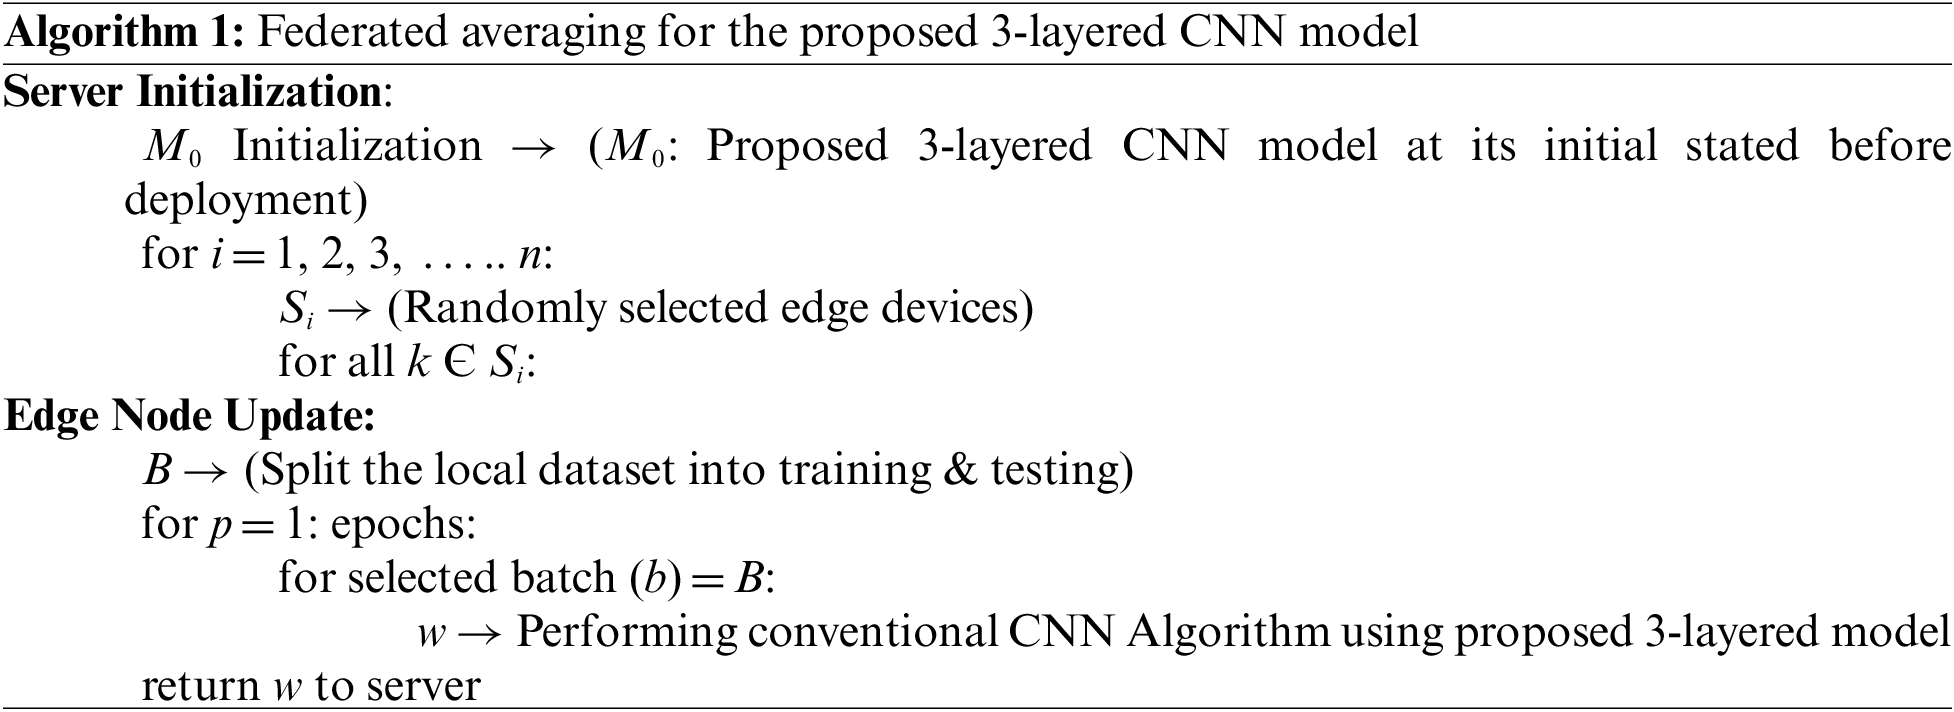
In the work that is being suggested, federated averaging will be used. Client datasets that evolve as data are added and removed; client availability that corresponds intricately with the local data distribution are just two of the many real-world concerns that a deployed federated optimization system must address. The scope of this study does not extend to addressing these issues. As a result, the tests were carried out in a controlled environment that, despite this, addresses the primary concerns about the availability of clients and the dataset that the deployed model is trained on. It is assumed here that the synchronous update system uses loops of connection to carry out its operations. For the sake of this research, it is expected that the number of customers, represented by k, will remain constant. Additionally, it is believed that each client will have their own local dataset that they are unwilling to share with the cloud. In this respect, they will seek to communicate with the server in order to request that the model be deployed so that they may train it using their dataset. A random percentage C of edge devices is chosen at the start of each round, and the server updates all of those devices with the global algorithm’s current status, which can be deployed. Each selected edge device will then train the deployed model using its own local dataset, and after that process is complete, it will send the learned parameters to the server. A federated or master model is produced as a consequence of the server running an algorithm to execute an averaging operation in order to change or aggregate the already deployed model. The edge devices are selected randomly and can be denoted by Si. M0 represents the proposed 3-layered initial model before deployment to the edge devices. Each edge device (Si) in the specified set is iterated to detect its existence as soon as the server chooses the random groups of nodes to use for the deployment of the model. The server will get the updated parameters wi + 1 that were trained by the specified edge device if the device is present.
6 Federated Learning Procedure on Decentralized Image Dataset
Unlike classical machine learning algorithm that uses datasets that are assembled on the local device and used to train the model [39], the Federated Learning method uses datasets that are locally stored on edge devices connected to the server, and this data has no correlation with other datasets that are indigenous to their edge devices. Thus the model trained using a decentralized dataset such as this one will be a global model for all dataset associated with the specific application [40]. Traditional machine learning techniques are unable to perform continuous learning because all the datasets are accumulated on the centralized server where the model is trained and distributed to the edge devices. This is not a problem in most cases if the server can predict using the trained model. However, users of mobile computing expect a quick response, and the connection time between a user’s device and a central server may be too long to provide a satisfying experience for the user and induce latency [41]. Also, traditional machine learning algorithms require edge nodes connected to the server to share their respective information, which may be confidential and include things like medical records, in order to train the model. Because of the introduction of Federated Learning, the restriction on the information that may be shared from the edge node to the server and the problem of latency due to the connection issue between the edge device and the server has been lifted.
Additionally, it allows continuous learning by aggregating the learned models from the many edge nodes in the server, which are then sent back to the edge nodes for additional training. An edge node must only ask the server to provide the basic model for training their locally stored dataset, and then they need to transmit the learned parameters, weights, etc., to the server in place of their own dataset. Instead of an image dataset, it trains the model on a local edge device and then transfers the weights and parameters to the server, where it aggregates the knowledge from other similar edge devices [42]. Algorithm 1 from Reference [43], which used the Federated Averaging technique, has been adapted to work with the 3-layered version of the proposed model, and 20 epochs have been chosen. The Federated learning approach is displayed in Algorithm 1.
Fig. 8 demonstrates the classical machine learning models where the server accumulates the data from an edge node and trains the model. As can be seen from Fig. 8, both the model and the dataset are stored in the cloud, which is also the location where the model is trained and from where it provides services to the edge node upon request. In general, it offers a decent response, but in most instances, the communication going back and forth between an edge device and server induces latency, which unquestionably negatively influences the end-user experience. On the other hand, in Federated Learning, the model is deployed in edge devices, as shown in Fig. 9, where the edge device trains the model on their local dataset and only transfers the learned parameter, such as weights, biases, etc., to the server. Now the server accumulates all the locally trained models from different connected edge devices and averages them to obtain a master model. In this way, the dataset remains with the edge devices. Since each edge node has a unique copy of the model that it will communicate to the server for aggregation, the number of edge nodes may be increased while still reducing the inference time. The gradient is being calculated in parallel by a number of edge devices, which considerably accelerates the entire federated process. By completely using the enormous potential of the data on terminal devices while maintaining user privacy, edge federated learning eliminates the “data island” problem and significantly boosts the effectiveness of model learning in edge computing systems [42].
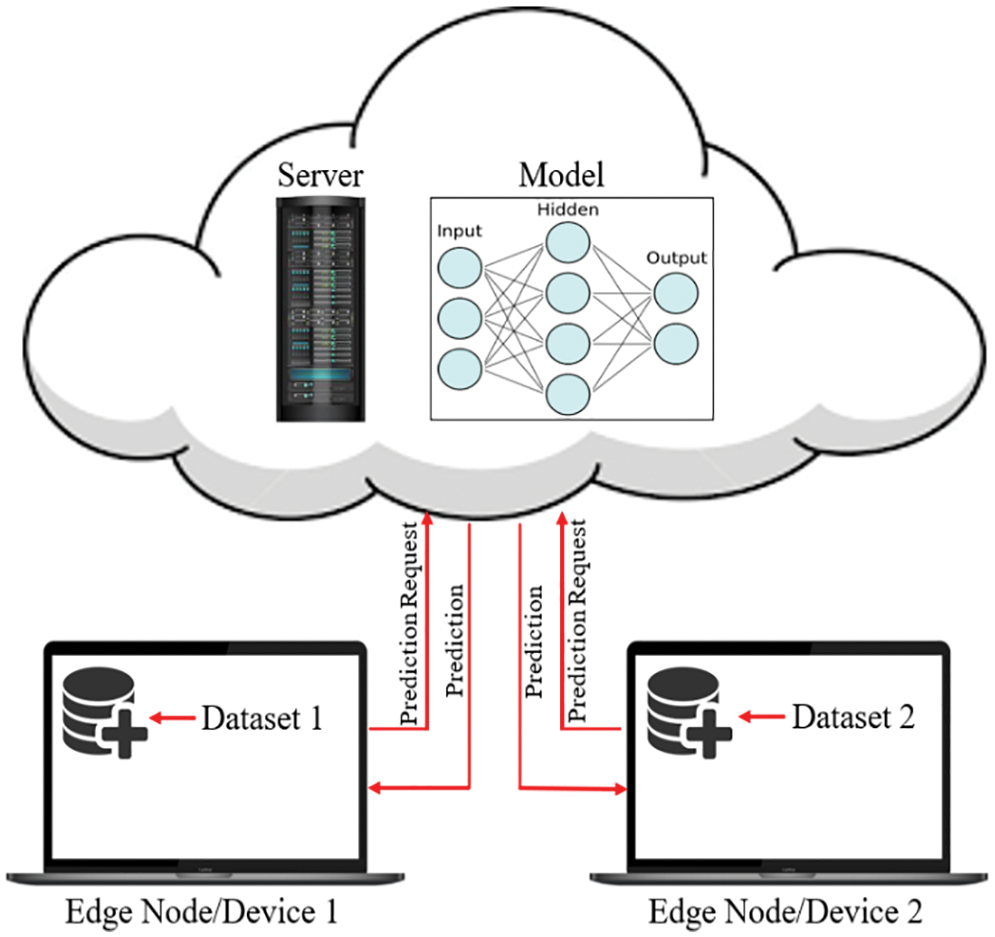
Figure 8: The classical machine learning procedure
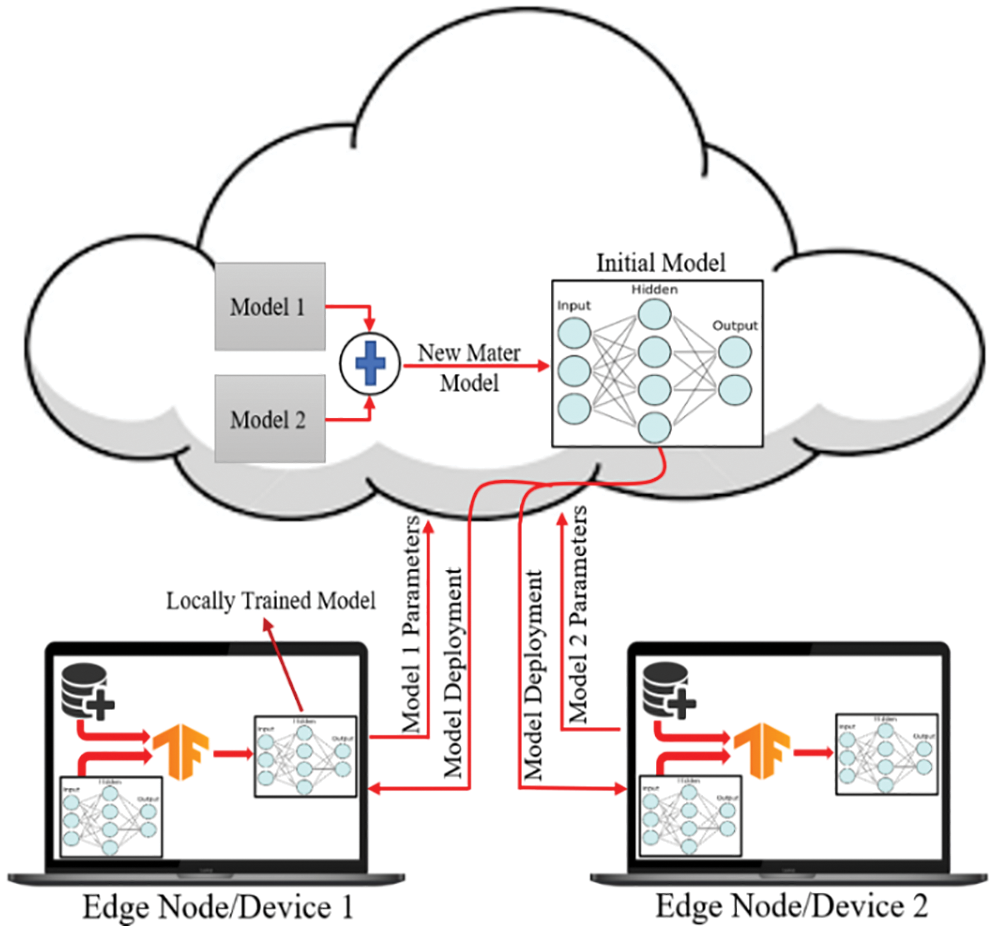
Figure 9: Federated learning approach for training the dataset on edge nodes
The performance of the trained model while utilizing a decentralized dataset on edge devices is proven by using a confusion matrix, as shown in Fig. 10, where the distribution of test data is presented in terms of both the true class and the predicted class. Table 4 contains the performance parameters of the trained model. From Table 4, it is observed that the performance of the proposed model, which uses the same decentralized dataset at each node, is superior to that of the two pre-trained models, which are VGG-16 and ResNet-50. In order to get the federated model, two common tools for federated averaging are utilized, as shown in Table 4. Of these tools, FedAvg gives a higher level of accuracy for the master model in comparison to the model that was obtained by utilizing FedMA.
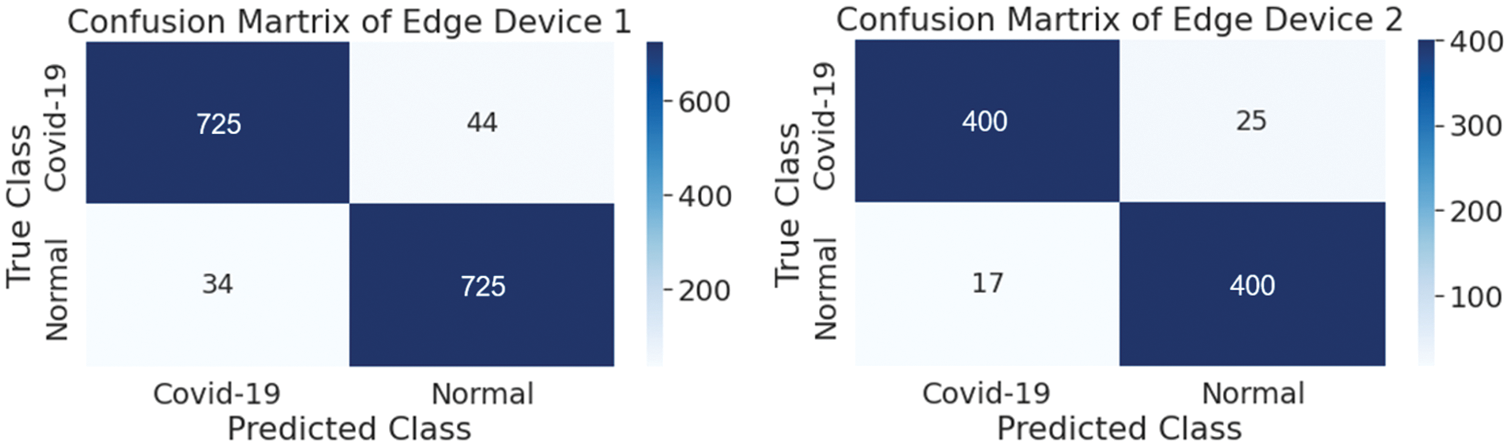
Figure 10: Confusion matrix of both edge devices

A graphical representation of the accuracy and loss for edge device 1 categorization is shown in Fig. 11, and the following output that it is anticipated to produce is shown in Fig. 12. It was completely accurate in its prediction for all six images, although they were selected at random from the test dataset. The training and testing accuracy, as well as the training and testing loss, for edge device 2 are shown in Figs. 13, and 14, respectively.
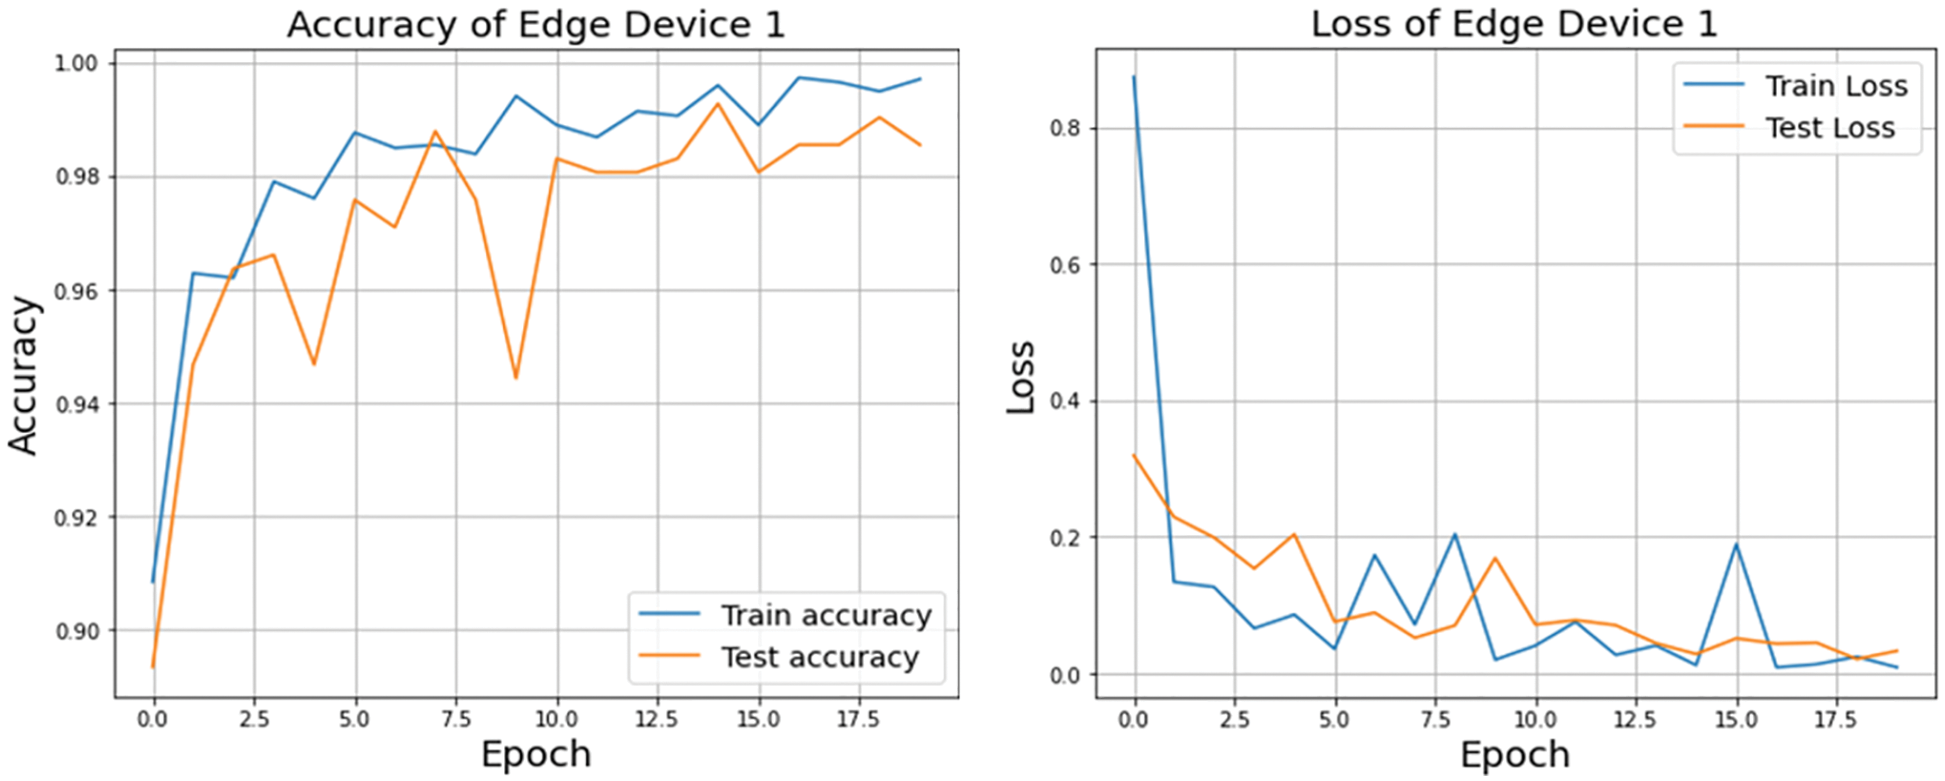
Figure 11: Accuracy and loss of edge device 1 using custom CNN model
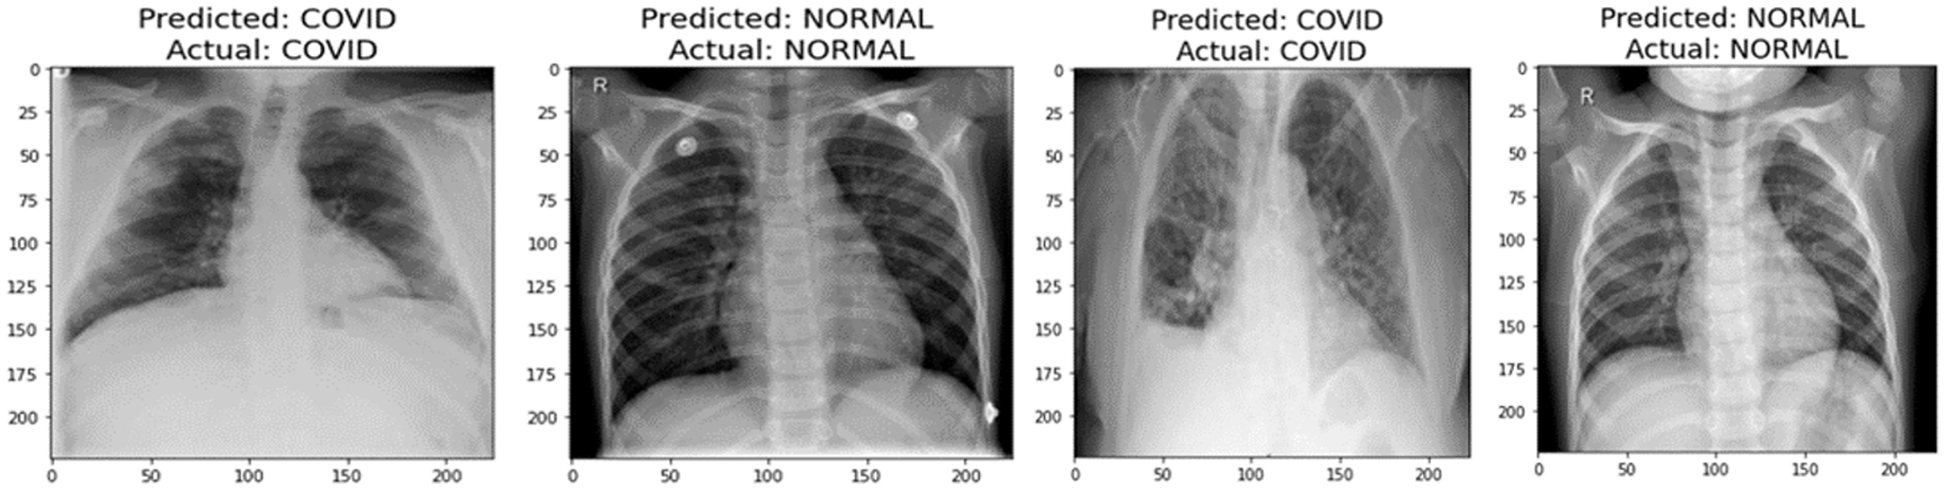
Figure 12: Prediction of edge device 1
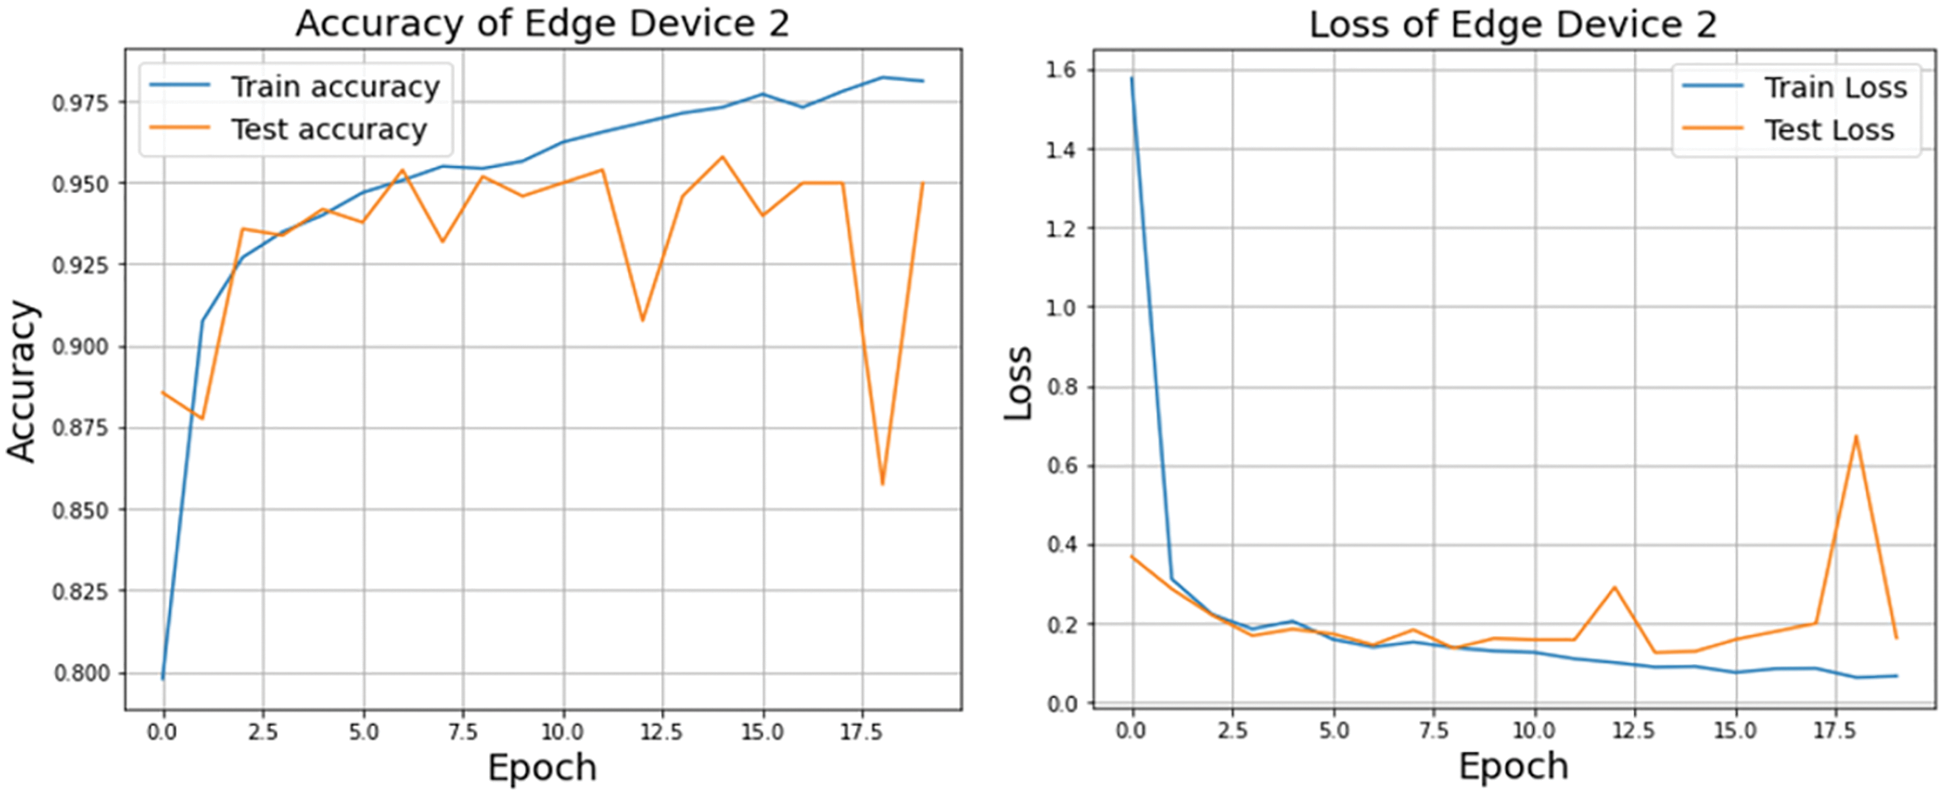
Figure 13: Accuracy and loss of edge device 2 using custom CNN model
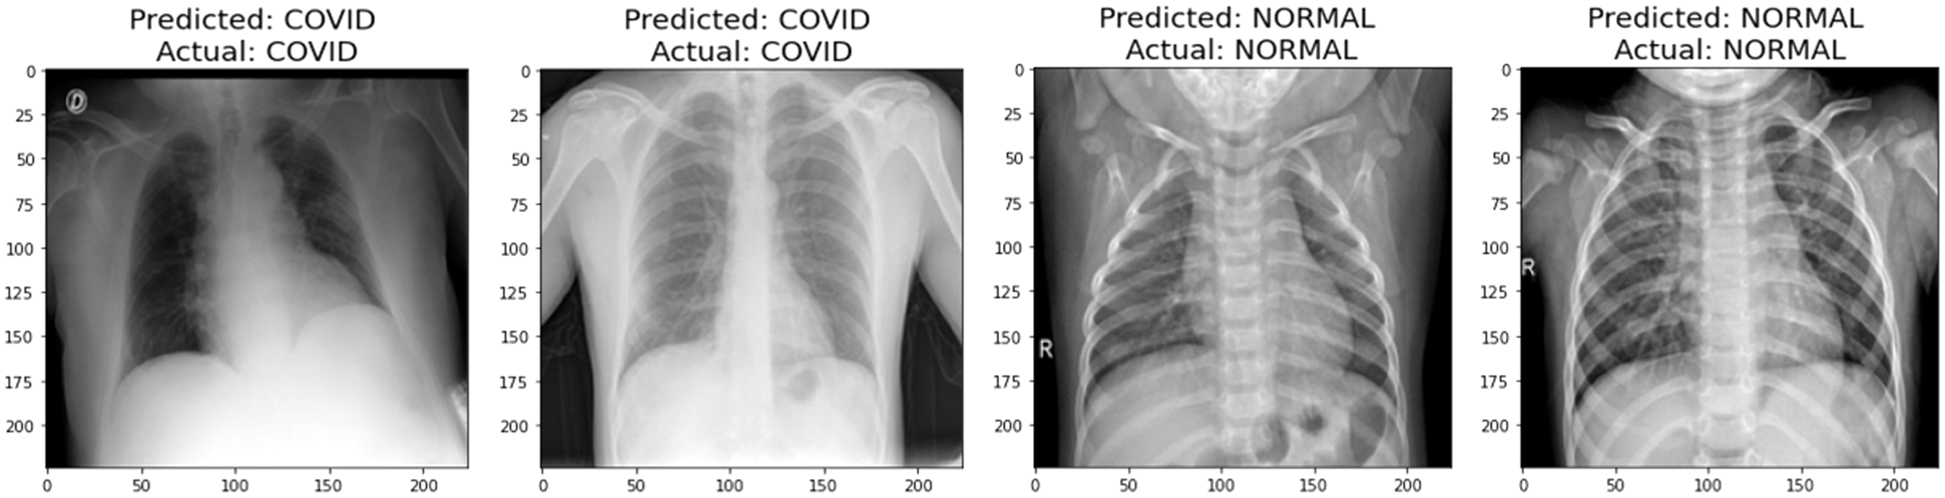
Figure 14: Prediction of edge device 2
Multimodality within each class, such as geodiversity, is common in real-world data. Since the corresponding dominant domain and class connection might hinder the classifier from learning meaningful links between features and classes, classifiers trained on such data “learn” these biases and perform badly on the under-represented domains. The Federated approach lets users train their model without providing their own dataset to the server. This way, the data of the localized node at the user will be secure, and even if the dataset is updated in the future, the edge device only has to request the server to redeploy the model to train their newly generated dataset. Each edge device will sink with the server to train their local dataset and update previous weights and biases to generate a new master model. Fig. 15 depicts the performance of the aggregated model at the server end using two federated averaging criteria, namely FedMA and FedAvg. FedMA constructs the shared global model layer-by-layer by matching and averaging hidden components (such as channels for convolution layers, hidden states for Long Short-Term Memory (LSTM), and neurons for fully connected layers) with comparable feature extraction signatures. FedMA not only outperforms current state-of-the-art federated learning approaches, but also considerably reduces the overall communication cost in deep CNN and LSTM architectures trained on real-world datasets [43]. In contrast to FedMA’s performance, FedAvg performed slightly better, reaching an accuracy of 99.03% while FedMA managed to achieve 98.63%. Due to its capacity to benefit from the variability in client data distributions through local updates, FedAvg has been able to understand the common data representation among the tasks of the customers. The iteration complexity needed by the clients to prove such outcomes is expressly specified in the case where the underlying shared representation is a linear map [44,45].
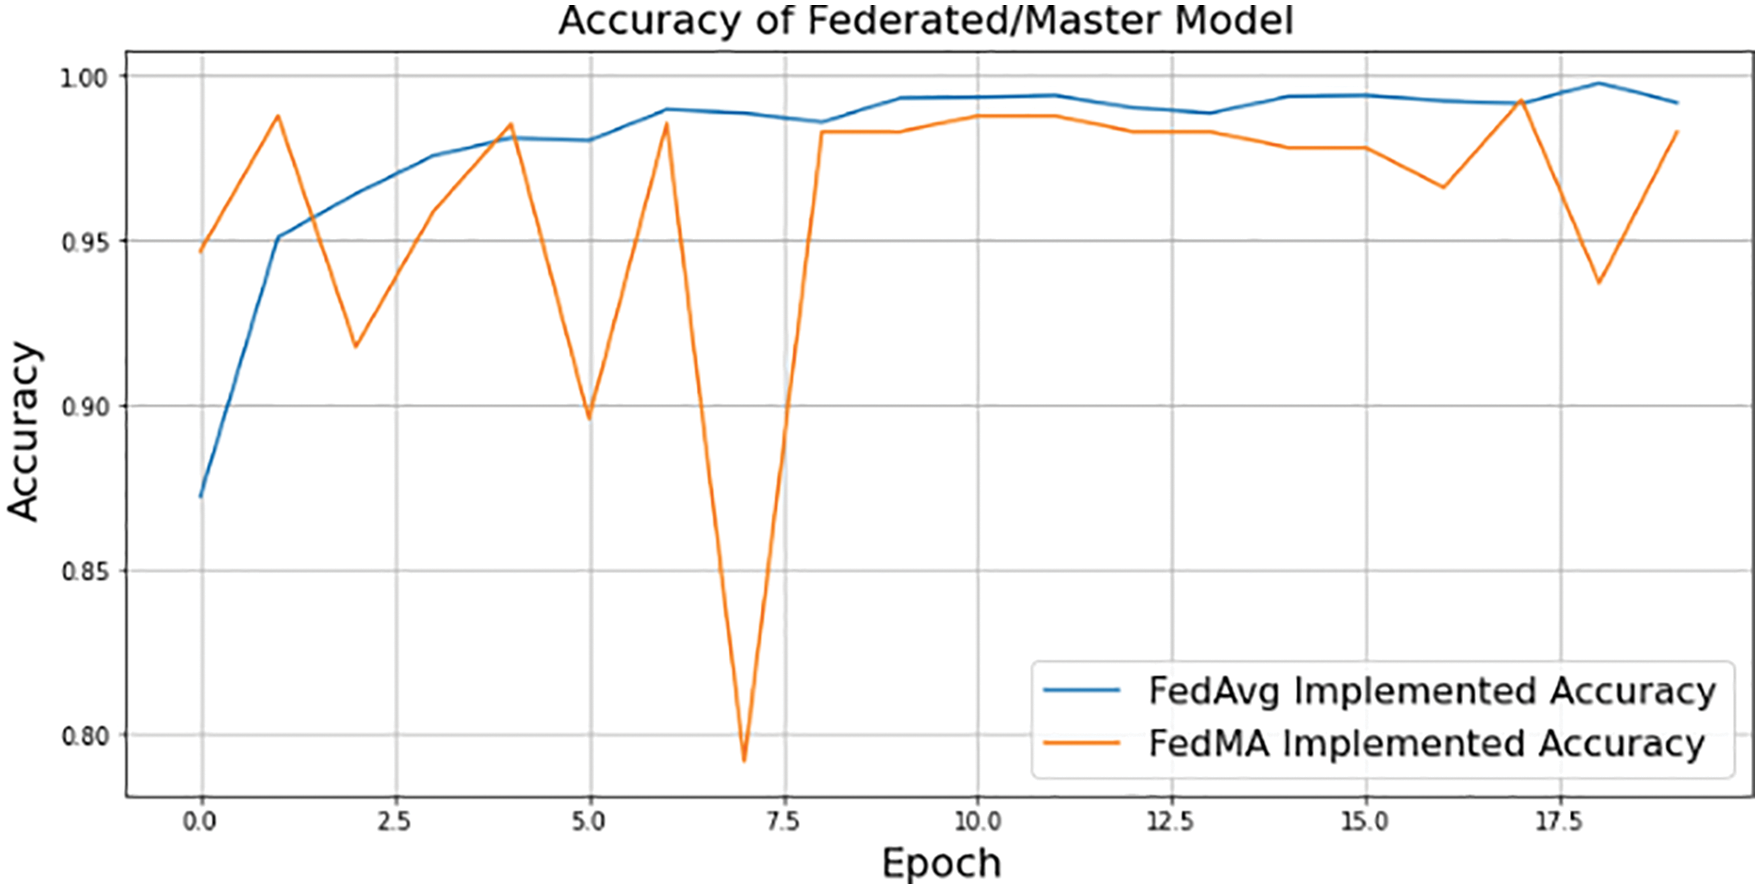
Figure 15: FedAvg and FedMA implemented federated/master model accuracy using 3-layered proposed CNN model
Pneumonia is a disease that may be fatal if not treated appropriately, and COVID-inducted Pneumonia is even more dangerous. Diagnostics in cognition that are timely, accurate, and supported by the proper therapy have the potential to help save several lives. In third-world countries, where the standard of medical care is not as high as it should be, many patients may be waiting in emergency wards outside for the correct diagnosis. Even in these cases, it can be extremely challenging for medical professionals to properly care for such a large number of patients at once since the rate at which COVID-19 spread is really high. In these circumstances, computer-aided diagnosis, often known as CAD, is a good choice for accelerating the diagnosing process while simultaneously keeping physical contact to a minimum. Given that the dataset at each edge device may be provided, but the organization may not have the authorization to share it with the server or data center where it may be trained to deliver services, the proposed model incorporates a Federated Learning technique that uses a 3-layered CNN model to train decentralized datasets on local devices that are connected to the server. Through Federated Learning, the system will be able to learn continuously since the data never stops accumulating. Federate Learning algorithm improved the model that it acquired from the edge devices using FedAvg and attained an accuracy of 99.03%, whereas FedMA attained 98.63. The predicted development of the proposed Federated Learning model would provide a tool that radiologists may use to acquire more image datasets and make a quick diagnosis of COVID-19 or any other illness given with an appropriate dataset of its sort.
Acknowledgement: The authors would like to acknowledge the Princess Nourah bint Abdulrahman University Researchers Supporting Project number (PNURSP2023R66), Princess Nourah bint Abdulrahman University, Riyadh, Saudi Arabia. The authors would like to acknowledge the support of Prince Sultan University for paying the Article Processing Charges (APC) of this publication.
Funding Statement: This work is supported by Princess Nourah bint Abdulrahman University Researchers Supporting Project number (PNURSP2023R66), Princess Nourah bint Abdulrahman University, Riyadh, Saudi Arabia.
Conflicts of Interest: The authors declare that they have no conflicts of interest to report regarding the present study.
References
1. W. El-Shafai and F. Abd El-Samie, “Extensive COVID-19 X-ray and CT chest images dataset,” Mendeley Data, vol. 3, no. 10, 2020. https://doi.org/10.17632/8h65ywd2jr.3 [Google Scholar] [CrossRef]
2. W. El-Shafai, S. Abd El-Nabi, E. El-Rabaie, A. Ali and F. Soliman, “Efficient deep-learning-based autoencoder denoising approach for medical image diagnosis,” Computers, Materials and Continua, vol. 70, no. 3, pp. 6107–6125, 2022. [Google Scholar]
3. W. El-Shafai, A. Mohamed, E. El-Rabaie, A. Ali and F. Soliman, “Automated COVID-19 detection based on single-image super-resolution and CNN models,” Computers, Materials and Continua, vol. 69, no. 3, pp. 1141–1157, 2021. [Google Scholar]
4. T. H. Noor, A. Almars, I. Gad, E. S. Atlam and M. Elmezain, “Spatial impressions monitoring during COVID-19 pandemic using machine learning techniques,” Computers, vol. 11, no. 4, pp. 52–68, 2022. [Google Scholar]
5. E. Korot, Z. Guan, D. Ferraz, S. K. Wagner, G. Zhang et al., “Code-free deep learning for multi-modality medical image classification,” Nature Machine Intelligence, vol. 3, no. 4, pp. 288–298, 2021. [Google Scholar]
6. C. Phillip, H. Min, N. Vandenberg, J. Dowling, L. Holloway et al., “A review of medical image data augmentation techniques for deep learning applications,” Journal of Medical Imaging and Radiation Oncology, vol. 65, no. 5, pp. 545–563, 2021. [Google Scholar]
7. S. Suganyadevi, V. Seethalakshmi and K. Balasamy, “A review on deep learning in medical image analysis,” International Journal of Multimedia Information Retrieval, vol. 11, no. 1, pp. 19–38, 2022. [Google Scholar] [PubMed]
8. A. Javaria, M. Sharif, N. Gul, S. Kadry and C. Chakraborty, “Quantum machine learning architecture for COVID-19 classification based on synthetic data generation using conditional adversarial neural network,” Cognitive Computation, vol. 14, no. 5, pp. 1677–1688, 2022. [Google Scholar]
9. L. Siyuan, Z. Zhu, J. Gorriz, S. Wang and Y. Zhang, “NAGNN: Classification of COVID-19 based on neighboring aware representation from deep graph neural network,” International Journal of Intelligent Systems, vol. 37, no. 2, pp. 1572–1598, 2022. [Google Scholar]
10. R. F. Mansour, N. M. Alfar, S. Abdel-Khalek, M. Abdelhaq, R. A. Saeed et al., “Optimal deep learning based fusion model for biomedical image classification,” Expert Systems, vol. 39, no. 3, pp. 1–15, 2022. [Google Scholar]
11. O. S. Albahri, A. A. Zaidan, A. S. Albahri, B. B. Zaidan, K. H. Abdulkareem et al., “Systematic review of artificial intelligence techniques in the detection and classification of COVID-19 medical images in terms of evaluation and benchmarking: Taxonomy analysis, challenges, future solutions and methodological aspects,” Journal of Infection and Public Health, vol. 13, no. 10, pp. 1381–1396, 2020. [Google Scholar] [PubMed]
12. G. Volkan, V. Sarı and S. Kockanat, “A novel classifier architecture based on deep neural network for COVID-19 detection using laboratory findings,” Applied Soft Computing, vol. 3, no. 106, pp. 107–121, 2021. [Google Scholar]
13. A. H. El-sheikh, A. I. Saba, M. Abd Elaziz, L. Songfeng, S. Shanmugan et al., “Deep learning-based forecasting model for COVID-19 outbreak in Saudi Arabia,” Process Safety and Environmental Protection, vol. 2, no. 149, pp. 223–233, 2021. [Google Scholar]
14. W. Xinggang, X. Deng, Q. Fu, Q. Zhou, J. Feng et al., “A weakly-supervised framework for COVID-19 classification and lesion localization from chest CT,” IEEE Transactions on Medical Imaging, vol. 39, no. 8, pp. 2615–2625, 2020. [Google Scholar]
15. W. El-Shafai, S. El-Rabaie, M. El-Halawany and F. Abd El-Samie, “Efficient hybrid watermarking schemes for robust and secure 3D-MVC communication,” International Journal of Communication Systems, vol. 31, no. 4, pp. 1–22, 2018. [Google Scholar]
16. J. Aayush, N. Gianchandani, D. Singh, V. Kumar and M. Kaur, “Classification of the COVID-19 infected patients using DenseNet201 based deep transfer learning,” Journal of Biomolecular Structure and Dynamics, vol. 39, no. 15, pp. 5682–5689, 2021. [Google Scholar]
17. S. Dilbag, V. Kumar and M. Kaur, “Classification of COVID-19 patients from chest CT images using multi-objective differential evolution–based convolutional neural networks,” European Journal of Clinical Microbiology & Infectious Diseases, vol. 39, no. 7, pp. 1379–1389, 2020. [Google Scholar]
18. P. Giuseppe, O. Díaz, V. Ribas and P. Radeva, “CoLe-CNN+: Context learning-convolutional neural network for COVID-19-ground-glass-opacities detection and segmentation,” Computers in Biology and Medicine, vol. 6, no. 13, pp. 104–115, 2021. [Google Scholar]
19. A. Asmaa, M. M. Abdelsamea and M. M. Gaber, “Classification of COVID-19 in chest X-ray images using DeTraC deep convolutional neural network,” Applied Intelligence, vol. 51, no. 2, pp. 854–864, 2021. [Google Scholar]
20. E. Khan, M. Zia-Ur-Rehman, F. Ahmed, F. A. Alfouzan, N. M. Alzahrani et al., “Chest X-ray classification for the detection of COVID-19 using deep learning techniques,” Sensors, vol. 22, no. 3, pp. 1–16, 2022. [Google Scholar]
21. T. Siham, A. Gómez-Ríos, J. L. Martín-Rodríguez, I. Sevillano-García, M. Rey-Area et al., “COVIDGR dataset and COVID-SDNet methodology for predicting COVID-19 based on chest X-ray images,” IEEE Journal of Biomedical and Health Informatics, vol. 24, no. 12, pp. 3595–3605, 2020. [Google Scholar]
22. S. Sachin, “Drawing insights from COVID-19-infected patients using CT scan images and machine learning techniques: A study on 200 patients,” Environmental Science and Pollution Research, vol. 27, no. 29, pp. 37155–37163, 2020. [Google Scholar]
23. K. Hoon, H. Chung, W. S. Kang, K. W. Kim, Y. Shin et al., “COVID-19 pneumonia diagnosis using a simple 2D deep learning framework with a single chest CT image: Model development and validation,” Journal of Medical Internet Research, vol. 22, no. 6, pp. 1–18, 2020. [Google Scholar]
24. C. Murat, “MH-COVIDNet: Diagnosis of COVID-19 using deep neural networks and meta-heuristic-based feature selection on X-ray images,” Biomedical Signal Processing and Control, vol. 5, no. 64, pp. 102–116, 2021. [Google Scholar]
25. O. Çinare and M. Yağanoğlu, “Detection of COVID-19 using deep learning techniques and classification methods,” Information Processing & Management, vol. 59, no. 5, pp. 247–262, 2022. [Google Scholar]
26. A. Sedik, H. Emara, A. Hamad, E. Shahin, N. El-Hag et al., “Efficient anomaly detection from medical signals and images,” International Journal of Speech Technology, vol. 22, no. 3, pp. 739–767, 2019. [Google Scholar]
27. R. Vinayakumar, H. Narasimhan, C. Chakraborty and T. D. Pham, “Deep learning-based meta-classifier approach for COVID-19 classification using CT scan and chest X-ray images,” Multimedia Systems, vol. 28, no. 4, pp. 1401–1415, 2022. [Google Scholar]
28. T. Samir, F. Antaki and R. Duval, “Development of a code-free machine learning model for the classification of cataract surgery phases,” Scientific Reports, vol. 12, no. 1, pp. 1–7, 2022. [Google Scholar]
29. L. Sundari, S. Ahmed, K. Anitha and M. Pushpa, “COVID-19 outbreak based coronary heart diseases (CHD) prediction using SVM and risk factor validation,” in Proc. 3rd Innovations in Power and Advanced Computing Technologies (i-PACT), Kuala Lumpur, Malaysia, IEEE, pp. 1–5. 2021. [Google Scholar]
30. S. Robbie, B. Sundaram, S. Majumdar and D. Ushizima, “Validating deep learning inference during chest X-ray classification for COVID-19 screening,” Scientific Reports, vol. 11, no. 1, pp. 1–10, 2021. [Google Scholar]
31. A. Vertika, M. C. Lohani, A. S. Bist, E. P. Harahap and A. Khoirunisa, “Analysis of deep learning techniques for chest X-ray classification in context of Covid-19,” ADI Journal on Recent Innovation, vol. 3, no. 2, pp. 208–216, 2022. [Google Scholar]
32. A. Alarifi, M. Amoon, M. Aly and W. El-Shafai, “Optical PTFT asymmetric cryptosystem based secure and efficient cancelable biometric recognition system,” IEEE Access, vol. 8, no. 1, pp. 221246–221268, 2020. [Google Scholar]
33. T. Enzo, C. Alberto, C. Berzovini, M. Calandri and M. Grangetto, “Unveiling COVID-19 from chest x-ray with deep learning: A hurdles race with small data,” International Journal of Environmental Research and Public Health, vol. 17, no. 18, pp. 69–82, 2020. [Google Scholar]
34. R. Kumar, A. A. Khan, J. Kumar, N. A. Golilarz, S. Zhang et al., “Blockchain-federated-learning and deep learning models for COVID-19 detection using ct imaging,” IEEE Sensors Journal, vol. 21, no. 14, pp. 16301–16314, 2021. [Google Scholar] [PubMed]
35. W. Zhang, T. Zhou, Q. Lu, X. Wang, C. Zhu et al., “Dynamic-fusion-based federated learning for COVID-19 detection.” IEEE Internet of Things Journal, vol. 8, no. 21, pp. 15884–15891, 2021. [Google Scholar] [PubMed]
36. A. Alarifi, S. Sankar, T. Altameem, K. Jithin, M. Amoon et al., “Novel hybrid cryptosystem for secure streaming of high efficiency H. 265 compressed videos in IoT multimedia applications,” IEEE Access, vol. 8, no. 1, pp. 128548–128573, 2020. [Google Scholar]
37. T. Dhananjayand and R. Sedamkar, “Detecting affect states using VGG16, ResNet50, and SE-ResNet50 networks,” SN Computer Science, vol. 1, no. 2, pp. 1–7, 2020. [Google Scholar]
38. Y. Rabab and W. Gouda, “Chest X-ray findings monitoring COVID-19 disease course and severity,” Egyptian Journal of Radiology and Nuclear Medicine, vol. 51, no. 1, pp. 1–18, 2020. [Google Scholar]
39. K. Asif, J. Latief and M. Bhat, “CoroNet: A deep neural network for detection and diagnosis of COVID-19 from chest x-ray images,” Computer Methods and Programs in Biomedicine, vol. 2, no. 19, pp. 105–116, 2020. [Google Scholar]
40. M. Mubeen, M. Shanmuga and M. Vijayaraj, “An effective approach of CNN based hybrid meta-heuristic optimization classifier for retrieving satellite images,” Earth Science Informatics, vol. 15, no. 1, pp. 253–264, 2022. [Google Scholar]
41. J. Michael and M. Mitchell, “Machine learning: Trends, perspectives, and prospects,” Science, vol. 3, no. 6, pp. 255–260, 2015. [Google Scholar]
42. Q. Xia, Y. Winso, T. Zeyi, W. Jindi and L. Qun, “A survey of federated learning for edge computing: Research problems and solutions,” High-Confidence Computing, vol. 1, no. 1, pp. 122–139, 2021. [Google Scholar]
43. Y. Qiang, Y. Liu, T. Chen and Y. Tong, “Federated machine learning: Concept and applications,” ACM Transactions on Intelligent Systems and Technology (TIST), vol. 10, no. 2, pp. 1–19, 2019. [Google Scholar]
44. S. Kit, Q. Lu, C. Wang, H. Paik and L. Zhu, “A systematic literature review on federated machine learning: From a software engineering perspective,” ACM Computing Surveys, vol. 5, no. 5, pp. 1–39, 2021. [Google Scholar]
45. M. E. ElAraby, O. M. Elzeki, M. Y. Shams, A. Mahmoud and H. Salem, “A novel gray-scale spatial exploitation learning Net for COVID-19 by crawling internet resources,” Biomedical Signal Processing and Control, vol. 73, no. 1, pp. 1–13, 2022. [Google Scholar]
Cite This Article
 Copyright © 2023 The Author(s). Published by Tech Science Press.
This work is licensed under a Creative Commons Attribution 4.0 International License , which permits unrestricted use, distribution, and reproduction in any medium, provided the original work is properly cited.
 Downloads
 Citation Tools