
 Submit a Paper
 Propose a Special lssue
 Open Access
ARTICLE

Optimal Synergic Deep Learning for COVID-19 Classification Using Chest X-Ray Images
1 Departament of Computational Science and Electronic, Universidad de la Costa, CUC, Barranquilla, 080002, Colombia
2 Biomedical Engineering Program, Universidad Simón Bolívar, Barranquilla, 080002, Colombia
3 Department of Computer Science and AI, Faculty of Computer Science and Engineering, University of Jeddah, Jeddah, Saudi Arabia
4 Department of Information Systems, Faculty of Computing and Information Technology, King Abdulaziz University, Jeddah, Saudi Arabia
5 Department of Mathematics, Faculty of Science, New Valley University, El-Kharga, 72511, Egypt
* Corresponding Author: José Escorcia-Gutierrez. Email:
Computers, Materials & Continua 2023, 75(3), 5255-5270. https://doi.org/10.32604/cmc.2023.033731
Received 26 June 2022; Accepted 16 November 2022; Issue published 29 April 2023
 View Full Text
 Download PDF
Abstract
A chest radiology scan can significantly aid the early diagnosis and management of COVID-19 since the virus attacks the lungs. Chest X-ray (CXR) gained much interest after the COVID-19 outbreak thanks to its rapid imaging time, widespread availability, low cost, and portability. In radiological investigations, computer-aided diagnostic tools are implemented to reduce intra- and inter-observer variability. Using lately industrialized Artificial Intelligence (AI) algorithms and radiological techniques to diagnose and classify disease is advantageous. The current study develops an automatic identification and classification model for CXR pictures using Gaussian Filtering based Optimized Synergic Deep Learning using Remora Optimization Algorithm (GF-OSDL-ROA). This method is inclusive of preprocessing and classification based on optimization. The data is preprocessed using Gaussian filtering (GF) to remove any extraneous noise from the image’s edges. Then, the OSDL model is applied to classify the CXRs under different severity levels based on CXR data. The learning rate of OSDL is optimized with the help of ROA for COVID-19 diagnosis showing the novelty of the work. OSDL model, applied in this study, was validated using the COVID-19 dataset. The experiments were conducted upon the proposed OSDL model, which achieved a classification accuracy of 99.83%, while the current Convolutional Neural Network achieved less classification accuracy, i.e., 98.14%.Keywords
All human activities have been severely affected by the outbreak of COVID-19, a deadly disease caused by the SARS-CoV-2 virus [1]. As of December 2019, 6.18 million people worldwide have been diagnosed with the CoV-2 virus. Since its discovery, there have been an estimated 80 million cases diagnosed across the globe, including 35 million in the Americas, 26 million in Europe, and 1.8 million verified deaths worldwide as of January 1, 2021 [2]. In this pandemic, people must avoid close contact with those infected by the virus, as it has been categorized as a super-spreader globally [3]. Maintaining social distance is the best method to prevent spreading this contagious virus. Patients affected with this disease need immediate treatment to stop the further spread and ensure the patient’s survival. Hence, it is critical to diagnose the patients at the earliest for their speedy recovery and containment of the virus. Although COVID-19 [4] can be detected in multiple ways like rapid antigen tests, qRT-PCR, etc., the detection methods have a few disadvantages associated with it [5–9].
Deep learning systems have significantly enhanced the diagnostic accuracy of medical imaging. In recent years, diagnostic accuracy has become essential in emerging AI technology [10–13]. Nowadays, these intelligent systems can automatically detect many diseases, including COVID-19, allowing faster progress in early diagnosis and treatment [14]. Many studies based on deep Convolutional Neural Networks (CNN) have demonstrated promising results in light of these advantages. They are prompted by the necessity for accurate and automated CXR image interpretation. If deep learning models have to yield excellent performance, they should be trained using a considerable volume of valid training data [15,16]. It is possible that the deep learning models cannot be generalized because the COVID-19 CXR dataset is minuscule in volume compared to other pneumonia disease datasets. Various factors affect the picture segmentation process in biomedical engineering, such as lighting, contrast, noise, and irregularity in the objects being segmented. An image can be segmented into separate segments or regions by comparing similar qualities in the vicinity of each other. COVID-19 patients can be diagnosed using chest radiography images with the help of Deep Learning structures, as demonstrated by Minaee and colleagues [17]. DenseNet-121, ResNet 18, Squeezenet, and ResNet50 CNN were used in this study to recognize COVID-19 in chest X-ray images. The study addressed the overfitting problem by applying a learning dataset to a subset of 2,000 radiograms across all the networks. Automated segmentation of the infested tissue in CT scan images was achieved by Fan et al. [18] using the deep network (Inf-Net) model. This study used a decoder to aggregate and create a global map of high-level features. This was followed by incorporating explicit and implicit edge-attention into the model to segment the borders in a better manner.
Detection of COVID-19 from high volumes of CT scan images, using Wang’s 3D deep DeCoVNet, was proposed in the study conducted earlier [19]. 3D lung masks were created using a pre-trained UNet model. The three stages of the proposed DeCoVNet are outlined herewith. In the initial stage, known as ‘network stem’, a simple 3D convolution was used. ResNet and AlexNet visual info were preserved using batch normalization and pooling layers with kernel size 5 × 7 × 7 to maintain local visual information. In the second phase, the study used two 3D residual blocks (ResBlocks). Another tool employed in this study was ProClf, a progressive classifier proposed by Barstugan et al. [20]. It allows early-phase detection of COVID-19 by employing five different feature extraction techniques. Support Vector Machine (SVM) and 10-fold cross were used to classify the extracted features in the organization course. COVID19’s robust screening model relies upon DL-NN, according to Panwar et al. [21]. Toraman’s research [22] proposed a new artificial neural network (ANN) technique to forecast COVID-19. Convolutional CapsNet and CXR pictures were used in the proposed algorithm. This classification system includes both binary and multi-class choices. It also has an extensive collection of images from normal pneumonia as well as COVID-19 patients. In this study, a 10-fold cross-validation method was used to appraise the presentation of the obtainable process. For binary and multi-classification, the simulation results showed remarkable accuracy. Hardware resources and computing time were the main constraints, highlighted by developers in this study.
Nour et al. [23] developed a COVID-19 tool to perform therapeutic activities. In-depth features and Bayesian optimization were utilized in the development of this strategy. The CNN framework is used when using k-nearest neighbor (kNN), SVM, and Decision Tree (DT) to extract the features from data automatically. The dataset contained various sample images for COVID-19, normal, and pneumonia patients. Data augmentation was done to upsurge the sum of instances of the COVID-19 class. Both training and testing datasets were used to determine how well the new framework performs its intended function. For optimum accuracy, the study recommended the usage of a freshly-predicted CNN.
Mansour et al. [24] developed a novel unsupervised DL-based variational autoencoder (UDL-VAE) model for COVID-19 detection and classification. To improve the image quality of the model they included a preprocessing technique that was based on an adaptive Wiener filter (AFW). The superior diagnostic performance of the UDL-VAE model was verified by a series of experiments for which the effective result was observed. The obtained model values showed the UDL-VAE results with the highest precision of 0.987 and 0.992 in the binary and multiple classes, respectively. This model will diagnose COVID-19 using other imaging modalities like computed tomography (CT). Using the data augmentation method, the researchers in Ahuja’s study [25] applied stationary wavelets and related diverse transmission learning CNN constructions to increase the amount of training given to the proposed method. In the dataset, the maximum number of COVID-19 images was used. In order to maximize the number of instances for both classes, the researchers developed augmentation approaches. At this point, the samples were trained, and the results were validated. As a part of the approach, ResNet 18 approach was used to test the binary classifiers, and the models given showed improved accuracy.
In-depth features and PF-BAT improved PF-FKNN classifiers were used by Kaur et al. [26] to identify the novel coronavirus. FKNN training was used in the proposed method to extract the feature. It is possible to fine-tune the hyperparameters of FKNN using the PF-BAT method. COVID-19 can be diagnosed from chest X-ray images using an automated technique proposed by Singh et al. [27]. The study’s analysis of the chest X-ray image included an improved depth-wise CNN model. Multiresolution analytical results were integrated into the network using wavelet decompositions. Using the frequency sub-bands of the input image, a neural network was able to determine the disease in this study. The networks were designed to distinguish COVID-19 and pneumonia from the images used as inputs. A deep uncertainty-aware TL construction method was reported by Shamsi et al. for COVID-19 detection using healthcare images [28]. ResNet50 and DenseNet121 were utilized to extract the deep features from CT and X-ray images at the beginning of this investigation. Later, to diagnose COVID-19, different ML and statistical modeling approaches were used to extract the feature information. In the method created by Wu et al. [29], fine-grained labeling of the opacification of the lung parenchyma, i.e., better attenuation, was achieved by annotating 3,855 chest CT scans from 200 people.
Quantum Seagull Optimization Algorithm (QSGOA-DL) was developed by Ragab et al. [30] based on DL-based COVID-19 analysis. CXR pictures were used in the proposed QSGOA-DL method to identify and categorize COVID-19. While the QSGOA technique is utilized for hyperparameter optimization, the QSGOA-DL method uses EfficientNet-B4 for feature extraction. Furthermore, a multilayer extreme learning machine (MELM) model is also used to classify the data. For hyper-parameter optimization, a new model was developed in this study called QSGOA based on EfficientNet-B4. The researchers conducted simulations on the CXR dataset and analyzed the findings in several ways.
The current investigation is focused on the classification of CXR images. Preprocessing stage removes any unwanted noise from the margins of the image. Next, CXR images are classified using the Optimized Synergic Deep Learning (OSDL) model, which uses Remora Optimization Algorithm (ROA) to optimize the SDL learning rate. The COVID-19 dataset was used in this study to support the explanation for the OSDL model. Following is a summary of various contributions made by the current study
• Proposed an automatic detection and classification model for CXR pictures using a deep learning network.
• Preprocessing is done to remove any visible noise from the image’s edges.
• Using the OSDL-based classification model, COVID-19 stages are categorized.
• ROA is used to fine-tune the learning rate of the suggested deep learning model
• With the use of the COVID-19 dataset, many experiments were carried out, and the results were measured under different parameters,
The introduction section presents an immediate opening about COVID-19, a problem statement, and a solution for current research work. A brief explanation for the proposed procedure with the dataset is depicted in Section 3. The experimental analysis conducted upon the proposed methodology and a comparison with existing works are dealt with in Section 4. Finally, the scientific contributions of the current research work are detailed in Section 5.
In this study, preprocessing is carried out using the Gaussian Filtering (GF) technique to remove the noise in the image. Then, Optimized Synergic Deep Learning (OSDL) model is also used for final classification, whereas Remora Optimization Algorithm (ROA) is used for adjusting the learning rate of the OSDL model; therefore, the proposed model is named after GF-OSDL-ROA. Finally, CXR images are segregated into two classes such as COVID-19 and non-COVID-19. Fig. 1 shows the workflow of the proposed methodology.
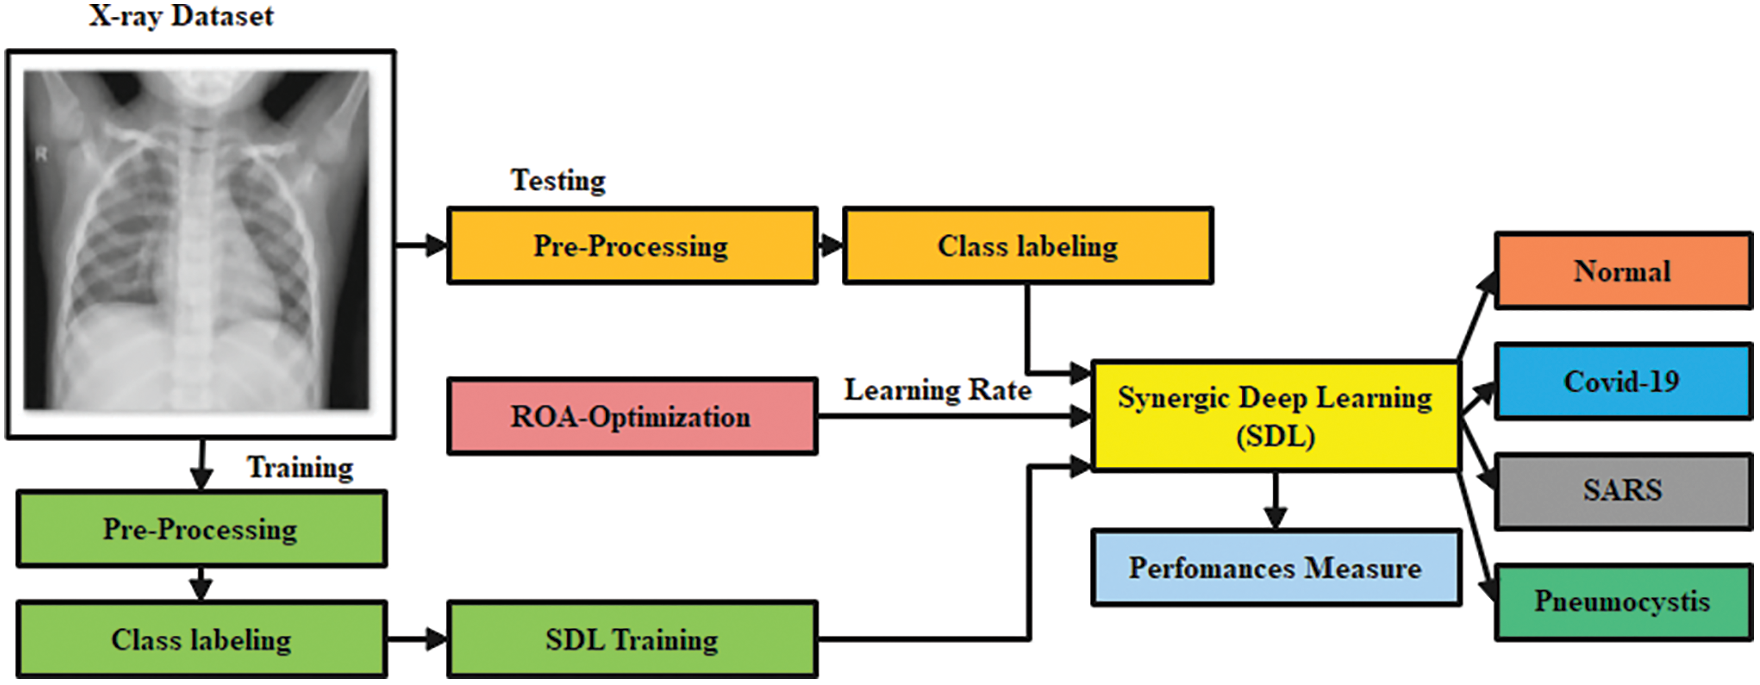
Figure 1: Workflow of the proposed model
To test the proposed GF-OSDN-ROA model, the authors used a chest X-ray dataset. The dataset contains 220 COVID-19 images, 27 normal shots, 11 SARS, and 15 Pneumocystis images [31].
Smoothing and noise reduction are typical applications of a 2D Gaussian filter. Although it requires enormous computing power, it is an exciting research subject thanks to its efficiency in the implementation process. Gaussian smoothing is suggested by convolution and is defined as a Gaussian operator. This document includes a 1-D Gaussian operator [32].
According to the published research, the most effective image smoothing filter is found by performing localization [32]:
The following equation provides the formula for the 2D Gaussian operator [32].
The SD of a Gaussian function is referred to as (Sigma). Image smoothing gets enhanced when it is set at a maximum value. Cartesian coordinates (x,y) denote the window’s dimensions depicted in this image. Then, the preprocessed images are fed into the classifier, which makes data predictions.
The proposed OSDL model includes three primary mechanisms as the input layer, the k deep CNN (DCNN) mechanism, and C k2 Synergic Network (SN) [33]. Fig. 2 depicts the whole SDL model. With the help of appropriate labeling of incoming data, each DCNN element in the network structure generates a self-governing learning representation. Synergic errors can be eliminated using a model of fully-connected construction layers to check that the input layer falls under a similar class. Afterward, the SDL model is divided into three submodules.
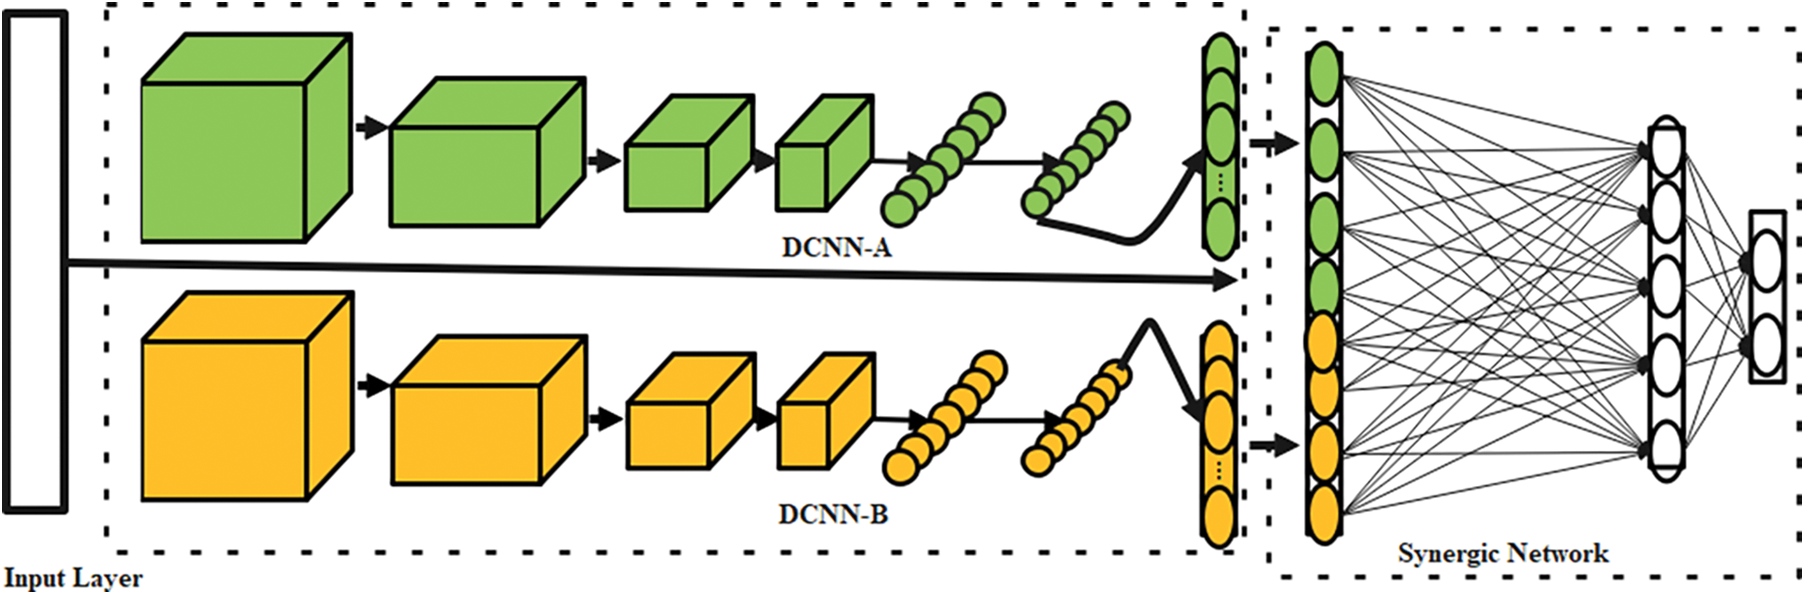
Figure 2: Architecture of SDL
For the projected OSDLk model, a random subset of the training data is selected in contrast to the sequential processing of the standard DCNN model. A Synergic network (SN) provides a synergistic label for every pair of data sets with a class label of 200, which are then sent into DCNN components. The photos are then downsized to 224 × 224 × 3 pixels using bicubic interpolation to maintain a consistent size.
It is possible to utilize ResNet-50 to initialize each DCNN as DCNN-a (a = 1, 2, 3, ..., n) because of its inherent ability. In addition, any DCNN can be used as a DCNN component in the SDL model. Using data sequences, these components are trained
where n designates the class total, and
An SN that consists of an input layer, a concatenate layer, a learning layer, and an output layer is used to supervise each DCNN component further using synergic labels for each data pair. Consider
Then, the deep topographies from each data are combined using
It is recommended that between 45 and 55 percent of batch data pairs are balanced in order to avoid problems with imbalanced data. When another sigmoid layer is enclosed, it becomes easy to see the synergic signal, whereas binary loss is shown below.
Here
DCNN and SN parameters can be adjusted [34,35] after completing the training phase.
where
Moreover,
In Eq. (9), the learning rate is optimized/attuned by ROA, which is clarified in the section given below.
2.4 Remora Optimization Algorithm (ROA)
When Remora first sets off on a global journey, it is referred to as ‘Free travel’ in ROA [36]. The long-distance position of the sailfish is updated in this step which also includes a ‘large global’ movement associated with Remora adsorption on the sailfish. As a bonus, there is a ‘little global’ movement, an ‘Experiment attack’ on Remora. However, the outcome of the endeavor is an essential consideration when deciding whether or not to switch hosts. Remora undergoes a partial renewal during this exploration phase. At this point, Remora begins to focus on the goal of eating. This stage is named ‘eat thoughtfully’. Remoras may follow a huge host to eat or feed on parasites living on the host. Two typical examples include a specific ‘bubble net’ position inform mode of WOA and ‘Host feeding’. A ‘Remora factor’ is generated in the ‘Host feeding’ module based on various placements of the whale’s other components to expand the optimization accuracy. This section presents two mathematical models, ‘Eat thoughtfully’ and ‘Free travel’.
Remora is a candidate solution in the ROA algorithm, and its site ‘R’ in the search space is the variable of the problem. A Remora’s position vector changes depending on how many dimensions it swims (one, two, three, or more). The position is
• SFO Strategy
As soon as Remora is assigned to a swordfish, its location is understood as updated. The location update formula of the algorithm is improved based on the idea of the following elite algorithm [36].
There are currently t iterations in this example, and the total number of iterations that can be finished is referred to as ‘T’. In this situation, R rand is the random position. An elite Remora is the best place for improvement. Additional Remoras are placed to guarantee that the search area has been thoroughly examined. As long as the fitness function value of the Remora is higher than the previous generation’s, the Remora is chosen for different hosts. It is used in the calculation of the current fitness function value.
• Knowledge attack
A tiny step is required around the host to regulate whether or not it is required to alter the host, just like the acquisition of knowledge. The following formula is applied for the above concepts to be translated into a mathematical form.
where
Remora selects a distinct feeding strategy for local optimization, as shown in the following section. To return to host selection, if the fitness function value of the attempted solution is higher than the fitness function value of the existing solution, then the formula follows.
• WOA Strategy
The ‘location’ inform formula for the Remora devoted to the whale, is derived from the unique WOA algorithm as given below.
when a Remora is attached to a whale, both locations can be treated as the same caused of the more comprehensive solution space. D distance separates hunters and prey while a random value in the range
• Host feeding
The exploitation process is further broken down into host feeding. Solution space can be abridged to the physical position of the host at this point. Small steps, which can be mathematically described, can be used to move around the host:
In order to denote the modest step of drive, concerning the host space capacity, the letter A is utilized here. The Remora factor C is employed to limit the position of Remora in solution space so that the host can be distinguished. Furthermore, it is scientifically understood to have the best potential to eat and evade predators.
Consequently, host feeding can be fine-tuned further. So, B should be leveraged to create a random-volume environment for the host. When Remora is attached to a host, the search area shrinks over a while.
The experimental validation of the proposed model is provided in detail. The proposed model is simulated using Python 3.6.5 tool on PC i5-8600k, GeForce 1050Ti 4 GB, 16 GB RAM, 250 GB SSD, and 1 TB HDD. The parameter settings are given as follows: learning rate: 0.01, dropout: 0.5, batch size: 5, epoch count: 50, and activation: ReLU.
Table 1 provides the results achieved by the GF-OSDL-ROA model under various measures and sums of folds. Fig. 3 is a graphical representation of sensitivity and specificity values achieved by the proposed model, whereas Fig. 4 shows the results achieved in terms of precision and accuracy. Finally, the F-score and Kappa’s graphical analysis results are shown in Fig. 5.

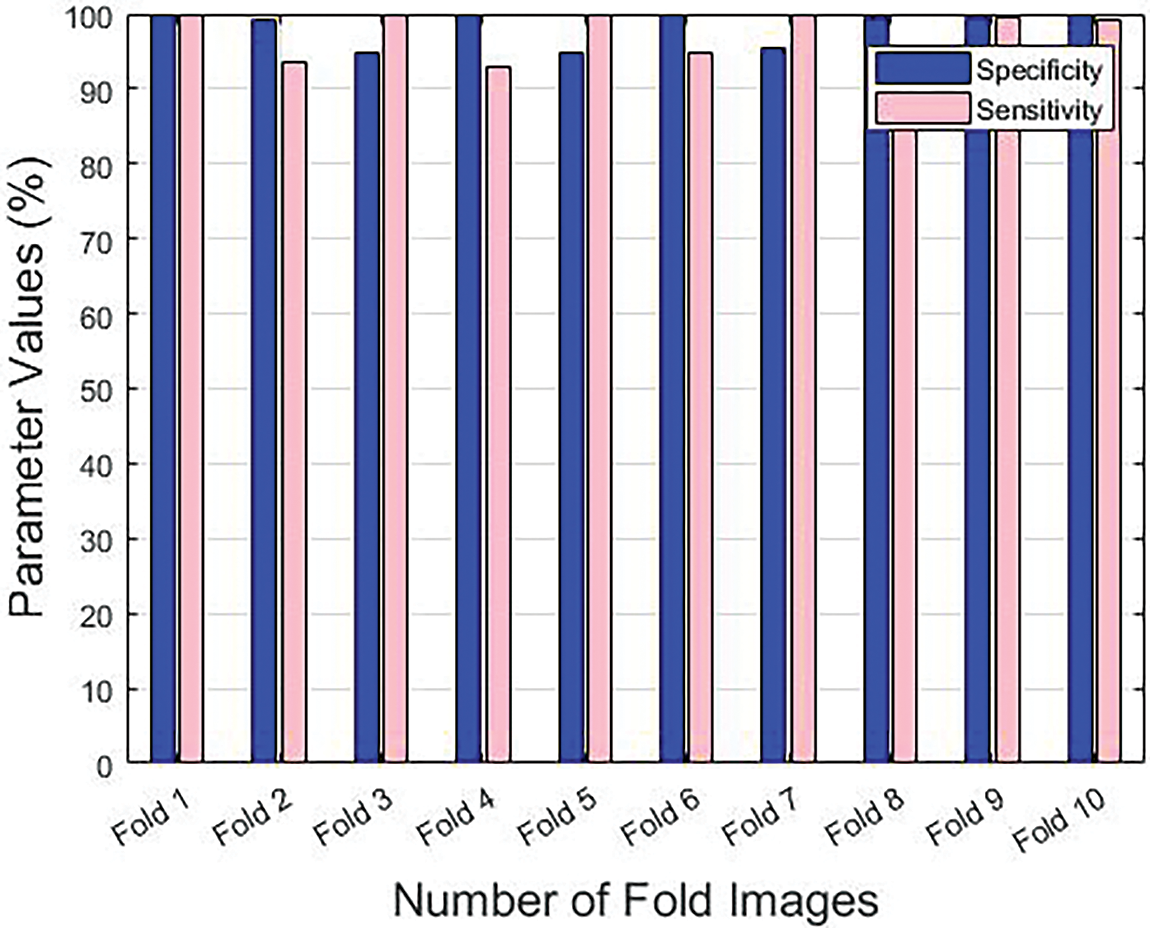
Figure 3: Sensitivity and specificity results achieved by the proposed model under different folds
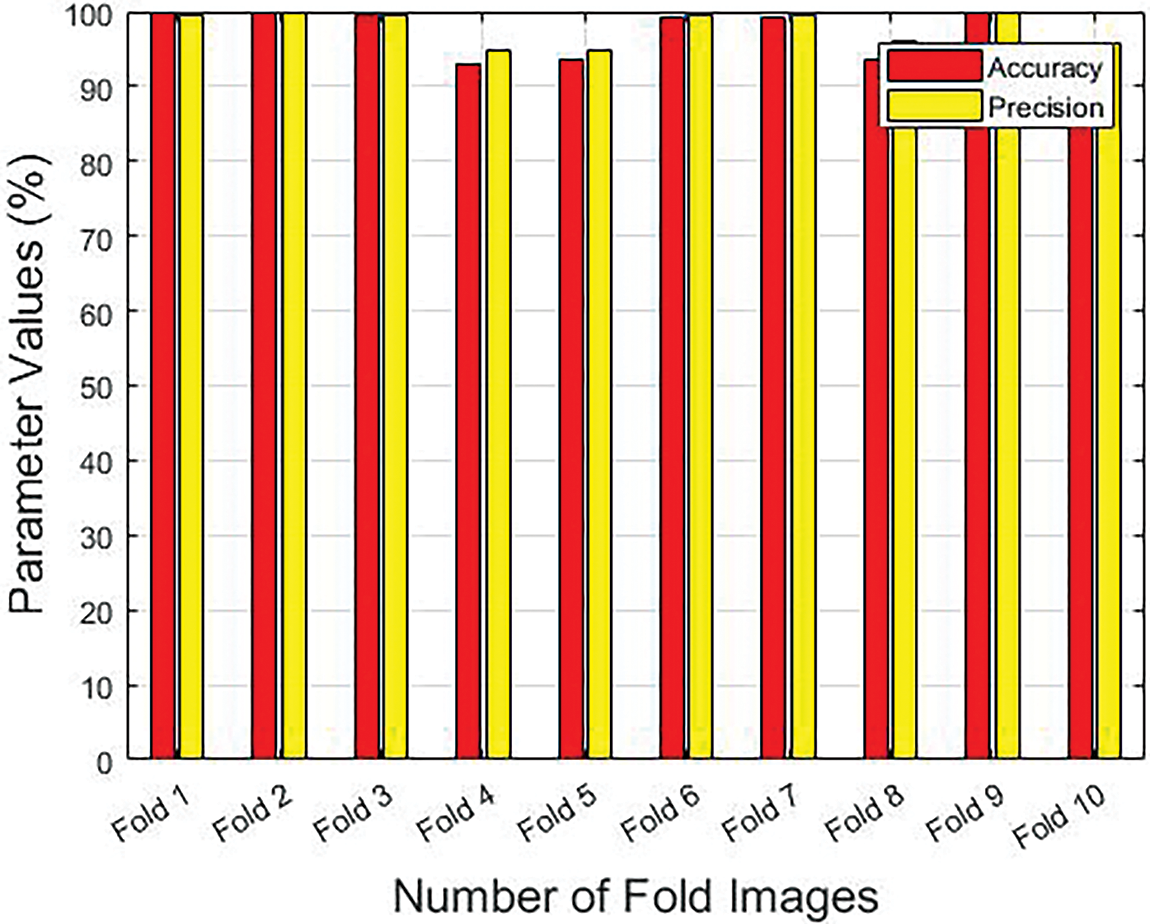
Figure 4: Precision and accuracy results achieved by the proposed model under different folds
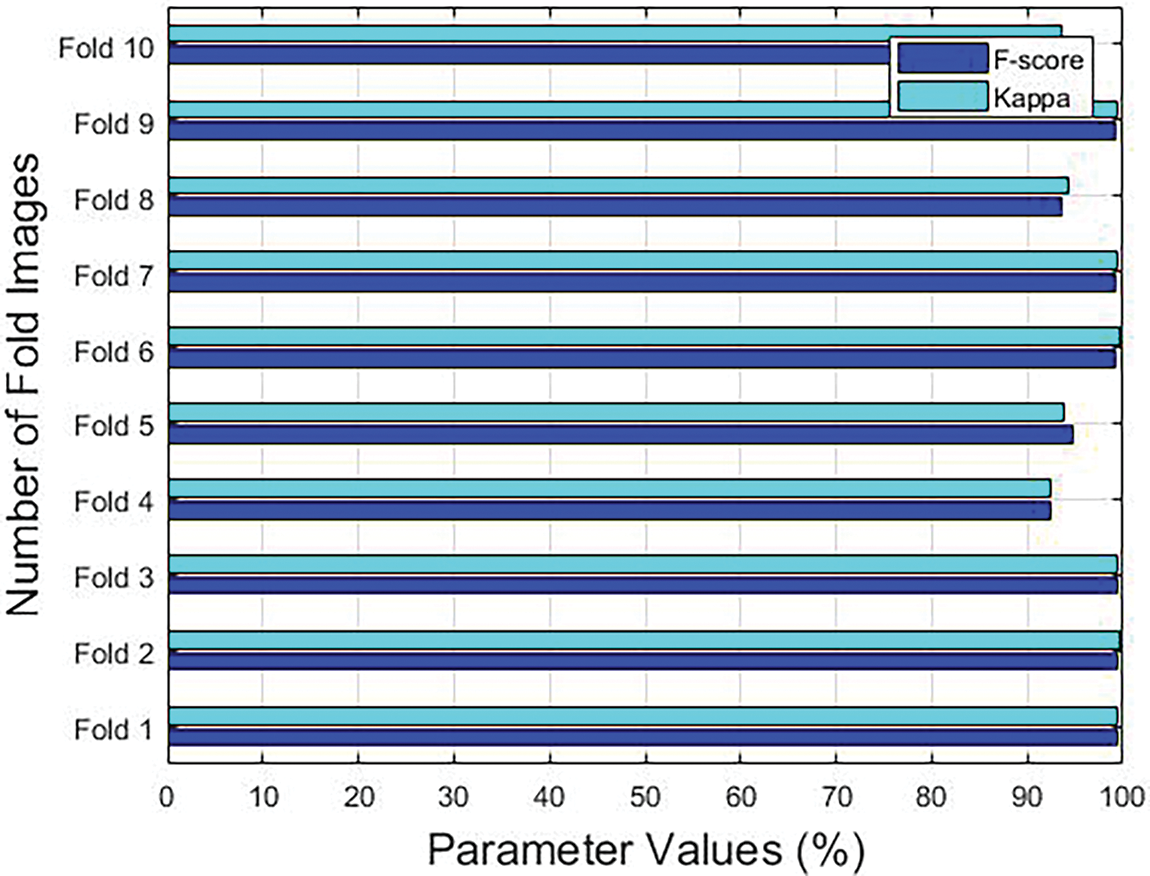
Figure 5: F-score and Kappa results accomplished by the proposed model under different folds
The proposed GF-OSDL-ROA model achieved peak sensitivity and specificity values such as 99.89% and 99.77%, respectively, under fold 1. Additionally, under fold 2, the GF-OSDL-ROA model yielded a 93.56% sensitivity and 99.19% specificity score. Further, the proposed GF-OSDL-ROA approach accomplished the highest sensitivity and specificity values, such as 99.87% and 94.75%, respectively, under fold 3. Furthermore, under fold 4, the GF-OSDL-ROA approach achieved a high specificity of 92.90% and high sensitivity of 99.97%. GF-OSDL-ROA showed 99.88% sensitivity and 94.74% specificity under fold 5, and the values are considered the best ones. Thus, under fold 6, the proposed GF-OSDL-ROA approach yielded 94.76% sensitivity and 99.84% specificity. High sensitivity and specificity (99.74% and 95.44%, respectively) were achieved using the newly-designed GF-OSDL-ROA technique under fold 7. In addition, when the GF-OSDL-ROA approach was used under fold 8, the best specificity of 93.80% and sensitivity of 99.47% were achieved. Further, under fold 9, using the GF-OSDL-ROA approach, the authors accomplished a superior sensitivity of 99.52% and a specificity of 99.554%. At the same time, the proposed GF-OSDL-ROA model attained a sensitivity of 99.10% and a specificity of 99.89% under fold 10.
Precision and accuracy values improved to 99.48% and 99.92%, respectively, when using the proposed GF-OSDL-ROA technique under fold 1. GF-OSDL-ROA also achieved the highest precision of 99.86% and an accuracy of 99.72%, respectively, under fold 2. It was found that the GF-OSDL-ROA technique attained a 99.67% precision and 99.38% accuracy when using fold 3. Further, the proposed GF-OSDL ROA model yielded a superior precision of 94.76% and an accuracy of 93% under fold 4. Fold 5 yielded a high precision (94.90%) and accuracy (93.57%) for the created GF-OSDL-ROA model. In addition, the suggested GF-OSDL–ROA model achieved a precision of 99.47% and an accuracy of 99.20% at fold 6. GF-OSDL-ROA’s precision and accuracy values were 99.57% percent and 99.12%, respectively, when tested under fold 7. GF-OSDL-ROA projected a precision of 95.97% and an accuracy of 93.51%, which were higher in fold 8. In addition, the proposed GF-OSDL-ROA technique achieved an extreme precision of 99.98% and an accuracy of 99.95% under fold 9. Finally, the proposed GF-OSDL-ROA model achieved 95.80% precision and 93.39% accuracy, correspondingly, when using fold 10.
With an F-score of 99.30% and a kappa of 99.41%, the proposed the GF-OSDL-ROA method was found to have performed well under fold 1. Under fold 2, GF-OSDL-ROA technique achieved a high F-score of 99.37% and a kappa of 99.58%. F-score and kappa values were 99.48% and 99.30%, respectively, when using the GF-OSDL-ROA framework under fold 3. As a result, under fold 4, the proposed GF-OSDL-ROA scheme achieved a high F-score of 92.48% and a high Kappa value of 92.46%; A perfect F-score of 94.68% was found under fold 5, in addition to an excellent kappa value of 93.75% by the proposed method. The proposed GF-OSDL-ROA model achieved optimal F-score and kappa scores such as 99.23% and 99.55% under fold 6. The best F-score (99.15%) and kappa values (99.51%) were achieved by the proposed GF-OSDL-ROA model under fold 7. At 93% and 94% F-score and Kappa values, the proposed GF-OSDL-ROA showed superior under fold 8. When applied under fold 9, the proposed GF-OSDL-ROA technique generated an F-score of 99.26% and a kappa value of 99.45%. GF-OSDL-ROA technique attained a high F-score 94.49% and a kappa of 93.58%, correspondingly, under fold 10. Based on these values listed in Table 2, it can be concluded that the proposed GF-OSDL-ROA model achieved the maximum average sensitivity and specificity value, i.e., 99.81% and 99.84%, average precision (99.84%), average accuracy (99.83%) with an average F-score of 99.82% and an average kappa-value of 99.51%.
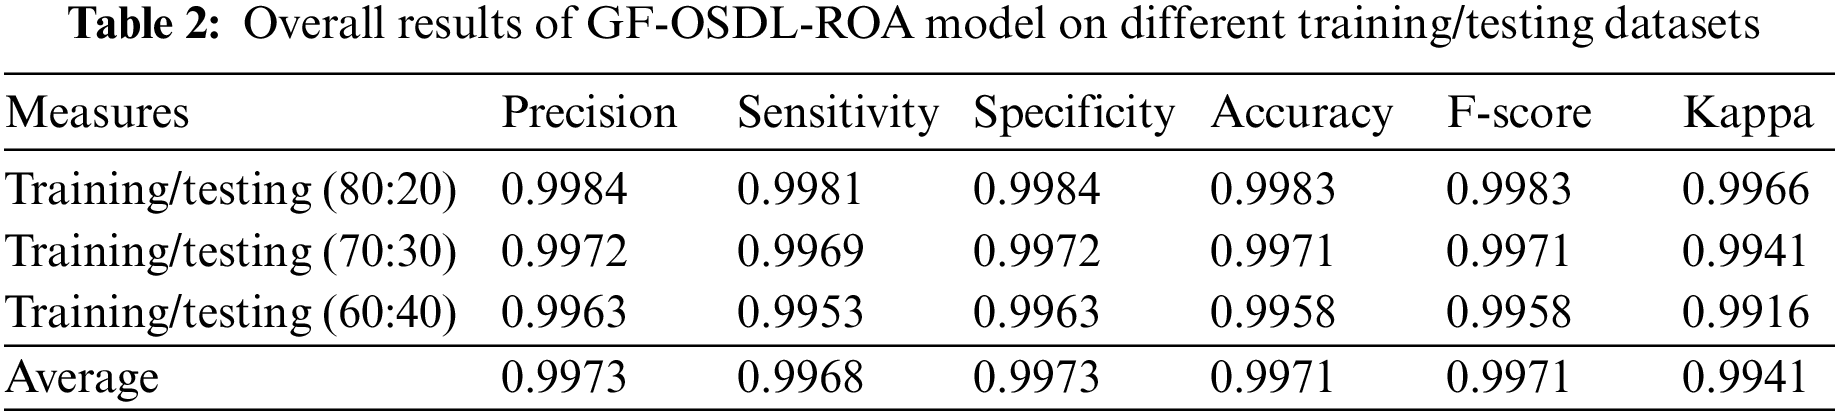
When using 80% of training data and 20% of testing data, the proposed GF-OSDL-ROA achieved the same accuracy and F-score value, i.e., 99.83%. 99.84% same value specificity and precision, 99.81% sensitivity, and 99.66% Kappa. The performance of the proposed model showed a few variations when experimented with using 70% of training data and 30% of testing data. For instance, the proposed GF-OSDL-ROA achieved 99.72% precision, 99.69% sensitivity, 99.72% specificity, 99.41% kappa, and 99.71% same accuracy with F-score values. In the experimental analysis, the proposed model achieved 99.16% Kappa, 99.53% sensitivity, 99.63% same specificity and precision values, and 99.58% same accuracy and F-score values when using 60% of training data and 40% of testing data. Finally, the proposed model achieved the average precision and specificity of 99.73%, 99.71% accuracy, F-score values, 99.68% sensitivity, and 99.41% of Kappa. Table 3 and Fig. 6 show the validated analysis results achieved by GF-OSDL-ROA and other existing deep learning classifiers when using 80% of training data and 20% of testing data.

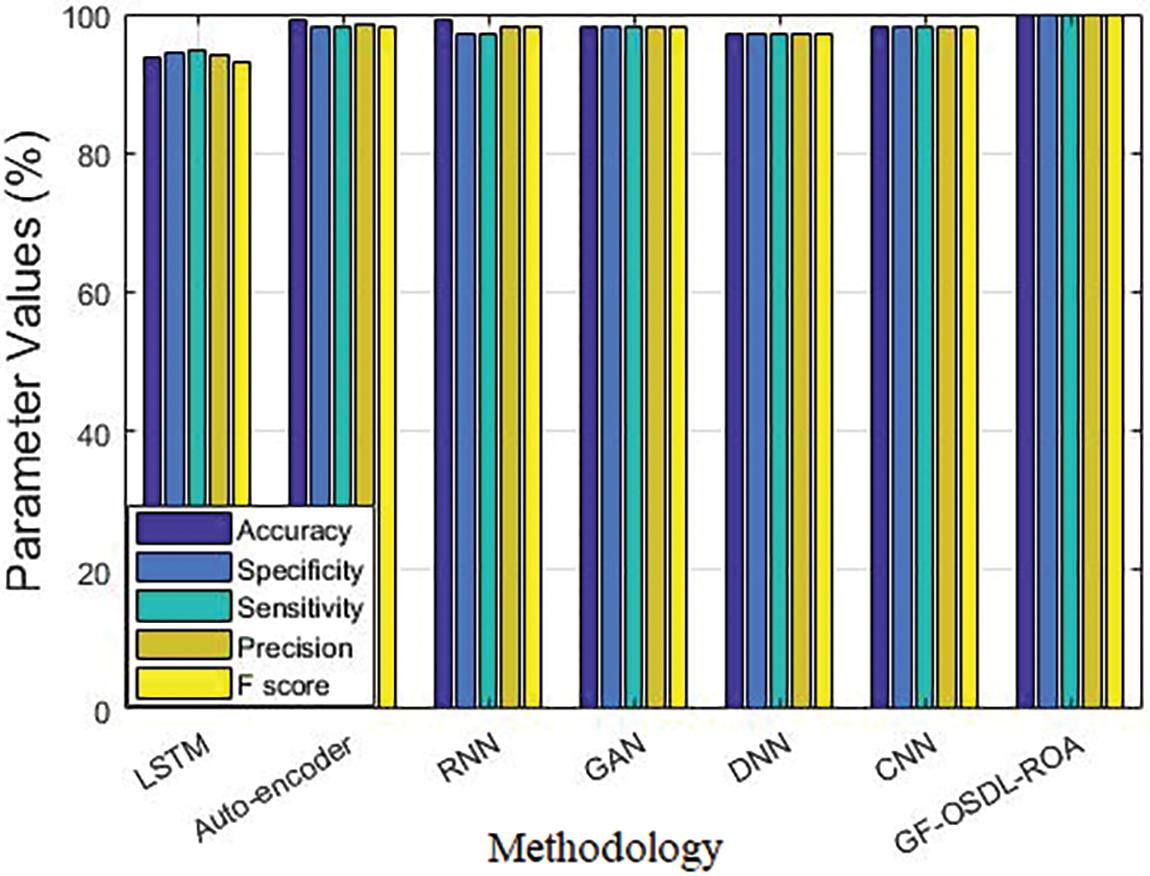
Figure 6: Comparative analysis results of the proposed model and other existing deep learning classifiers
In the accuracy analysis, LSTM achieved 94.08%, auto-encoder achieved 98.53%, RNN achieved 98.29%, GAN achieved 98.14%, DNN achieved 97.21%, CNN achieved 98.14%, and the proposed GF-OSDL-ROA achieved the highest accuracy, i.e., 99.83%. While the experiments were carried out in terms of sensitivity too, LSTM achieved 93.61%, auto-encoder achieved 99%, RNN achieved 99%, GAN achieved 98%, DNN achieved 97%, CNN achieved 98%, and the proposed GF-OSDL-ROA achieved the maximum sensitivity of 99.81%. In specificity validation analysis, LSTM achieved 94.56%, auto-encoder achieved 98%, RNN achieved 97%, GAN achieved 98%, DNN achieved 97%, CNN achieved 98%, and the proposed GF-OSDL-ROA achieved a superior specificity of 99.84%. In F-score analysis, auto-encoder, RNN, GAN, and CNN achieved 98%, DNN achieved 97%, LSTM achieved 93.20%, and the proposed GF-OSDL-ROA achieved the highest F-score of 99.83%. While all the techniques were tested for precision, auto-encoder, GAN, and CNN achieved 98%, RNN and DNN achieved 97%, LSTM achieved 94.85%, and the proposed model achieved a superior precision of 99.84%. For more experimental analysis, the proposed model was tested against pre-trained models in terms of accuracy. Various DN models such as 201, 169, and 121 achieved 92.90%, 91.20%, and 88.90% accuracy values, Xception model achieved 88.50%, Inception V3 achieved 89.40%, RN-101 model achieved 96.25%, and the proposed GF-OSDL-ROA model achieved a supreme accuracy of 99.83%.
CXR images can be used for the detection of classification of COVID-19 using the OSDL-based deep learning model suggested in this study. Using CXR pictures with the highest detection rate, this study aims at identifying various stages of COVID-19. Preprocessing includes the utilizing the GF model to remove any unwanted noise from the edges. SDL model is used to categorize CXR images under several stages, while ROA is used to alter the learning rate of SDL. With this dataset, the proposed OSDL model was validated for COVID-19 identification. The proposed model’s classification accuracy was found to be 99.993%, sensitivity 99.81%, and specificity 99.94%. Thus, the proposed method proved its superiority in all the measures compared to other existing algorithms. In the future, filtering algorithms can be added to this model to enhance the quality of images captured before processing. Highly advanced optimization and hybrid strategies can also be involved by fine-tuning the hyper-parameters such as epoch/dropout/number/motion function to achieve highly optimized performance.
Funding Statement: The authors received no specific funding for this study.
Conflicts of Interest: The authors declare that they have no conflicts of interest to report regarding the present study.
References
1. S. Sadhana, S. Pandiarajan, E. Sivaraman and D. Daniel, “AI-based power screening solution for SARS-COV2 infection: A sociodemographic survey and COVID-19 cough detector,” Procedia Computer Science, vol. 194, no. 9, pp. 255–271, 2021. [Google Scholar] [PubMed]
2. E. Mahase, “Coronavirus: COVID-19 has killed more people than SARS and MERS combined, despite lower case fatality rate,” BMJ, vol. 368, pp. m641, 2020. [Google Scholar] [PubMed]
3. U. Rani and R. K. Dhir, “Platform work and the COVID-19 pandemic,” The Indian Journal of Labour Economics, vol. 63, no. S1, pp. 163–171, 2020. [Google Scholar]
4. M. Ahmadi, A. Sharifi, S. Dorosti, S. J. Ghoushchi and N. Ghanbari, “Investigation of effective climatology parameters on COVID-19 outbreak in Iran,” Science of the Total Environment, vol. 729, no. 8, pp. 138705, 2020. [Google Scholar] [PubMed]
5. Y. Fang, H. Zhang, J. Xie, M. Lin, L. Ying et al., “Sensitivity of chest CT for COVID-19: Comparison to RT-PCR,” Radiology, vol. 296, no. 2, pp. E115–E117, 2020. [Google Scholar] [PubMed]
6. M. N. Ikeda, K. Imai, S. Tabata, K. Miyoshi, N. Murahara et al., “Clinical evaluation of self-collected saliva by quantitative reverse transcription-PCR (RT-qPCRdirect RT-qPCR, reverse transcription-loop-mediated isothermal amplification, and a rapid antigen test to diagnose COVID-19,” Journal of Clinical Microbiology, vol. 58, no. 9, pp. e01438-20, 2020. [Google Scholar]
7. M. L. Bastos, G. Tavaziva, S. K. Abidi, J. R. Campbell, L. P. Haraoui et al., “Diagnostic accuracy of serological tests for COVID-19: Systematic review and meta-analysis,” BMJ, vol. 370, pp. 1–13, 2020. [Google Scholar]
8. M. Rahimzadeh, A. Attar and S. M. Sakhaei, “A fully automated deep learning-based network for detecting COVID-19 from a new and large lung CT scan dataset,” Biomedical Signal Processing and Control, vol. 68, no. 1, pp. 102588, 2021. [Google Scholar] [PubMed]
9. D. Li, D. Wang, J. Dong, N. Wang, H. Huang et al., “False-negative results of real-time reverse-transcriptase polymerase chain reaction for severe acute respiratory syndrome coronavirus 2: Role of deep-learning-based CT diagnosis and insights from two cases,” Korean Journal of Radiology, vol. 21, no. 4, pp. 505, 2020. [Google Scholar] [PubMed]
10. F. Shi, J. Wang, J. Shi, Z. Wu, Q. Wang et al., “Review of artificial intelligence techniques in imaging data acquisition, segmentation and diagnosis for COVID-19,” IEEE Reviews in Biomedical Engineering, vol. 14, pp. 4–15, 2020. [Google Scholar]
11. G. Wang, X. Liu, C. Li, Z. Xu, J. Ruan et al., “A noise-robust framework for automatic segmentation of COVID-19 pneumonia lesions from CT images,” IEEE Transactions on Medical Imaging, vol. 39, no. 8, pp. 2653–2663, 2020. [Google Scholar] [PubMed]
12. A. A. Ardakani, A. R. Kanafi, U. R. Acharya, N. Khadem, A. Mohammadi et al., “Application of deep learning technique to manage COVID-19 in routine clinical practice using CT images: Results of 10 convolutional neural networks,” Computers in Biology and Medicine, vol. 121, no. 10229, pp. 103795, 2020. [Google Scholar] [PubMed]
13. L. Zhou, Z. Li, J. Zhou, H. Li, Y. Chen et al., “A rapid, accurate and machine-agnostic segmentation and quantification method for CT-based COVID-19 diagnosis,” IEEE Transactions on Medical Imaging, vol. 39, no. 8, pp. 2638–2652, 2020. [Google Scholar] [PubMed]
14. R. Ranjbarzadeh and S. B. Saadi, “Automated liver and tumor segmentation based on concave and convex points using fuzzy C-means and mean shift clustering,” Measurement, vol. 150, no. 2, pp. 107086, 2020. [Google Scholar]
15. X. Ouyang, J. Huo, L. Xia, F. Shan, J. Liu et al., “Dual-sampling attention network for diagnosis of COVID-19 from community acquired pneumonia,” IEEE Transactions on Medical Imaging, vol. 39, no. 8, pp. 2595–2605, 2020. [Google Scholar] [PubMed]
16. V. Rajinikanth, N. Dey, A. N. J. Raj, A. E. Hassanien, K. C. Santosh et al., “Harmony-search and otsu based system for coronavirus disease (COVID-19) detection using lung CT scan images,” arXiv preprint arXiv:2004.03431, 2004. [Google Scholar]
17. S. Minaee, R. Kafieh, M. Sonka, S. Yazdani, G. J. Soufi et al., “Deep-COVID: Predicting COVID-19 from chest X-ray images using deep transfer learning,” Medical Image Analysis, vol. 65, no. 12, pp. 101794, 2020. [Google Scholar] [PubMed]
18. D. P. Fan, T. Zhou, G. P. Ji, Y. Zhou, G. Chen et al., “Inf-Net: Automatic COVID-19 lung infection segmentation from CT images,” IEEE Transactions on Medical Imaging, vol. 39, no. 8, pp. 2626–2637, 2020. [Google Scholar] [PubMed]
19. X. Wang, X. Deng, Q. Fu, Q. Zhou, J. Feng et al., “A weakly-supervised framework for COVID-19 classification and lesion localization from chest CT,” IEEE Transactions on Medical Imaging, vol. 39, no. 8, pp. 2615–2625, 2020. [Google Scholar] [PubMed]
20. M. Barstugan, U. Ozkaya and S. Ozturk, “Coronavirus (COVID-19) classification using CT images by machine learning methods,” arXiv preprint arXiv:2003.09424, 2020. [Google Scholar]
21. H. Panwar, P. K. Gupta, M. K. Siddiqui, R. M. Menendez, V. Singh et al., “Application of deep learning for fast detection of COVID-19 in X-rays using nCOVnet,” Chaos, Solitons & Fractals, vol. 128, no. 3, pp. 109944, 2020. [Google Scholar]
22. S. Toraman, T. B. Alakus and I. Turkoglu, “Convolutional CapsNet: A novel artificial neural network approach to detect COVID-19 disease from X-ray images using capsule networks,” Chaos, Solitons & Fractals, vol. 140, no. 18, pp. 110122, 2020. [Google Scholar]
23. M. Nour, Z. Cömert and K. Polat, “A novel medical diagnosis model for COVID-19 infection detection based on deep features and Bayesian optimization,” Applied Soft Computing, vol. 97, no. Part A, pp. 106580, 2020. [Google Scholar] [PubMed]
24. R. F. Mansour, J. Escorcia-Gutierrez, M. Gamarra, D. Gupta, O. Castillo et al., “Unsupervised deep learning based variational autoencoder model for COVID-19 diagnosis and classification,” Pattern Recognition Letters, vol. 151, no. 151, pp. 267–274, 2021. [Google Scholar] [PubMed]
25. S. Ahuja, B. K. Panigrahi, N. Dey, V. Rajinikanth, T. K. Gandhi et al., “Deep transfer learning-based automated detection of COVID-19 from lung CT scan slices,” Applied Intelligence, vol. 51, no. 1, pp. 571–585, 2021. [Google Scholar] [PubMed]
26. T. Kaur, T. K. Gandhi and B. K. Panigrahi, “Automated diagnosis of COVID-19 using deep features and parameter free BAT optimization,” IEEE Journal of Translational Engineering in Health and Medicine, vol. 9, pp. 1–9, 2021. [Google Scholar]
27. K. K. Singh and A. Singh, “Diagnosis of COVID-19 from chest X-ray images using wavelets-based depthwise convolution network,” Big Data Mining and Analytics, vol. 4, no. 2, pp. 84–93, 2021. [Google Scholar]
28. A. Shamsi, H. Asgharnezhad, S. S. Jokandan, A. Khosravi, P. M. Kebria et al., “An uncertainty-aware transfer learning-based framework for COVID-19 diagnosis,” IEEE Transactions on Neural Networks and Learning Systems, vol. 32, no. 4, pp. 1408–1417, 2021. [Google Scholar] [PubMed]
29. Y. H. Wu, S. H. Gao, J. Mei, J. Xu, D. P. Fan et al., “JCS: An explainable COVID-19 diagnosis system by joint classification and segmentation,” IEEE Transactions on Image Processing, vol. 30, pp. 3113–3126, 2021. [Google Scholar] [PubMed]
30. M. Ragab, S. Alshehri, N. A. Alhakamy, W. Alsaggaf, H. A. Alhadrami et al., “Machine learning with quantum seagull optimization model for COVID-19 chest X-ray image classification,” Journal of Healthcare Engineering, vol. 2022, no. 1, pp. 1–13, 2022. [Google Scholar]
31. K. Shankar and E. Perumal, “A novel hand-crafted with deep learning features based fusion model for COVID-19 diagnosis and classification using chest X-ray images,” Complex & Intelligent Systems, vol. 7, no. 3, pp. 1277–1293, 2020. [Google Scholar]
32. D. Nandan, J. Kanungo and A. Mahajan, “An error-efficient Gaussian filter for image processing by using the expanded operand decomposition logarithm multiplication,” Journal of Ambient Intelligence and Humanized Computing, 2018. https://doi.org/10.1007/s12652-018-0933-x [Google Scholar] [CrossRef]
33. K. Shankar, E. Perumal, M. Elhoseny, F. Taher, B. B. Gupta et al., “Synergic deep learning for smart health diagnosis of COVID-19 for connected living and smart cities,” ACM Transactions on Internet Technology, vol. 22, no. 3, pp. 1–14, 2022. [Google Scholar]
34. K. Shankar, E. Perumal, V. G. Díaz, P. Tiwari, D. Gupta et al., “An optimal cascaded recurrent neural network for intelligent COVID-19 detection using chest X-ray images,” Applied Soft Computing, vol. 113, no. Part A, pp. 1–13, 2021. [Google Scholar]
35. C. S. S. Anupama, M. Sivaram, E. L. Lydia, D. Gupta and K. Shankar, “Synergic deep learning model-based automated detection and classification of brain intracranial hemorrhage images in wearable networks,” Personal and Ubiquitous Computing, 2020. https://doi.org/10.1007/s00779-020-01492-2 [Google Scholar] [CrossRef]
36. H. Jia, X. Peng and C. Lang, “Remora optimization algorithm,” Expert Systems with Applications, vol. 185, no. 2, pp. 115665, 2021. [Google Scholar]
Cite This Article
 Copyright © 2023 The Author(s). Published by Tech Science Press.
This work is licensed under a Creative Commons Attribution 4.0 International License , which permits unrestricted use, distribution, and reproduction in any medium, provided the original work is properly cited.
 Downloads
 Citation Tools