
 Submit a Paper
 Propose a Special lssue
 Open Access
ARTICLE

Classification of Electroencephalogram Signals Using LSTM and SVM Based on Fast Walsh-Hadamard Transform
1 Electronics and Communications Engineering Department, Al-Madinah Higher Institute for Engineering and Technology, Giza, 12947, Egypt
2 Department of Artificial Intelligence Engineering, Faculty of Computer Science and Engineering, King Salman International University (KSIU), South Sinai, 46511, Egypt
3 Department of Electrical Engineering, College of Engineering, Taif University, Taif, 21944, Saudi Arabia
4 Department of Electronics and Communications Engineering, October High Institute for Engineering and Technology, 6th of October City, Giza, 12596, Egypt
* Corresponding Author: Saeed Mohsen. Email:
Computers, Materials & Continua 2023, 75(3), 5271-5286. https://doi.org/10.32604/cmc.2023.038758
Received 28 December 2022; Accepted 10 March 2023; Issue published 29 April 2023
 View Full Text
 Download PDF
Abstract
Classification of electroencephalogram (EEG) signals for humans can be achieved via artificial intelligence (AI) techniques. Especially, the EEG signals associated with seizure epilepsy can be detected to distinguish between epileptic and non-epileptic regions. From this perspective, an automated AI technique with a digital processing method can be used to improve these signals. This paper proposes two classifiers: long short-term memory (LSTM) and support vector machine (SVM) for the classification of seizure and non-seizure EEG signals. These classifiers are applied to a public dataset, namely the University of Bonn, which consists of 2 classes –seizure and non-seizure. In addition, a fast Walsh-Hadamard Transform (FWHT) technique is implemented to analyze the EEG signals within the recurrence space of the brain. Thus, Hadamard coefficients of the EEG signals are obtained via the FWHT. Moreover, the FWHT is contributed to generate an efficient derivation of seizure EEG recordings from non-seizure EEG recordings. Also, a k-fold cross-validation technique is applied to validate the performance of the proposed classifiers. The LSTM classifier provides the best performance, with a testing accuracy of 99.00%. The training and testing loss rates for the LSTM are 0.0029 and 0.0602, respectively, while the weighted average precision, recall, and F1-score for the LSTM are 99.00%. The results of the SVM classifier in terms of accuracy, sensitivity, and specificity reached 91%, 93.52%, and 91.3%, respectively. The computational time consumed for the training of the LSTM and SVM is 2000 and 2500 s, respectively. The results show that the LSTM classifier provides better performance than SVM in the classification of EEG signals. Eventually, the proposed classifiers provide high classification accuracy compared to previously published classifiers.Keywords
Almost 1% of people in the world suffer from epilepsy, a disease in which seizures ocuur repeatedly [1]. Epilepsy limits human’s behavior because of abnormal electrical signals in the brain. Patients experience different symptoms based on the location of the brain’s abnormal signals. When a seizure occurs, patients may lose consciousness and there is a danger of injury or even death. Epilepsy is caused by the occurrence of seizures regularly, and epilepsy represents a nervous system syndrome [2]. Its recurrence occurs due to disability in the body’s movement [3]. More than 60% have epileptic seizures, while only 20% have generalized epilepsy. These percentages are according to the international league against epilepsy [4]. The essential requirement for neurosurgeons is the test of the epileptogenic zone (EZ) prior to the surgical step. One of the non-invasive diagnostic tools is the EEG, which can be classified via machine and deep learning classifiers [5–14]. It is used to track the characteristics of brain activity [15]. Scalp EEG is a technique used to involve placing sensors on the scalp for a brief duration of time. The traditional EEG-based technique for epilepsy diagnosis is tested by eminently qualified neurologists and doctors [16]. In this paper, two classifiers: LSTM and SVM with an FWHT technique, are proposed to classify EEG signals, and the objective of the paper is to increase the classifiers’ accuracy. The FWHT technique decomposes non-seizure and seizure signals and is utilized to extract the features from the decomposed EEG signals. In other words, the FWHT is employed to transform the domain of the signals (i.e., from time to frequency domain). The SVM classifier is applied with the FWHT technique. This classifier is used to classify the retrieved features in order to assess the proposed work’s performance in categorizing non-seizure and seizure EEG signals. The LSTM and SVM classifiers are tested on the dataset available [17], namely the University of Bonn dataset. The primary contributions of the paper are highlighted as follows:
• Implementing the LSTM and SVM classifiers to classify EEG signals;
• Applying the FWHT technique to generate an efficient derivation of seizure EEG recordings from non-seizure EEG recordings, and analyzing the EEG signals within the recurrence space;
• Achieving the highest test accuracy of the two proposed classifiers by evaluating their performance via various evaluation metrics with the University of Bonn dataset;
• Validating the performance of the proposed classifiers by the technique of k-fold cross-validation.
The organization of the paper is as follows: Section 2 reviews the related work. Section 3 explains the methodology of the proposed classifiers, illustrates the architectures of the LSTM and SVM classifiers with the FWHT technique, clarifies how to capture features based on EEG signals, and introduces the dataset description of EEG signals. Section 4 covers the results, while Section 5 presents a discussion of these results. Section 6 introduces the conclusions of the presented work.
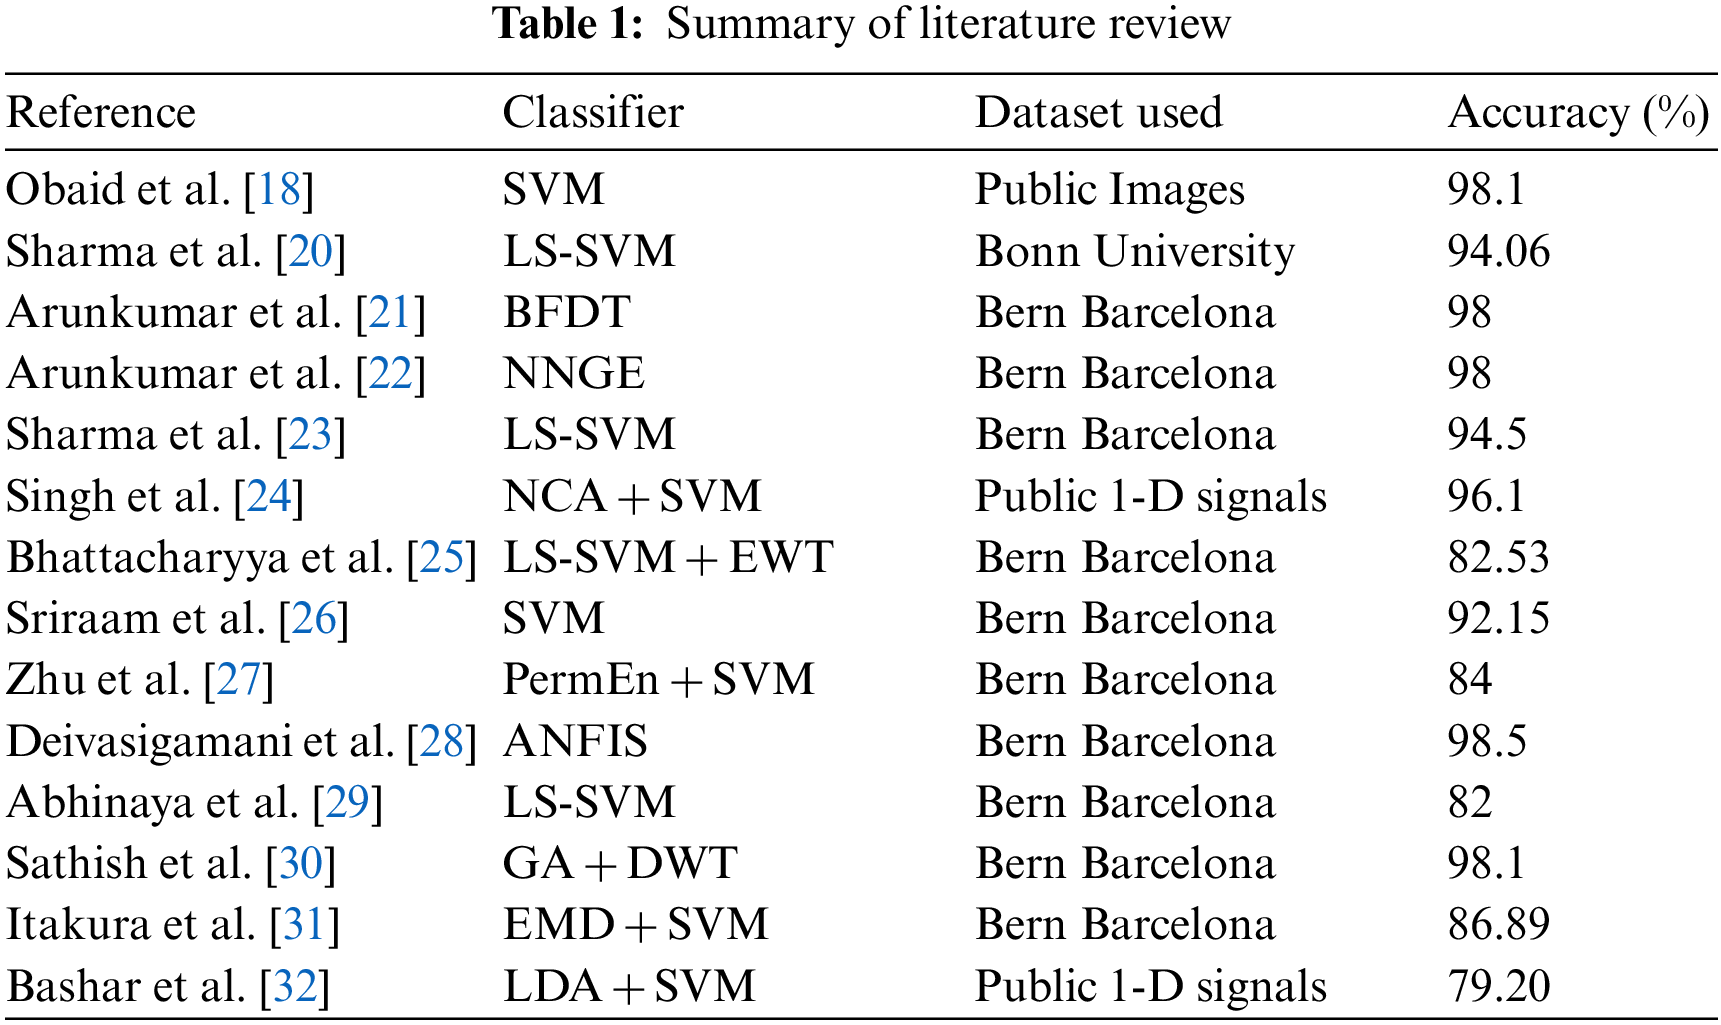
In the literature, several classifiers have been developed as tools to help neurologists identify the EZ. In [18], Obaid et al. introduced many machine learning classifiers for healthcare challenges [19] to support a solution. In [20], Sharma et al. presented an LS-SVM classifier depended on the tunable-Q wavelet transform, which was employed in the separation of the non-seizure and seizure. In [21], a best first decision tree (BFDT) classifier was proposed to identify non-seizure and seizure, which entails testing the performance of creating an output using 50 combinations of non-seizure and seizure EEG signals. Arunkumar et al. [22] presented calculations to the sample entropy, Reyni’s entropy, and approximate entropy for electroencephalogram raws and fed them into a non-nested generalized exemplars (NNGE) classifier to separate the non-seizure and seizure which achieved an accuracy of 98%. In [23], Sharma et al. proposed orthogonal wavelet filter banks to decompose sub-bands and achieved high accuracy of 94.5%. Singh et al. [24] applied a neighborhood component analysis (NCA) with a support vector machine (SVM) classifier to categorize the non-seizure and seizure EEG signals, with a sensitivity of 97.6%, an accuracy of 96.1%, and a specificity of 94.4%.
In [25], Bhattacharyya et al. presented analyzing of the EEG signals depending on the empirical wavelet transform (EWT). Sriraam et al. [26] applied an SVM classifier to classify non-seizure and seizure, which was implemented based on many features. This classifier improved the testing accuracy, specificity and sensitivity to 92.15%, 89.74%, and 94.56%, respectively. In [27], Zhu et al. localized the EZ via a delay permutation entropy (PermEn) technique with an SVM classifier. In [28], Deivasigamani et al. proposed a design of an adaptive neuro-fuzzy inference system (ANFIS) for discriminating between non-seizure and seizure cases. This classifier enhanced the specificity, accuracy, and sensitivity to 100%, 98.5%, and 98%, respectively. In [29], an LS-SVM classifier tacked the entropy features, which were captured from the EEG signals [20] to identify the seizure. For this classifier, the accuracy reached 82%. In [30], a genetic algorithm (GA) was presented to choose the optimum features from statistical features, which were extracted from a discrete wavelet transform (DWT). This algorithm was utilized to extract the features, and the best performance was achieved by engaging. In [31], non-seizure and seizure signals were identified via an empirical mode decomposition (EMD) technique with an SVM classifier to obtain the extracted entropy features, to achieve 86.89% accuracy. In [32], Bashar et al. introduced a linear discriminant analysis (LDA) with an SVM classifier to discriminate among non-seizure and seizure EEG signals. However, the achieved accuracy of this technique was 79.20%. All classifiers in the reviewed literature still need enhancements to obtain. Table 1 presents a comparison between the literature review.
The LSTM and SVM classifiers are employed here to classify EEG signals. The proposed classifiers are chosen due to their robust performance. The LSTM is discovered to be convenient for processing data that consists of time series [33]. The advantage of the LSTM is avoiding the problem of vanishing gradient [34]. The SVM has several advantages; it performs well when a number of samples is less than a number of dimensions. Thus, the SVM classifier is effective with high dimensional spaces [35]. Fig. 1 shows the block diagram of the proposed classifiers. A pre-processing is applied to the utilized dataset, then the data is split into two parts: the first part is used for training phase, while the second part is utilized for testing phase. Also, hyper-parameters of the proposed classifiers are tuned during the training process. The hyper-parameters of the proposed classifiers i.e., the loss and activation functions, the optimizer type, learning rate, number of training epochs, dropout rate, batch size, and number of neurons for the utilized layers in the proposed classifiers, are found to significantly affect the accuracy of the proposed classifiers, and high performance achieved is highly correlated to the optimal settings applied. After the training, the best classifier is evaluated using different evaluation metrics.

Figure 1: The block diagram of the proposed classifiers
3.1 Long Short-Term Memory (LSTM)
Fig. 2 and Table 2 illustrate the proposed LSTM classifier architecture. The classifier consists of an input layer, five LSTM layers, three dropout layers, a fully connected layer, and an output layer. The input layer receives one channel of EEG data. The input shape of the channel has a length of 178 and 1 feature. The LSTM layers are applied with a ReLU activation function. They are used to capture time series features. The LSTM layers have a different numbers of neurons, i.e., 64, 128, and 32. The dropout layers drop 20% of the neurons. The fully connected layer is set to 250 neurons. The layer of output utilizes a sigmoidal function. The input layer, namely a LSTM layer, while the output layer is represented by a Dense layer. For this classifier, a cost function is utilized to assess the loss between the actual and the expected values. The utilized optimizer for this LSTM is Adam. This classifier is learned for 50 training epochs with a batch size of 200. The total trainable parameters are 447, 733. The hidden units of the LSTM layers include three gates with a memory cell. These gates are input, forget, and output [36]. These gates are calculated via Eqs. (1)–(3) [36], while Eqs. (4)–(6) [36] represent ĉ(t), Ct, and ht parameters, where ĉ(t) is a new cell state, Ctrepresents the current cell state, and ht is the current hidden state output of the current cell.

Figure 2: The proposed LSTM classifier architecture

3.2 Support Vector Machine (SVM)
The proposed SVM classifier is implemented to categorize seizure and non-seizure EEG data. The theory of statistical learning in [37,38] is utilized to express the SVM classifier. A hyperplane is utilized in the proposed SVM to separate all the features related to EEG signals into distinct classes [37]. The mathematical formula of the SVM classifier and the expression for a kernel function are expressed in Eqs. (7) and (8) [39].
In this work, the used values of
3.3 Support Vector Machine (SVM) with FWHT
Fig. 3 demonstrates the block diagram of the implemented SVM classifier with the FWHT technique. The proposed SVM is used to classify non-seizure and seizure EEG signals; it is based on the FWHT technique, which converts the EEG signals from time into frequency [43]. The features are extracted from EEG signals using the FWHT [44].
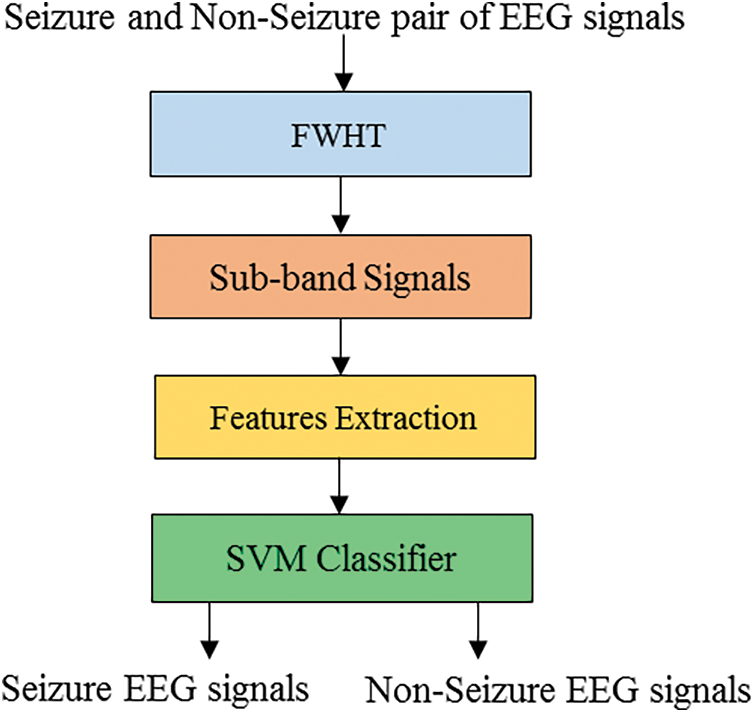
Figure 3: Block diagram of the SVM classifier to classify the seizure and non-seizure pairs of EEG data
Walsh functions are created by decomposing the EEG signal in terms of rectangular waveforms with a series of orthogonal. Each function has a value of + 1 or −1 [45]. The FWHT technique is executed via functions of subtraction and addition. FWHT is a transformation used to recognize the EEG signals more accurately. The EEG signals’ samples with a 2n length are translated to 2n coefficients via the FWHT. Walsh Hadamard Transformation (WHT) is an example of a generic class of Fourier transforms. The WHT can convert an EEG signal into an orthogonal and non-sinusoidal signal. This method is accomplished by converting a signal into a series of rectangular and orthogonal signals known as Walsh functions. There are no multipliers in it either. The WHT can be used to compress EEG signals. It is suitable in the medical profession, due to it is faster in computing Walsh-Hadamard coefficients and requires less storage space [32]. Assume a signal x(t) has a length of N. For the x(t), the forward and inverse Walsh transformations pair are as follows:
where the WAL function is defined as follows:
For k = 1, 2, 3,….
For k = 0
For k = 1, the WAL2 is:
For k = 2, the WAL4 is:
Substituting Eq. (10) into Eq. (11),
Fig. 4 shows the Hadamard coefficients deconstructed for the Bonn datasets. The FWHT technique is a combining of a sequence of data with a length 1-N, and a Walsh matrix has a length N-N. The positives of this technique are: it needs a small amount of storage space for the decomposed coefficients. In addition, the reconstruction of signals is quicker. The signal length for the utilized FWHT is equal to a power of two. If the length of the signal is smaller than two, a compensating is considered for this loss “zeros are appended”. The FWHT is utilized to assess the signals of EEG based on the Bonn dataset. The sample size for this dataset is 4,096 “212”. Thus, there are 4,096 Hadamard coefficients.

Figure 4: Hadamard coefficients for the university of Bonn dataset
One of the essential phases in classifying the performance of the SVM is extracting the features of the EEG signals. Here, two features: MC [46] and EE [47], are used to recognize EEG data: seizure and non-seizure. The MC is used to investigate the nonlinear correlation between different stochastic processes using two Gaussian kernel functions
where A and B are considered as random variables, E is the operator of expectation, while the mixture coefficient is
The function width is estimated by ζ, and the desired range for ζ is from 0.1 to 2. The mean of the characteristics generated from sub-band signals obtained after the decomposition of the ‘x’ and ‘y’ pairs EEG data was convenient for distinguishing seizure and non-seizure EEG signals [49–52].
3.5 University of Bonn Dataset
For the proposed classifiers, the trained EEG dataset is the Bonn dataset. It has 500 files of EEG records and contains EEG sectors of a single-channel with one hundred signals [17]. A and B are classes of the dataset, and represent audio recordings of healthy individuals opening and closing their eyes. The epileptic subjects in the C and D classes were recorded during the interictal period when seizures were not occurring. The epileptic subject’s records during seizure activity are classified as E class. A visual examination is used to remove artifacts. The classifying of non-seizure and seizure EEG data is the subject of this work. As a result, only classes C and D are utilized for this work. The EEG data with a length of 23.6 s is recorded from seizure epileptic individuals in the C and D groups. Electroencephalogram signals are recorded at EZ utilizing depth electrodes and classified as class D, while EEG signals are stored from the hippocampus formation of the opposite hemisphere of the brain and classified as class C. The sampling frequency of the signals is 173.61 Hz, and each EEG record has 4,096 samples. The signals in the collection have a total duration of 23.6 s. Fig. 5 depicts EEG signal samples from classes C and D.
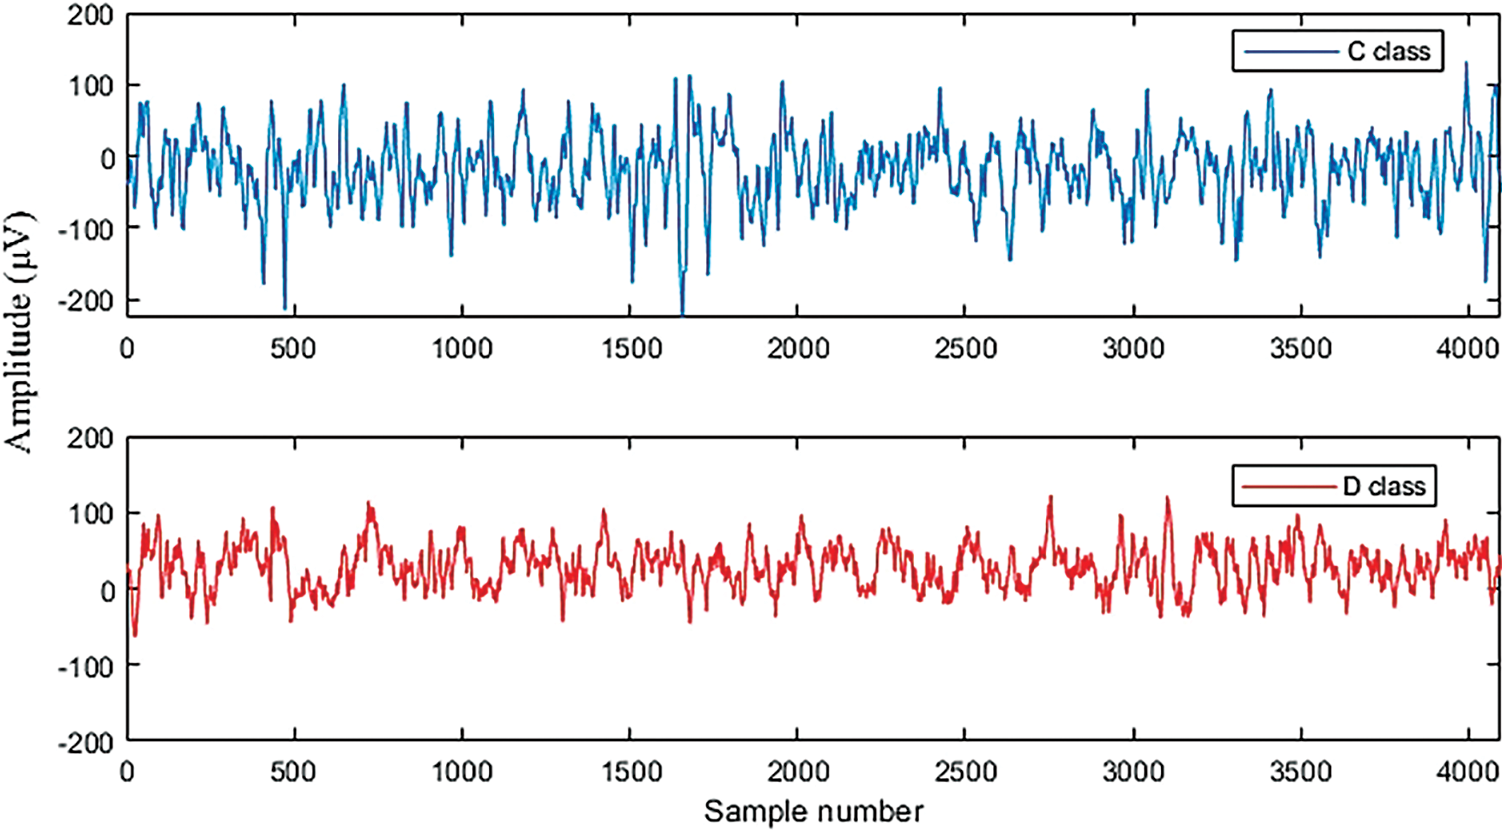
Figure 5: EEG signal samples of the dataset of the Bonn university
The proposed LSTM and SVM classifiers are tested using non-seizure and seizure EEG recordings obtained from the University of Bonn dataset. Fig. 6 demonstrates the testing and training accuracy for the LSTM over 50 epochs. The training, yellow, curve starts at 65.11% and reaches 99.91%. Similarly, the test, green curve starts at 88.43% and increases to 99.00%. Fig. 7 represents the training and testing loss for the LSTM. The training loss starts from 0.9175 and decreases to 0.0029 after 50 epochs, while the test loss curve starts at 0.4755 and decreases to 0.0602.

Figure 6: Training and testing accuracy curves for the LSTM classifier
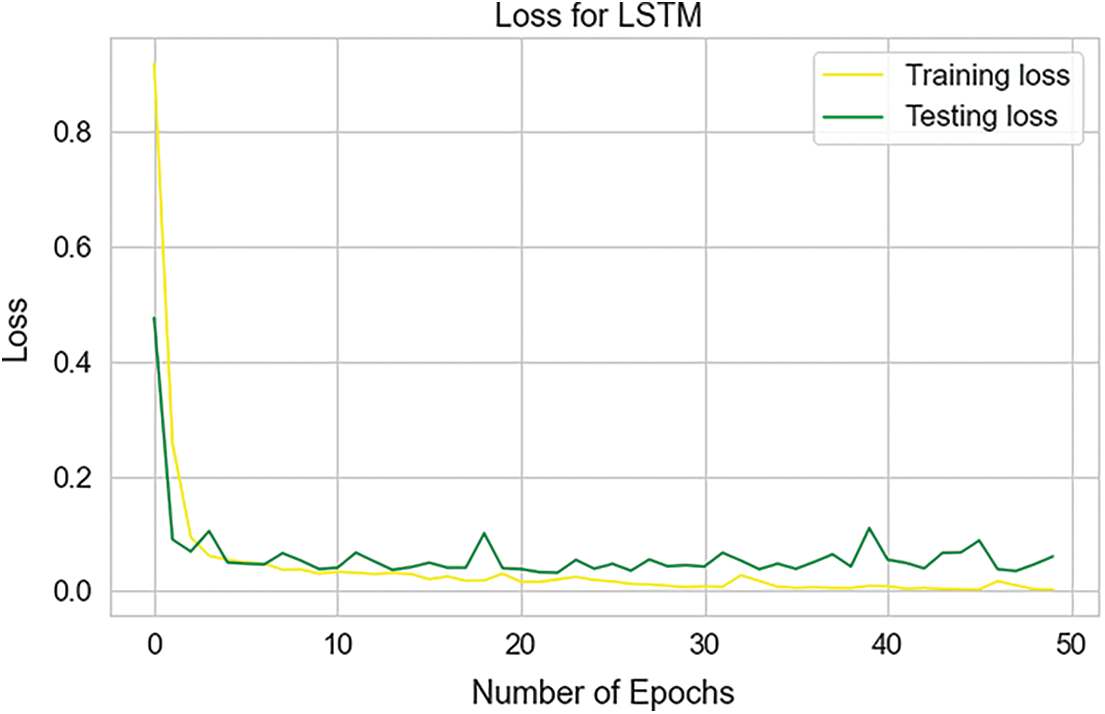
Figure 7: Loss curves of testing and training for the LSTM classifier
Table 3 presents a report of the assessing metrics for the LSTM. This report depends on the recall, precision, and F1-score of the LSTM classifier, to assess the performance of the Bonn dataset. The weighted average recall, precision, and F1-score are 99.00%.

Fig. 8 demonstrates the confusion matrix for the LSTM based on the dataset of testing. Here, there are 2277 samples correctly classified. True label matched the predicted label for the Seizure and Non-Seizure in 1840, 437 classes, respectively. For the LSTM classifier, the normalized confusion matrix is shown in Fig. 9. It has a classification accuracy of 1 for Seizure class and 0.96 for Non-Seizure class, whereas only 0.037 and 0.0033 are classification errors as the Seizure case and Non-Seizure case, respectively. According to this matrix, the LSTM classifier performs so well with minimal values of error, which occur above and below the diagonal of this matrix.

Figure 8: The confusion matrix of the LSTM classifier
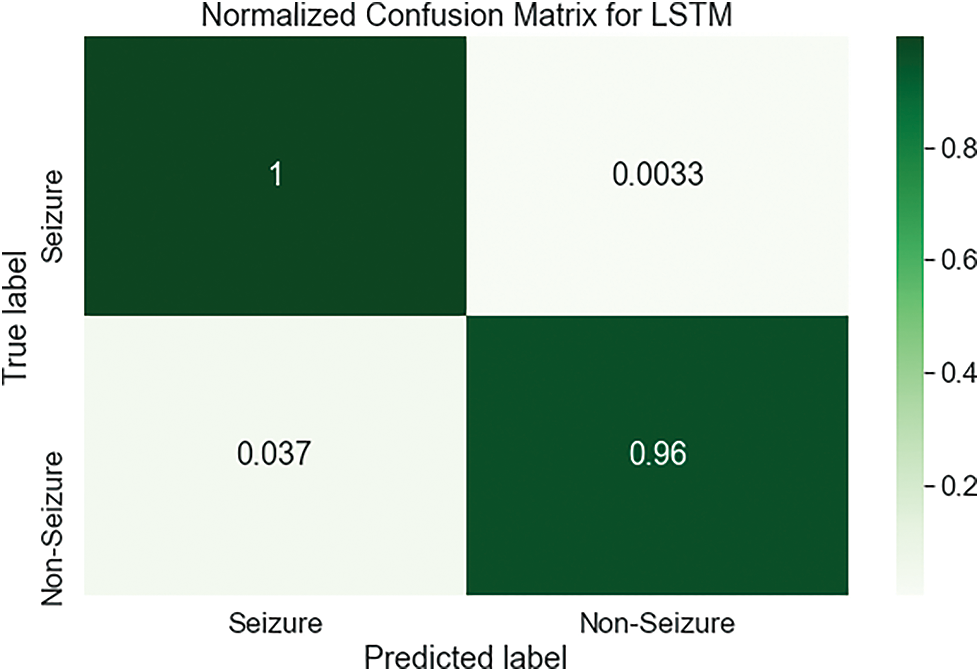
Figure 9: The normalized confusion matrix of the LSTM classifier
Table 4 illustrates the performance of the proposed classifiers using the k-fold cross-validation technique. In this technique, the dataset is divided into five equal partitions (4 partitions are utilized for training and one partition for validation), where k denotes the partition number and equals 5. The proposed classifiers are repeatedly trained five times using various partitioning of the dataset. According to this division, the average accuracy for the SVM is 91.92% with ± 0.39% standard deviation, while the average precision is 91.95% with ± 0.50% standard deviation. Similarly, the average recall is 93.97% with ± 0.41% standard deviation, and the average F1-score is 91.94% with ± 0.32% standard deviation. For the LSTM, the average accuracy, precision, recall, and F1-score are 99.32%, 99.29%, 99.45%, and 99.52%, respectively, while the standard deviations are ± 0.47%, ± 0.58%, ± 0.52%, and ± 0.41%, respectively. Therefore, the proposed LSTM classifier has the best performance, with the minimum standard deviation. Moreover, the k-fold cross-validation technique improved the classifiers’ performance and avoided the biasing of the performance results via a convenient division of the training and testing dataset.

The proposed SVM classifier is tested using non-seizure and seizure EEG recordings obtained from the University of Bonn dataset. The Hadamard coefficients for individual pairings of non-seizure and seizure EEG data are calculated in this work by transforming the time domain signals into frequency-dependent signals and by applying the FWHT analysis to nonlinear characteristics. The Hadamard coefficients of the EEG recordings are utilized to extract judicious features to identify non-seizure and seizure. For the SVM, the performance in terms of accuracy is 91%, while sensitivity is 93.52, and specificity is 91.3%. The performance of the classifiers is compared to previously published works based on the dataset of the University of Bonn, as shown in Table 5. The proposed LSTM achieved less training time, so it has the lowest computational performance when compared to published previous works [53–55].

Fig. 10 demonstrates a comparison of the proposed classifiers in terms of the performance with existing works [53–55], which were trained on the dataset of the university of Bonn. The proposed classifiers are also shown to surpass the existing works depending on the accuracy metric. The advantages of the proposed classifiers are high computational efficiency and consistency. As discussion, the high accuracy of the proposed classifiers is achieved due to the utilized dataset having huge size. In addition, the LSTM classifier is convenient for processing time sequences of the dataset, while the SVM classifier is convenient with high dimensional spaces of the dataset. Also, the technique of k-fold cross-validation contributed to increasing the classifiers’ accuracy.

Figure 10: Comparison of the performance between the proposed and existing works based on the dataset of Bonn university
This paper presents an implementation of two classifiers “LSTM and SVM”, to develop an automatic diagnosis tool for the classification of non-seizure and seizure EEG signals, to aid neurologists in locating the EZ for medical judgment. The features of the EEG signals are processed via the FWHT technique, which converts the EEG recordings into discrete series. The proposed FWHT is used to extract MC and EE features from sub-band EEG signals. These features give substantial accuracy when using the SVM to classify EEG signals. The classifiers achieved the lowest computational performance based on the training time. The achieved training time of the SVM and LSTM classifiers are 2250 and 2000 s, respectively. Also, the implemented classifiers achieved maximum accuracy when compared to published previous works. The FWHT technique is employed to transform the domain of the signals (i.e., from time to frequency domain) by analyzing the EEG signals within the recurrence space. Thus, Hadamard coefficients of the EEG signals are obtained via the FWHT. The results obtained from the classifiers are compared with previous studies, and the performance is evaluated. The LSTM classifier achieved a testing accuracy of 99%, while the SVM classifier had an accuracy of 91%. Also, the performance of the LSTM classifier is enhanced via k-fold cross validation technique, which achieved an accuracy of 99.32%. In the future, the proposed work will be improved by using other deep-learning classifiers to diagnose other diseases, such as neurodegenerative disorders and mental problems.
Acknowledgement: The authors would like to thank the support of the Taif University Researchers Supporting Project TURSP 2020/34, Taif University, Taif Saudi Arabia for supporting this work.
Funding Statement: This research was funded by “TAIF UNIVERSITY RESEARCHERS SUPPORTING PROJECT”, grant number TURSP-2020/34, Taif University, Taif, Saudi Arabia.
Conflicts of Interest: The authors declare they have no conflicts of interest to report regarding the present study.
References
1. D. Wu, J. Zhang and Q. Zhao, “Multimodal fused emotion recognition about expression-EEG interaction and collaboration using deep learning,” IEEE Access, vol. 8, pp. 133180–133189, 2020. [Google Scholar]
2. S. Mohsen and A. G. Alharbi, “EEG-Based human emotion prediction using an LSTM model,” in The 64th IEEE Int. Midwest Symp. on Circuits and Systems (MWSCAS), Michigan, USA, pp. 458–461, 2021. [Google Scholar]
3. Z. Lian, L. Duan, Y. Qiao, J. Chen, J. Miao et al., “The improved ELM algorithms optimized by bionic WOA for EEG classification of brain computer interface,” IEEE Access, vol. 9, pp. 67405–67416, 2021. [Google Scholar]
4. C. Park, G. Choi, J. Kim, S. Kim, T. -J. Kim et al., “Epileptic seizure detection for multi-channel EEG with deep convolutional neural network,” in Int. Conf. on Electronics, Information, and Communication (ICEIC), Honolulu, HI, USA, pp. 1–5, 2018. [Google Scholar]
5. K. Shaukat, S. Luo, V. Varadharajan, I. A. Hameed, S. Chen et al., “Performance comparison and current challenges of using machine learning techniques in cybersecurity,” Energies, vol. 13, no. 10, pp. 2509, 2020. [Google Scholar]
6. K. Shaukat, S. Luo, V. Varadharajan, I. A. Hameed and M. Xu, “A survey on machine learning techniques for cyber security in the last decade,” IEEE Access, vol. 8, pp. 222310–222354, 2020. [Google Scholar]
7. T. M. Alam, K. Shaukat, I. A. Hameed, S. Luo, M. U. Sarwar et al., “An investigation of credit card default prediction in the imbalanced datasets,” IEEE Access, vol. 8, pp. 201173–201198, 2020. [Google Scholar]
8. U. Javed, K. Shaukat, I. A. Hameed, F. Iqbal, T. M. Alam et al., “A review of content-based and context-based recommendation systems,” International Journal of Emerging Technologies in Learning, vol. 16, no. 3, pp. 274–306, 2021. [Google Scholar]
9. M. Khushi, K. Shaukat, T. M. Alam, I. A. Hameed, S. Uddin et al., “A comparative performance analysis of data resampling methods on imbalance medical data,” IEEE Access, vol. 9, pp. 109960–109975, 2021. [Google Scholar]
10. T. M. Alam, K. Shaukat, M. Mushtaq, Y. Ali, M. Khushi et al., “Corporate bankruptcy prediction: An approach towards better corporate world, The Computer Journal, vol. 64, no. 11, pp. 1731–1746, 2021. [Google Scholar]
11. K. Shaukat, S. Luo, S. Chen and D. Liu, “Cyber threat detection using machine learning techniques: A performance evaluation perspective,” in 2020 Int. Conf. on Cyber Warfare and Security (ICCWS), Islamabad, Pakistan, pp. 1–6, 2020. [Google Scholar]
12. L. S. Mokatren, R. Ansari, A. E. Cetin, A. D. Leow, O. A. Ajilore et al., “EEG classification by factoring in sensor spatial configuration,” IEEE Access, vol. 9, pp. 19053–19065, 2021. [Google Scholar]
13. L. L. Chen, J. Zhang, J. Z. Zou, C. J. Zhao and G. S. Wang, “A framework on wavelet-based nonlinear features and extreme learning machine for epileptic seizure detection,” Biomedical Signal Processing and Control, vol. 10, no. 1, pp. 1–10, 2014. [Google Scholar]
14. J. Chen, K. Li, Z. Zhang, K. Li and P. S. Yu, “A survey on applications of artificial intelligence in fighting against COVID-19,” ACM Computing Surveys, vol. 54, no. 8, pp. 1–32, 2022. [Google Scholar]
15. L. Zhao, K. Li, B. Pu, J. Chen, S. Li et al., “An ultrasound standard plane detection model of fetal head based on multi-task learning and hybrid knowledge graph,” Future Generation Computer Systems, vol. 135, pp. 234–243, 2022. [Google Scholar]
16. J. Chen, K. Li, H. Rong, K. Bilal, N. Yang et al., “A disease diagnosis and treatment recommendation system based on big data mining and cloud computing, Information Sciences, vol. 435, pp. 124–149, 2018. [Google Scholar]
17. R. G. Andrzejak, K. Schindler and C. Rummel, “Nonrandomness, nonlinear dependence, and nonstationarity of electroencephalographic recordings from epilepsy patients,” Physical Review E-Statistical, Nonlinear, Bilogical, and Soft Matter Physics, vol. 86, no. 4, pp. 046206, 2012. [Google Scholar]
18. O. I. Obaid, M. A. Mohammed, M. K. Abd Ghani, S. A. Mostafa and F. T. Al-Dhief, “Evaluating the performance of machine learning techniques in the classification of wisconsin breast cancer,” International Journal of Engineering and Technology, vol. 7, no. 4.36, pp. 160–166, 2018. [Google Scholar]
19. A. A. Mutlag, M. K. Abd Ghani, M. A. Mohammed, M. S. Maashi, O. Mohd et al., “MAFC: Multi-agent fog computing model for healthcare critical tasks management,” Sensors (Switzerland), vol. 20, no. 7, pp. 1853, 2020. [Google Scholar]
20. R. Sharma, M. Kumar, R. B. Pachori and U. R. Acharya, “Decision support system for focal EEG signals using tunable-Q wavelet transform,” Journal of Computational Science, vol. 20, pp. 52–60, 2017. [Google Scholar]
21. N. Arunkumar, K. R. Kumar and V. Venkataraman, “Entropy features for focal EEG and non focal EEG,” Journal of Computational Science, vol. 27, pp. 440–444, 2018. [Google Scholar]
22. N. Arunkumar, K. R. Kumar and V. Venkataraman, “Classification of focal and non focal EEG using entropies,” Pattern Recognition Letters, vol. 94, pp. 112–117, 2017. [Google Scholar]
23. M. Sharma, A. Dhere, R. B. Pachori and U. R. Acharya, “An automatic detection of focal EEG signals using new class of time–frequency localized orthogonal wavelet filter banks,” Knowledge-Based Systems, vol. 118, pp. 217–227, 2017. [Google Scholar]
24. P. Singh and R. B. Pachori, “Classification of focal and nonfocal EEG signals using features derived from Fourier-based rhythms,” Journal of Mechanics in Medicine and Biology, vol. 17, no. 7, pp. 1740002, 2017. [Google Scholar]
25. A. Bhattacharyya, M. Sharma, R. B. Pachori, P. Sircar and U. R. Acharya, “A novel approach for automated detection of focal EEG signals using empirical wavelet transform,” Neural Computating and Applications, vol. 29, pp. 47–57, 2018. [Google Scholar]
26. N. Sriraam and S. Raghu, “Classification of focal and non focal epileptic seizures using multi-features and SVM classifier,” Journal of Medical Systems, vol. 41, no. 10, pp. 160, 2017. [Google Scholar] [PubMed]
27. G. Zhu, Y. Li, P. P. Wen, S. Wang and M. Xi, “Epileptogenic focus detection in intracranial EEG based on delay permutation entropy,” AIP Conference Proceedings, vol. 1559, no. 31, pp. 31–36, 2013. [Google Scholar]
28. S. Deivasigamani, C. Senthilpari and W. H. Yong, “Classification of focal and nonfocal EEG signals using ANFIS classifier for epilepsy detection,” International Journal of Imaging Systems and Technology, vol. 26, no. 4, pp. 277–283, 2016. [Google Scholar]
29. B. Abhinaya and D. Charanya, “Feature extraction and selection of a combination of entropy features for real-time epilepsy detection,” International Journal of Advanced Trends in Computer Science and Engineering, vol. 5, no. 4, pp. 16073–16078, 2016. [Google Scholar]
30. E. Sathish, N. Sivakumaran, S. P. Simon and S. Raghavan, “Genetic algorithm based feature selection for classification of focal and non-focal intracranial electroencephalographic signals,” Journal of Scientific and Industrial Research, vol. 76, no. 10, pp. 614–619, 2017. [Google Scholar]
31. T. Itakura and T. Tanaka, “Epileptic focus localization based on bivariate empirical mode decomposition and entropy,” in Asia-Pacific Signal and Information Processing Association Annual Summit and Conf. (APSIPA ASC), Kuala Lumpur, Malaysia, pp. 1426–1429, 2017. [Google Scholar]
32. M. K. Bashar, F. Reza, Z. Idris and H. Yoshida, “Epileptic seizure classification from intracranial EEG signals: A comparative study EEG-based seizure classification,” in IEEE EMBS Conf. on Biomedical Engineering and Sciences (IECBES), Kuala Lumpur, Malaysia, pp. 96–101, 2016. [Google Scholar]
33. A. Khorram, M. Khalooei and M. Rezghi, “End-to-end CNN + LSTM deep learning approach for bearing fault diagnosis,” Applied Intelligence, vol. 51, no. 2, pp. 736–751, 2021. [Google Scholar]
34. P. Malhotra, L. Vig, G. Shroff and P. Agarwal, “Long short term memory networks for anomaly detection in time series,” in 23rd European Symp. on Artificial Neural Networks, Computational Intelligence and Machine Learning (ESANN), Bruges, Belgium, pp. 89–94, 2015. [Google Scholar]
35. S. Karamizadeh, S. M. Abdullah, M. Halimi, J. Shayan and M. J. Rajabi, “Advantage and drawback of support vector machine functionality,” in 2014 Int. Conf. on Computer, Communications, and Control Technology (I4CT), Langkawi, Malaysia, pp. 63–65, 2014. [Google Scholar]
36. S. Mohsen, A. Elkaseer and S. G. Scholz, “Industry 4.0-oriented deep learning models for human activity recognition,” IEEE Access, vol. 9, pp. 150508–150521, 2021. [Google Scholar]
37. L. S. Zaremba and W. H. Smoleński, “Optimal portfolio choice under a liability constraint,” Annals of Operations Research, vol. 97, pp. 131–141, 2000. [Google Scholar]
38. V. N. Vapnik, The Nature of Statistical Learning Theory. 2nd ed., New York, NY: Springer, pp. XX–314, 2000. [Google Scholar]
39. A. H. Khandoker, D. T. H. Lai, R. K. Begg and M. Palaniswami, “Wavelet-based feature extraction for support vector machines for screening balance impairments in the elderly,” IEEE Transactions on Neural Systems Rehabilitation Engineering, vol. 15, no. 4, pp. 587–597, 2007. [Google Scholar] [PubMed]
40. A. K. Vasan, R. Harikumar and M. L. Kumar, “Performance analysis of support vector machine (SVM) for optimization of fuzzy based epilepsy risk level classifications using different types of kernel functions from EEG signal parameters,” Proceedings of the International MultiConference of Engineers and Computer Scientists, vol. I, pp. 29–34, 2009. [Google Scholar]
41. R. Kohavi, “A study of cross-validation and bootstrap for accuracy estimation and model selection,” in Proc. of the Int. Joint Conf. on Artificial Intelligence (IJCAI), San Francisco, CA, USA, pp. 1137–1143, 1995. [Google Scholar]
42. K. Shaukat, S. Luo and V. Varadharajan, “A novel method for improving the robustness of deep learning-based malware detectors against adversarial attacks,” Engineering Applications of Artificial Intelligence, vol. 116, pp. 105461, 2022. [Google Scholar]
43. S. Sareen, S. K. Sood and S. K. Gupta, “An automatic prediction of epileptic seizures using cloud computing and wireless sensor networks,” Journal of Medical Systems, vol. 40, no. 226, pp. 1–18, 2016. [Google Scholar]
44. K. Saka, Ö. Aydemir and M. Öztürk, “Classification of EEG signals recorded during right/left hand movement imagery using fast walsh hadamard transform based features,” in 2016 39th Int. Conf. on Telecommunications and Signal Processing (TSP), Vienna, Austria, pp. 413–416, 2016. [Google Scholar]
45. S. Sareen, S. K. Sood and S. K. Gupta, “A Cloud-based seizure alert system for epileptic patients that uses higher-order statistics,” Computing in Science and Engineering, vol. 18, no. 5, pp. 56–67, 2016. [Google Scholar]
46. V. Gupta, A. Nishad and R. B. Pachori, “Focal EEG signal detection based on constant-bandwidth TQWT filter-banks,” in 2018 IEEE Int. Conf. on Bioinformatics and Biomedicine (BIBM), Madrid, Spain, pp. 2597–2604, 2019. [Google Scholar]
47. O. K. Fasil and R. Rajesh, “Time-domain exponential energy for epileptic EEG signal classification,” Neuroscience Letters, vol. 694, pp. 1–8, 2019. [Google Scholar]
48. B. Chen, X. Wang, N. Lu, S. Wang, J. Cao et al., “Mixture correntropy for robust learning,” Pattern Recognition, vol. 79, pp. 318–327, 2018. [Google Scholar]
49. R. Sharma, R. B. Pachori and S. Gautam, “Empirical mode decomposition based classification of focal and non-focal seizure EEG signals,” in 2014 Int. Conf. on Medical Biometrics, Shenzhen, China, pp. 135–140, 2014. [Google Scholar]
50. R. Sharma, R. B. Pachori and U. R. Acharya, “Application of entropy measures on intrinsic mode functions for the automated identification of focal electroencephalogram signals,” Entropy, vol. 17, no. 2, pp. 669–691, 2015. [Google Scholar]
51. R. Sharma, R. B. Pachori and U. Rajendra Acharya, “An integrated index for the identification of focal electroencephalogram signals using discrete wavelet transform and entropy measures,” Entropy, vol. 17, no. 8, pp. 5218–5240, 2015. [Google Scholar]
52. F. Mohammad and S. Al-Ahmadi, “Epileptic seizures diagnosis using amalgamated extremely focused EEG signals and brain MRI,” Computers, Materials & Continua, vol. 74, no. 1, pp. 623–639, 2023. [Google Scholar]
53. U. Rajendra Acharya, S. Vinitha Sree, A. P. C. Alvin and J. S. Suri, “Use of principal component analysis for automatic classification of epileptic EEG activities in wavelet framework,” Expert Systems with Applications, vol. 39, no. 10, pp. 9072–9078, 2012. [Google Scholar]
54. E. D. Übeyli, “Combined neural network model employing wavelet coefficients for EEG signals classification,” Digital Signal Processing, vol. 19, no. 2, pp. 297–308, 2009. [Google Scholar]
55. D. Chen, S. Wan and F. S. Bao, “Epileptic focus localization using discrete wavelet transform based on interictal intracranial EEG,” IEEE Transactions on Neural Systems Rehabilitation Engineering, vol. 25, no. 5, pp. 413–425, 2017. [Google Scholar] [PubMed]
Cite This Article
 Copyright © 2023 The Author(s). Published by Tech Science Press.
This work is licensed under a Creative Commons Attribution 4.0 International License , which permits unrestricted use, distribution, and reproduction in any medium, provided the original work is properly cited.
 Downloads
 Citation Tools