
 Submit a Paper
 Propose a Special lssue
 Open Access
ARTICLE
GRATDet: Smart Contract Vulnerability Detector Based on Graph Representation and Transformer
1 College of Information Science and Engineering, Xinjiang University, Urumqi, 830000, China
2 Key Laboratory of Signal Detection and Processing in Xinjiang Uygur Autonomous Region, Xinjiang University, Urumqi, 830000, China
3 Key Laboratory of Multilingual Information Technology in Xinjiang Uygur Autonomous Region, Xinjiang University, Urumqi, 830000, China
* Corresponding Author: Wenzhong Yang. Email:
Computers, Materials & Continua 2023, 76(2), 1439-1462. https://doi.org/10.32604/cmc.2023.038878
Received 01 January 2023; Accepted 10 March 2023; Issue published 30 August 2023
 View Full Text
 Download PDF
Abstract
Smart contracts have led to more efficient development in finance and healthcare, but vulnerabilities in contracts pose high risks to their future applications. The current vulnerability detection methods for contracts are either based on fixed expert rules, which are inefficient, or rely on simplistic deep learning techniques that do not fully leverage contract semantic information. Therefore, there is ample room for improvement in terms of detection precision. To solve these problems, this paper proposes a vulnerability detector based on deep learning techniques, graph representation, and Transformer, called GRATDet. The method first performs swapping, insertion, and symbolization operations for contract functions, increasing the amount of small sample data. Each line of code is then treated as a basic semantic element, and information such as control and data relationships is extracted to construct a new representation in the form of a Line Graph (LG), which shows more structural features that differ from the serialized presentation of the contract. Finally, the node information and edge information of the graph are jointly learned using an improved Transformer–GP model to extract information globally and locally, and the fused features are used for vulnerability detection. The effectiveness of the method in reentrancy vulnerability detection is verified in experiments, where the F1 score reaches 95.16%, exceeding state-of-the-art methods.Keywords
Blockchain [1], as a hot technology on the Internet, has gradually exerted its huge advantages and has given rise to many projects, Ethereum [2] being typical. Unlike Bitcoin, Ethereum has joined the smart contract [3], which makes it a richer application scenario. Smart contracts are deployed on the blockchain and cannot be changed once they are connected to the blockchain, which effectively eliminates interference from others and ensures the independent operation of the contract. However, the smart contract also brings some problems. Even if the smart contract is found to have vulnerabilities, the user cannot do anything about it. Facing huge economic losses, people can only solve the problem through a permanent divergence in the blockchain [4]. Currently, vulnerability detection technology for smart contracts is still immature. To prevent the risk of losses caused by threats, it is necessary and challenging to mine the vulnerabilities hidden in the contract code before it is deployed on the blockchain.
With the development of computing power in recent years, promoting breakthroughs in artificial intelligence, emerging deep learning technologies provide new potential for smart contract vulnerability detection. Traditional machine learning methods rely on artificial features extracted from static or dynamic analysis, which can be time-consuming and error-prone [5]. In contrast, the hierarchical structure of deep learning models can learn abstract and nonlinear patterns, capture the inherent structure and vulnerability characteristics of complex data, and discover vulnerability laws from massive datasets. Deep learning to detect the vulnerabilities of smart contracts can save labor costs and time, systematically detect vulnerabilities, and maintain the stability and development of the network.
Vulnerability detection based on deep learning has attracted much attention in recent years. Huang et al. [6] correspond byte codes to Red, Green, and Blue (RGB) colors, convert them to images, and use a convolutional neural network (CNN), which is widely used in the field of deep learning, to extract the implied information. Qian et al. [7] use natural language techniques for processing, lock the vulnerability fragments into code slices, construct contract snippet representations, and input the fragments into a Bidirectional Long Short-Term Memory Attention-based (BLSTM–ATT) model for vulnerability detection. Yu et al. [8] innovatively propose Vulnerability Candidate Slice and use a modular framework to learn rich semantic knowledge in Slice. However, these representations, based on sequenced text or binary images, leave out the rich structural information in the source code, making it difficult to mine deep vulnerability features in the contract. Zhuang and Liu et al. [9–11] construct a graph to show the syntactic and semantic features of the smart contract and mine the vulnerability information in it with the help of Graph Neural Network (GNN) techniques. This takes some time to complete the message iteration, and cannot model global information, making it difficult to perform satisfactory long-distance information capture.
To solve the above problems comprehensively, information needs to be propagated globally, allowing code fragments that are far apart to communicate directly, while co-learning structural information and code context, modeling complex code, and capturing latent semantic information. Given these considerations, this paper proposes a method based on graph representation and Transformer, called GRATDet. The method operates at the Solidity source code level and begins by addressing data imbalance through expansion on small sample data. Line-level code, as the basic component of code slicing, is then taken as the minimum granularity for model learning, and multiple line-level fragments of code are generated. To reflect the rich semantic information in the code, these fragments are used as nodes in which different types of edges are added, and a Line Graph (LG) is constructed to show the rich relationships inside the code. Finally, based on the transformer architecture of deep learning, the Transformer–GP model is proposed for contract vulnerability detection to overcome the limitations of GNN and Recurrent Neural Networks (RNN) models. The relationships between nodes are captured using a multi-headed self-attentive mechanism to model the global information. The information encoding of the edges in the graph is fused in the attention matrix to learn the inductive bias in the graph and complete the modeling of structural information. Further, node embedding generates an additional role vector, which is bound together with the vector learned through global attention. By utilizing the role vector to explore the graph information learned through the attention matrix, the model can highlight vulnerability information, allowing for deeper analysis. Experiments are conducted on reentrancy vulnerabilities which demonstrate the proposed method’s robustness and more competitive results. The main contributions of this paper are as follows:
1. A data augmentation method is designed that solves the category imbalance problem through syntactic analysis and function combination of Solidity source code.
2. A new code representation LG is proposed that incorporates multiple key information of the smart contract such as data relationships and control information, presenting the rich semantics of the code.
3. A Transformer–GP deep learning model is proposed that fuses global feature learning with local structure feature learning and shows excellent results in vulnerability detection.
The remainder of this paper is organized as follows. Section 2 introduces related work and the background. Section 3 explains the method in more detail. Section 4 presents evaluation methods, experimental results, and performance comparisons. Section 5 summarizes the work.
There are several well-known vulnerability detection tools. Mythril [12] is an officially recommended Ethereum security analytics tool that analyzes Ethereum Virtual Machine (EVM) bytecode, using symbolic execution, satisfiability modulo theories (SMT) solving, and smudge analysis to detect common vulnerabilities in various Ethereum smart contracts. Oyente [13] is a symbol-based execution vulnerability monitoring tool that can statically infer the path of a program, and its modular design allows users to insert their detection logic to check custom properties in their contracts. SmartCheck [14] is also a static analysis tool that converts Solidity source code into an XML-based intermediate representation and examines it against an XPath schema. Securify [15] is a security analysis tool for Ethereum. Its analysis consists of two steps. First, it analyzes symbolically the dependency graph of the contract to extract precise semantic information from the code. Compliance and violation patterns are then designed to demonstrate effectively whether the contract-related attributes are secure. Slither [16] is a static analysis framework that works by converting Solidity smart contracts into an intermediate representation called SlithIR, which preserves the semantic information lost when converted to bytecode. Slither allows the application of common program analysis techniques, such as data flow and taint tracking. Manticore [17] is an analysis tool based on symbolic analysis that executes a program with symbolic input and explores all possible states it can achieve. It can perform simulation environments that support any number of contract interactions, detect crashes and other failures in smart contracts, enumerate the execution status of contracts, and verify the security of critical functions.
These tools are based on rules formulated by experts but fail to meet the current demand for efficiency and accuracy. However, technologies based on deep learning are starting to emerge in the development of vulnerability detection.
Li et al. [18] performed vulnerability detection based on code gadgets, which are semantically interrelated lines of code. The sequences are encoded as vectors and input to a BLSTM to train the model to detect the presence of vulnerabilities. Russell et al. [19] combined neural networks with Random Forests (RF) for vulnerability detection. After mapping tokens to specific dimensions to obtain a vector matrix composed of tokens, the vulnerability features are extracted using CNN and RNN models and input to a random forest classifier for the final result decision. Ziems et al. [20] treat source code as text and use the Bidirectional Encoder Representation from Transformers (BERT) model for vulnerability mining. The model was pre-trained on an English Wikipedia dataset containing 2.5 billion words. The model was then fine-tuned using the specific task of text classification, ultimately achieving impressive results in the vulnerability detection task. Lin et al. [21] obtained a serialized form of Abstract Syntax Tree (AST) by Deep-First Traversal (DFT) to reveal the code semantics. After padding and truncation, equal-length sequences are obtained to represent the embedded code. The serialized AST is then provided to the sequential deep learning classifier BLSTM for vulnerability detection. Bilgin et al. [22] also performed vulnerability detection based on AST, which transformed the initial AST into a corresponding Binary AST and used a three-dimensional tuple to represent each node’s information. A Breadth-First Search (BFS) then traverses the binary tree starting from the root of the tree and connects the representations of each node to obtain a vector of a specific length containing code semantics for semantic analysis vulnerability mining using the CNN model. Wu et al. [23] proposed a method called Peculiar. Peculiar extracts the critical data flow graph of the contract and combines it with the use of a pre-trained model to accomplish vulnerability classification detection, achieving good results on reentrancy vulnerability. Zhou et al. [24] proposed a vulnerability identification model, Devign, to use GNN for vulnerability detection for the first time. The model encodes a source code function from multiple syntactic and semantic representations into a joint graph structure, learns data information by Gated Graph Sequence Neural Networks (GGNN), and designs a convolutional model to extract features for classification detection in the readout phase. Similarly, Wang et al. [25] established the vulnerability detection framework FUNDED, which uses an extended graph neural network to model multiple code relationships such as program control and program data, achieving a significant advantage when competing with other methods. Zhang et al. [26] proposed a hybrid deep learning model, CBGRU, which exploits the different features of models such as CNN and Bidirectional Gating Recurrent Unit (BiGRU) to extract feature values through two neural networks after completing word embedding and, finally, connects the different feature values to perform vulnerability classification detection. Wu et al. [27] proposed a hybrid attention mechanism model to detect security vulnerabilities in smart contracts. They extract smart contract fragments, transform them into fixed dimensional vectors, and use a single-headed attention encoder together with a multi-headed attention encoder to perform vulnerability detection. Table 1 shows a summary of the different vulnerability detection methods.
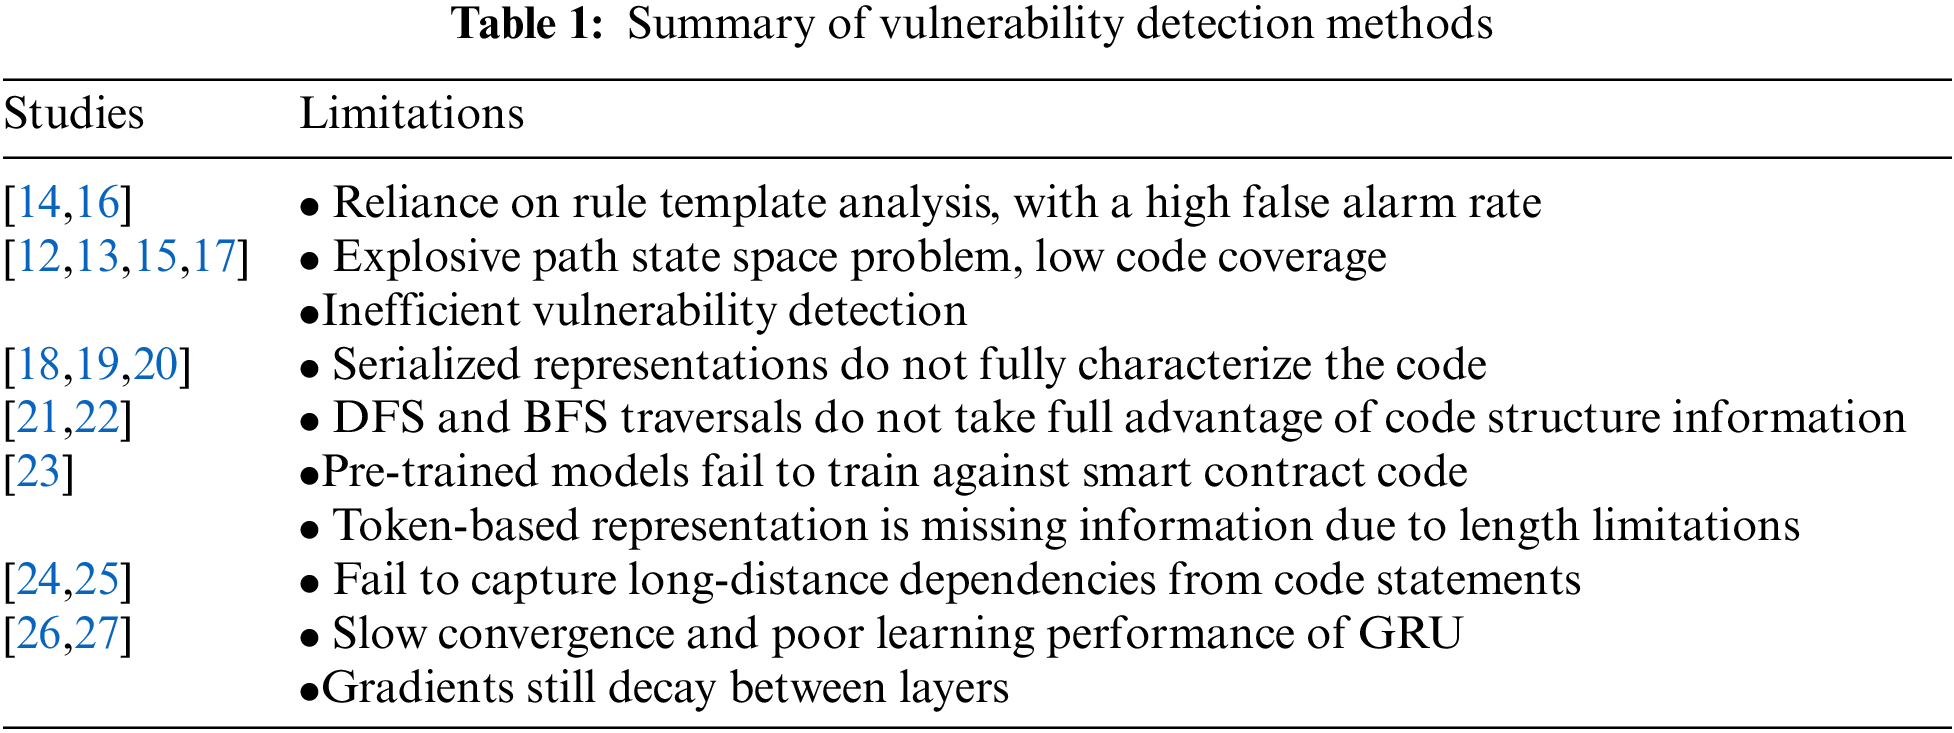
The reentrancy vulnerability, a classic vulnerability among smart contract vulnerabilities, is the cause of the famous DAO incident [4]. A classic example of a reentrancy vulnerability is shown in Fig. 1.
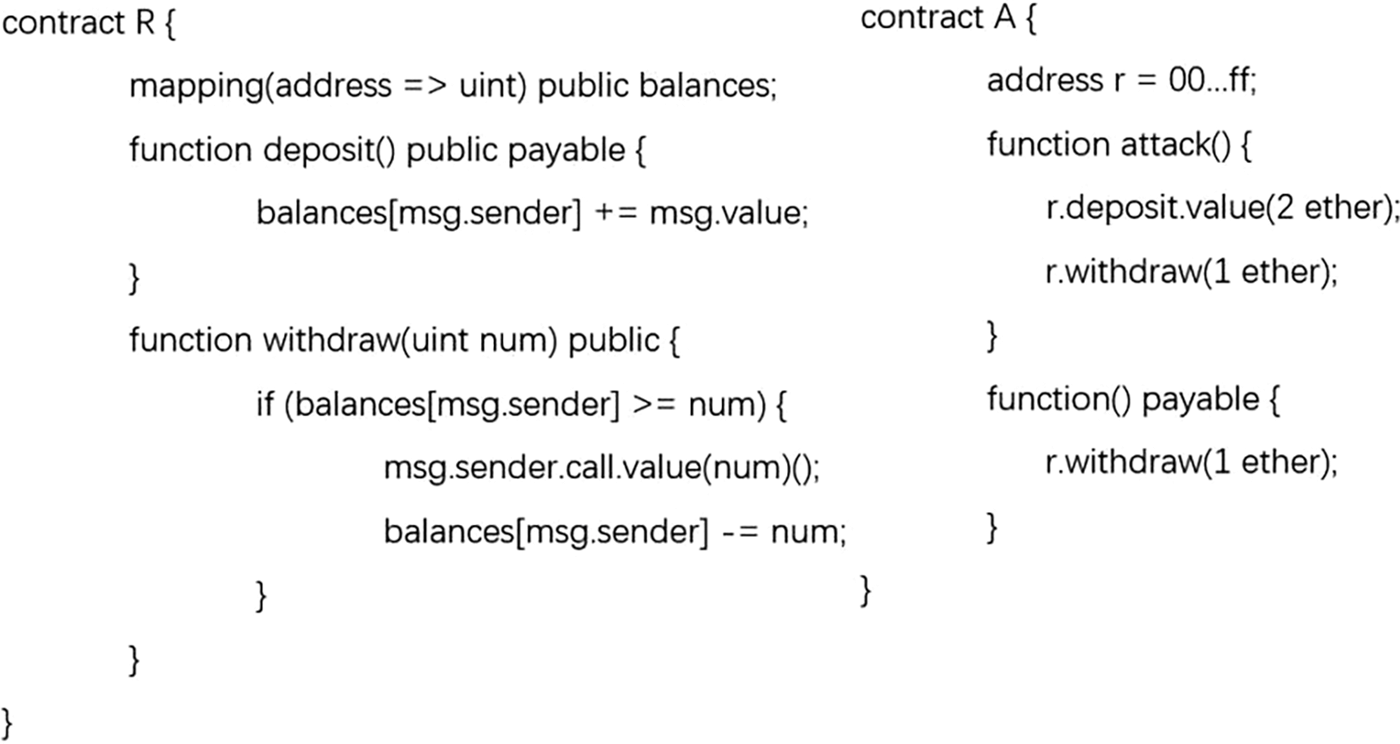
Figure 1: Example of a reentrancy vulnerability data and attacker
There are reentrancy vulnerabilities in the withdraw function of contract R, since external calls can be made between contracts. When contract A executes the R contract withdraw function to receive ether, the A contract fallback function will be triggered to execute the corresponding logic. If the executor of contract A is malicious, it can write its fallback function so that it calls the withdraw function again to take out the account balance multiple times before the account balance is updated. The operation of performing transactions in smart contracts is not limited to call.value. Sender and transfer are also available, but these have a gas limit and cannot perform unbridled operations. In contrast, call.value can call all gas out of the account, so call.value can be regarded as a prominent feature of reentrancy vulnerabilities.
The Transformer architecture [28] is widely used not only in the field of natural language processing but also in other fields such as computer vision and pseudocode generation [29,30]. It has achieved astounding results, with the encoder part playing a key role.
The architecture is formed by stacking several identical layers, each of which contains residual connections, layer normalization, and self-attentive modules. The self-attentive module is key as it models the relevance of all words of the input in parallel. Its input and output can be denoted by
The input elements of the Transformer are capable of exchanging information with each other. Without considering the position encoding, it is easy to think of Transformer as treating the data as a directed complete graph, which makes it possible to manipulate graph structures with this architecture later on.
The work cited above [6–11,18–27] has explored the combination of code information and models from different perspectives to apply the advantages of deep learning techniques to vulnerability detection. However, the methods still have some limitations. On the one hand, the performance in the smart contract example in Fig. 1 is based on structure, and some serialized data feature mining based on natural language processing does not consider the logic of the code. On the other hand, traditional deep learning models such as RNN and GNN are based on local information transfer, which requires a certain amount of time to complete global information iteration and cannot fundamentally learn the global information for vulnerability detection. To address these issues, this paper introduces the GRATDet method based on the Transformer encoder. The method initially represents the contract as LG, using its structured representation to capture the semantic information of the contract, and then applies the Transformer-GP model to automatically mine the vulnerability information in the graph representation. The model learns the local information from the contract's graph representation and simultaneously mines the global information of the code based on the global attention mechanism, incorporating multiple layers to explore the vulnerability information.
This section introduces GRATDet from the three-stage perspective of data pre-processing, graph representation, and model learning. The general architecture of the process is shown in Fig. 2.
Figure 2: Vulnerability detection frame
This work eliminates some factors that may affect the subsequent learning through the three-step operation of noise removal, symbolic representation, and data augmentation.
The existence of noise will interfere with the vulnerability detection of the model. This paper addresses the problem of noise in smart contracts through two levels of processing. At the code level, some statements that are semantically irrelevant to the code such as blank lines between codes and human-written comments are removed. At the contract level, some code that does not affect the fundamental operations of the contract is removed from the Solidity language level, such as event declarations and version numbers.
Unlike natural languages, which have a limited vocabulary, code can theoretically have an infinite number of function names and artificially written variables, leading to a potentially vast code vocabulary when performing statistical analysis. This can result in a significant waste of vocabulary space and can also impede subsequent semantic understanding of the model. To address this issue, this paper follows techniques used in previous works [18,31] by replacing some human-written variables with specific symbols such as ‘FUNC’ and ‘var’ after performing a lexical analysis of the code.
In particular, this paper replaces modifier characters in the contract with ‘MOD’ to distinguish them from ‘FUNC’. Additionally, the contract name is uniformly replaced with a specific symbol like ‘Contract’. The replacement of the contract name has no impact on vulnerability detection, and it ensures that the first line of code in each dataset is consistent, similarly with the ‘CLS’ character, which allows us to classify.
The dataset [23] contains significantly less vulnerable data than non-vulnerable data, so the sample size of a few classes needs to be increased. Considering the characteristics of smart contracts, this paper borrows the EDA method [32] in natural language processing and combines the three steps of swap, insertion, and symbolization to augment the data.
Swap: Due to the nature of smart contracts, a contract contains multiple function definitions. Often, however, there are vulnerabilities in only one or a few functions, and swapping several of these functions sequentially has no impact on the nature of the contract itself. Therefore, to augment the vulnerability dataset, we select the functions in the vulnerability contract for random exchange to obtain Data 1.
Insertion: Due to the characteristics of smart contracts, the introduction of functions without vulnerability data will not change the nature of the contract. Therefore, functions from each contract without vulnerability are randomly selected to form a functioning pool, and functions from the functioning pool are randomly selected to insert into Data 1 and obtain Data 2.
Symbolization: After the first two steps of processing, the final operation is to perform a symbolic representation for Data 2. Even if two contracts are the same, after the functions inside are exchanged, the positions of some variables deviate, and changed variable names will be obtained. These variables are semantically close; hence, finally, two contracts that are close in the vector space will be generated.
The specific process of data pre-processing is shown through an example. In Fig. 3, this work performs symbolic representation for the contract in Fig. 1, using the tree-sitter tool [33] to analyze the code and replace the variables of type identifier in the source code with specific symbols. From another point of view, this is also a filter to limit the number of keywords. Fig. 4 shows two smart contracts obtained by data augmentation of the contract in Fig. 3. A function from the functioning pool is randomly selected and inserted into the contract, and the two functions of the original contract receive different names in the two contracts derived from the augmentation due to the exchange of function positions.
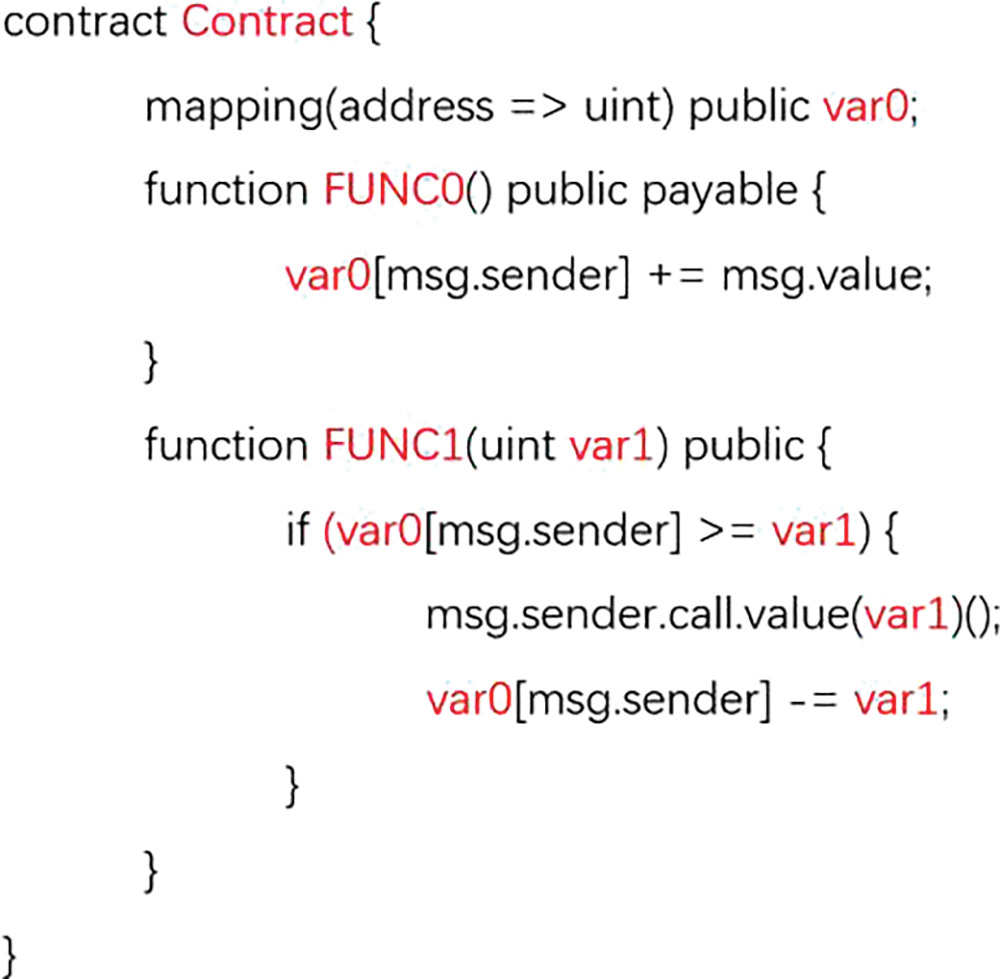
Figure 3: Example of symbolic representation
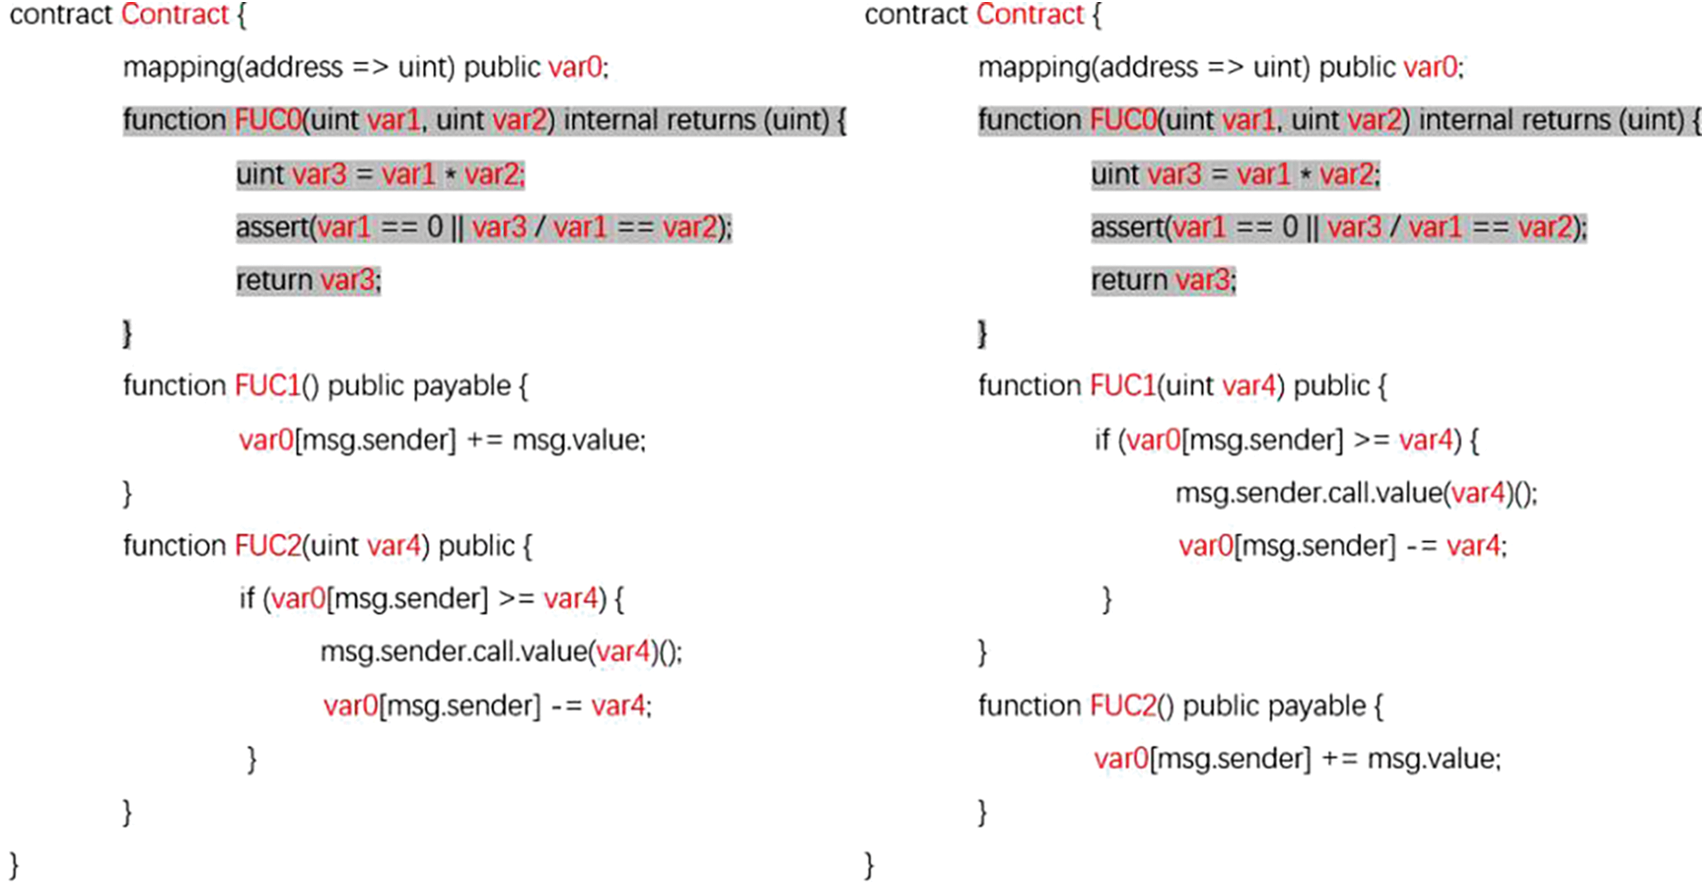
Figure 4: Example of data augmentation
This paper uses graphs as intermediate representations of code, building a ‘bridge’ between origin data and their corresponding vector representations [18]. Graph structure information is a better fit for the syntactic–semantic information contained in the code and helps in vulnerability detection, compared to sequential representations [18–20]. Code slicing is a pre-processing technique to obtain a more refined code fragment through data flow and control flow analysis, ignoring some unimportant code and narrowing the scope of vulnerabilities. However, this operation not only requires professional tools to assist in the analysis but also may miss some relevant code due to the point-of-interest cut; therefore, code slicing is not used in the data pre-processing here. Nevertheless, this paper draws on the idea that, although slicing is derived from various dependency analyses, in practice it is a combination of lines of code, and therefore it is reasonable to assume that there are rich relationships between lines of code.
Building on this idea, this paper proposes an innovative line-level graph representation, called Line Graph (LG). Compared with a traditional graph representation (where the token is the main node in the graph), the line-level graph representation increases information capacity, reduces the number of nodes, and provides a more compact representation, making it better suited for smart contracts containing a large amount of code. At the same time, since the programmer subconsciously performs line breaks on these codes when writing, it can be seen as a natural organization and feature division of the data, while representing each line of code as a node in the graph is more conducive to learning the overall semantics of the code.
LG is a directed graph, and nodes are connected by different kinds of edges. On the one hand, the different information in the code is reflected and fused in the graph representation by these edges, which better shows the semantic information of the code and helps to detect vulnerabilities. At the same time, these connections break the balance between the original nodes, making the nodes have different neighbors and forming a potential group, which helps the model to conduct targeted learning in the follow-up by judging and ignoring some unimportant code. In terms of data, control, and basic code structure, the following six edges are constructed in LG:
Function edge (Type 1): The function edge connects the first and last sentences of the function’s declaration, which can help determine the important separator elements of the code.
Control edge (Type 2): There are some special code blocks in a function such as if, for, and while, which contain control information. These code blocks are connected end to end, which helps the model to obtain better information from the code.
Sequential edge (Type 3): Given a code segment, the sequential edge forms connections from top to bottom in the order of the code, which enables us to capture some sequences of operations.
Variable edge (Type 4): The variable edge connects nodes containing the same variables, which helps determine the migration of data.
Modifier edge (Type 5): The modifiers of smart contracts contain some control information, which can often restrict subsequent function operations. Therefore, the definitions of these modifiers are connected with the corresponding uses, which is useful for judging the corresponding control information.
Reentrancy edge (Type 6): Nodes have different levels of importance, and nodes containing call.value are considered to be more important than other nodes. Reflecting on the structure of the graph, this specific type of edge is introduced to associate the code lines of call.value with all other code nodes that belong to the same function.
The code in Fig. 3 is shown in Fig. 5 after graph representation, and the node numbers represent the corresponding line numbers before the code is transformed into a node.
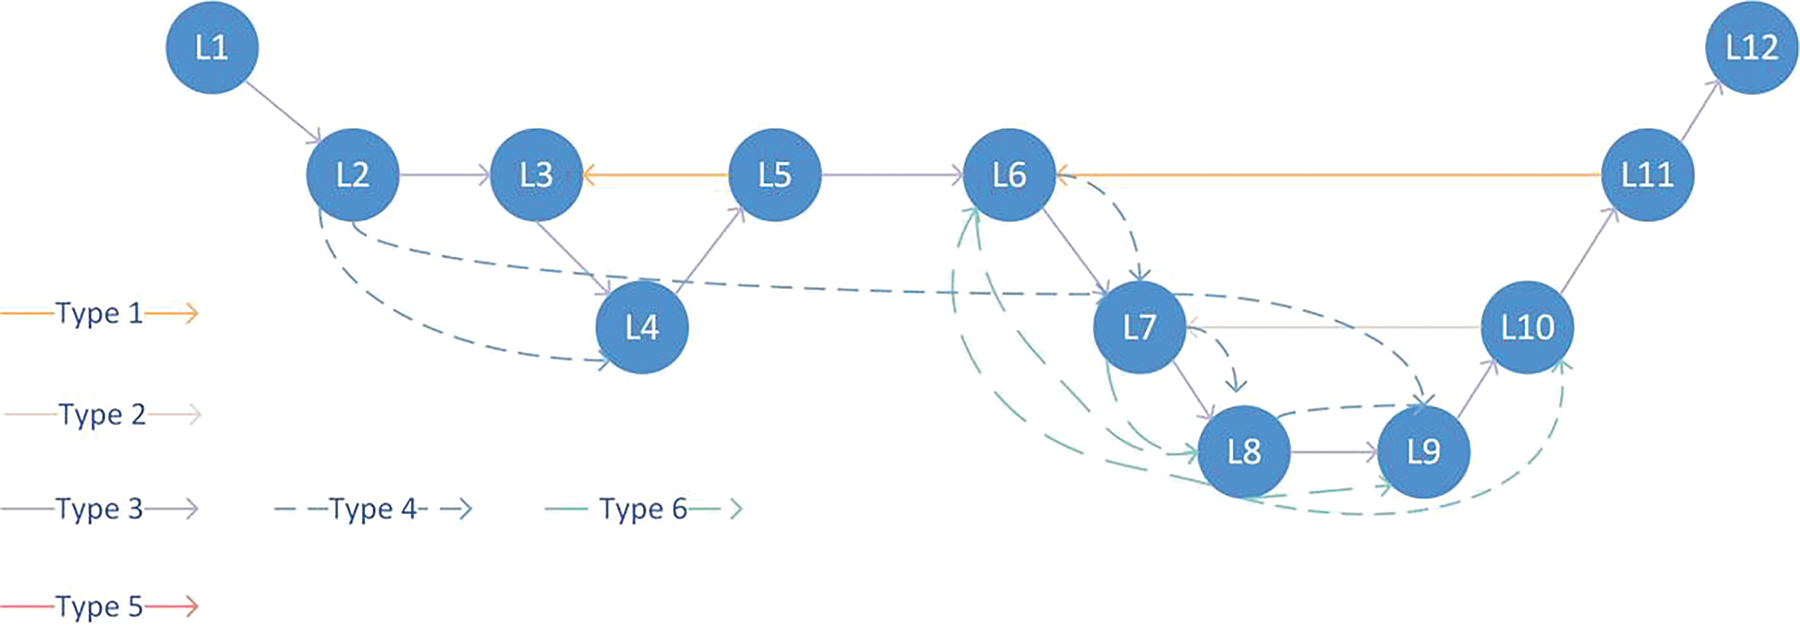
Figure 5: Graph representation of the code in Fig. 3
This paper uses
This paper improves on the original Transformer architecture by adding two modules to accommodate graph representation and vulnerability detection tasks, as shown in Fig. 6.
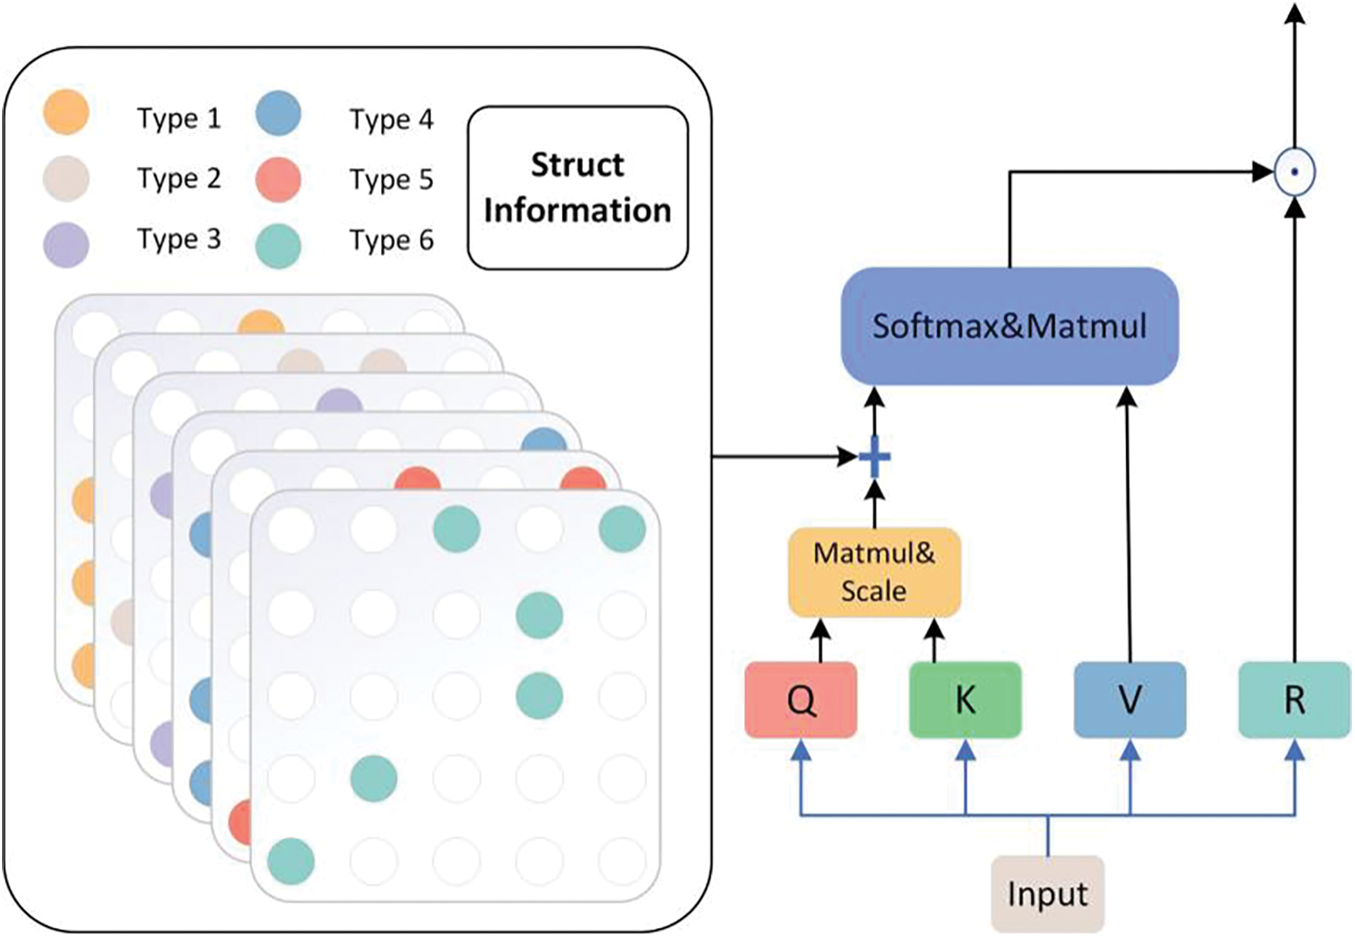
Figure 6: Transformer–GP model architecture
The transformer structure is originally designed for natural language, and the position encoding in it reflects the sequence–structure information. However, it is difficult to fit the position encoding data with graph attributes of the code, and the position encoding cannot reflect the rich semantic features of the code. This work believes that the essence of position encoding is to transform the attention matrix, on which much work has been carried out [34,35]. In this paper, the edges of the graph are encoded into the attention matrix instead of the position encoding. This approach offers an additional benefit: nodes are more likely to prioritize nodes that are closely connected to themselves during the learning process. The more edges there are between nodes, the more information is exchanged, the stronger their connection becomes, and the more attention they allocate to each other.
This paper makes some additions to Eq. (3) to enable it to capture edge information, which is equivalent to adding a graph structure module to the original model, and results in Eq. (4):
In Eq. (4),
In Eq. (5),
In Eq. (6),
In Eq. (7),
As input to the model,
Although the introduction of the graph structure module can encode edge information to give an additional gain to the model, the model may rely too much on this information and neglect learning the overall structure. As the task of this paper is to detect vulnerabilities, which involves capturing deeper semantic information, it is difficult to learn the deeper structural properties of the model by simply summing up the information.
Based on these two considerations, this work enhances the model by introducing a further module after graph structure learning. The Tensor-Product Representation [37] is introduced into the model as a Tensor-Product module and Eq. (1) is modified to better accommodate the structure representation, as follows:
In Eq. (8), the dimensions of
The tensor product of two vectors tends to change the dimension. To control the dimension, vector R is multiplied by the corresponding position of vector V (a Hadamard product). The traditional attention mechanism itself can be seen as a linear reorganization of the previous layer of vectors. However, the R and V communicate information by element-wise multiplication, which enhances the feature expression of the V vector by transforming its features in different dimensions. This provides further potential for establishing deeper abstract representations. Structural knowledge learned in V has been further combined and can be more comprehensively learned by the model. Therefore, this paper uses the Tensor-Product module to mine richer vulnerability features that help the model perform vulnerability detection.
For these experiments, the dataset-wild collated in [23] was used as the experimental dataset, which originated from [38]. After the noise removal, the data [23] was analyzed using the tree-sitter tool which found after parsing that some of the codes had ERROR type nodes. Therefore, to avoid interference from unknown features and ensure the reliability of the experiment, it was decided to eliminate these codes. Finally, more than 170,000 pieces of data were obtained. Twenty percent of the vulnerability dataset was randomly selected for data augmentation to 4750 pieces, and 4750 pieces were randomly selected from the non-vulnerability dataset to form Test Set 1, giving a total of 9500 data items. To investigate whether the performance of the model is related to the over-matching of keywords, we selected all data from the remaining dataset that contained call.value but had no vulnerabilities. Then 20% of these data were randomly selected for enhancement, resulting in 1890 items. This was combined with the 4750 vulnerability data in Test Set 1 to form Test Set 2. After expanding the remaining data, the training set was finally composed of 22,054 pieces of vulnerability data, 9,930 pieces of non-vulnerability data containing keywords, and 171,322 pieces of non-vulnerability data without keywords. The sample data were expanded in the manner shown in Fig. 4, and the overall change in the dataset is shown in Fig. 7. After data augmentation, there was a significant increase in the proportion of underrepresented data in the dataset.
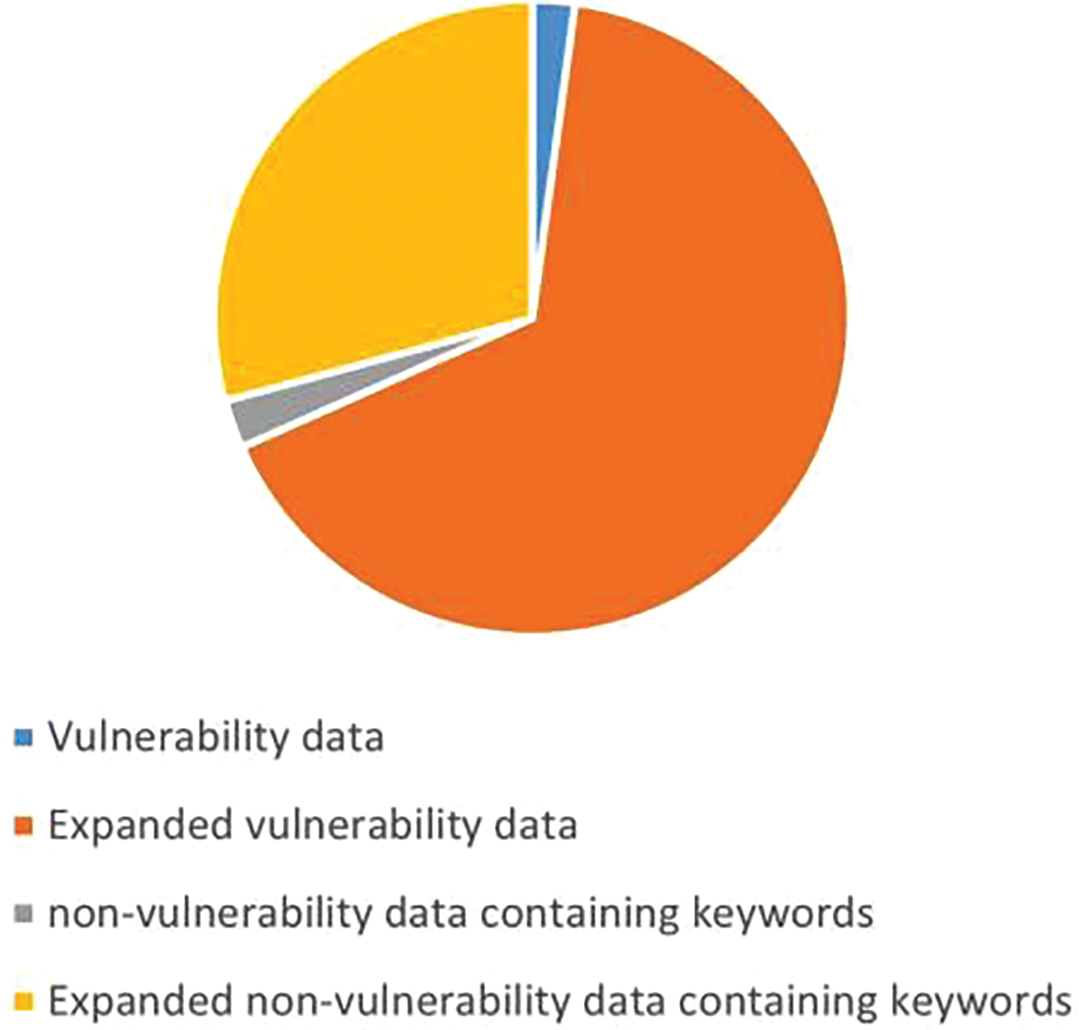
Figure 7: The effect of data enhancement
This work mainly studies the effect of the model on Test Set 1, as this is more in line with the real data distribution, and uses Test Set 2 as an aid to help determine the learning characteristics of the model itself.
4.2 Experimental Environment and Hyperparameters
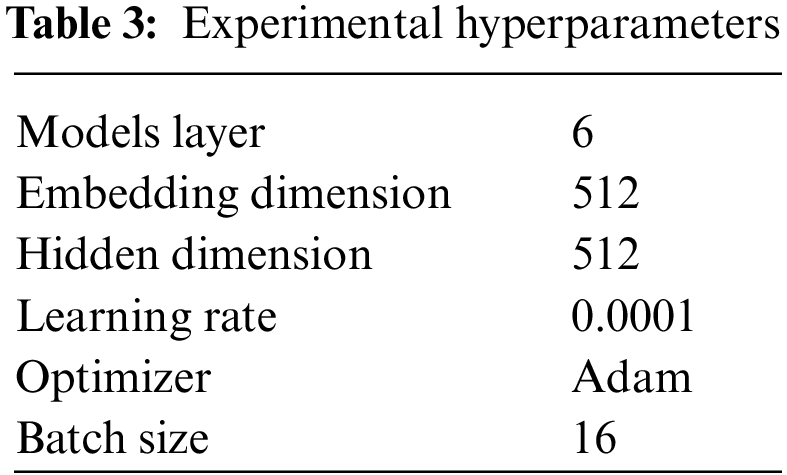
The experimental environment is shown in Table 2 and the experimental hyperparameters are shown in Table 3.
This paper regards smart contract vulnerability detection as a binary classification problem and uses Precision (P), Recall (R), Accuracy (ACC), and F1 to evaluate performance.
The Precision metric measures the proportion of correctly predicted vulnerability samples compared to all samples predicted to be vulnerable:
The Recall metric measures the proportion of correctly predicted vulnerability samples compared to all samples labeled as vulnerability:
The Accuracy metric measures the proportion of correct prediction samples compared to all samples:
As Precision and Recall are usually not positively correlated and often contradictory, F1 was used as an overall measure of model performance metrics:
To demonstrate the validity of the method proposed in this paper and to fully evaluate its performance, experiments were conducted to answer the following questions:
RQ1: How does the method proposed in this paper compare with current mainstream methods?
RQ2: Do the modules added to the model enhance its effects?
RQ3: Is the proposed method robust?
RQ4: Does data enhancement work?
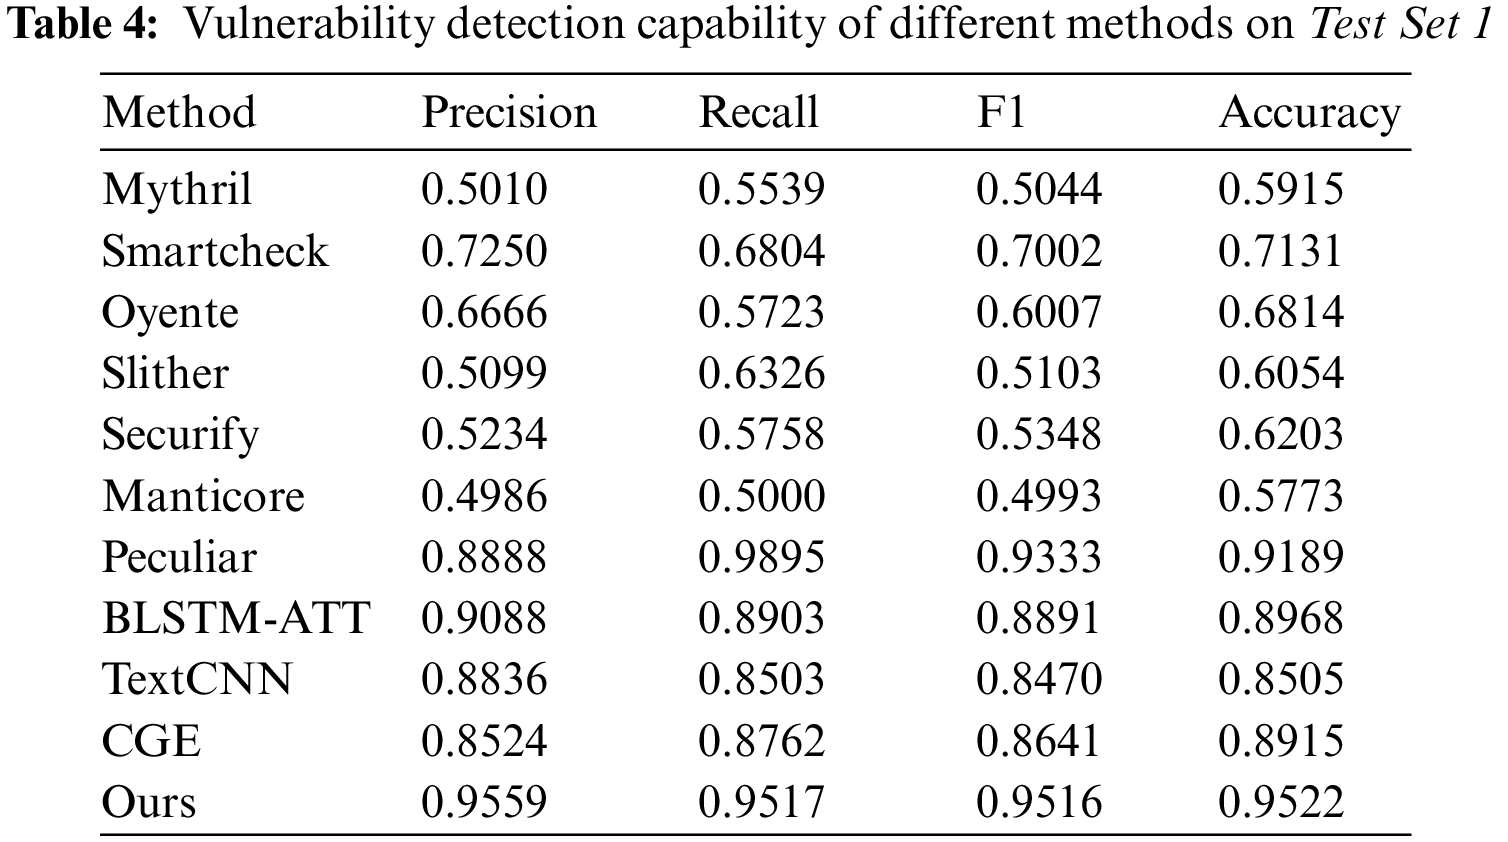
This paper compares the results of the model on Test Set 1 with ten different methods. Among them, SmartCheck [12–17] is the mainstream analysis tool at present; BLSTM-ATT and TextCNN are the classic deep learning models; CGE [10] is currently the best-performing graph neural network-based approach; and Peculiar is a method that has performed well in recent times for reentrancy vulnerability detection. For some models that are difficult to reproduce, we refer to the experimental effects in their original papers. As demonstrated in Tables 4 and 5, the six traditional methods [12–17] show poor performance in vulnerability detection tasks, with high rates of false positives and negatives. This is because the traditional detection methods follow a single pattern and cannot capture deeper contract features as well as the relationship between vulnerabilities compared to deep learning methods. Compared to the deep learning-based baseline methods, GRATDet achieved the best results in F1 and other metrics. The combination of global information and structural information in GRATDet allows the model to capture long-distance information relationships better and to learn from vulnerability information fragments, outperforming models such as LSTM and CNN. GRATDet outperformed the most competitive method, Peculiar, by improving F1 scores by 1.83% and 7.55% on Test Set 2 and Test Set 1, respectively. The proposed method combines multiple types of relationships, such as data relationships and control relationships, in contract representation. Compared to the Peculiar, which integrates a single relationship in its code representation, this approach can better reflect the rich semantic information in contracts. This enables the model to explore vulnerability features in contracts from multiple perspectives, resulting in better vulnerability detection capability.

Further analyses were conducted on the precision and recall of the proposed method for each category on Test Set 2. As shown in Table 6, the precision for Class 1 is higher than the recall, indicating that the model is more cautious and does not forcibly link keywords with vulnerability information. It can effectively determine the cases where there are keywords in the contract but there may not necessarily be a reentry vulnerability. The keywords and vulnerabilities can be analyzed separately.

Conclusion to RQ1: The effectiveness of the proposed method is demonstrated by experiments on two test sets.
To answer RQ2, ablation experiments were performed to explore the contribution of different modules.
Firstly, to verify the role of the graph structure module, comparative experiments were conducted on three models: the classic Transformer model; the Transformer–NON model with position encoding removed; and the Transformer–G model with position encoding replaced using the graph structure, as shown in Fig. 8. Compared to the classic Transformer, the Transformer–NON, which eliminates position encoding, showed better performance in detecting vulnerabilities. This suggests that the sequence feature learning represented by position encoding is not well-suited for this task, and removing the position encoding allows the model to focus more on other important features and relationships, thus improving the performance of vulnerability detection. Introducing a graph structure in the Transformer-G model leads to further improvement over the Transformer-NON model, as indicated by an increase in F1 scores on two datasets by 3.14% and 4.33%, respectively. This demonstrates that the introduction of a graph structure module can enhance the effectiveness of vulnerability detection, as the model can use the rich information in the graph to better link vulnerability fragment information, improve contract semantic understanding and enhance the learning of vulnerability features.
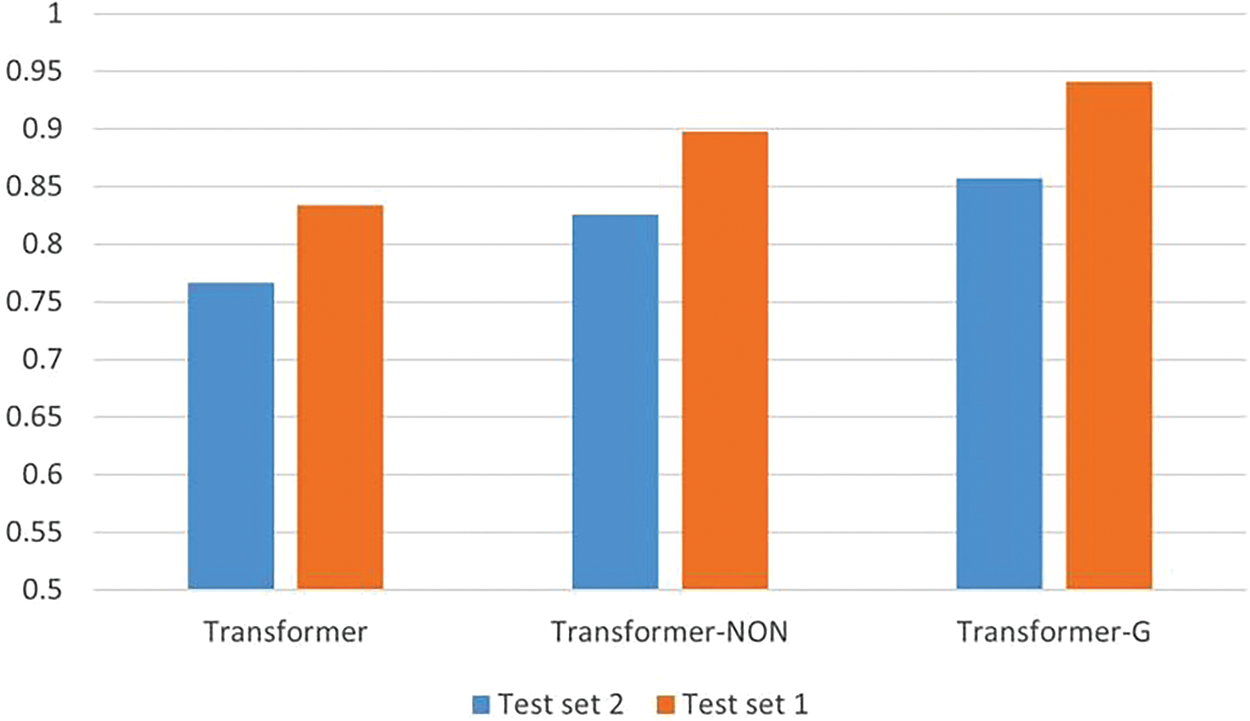
Figure 8: F1 score with and without graph structure module
Secondly, the role of the graph structure module in this paper is implemented in a way that changes the attention matrix, which could theoretically be accomplished using other approaches. To further explore whether the graph structure module can be replaced, this paper introduces two other additive models for comparative reference and the exploration of other possibilities, as follows:
Transformer–G1: Replace Eq. (4) in Transformer–G with
Transformer–G2: With reference to [36], replace Eq. (4) in Transformer–G with
The study included four models for comparison, namely Transformer–G, Transformer–G1, Transformer–G2, and Transformer–NON. The results are shown in Fig. 9. Among the three models with different ways of adding information, two of them have improved the effect compared with the one before the addition, and it is obvious that the change to the attention matrix helps the model to improve the effect in most cases. Transformer–G achieves the best results among the models with different additions. The attention mechanism is a critical component of the Transformer architecture, allowing it to selectively focus on input data. By increasing information in the attention matrix, this mechanism guides the model toward targeted learning. Analysis of these results suggests that incorporating information on the outer layer of the attention matrix is more effective in influencing the model’s feature learning and encourages it to focus on vulnerability segments, ultimately enhancing vulnerability detection performance.
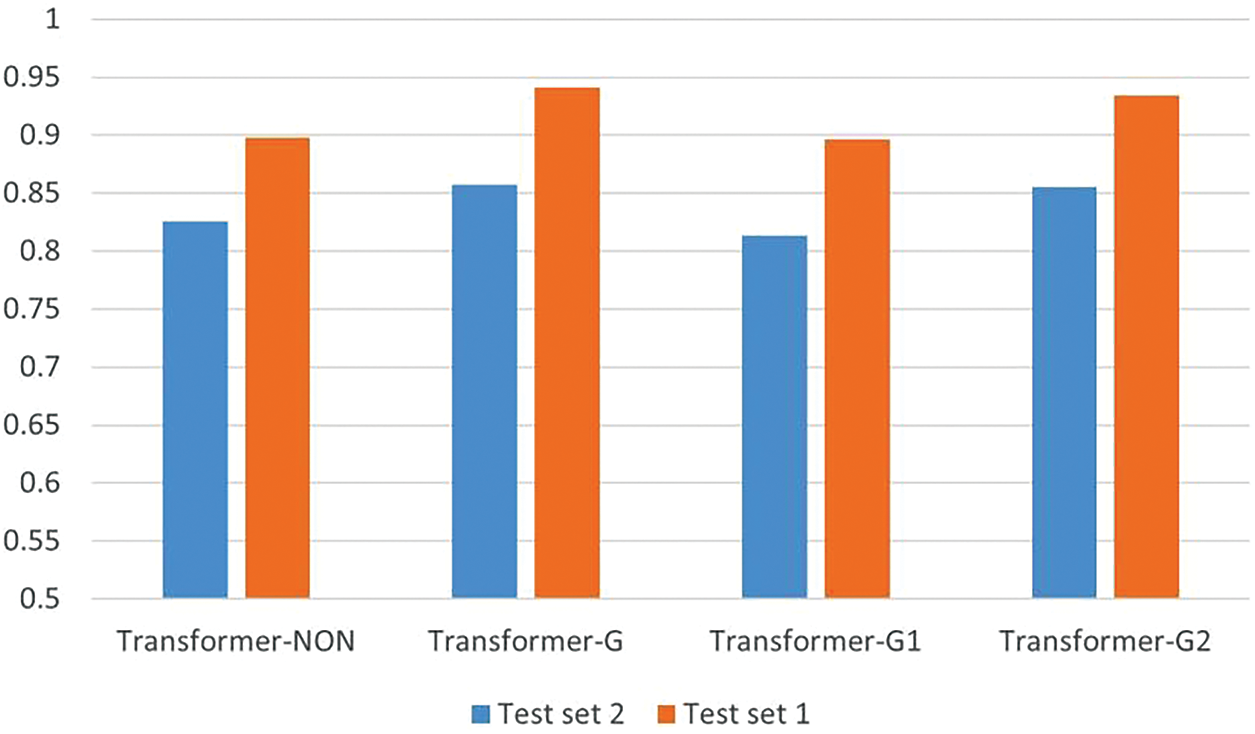
Figure 9: Different combination effects on two test sets
Thirdly, more useful forms of graph structure modules were also explored. We produced a model stacked with six layers in total by combining our modified module with the original Transformer module. Three combinations of structures were designed: 1–5, 5–1, and 3–1–2. Number 1 represents the layer to which the graph information is added. The other numbers represent the layers of the original Transformer, and the combination of numbers represents the stacking order of the model from bottom to top. Conducting module combination experiments on the two best-performing models in the previous experiment separately, the effects were tested on two test sets. The effects of the model combinations, measured by the F1 score, are presented in Fig. 10. Our findings suggest that introducing more graph information into the model does not always lead to better outcomes. The good performance achieved by the 1–5 architecture may be attributed to the initial layers playing a key role in learning the structural information of the model, which is consistent with the study by Wang et al. [39]. The initial layers of the Transformer directly encode the input information and convert it into an internal representation. Therefore, the training results of the initial layers have a great impact on the overall performance of the Transformer model. If the parameters of the initial layers are not able to capture the semantics of the input information well, then the subsequent attention layers and classification layers may also fail to generate effective results. Similarly, in this work, implementing beneficial information guidance at the initial layers can improve the performance of the model in detecting vulnerabilities.
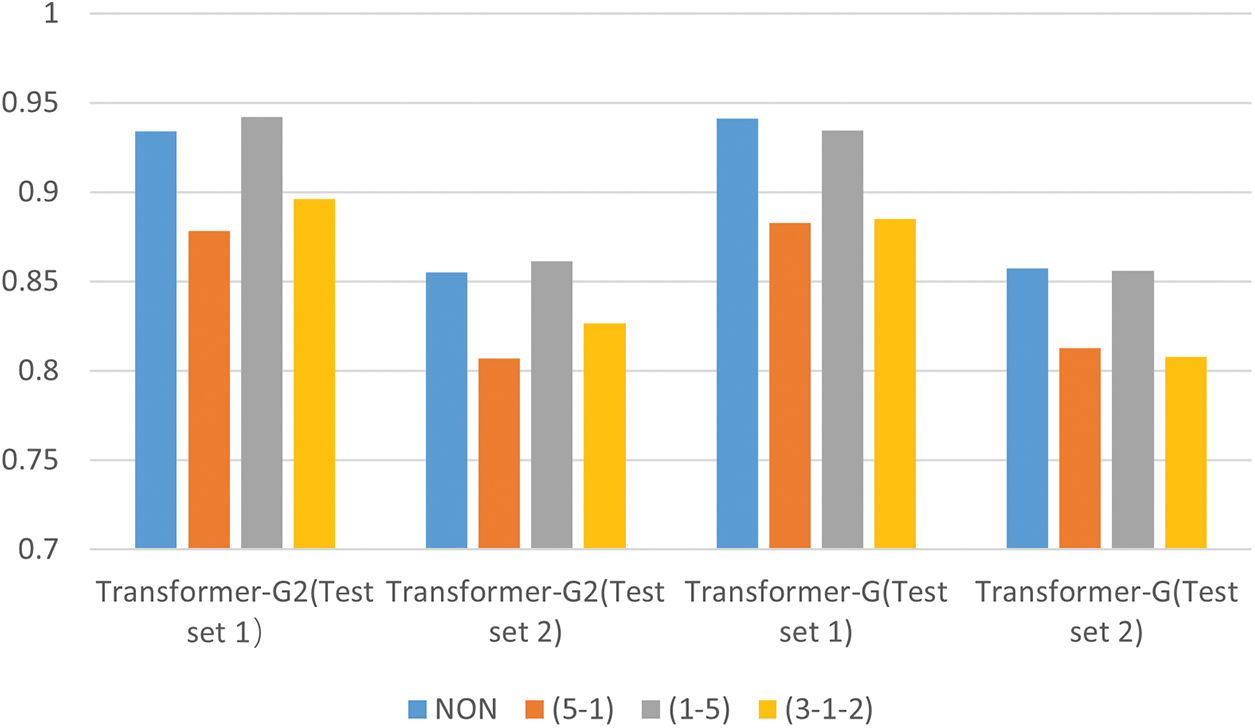
Figure 10: Different combination effects on two test sets
Finally, to verify the role of the Tensor-Product module, a representative group of models was selected for tests: Transformer–NON, Transformer, Transformer–G, Transformer–G2, Transformer–G (1–5), and Transformer–G2 (1–5). Using these six models as a base for comparison, the Tensor-Product module was added to create six new models: Transformer–NONP, Transformer–P, Transformer–GP, Transformer–GP2, Transformer–GP (1–5), and Transformer–GP2 (1–5). The final results for all models are shown in Fig. 11. The Transformer–GP model achieves the best results with F1 scores of 95.16% and 87.67% on the two test sets, which are 1.05% and 1.95% higher, respectively, compared to the model without the Tensor-Product module added. However, it was also found that not all Tensor-Product module additions are effective. The Tensor-Product module does not achieve any improvement compared to some competitive models, such as Transformer–G (1–5) and Transformer–G2 (1–5). The comparisons indicate that this is not a general module that can improve any model. When used in isolation, it increases the overall complexity of the task and reduces the effectiveness of vulnerability detection. However, when combined with a graph structure module, its deep-level feature extraction based on Tensor-Product representation benefits from the rich graph information as a backdrop, supporting it with enough knowledge to perform optimally and improve the vulnerability detection task.
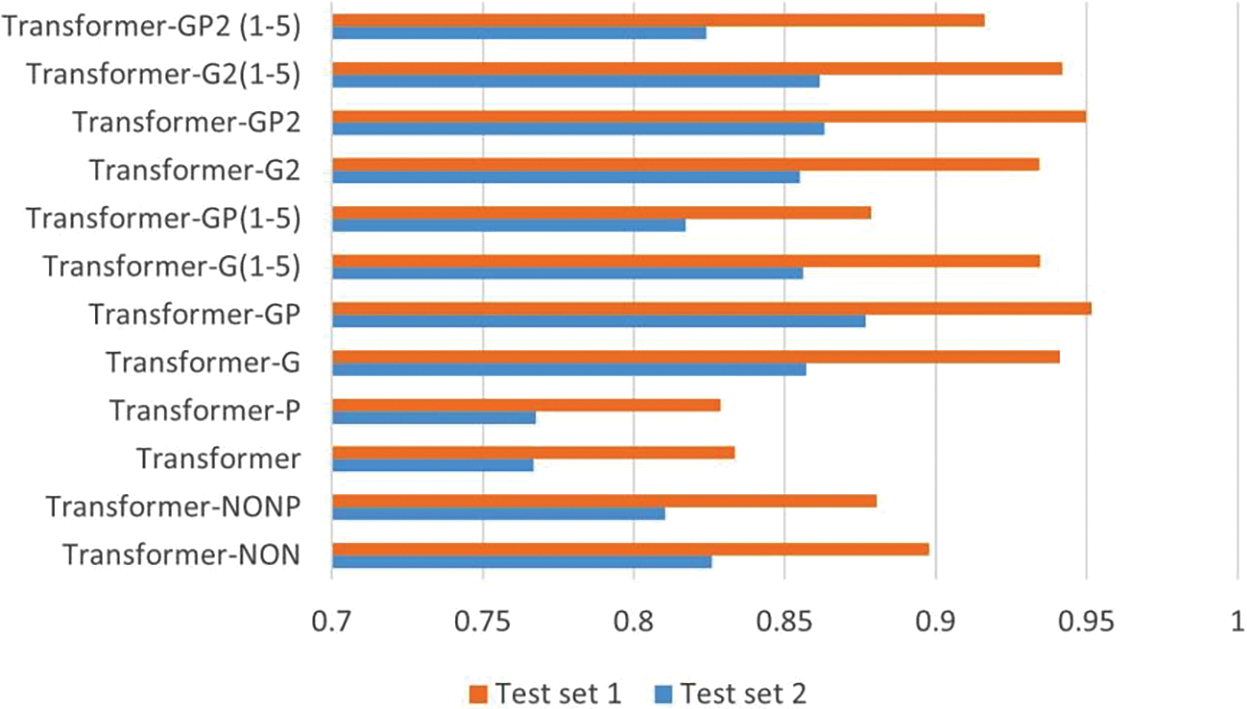
Figure 11: F1 score with and without Tensor-Product module
Conclusion to RQ2: It is difficult to perform excellent results with individual modules, but combining them can produce a better performance.
The third question concerns the model’s robustness. In the data containing nodes of type ERROR, analysis found that most of the code samples had ERROR type nodes due to some specific characters that could not be parsed by the tree-sitter. Only a small amount of code, such as the data in [23] with the serial number ‘106247’, could not be compiled successfully owing to some minor errors. (For instance, the missing ‘{’ character in data No. 106247 causes a parsing error and thus an ERROR node.) These codes are rich in semantic information and usually have no impact on our judgment of the nature of the data. Inspired by this example, we designed six common error templates to further explore the robustness of the method, as follows:
1) The number of } characters exceeds the contract requirement.
2) The number of { characters exceeds the contract requirement.
3) Missing } characters in the contract.
5) Missing { characters in the contract.
5) Strange characters appear in the contract.
6) Strange characters appear in the functions.
Applying these error patterns to the code in Fig. 3 produces the results shown in Fig. 12.
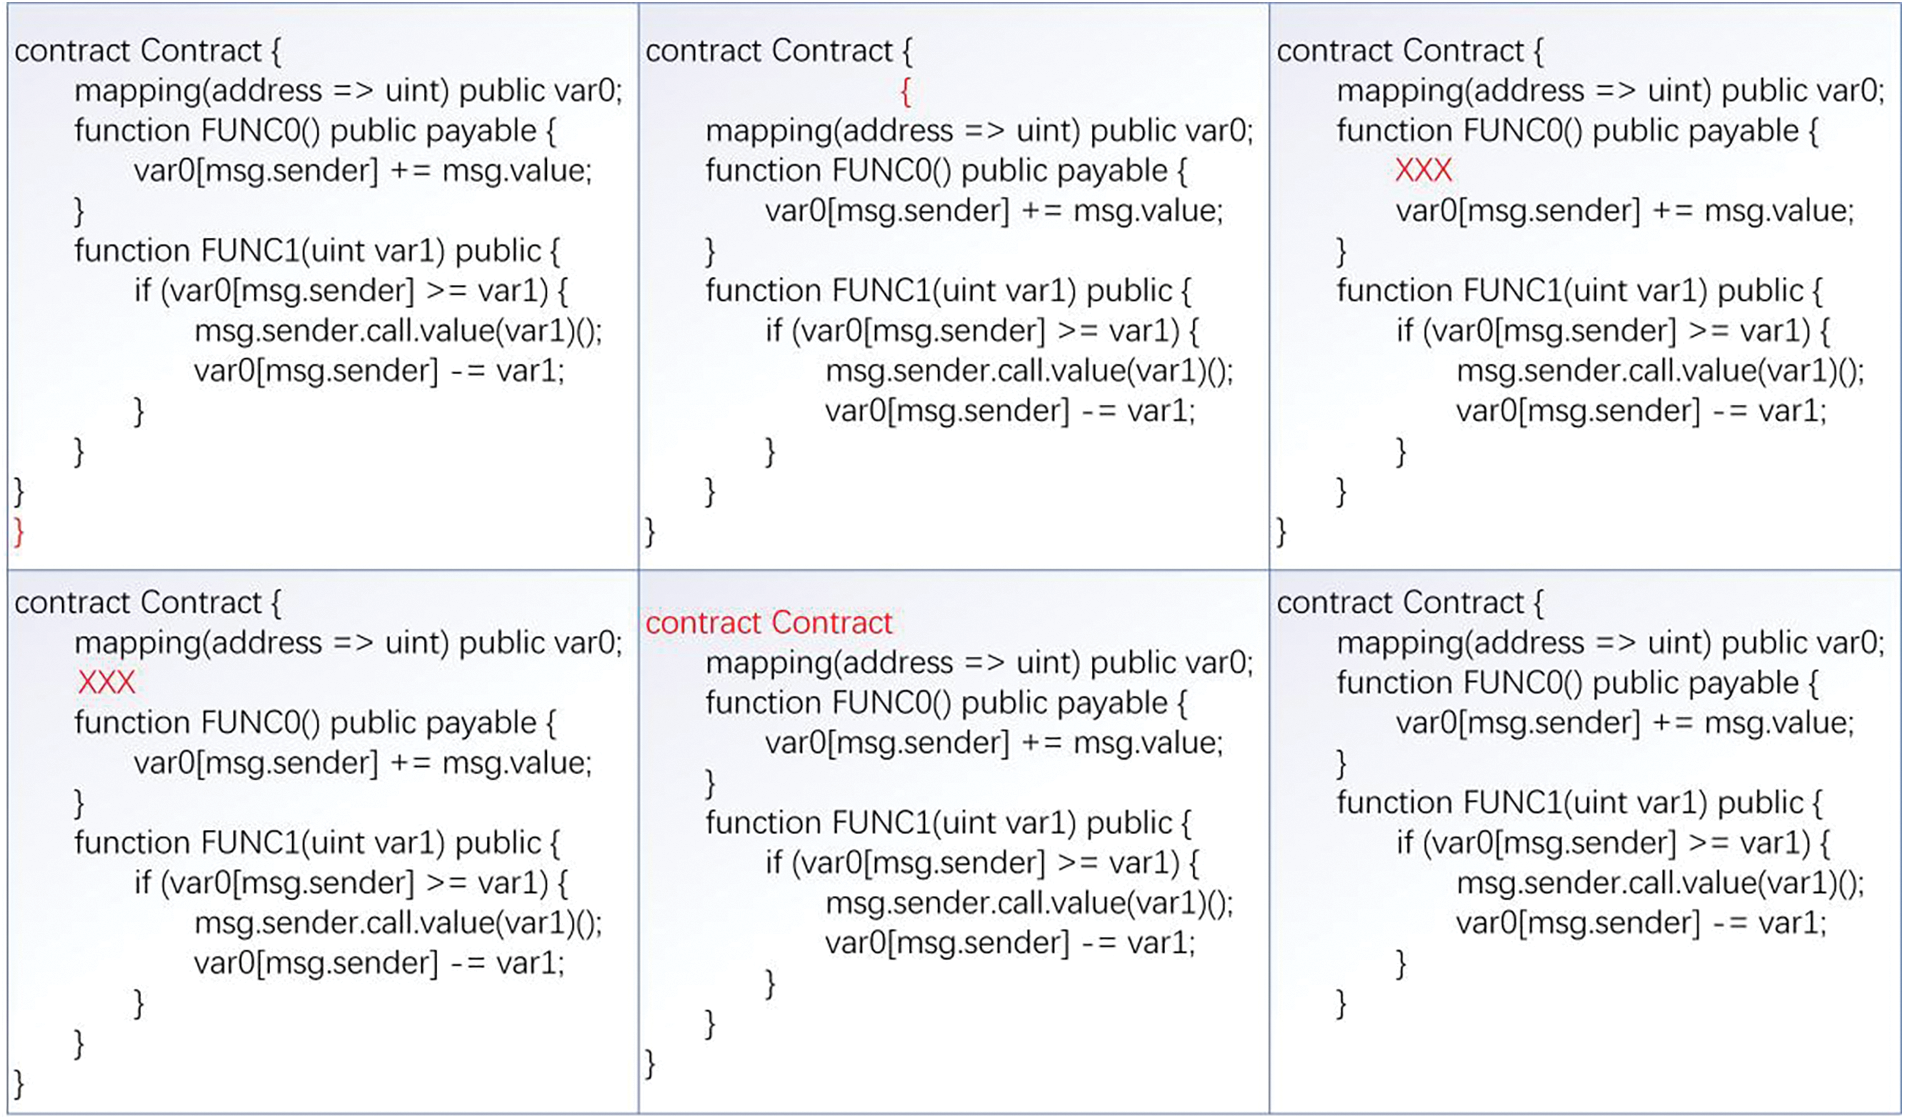
Figure 12: Six error templates
In a series of experiments, three types of code were selected that the model has predicted either correctly or incorrectly, giving a total of 6 kinds of data. Specifically, the types were vulnerability codes, non-vulnerability codes with keywords, and non-vulnerability codes without keywords. The error templates were then applied to these data several times, and the changes in model predictions before and after application were compared, as shown in Table 7.

The results reveal that the model’s predictions remained unchanged before and after these code modifications, indicating that minor deviations do not affect vulnerability detection. The proposed graph representation provides a comprehensive analysis of the code, combining multiple information to determine potential vulnerabilities. As a result, the presence of some incorrect code does not interfere with the model’s overall core semantic learning, and has no impact on the effectiveness of vulnerability detection.
Conclusion to RQ3: When targeting problematic data, the proposed method demonstrates its robustness.
The fourth question concerns data enhancement. For this experiment, the enhanced data from the training set (Train Set 1) was removed while the unenhanced data was retained to obtain Train Set 2 as the training data set. The model was trained with the same training rounds using the Train Set 2 dataset, and the detection effect was verified on Test Set 1. The model with the best results in multiple experiments is retained and compared with the model trained with the enhanced dataset, Train Set 1.
As shown in Table 8, the models trained with the enhanced data demonstrate a significant improvement in all aspects of the vulnerability detection task, including accuracy and F1 scores, compared to the models without the data enhancement. With data augmentation, the number of minority class samples is increased, which allows the model to see more examples of different patterns and relationships in the data. There is a better understanding of the underlying patterns in the data, and this improved understanding translates into improved performance for vulnerability detection classification tasks. Due to the severely unbalanced distribution of data classes, which interferes with model learning, the model trained by Train Set 2 is not very effective in detecting vulnerabilities. After data augmentation, the number of vulnerability samples is enhanced, reducing the interference of a priori information such as sample proportion, and the model can focus more on vulnerability feature learning during the learning process, thus improving the vulnerability detection effect.
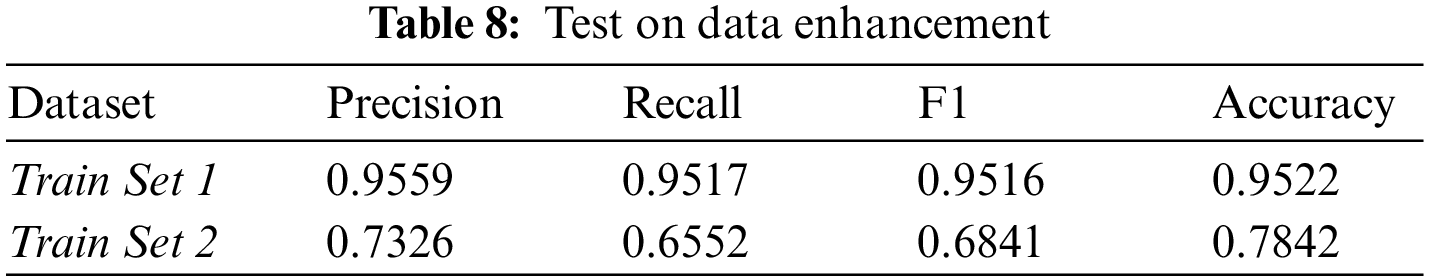
Conclusion to RQ4: Data enhancement can improve the model’s vulnerability detection effect.
This paper has presented a vulnerability detection method based on graph representation and Transformer, called GRATDet. The method incorporates the idea of code slicing and represents data as LG, which presents data and control information in the code in the form of a graph. The work uses an improved Transformer–GP model to learn code representations, which combines global semantic information with local structural information during the attention learning phase, integrates multi-level features, and then binds the information with vectors encoded by node information to enhance the feature representation ability of the vectors. Further, the method contains a data enhancement approach to Solidity language to deal with the data imbalance problem. Experiments show that the proposed method has a better vulnerability detection effect compared to other methods, and tests on problematic data demonstrate its robustness.
Although the method has achieved satisfactory detection results, this work has only explored the effect of reentrancy vulnerabilities due to the lack of data on publicly available smart contract vulnerabilities. Therefore, future research will work on data collection to verify the effectiveness of the method on more types of vulnerabilities, including unhandled exceptions and timestamp dependency.
Funding Statement: This research work was supported by the Science and Technology Program Project (No. 2020A02001-1) of Xinjiang Autonomous Region, China.
Conflicts of Interest: The authors declare that they have no conflicts of interest to report regarding the present study.
References
1. S. Nakamoto, “Bitcoin: A peer-to-peer electronic cash system,” 2008. [Online]. Available: https://bitcoin [Google Scholar]
2. G. Wood, “Ethereum: A secure decentralised generalised transaction ledger,” 2013. [Online]. Available: http://gavwood.com/paper.pdf [Google Scholar]
3. V. Buterin, “A next-generation smart contract and decentralized application platform,” 2014. [Online]. Available: https://www.ethereum.org/pdfs/EthereumWhitePaper.pdf [Google Scholar]
4. M. I. Mehar, C. L. Shier, A. Giambattista, E. Gong, G. Fletcher et al., “Understanding a revolutionary and flawed grand experiment in blockchain: The DAO attack,” Journal of Cases on Information Technology, vol. 21, no. 1, pp. 19–32, 2019. [Google Scholar]
5. G. Lin, S. Wen, Q. L. Han, J. Zhang and Y. Xiang, “Software vulnerability detection using deep neural networks: A survey,” Proceedings of the IEEE, vol. 108, no. 10, pp. 1825–1848, 2020. [Google Scholar]
6. T. H. D. Huang, “Hunting the ethereum smart contract: Color-inspired inspection of potential attacks,” 2018. [Online]. Available: https://arxiv.org/abs/1807.01868 [Google Scholar]
7. P. Qian, Z. Liu, Q. He, R. Zimmermann and X. Wang, “Towards automated reentrancy detection for smart contracts based on sequential models,” IEEE Access, vol. 8, pp. 19685–19695, 2020. [Google Scholar]
8. X. Yu, H. Zhao, B. Hou, Z. Ying and B. Wu, “DeeSCVHunter: A deep learning-based framework for smart contract vulnerability detection,” in 2021 Int. Joint Conf. on Neural Networks (IJCNN), Shenzhen, China, pp. 1–8, 2021. [Google Scholar]
9. Y. Zhuang, Z. Liu, P. Qian, Q. Liu, X. Wang et al., “Smart contract vulnerability detection using graph neural network,” in Int. Joint Conf. on Artificial Intelligence(IJCAI), Yokohama, Japan, pp. 3283–3290, 2020. [Google Scholar]
10. Z. Liu, P. Qian, X. Wang, L. Zhu, Q. He et al., “Smart contract vulnerability detection: From pure neural network to interpretable graph feature and expert pattern fusion,” 2021. [Online]. Available: https://arxiv.org/abs/2106.09282 [Google Scholar]
11. Z. Liu, P. Qian, X. Wang, Y. Zhuang, L. Qiu et al., “Combining graph neural networks with expert knowledge for smart contract vulnerability detection,” IEEE Transactions on Knowledge and Data Engineering, vol. 3, pp. 1, 2021. [Google Scholar]
12. B. Mueller, “Mythril—Reversing and Bug Hunting Framework for the Ethereum Blockchain,” 2017. [Online]. Available: https://github.com/b-mueller/mythril/ [Google Scholar]
13. L. Luu, D. H. Chu, H. Olickel, P. Saxena and A. Hobor, “Making smart contracts smarter,” in Proc. of the 2016 ACM SIGSAC Conf. on Computer and Communications Security, Vienna, Austria, pp. 254–269, 2016. [Google Scholar]
14. S. Tikhomirov, E. Voskresenskaya, I. Ivanitskiy, R. Takhaviev, E. Marchenko et al., “Smartcheck: Static analysis of ethereum smart contracts,” in Proc. of the 1st Int. Workshop on Emerging Trends in Software Engineering for Blockchain, Gothenburg, Sweden, pp. 9–16, 2018. [Google Scholar]
15. P. Tsankov, A. Dan, D. Drachsler-Cohen, A. Gervais, F. Buenzli et al., “Securify: Practical security analysis of smart contracts,” in Proc. of the 2018 ACM SIGSAC Conf. on Computer and Communications Security, Toronto, Canada, pp. 67–82, 2018. [Google Scholar]
16. J. Feist, G. Grieco and A. Groce, “Slither: A static analysis framework for smart contracts,” in 2019 IEEE/ACM 2nd Int. Workshop on Emerging Trends in Software Engineering for Blockchain (WETSEB), Montreal, QC, Canada, pp. 8–15, 2019. [Google Scholar]
17. M. Mossberg, F. Manzano, E. Hennenfent, A. Groce, G. Grieco et al., “Manticore: A user-friendly symbolic execution framework for binaries and smart contracts,” in 2019 34th IEEE/ACM Int. Conf. on Automated Software Engineering (ASE), San Diego, CA, USA, pp. 1186–1189, 2019. [Google Scholar]
18. Z. Li, D. Zou, S. Xu, X. Ou, H. Jin et al., “Vuldeepecker: A deep learning-based system for vulnerability detection,” in Proc. of the 25th Annual Network and Distributed System Security Symp. (NDSS), San Diego, CA, 2018. [Google Scholar]
19. R. Russell, L. Kim, L. Hamilton, T. Lazovich, J. Harer et al., “Automated vulnerability detection in source code using deep representation learning,” in 2018 17th IEEE Int. Conf. on Machine Learning and Applications (ICMLA), Orlando, FL, USA, pp. 757–762, 2018. [Google Scholar]
20. N. Ziems and S. Wu, “Security vulnerability detection using deep learning natural language processing,” in IEEE INFOCOM 2021-IEEE Conf. on Computer Communications Workshops (INFOCOM WKSHPS), Vancouver, BC, Canada, pp. 1–6, 2021. [Google Scholar]
21. G. Lin, J. Zhang, W. Luo, L. Pan, Y. Xiang et al., “Cross-project transfer representation learning for vulnerable function discovery,” IEEE Transactions on Industrial Informatics, vol. 14, no. 7, pp. 3289–3297, 2018. [Google Scholar]
22. Z. Bilgin, M. A. Ersoy, E. U. Soykan, E. Tomur, P. Çomak et al., “Vulnerability prediction from source code using machine learning,” IEEE Access, vol. 8, pp. 150672–150684, 2020. [Google Scholar]
23. H. Wu, Z. Zhang, S. Wang, Y. Lei, B. Lin et al., “Peculiar: Smart contract vulnerability detection based on crucial data flow graph and pre-training techniques,” in 2021 IEEE 32nd Int. Symp. on Software Reliability Engineering (ISSRE), Wuhan, China, pp. 378–389, 2021. [Google Scholar]
24. Y. Zhou, S. Liu, J. Siow, X. Du and Y. Liu, “Devign: Effective vulnerability identification by learning comprehensive program semantics via graph neural networks,” in Advances in Neural Information Processing Systems, Vancouver, Canada, vol. 32, pp. 10197–10207, 2019. [Google Scholar]
25. H. Wang, G. Ye, Z. Tang, S. H. Tan, S. Huang et al., “Combining graph-based learning with automated data collection for code vulnerability detection,” IEEE Transactions on Information Forensics and Security, vol. 16, pp. 1943–1958, 2020. [Google Scholar]
26. L. Zhang, W. Chen, W. Wang, Z. Jin, C. Zhao et al., “Cbgru: A detection method of smart contract vulnerability based on a hybrid model,” Sensors, vol. 22, no. 9, pp. 3577, 2022. [Google Scholar] [PubMed]
27. H. Wu, H. Dong, Y. He and Q. Duan, “Smart contract vulnerability detection based on hybrid attention mechanism model,” Applied Sciences, vol. 13, no. 2, pp. 770, 2023. [Google Scholar]
28. A. Vaswani, N. Shazeer, N. Parmar, J. Uszkoreit, L. Jones et al., “Attention is all you need,” in Advances in Neural Information Processing Systems, Long Beach, USA, vol. 30, pp. 5998–6008, 2017. [Google Scholar]
29. Z. Liu, Y. Lin, Y. Cao, H. Hu, Y. Wei et al., “Swin transformer: Hierarchical vision transformer using shifted windows,” in Proc. of the IEEE/CVF Int. Conf. on Computer Vision, Montreal, Canada, pp. 10012–10022, 2021. [Google Scholar]
30. W. Gad, A. Alokla, W. Nazih, M. Aref and A. Salem, “DLBT: Deep learning-based transformer to generate Pseudo-Code from source code,” Computers, Materials & Continua, vol. 70, no. 2, pp. 3117–3132, 2022. [Google Scholar]
31. X. Cheng, H. Wang, J. Hua, G. Xu and Y. Sui, “Deepwukong: Statically detecting software vulnerabilities using deep graph neural network,” ACM Transactions on Software Engineering and Methodology (TOSEM), vol. 30, no. 3, pp. 1–33, 2021. [Google Scholar]
32. J. Wei and K. Zou, “Eda: Easy data augmentation techniques for boosting performance on text classification tasks,” in Proc. of the 2019 Conf. on Empirical Methods in Natural Language Processing and the 9th Int. Joint Conf. on Natural Language Processing (EMNLP-IJCNLP), Hong Kong, China, pp. 6382–6388, 2019. [Google Scholar]
33. JoranHonig, “tree-sitter-solidity,” [Online]. Available: https://github.com/jordanHoing/tree-sitter-solidity [Google Scholar]
34. V. J. Hellendoorn, C. Sutton, R. Singh, P. Maniatis and D. Bieber, “Global relational models of source code,” in Int. Conf.on Learning Representations, Addis Ababa, Ethiopia, 2019. [Google Scholar]
35. P. Shaw, J. Uszkoreit and A. Vaswani, “Self-attention with relative position representations,” in Proc. of the 2018 Conf. of the North American Chapter of the Association for Computational Linguistics: Human Language Technologies, New Orleans, Louisiana, vol. 2, pp. 464–468, 2018. [Google Scholar]
36. Q. Le and T. Mikolov, “Distributed representations of sentences and documents,” in Int. Conf. on Machine Learning, Beijing, China, pp. 1188–1196, 2014. [Google Scholar]
37. I. Schlag, P. Smolensky, R. Fernandez, N. Jojic, J. Schmidhuber et al., “Enhancing the transformer with explicit relational encoding for math problem solving,” 2019. [Online]. Available: https://arxiv.org/abs/1910.06611 [Google Scholar]
38. J. F. Ferreira, P. Cruz, T. Durieux and R. Abreu, “Smartbugs: A framework to analyze solidity smart contracts,” in Proc. of the 35th IEEE/ACM Int. Conf. on Automated Software Engineering, New York, NY, USA, pp. 1349–1352, 2020. [Google Scholar]
39. W. Wang and Z. Tu, “Rethinking the value of transformer components,” in Proc. of the 28th Int. Conf. on Computational Linguistics, Barcelona, Spain, pp. 6019–6029, 2020. [Google Scholar]
Cite This Article
 Copyright © 2023 The Author(s). Published by Tech Science Press.
This work is licensed under a Creative Commons Attribution 4.0 International License , which permits unrestricted use, distribution, and reproduction in any medium, provided the original work is properly cited.
 Downloads
 Citation Tools