
 Submit a Paper
 Propose a Special lssue
 Open Access
ARTICLE

Explainable Classification Model for Android Malware Analysis Using API and Permission-Based Features
1 SAUDI ARAMCO Cybersecurity Chair, Department of Computer Science, College of Computer Science and Information Technology, Imam Abdulrahman Bin Faisal University, P.O. Box 1982, Dammam, 31441, Saudi Arabia
2 Department of Computer Science, College of Computer Science and Information Technology, Imam Abdulrahman Bin Faisal University, P.O. Box 1982, Dammam, 31441, Saudi Arabia
3 Computer Engineering Department, College of Computer Science and Information Technology, Imam Abdulrahman Bin Faisal University, P.O. Box 1982, Dammam, 31441, Saudi Arabia
4 School of Computer Science and Technology, Zhejiang Gongshang University, Hangzhou, China
* Corresponding Authors: Nida Aslam. Email: ; Tariq Hussain. Email:
(This article belongs to the Special Issue: AI-driven Cybersecurity in Cyber Physical Systems enabled Healthcare, Current Challenges, Requirements and Future research Foresights)
Computers, Materials & Continua 2023, 76(3), 3167-3188. https://doi.org/10.32604/cmc.2023.039721
Received 13 February 2023; Accepted 07 June 2023; Issue published 08 October 2023
 View Full Text
 Download PDF
Abstract
One of the most widely used smartphone operating systems, Android, is vulnerable to cutting-edge malware that employs sophisticated logic. Such malware attacks could lead to the execution of unauthorized acts on the victims’ devices, stealing personal information and causing hardware damage. In previous studies, machine learning (ML) has shown its efficacy in detecting malware events and classifying their types. However, attackers are continuously developing more sophisticated methods to bypass detection. Therefore, up-to-date datasets must be utilized to implement proactive models for detecting malware events in Android mobile devices. Therefore, this study employed ML algorithms to classify Android applications into malware or goodware using permission and application programming interface (API)-based features from a recent dataset. To overcome the dataset imbalance issue, RandomOverSampler, synthetic minority oversampling with tomek links (SMOTETomek), and RandomUnderSampler were applied to the Dataset in different experiments. The results indicated that the extra tree (ET) classifier achieved the highest accuracy of 99.53% within an elapsed time of 0.0198 s in the experiment that utilized the RandomOverSampler technique. Furthermore, the explainable Artificial Intelligence (EAI) technique has been applied to add transparency to the high-performance ET classifier. The global explanation using the Shapely values indicated that the top three features contributing to the goodware class are: Ljava/net/URL;->openConnection, Landroid/location/LocationManager;->getLastKgoodwarewnLocation, and Vibrate. On the other hand, the top three features contributing to the malware class are Receive_Boot_Completed, Get_Tasks, and Kill_Background_Processes. It is believed that the proposed model can contribute to proactively detecting malware events in Android devices to reduce the number of victims and increase users’ trust.Keywords
A mobile phone is a potent communication tool that Motorola initially introduced in 1973 and made commercially accessible in 1984 [1]. In today’s world, mobile devices play an essential role in every aspect of our lives. There is much more to smartphones than just making phone calls, where a personal information management system, a payment system, and more are now integrated into it [2]. As a result, over a billion people own smartphones, and most use them for day-to-day functions. Moreover, it is estimated that there will be 7.49 billion mobile phone users worldwide by 2025 [3]. With the advent of the Android platform, the smartphone industry has increased and now holds more than 80% market share, being one of the most popular operating systems in 2019, according to research by International Data Corporation [4] and Gartner [5]. Android has changed radically in the previous five years, with more attractive features and critical functions related to health, finance, entertainment, banking, and wallet, and many more being introduced. The number of Android devices sold has exceeded 1 billion, with the Google Play store reporting 65 billion app downloads [6]. As a result of the popularity of the Android platform, more sophisticated malware that employs complicated logic and anti-analysis measures was developed [7]. Approximately 2.5 million new Android malware samples are detected every year, according to a McAfee report [8]. In addition to this store, many unofficial third-party app developers also started offering Android apps. Consequently, the security and privacy vulnerabilities caused by malware have risen [9,10].
Jon von Neumann was the first to propose the concept of malware in his study: “Theory of Self-Reproducing Automata” [11]. Malware is key to all network invasions and security breaches, including trojans, worms, rootkits, scareware, spyware, viruses, and any program that disturbs user data, systems, or networks. It is mainly used to obtain unauthorized access to several inter-connected devices and network assets to sneak sensitive data and files and disrupt regular operations. Most malware is designed solely for entertainment and experimentation, where tactics constantly evolve, attacking with increasing stealth and frequency [12]. The three most prevalent obstacles in malware detection are: identifying obfuscated malware, classifying it, and identifying the crucial attributes used in application obfuscation. This inquiry necessitates a thorough examination of applications. The procedures for detecting Android malware events can be categorized into three categories: Static, dynamic, and hybrid. In the static analysis, anomaly behaviour is monitored by extracting the features from the Android application without running them into a device or Android emulator. This technique can achieve significant feature coverage while being computationally less costly, yet, it can be easily foiled by obfuscation strategies [13]. The dynamic analysis overcomes the static analysis’s limitation by running the analysis into a device or Android emulator [14]. Nevertheless, it necessitates higher technical skills and is computationally costly. In contrast, hybrid analysis combines static and dynamic analysis, improving the detecting process’s effectiveness and efficiency.
To protect Android users from being attacked by viruses and other malicious applications, Google has developed a machine learning-based (ML-based) ecosystem called “Play Protect” [15]. The ecosystem intends to identify malware before and after uploading programs to Google Play. However, fraudsters continue targeting Android phones and infecting their users [9,16]. Thus, introducing a reliable malware detection application is crucial to reduce malware victims and encourage end-user trust. Cyber security can be revolutionized by combining ML with threat intelligence-based solutions to counter attacks against networks [17–19]. For instance, using an ensemble technique, in [20] established a high malware detection accuracy for Windows portable executables (PE). Furthermore, authors in [21] used an ML algorithm to detect ransomware, achieving promising results. Additionally, several studies have implemented ML-based models to detect malware in Android devices. However, their effort is adversely affected by the lack of a clear understanding of the latest Android malware landscape. Furthermore, up-to-date datasets capturing the latest Android malware environment are vital for developing successful malware analysis techniques and evaluating new detection systems.
Similarly, most previous studies focused on using black-box complex ML models. The complex ML models are usually opaque and cannot extract how the reasoning has been made. Explainable AI (EAI) or ML (EML) adds interpretability to the black-box ML models. EAI has already been successfully implemented in various domains like health, education, cyber security, etc. [22]. However, EAI has not been used for detecting Android malware. Accordingly, researchers are trying to develop new and effective approaches to Android malware detection. Although earlier research has yielded encouraging results, a further contribution can be made to produce better outcomes by utilizing updated datasets.
To overcome the previous work limitations, this study aimed to develop an ML-based model for detecting malware in Android devices using a newly published dataset [12]. Three ML algorithms were trained, including support vector machine (SVM), random forest (RF), and extra trees (ET), in four different experiments. The ML algorithms were trained using the original imbalanced Dataset in the first experiment. The second, third, and fourth experiments utilized the RandomOverSampler, synthetic minority oversampling with tomek links (SMOTETomek), and RandomUnderSampler, respectively. The results indicated that the ET-RandomOverSampler model achieved the highest accuracy of 99.53% with the lowest elapsed time of 0.0198 s. Additionally, EAI techniques were used to understand the effect of each feature on the proposed model. The main contribution of the presented research is expressed as follows:
• Develop an accurate model for detecting malware events in Android devices using an updated dataset.
• Compare the performance of the base classifier (SVM) with the ensemble classifiers (RF and ET) in detecting malware in Android devices.
• Overcome the TUANDROMD dataset imbalance using three different dataset sampling methods.
• Compare the results of the proposed models in four different sets of experiments (i.e., original data, random-oversampled, oversampled using SMOTETomek, random-undersampled).
• Analyze the most contributing features to classifying malware using EAI techniques.
• Achieve the highest results compared to benchmark studies.
Additionally, the main research questions the study aims to answer are stated as follows:
• Which features contribute mostly to detecting Android malware?
• How can different sampling techniques affect the performance of the ML algorithms?
• How might the proposed ML model aid in accurately and rapidly identifying Android malware?
The division and arrangement of the paper are as follows: The review of related literature is covered in Section 2 of the article. The materials and methods utilized are reported in Section 3 of the article. The empirical design and findings of this study are presented in Section 4, along with a discussion. An explanation of the best model’s prediction is detailed in Section 5, whereas the conclusion and future work recommendation is presented in Section 6.
Research has been done to develop models to improve malware detection in the Android operating system. The sections below contain some studies that used ML and deep learning (DL) algorithms ordered chronologically from oldest to most recent.
2.1 Android Detection Based on Machine Learning
Milosevic et al. [23] compared emulator and device-based detection to extract features for supervised learning from both environments. They utilized 1222 malware samples from 2444 Android apps. SVM, naive Bayes (NB), simple logistic regression (SLR), multilayer perceptron (MLP), partial decision trees (PART), RF, and J48 decision tree (DT) algorithms were utilized. The results indicated that the phone-based environment outperformed the emulator-based one, where the RF classifier achieved a 92.6% F1–score, a 93.1% true positive rate (TPR), and a 92% false positive rate (FPR) using the top 100 features. The authors concluded that developing more efficient device-based ML detection methods is essential as an incentive to minimize the impact of malware anti-emulation and emulator environmental flaws that limit analysis performance. Similarly, Gosiewska et al. [24] carried out a study on malware detection attacking Android devices. Two ML models were developed, one based on source code assessment using a set of words and the other based on permissions. The Dataset included 387 instances for the permission-based approach and 400 applications for the source code-based method. The C4.5 DT, logistic regression (LR), JRip, Bayes networks, and SVM with minimal sequential optimization (SMO) classifiers were used. The results indicated that SVM attained the highest results using the source code-based approach, attaining an F1-score of 95.1%. Some improvements can be explored by examining how the suggested permission and source code analysis interact to produce different results. Another enhancement could be done by integrating the static and dynamic application analysis, using multiple classifiers to assess source code and dynamic application properties in real-time.
On the other hand, Suarez-Tangil et al. [25] introduced DroidSieve, a malware classification system whose characteristics are generated from a rapid and scalable static analysis of Android applications. DroidSieve determines if an app is dangerous; if so, it labels it as part of a malware family. The authors used a dataset with over 100k malicious and benign applications. Their model used a binary class label for malware detection and a multi-class label for family classification. ET was used for classification in their study, and the mean decrease in impurity (MDI) technique was utilized for feature selection. They achieved a detection accuracy of 99.82% with zero false positives and a malicious family identification accuracy of 99.26%. According to their findings, static analysis for Android can work even when faced with obfuscation techniques like reflection, dynamically loaded native code, and encryption. Nevertheless, their approaches are susceptible to mimic attacks since the features they extract can be fabricated. As malware grows more complex, the classifier’s performance may organically deteriorate over time. This occurrence is described as concept drift.
In another study, Martín et al. [26] analyzed indirect characteristics and their ability to detect malware using ML. Around 118K Android apps were acquired from the Google Play Store, where malware was declared in 69K apps, and the others were considered goodware. Feature selection was applied by some algorithms, including Pearson’s chi-squared test, entropy-based methods, and RF feature importance. The classifiers used were LR, SVM, and RF, where RF yielded the highest results with an 89% F1 score. Their analysis showed that metadata could be utilized as a basic static malware predictor, making it ideal for simultaneously analyzing vast numbers of Android apps. It is also feasible to create an in-device system that warns users about the style of programs and the risk of installing them.
In addition, Fang et al. [27] presented a unique technique in which frequent subgraphs (fre-graphs) are formed to describe the common behaviours of malware samples of the same family. Furthermore, they have developed FalDroid, a unique method that automatically classifies Android malware and selects typical malware samples based on free graphs. They used a dataset of 8407 samples to train four different classifiers: SVM with linear kernel, k-nearest neighbour (K-NN), RF, and DT. SVM achieved the highest result compared to the other classifiers, with an accuracy of 95.3%. Furthermore, FalDroid attained 94.2% accuracy. Due to the difficulties of gathering Android malware samples with precise labels, the Dataset contained only 8,407 malware samples from 36 families, with labels based on VirusTotal findings. As a result, the authors concluded that VirusTotal’s results might not be entirely accurate. Martín et al. [28] found that most malware incidents are related to misusing adware or hazardous apps, while others are unknown. The authors aimed to categorize unknown software into either adware or harmful risks using a dataset of 82,866 harmful samples, representing 51.5% of the dataset samples. The classification algorithms used were LR and RF, where RF outperformed LR with an F1-score of 84%. It has been noticed that adware and harmful programs are often autonomous, but the unknown category gives no more indication of the threat.
In another study by Mehtab et al. [29], the authors employed AdDroid. This ensemble-based ML approach merges adaptive boosting (Adaboost) with standard classifiers to build a model that detects fraudulent apps. After employing feature selection on a dataset of 1420 Android applications, of which 910 are malicious and 510 are benign, DT integrated with Adaboost achieved an accuracy of 99.11%. As the suggested approach has very low computational complexity, it can be used to examine real-world applications. Their work can be improved by using a larger dataset of harmful and trustworthy applications, considering the order in which the rule appears, and combining dynamic analysis with the suggested method to analyze disguised malware.
Yang et al. [30] developed a model to improve the accuracy of Android malware detection. The model uses DT and SVM to classify applications as malicious or benign. The study used the University of Gottingen’s Drebin project dataset, which contains 5560 malware samples collected from August 2010 to October 2012. The Dataset was divided into three sections in the ratio 6:2:2, representing the training set, the pseudo test set, and the test set. Moreover, the 3-gram technique was used for feature selection. The model achieved an accuracy of 96%.
In another study, McLaughlin et al. [31] presented a methodology that improves accuracy in three scenarios: malware binary detection, malware family classification, and malware categorization. The model used over 5000 samples that were divided into two categories: malicious and non-malicious. Furthermore, they classified malware into four categories: adware, ransomware, scareware, and short message service (SMS). They used three classifiers, namely RF, DT, and ET. Moreover, three feature selection techniques were used: Recursive feature elimination (RFE), light gradient boosting model (LGBM), and RF. The findings demonstrate that ET achieved the highest weighted accuracy of all other classifiers. The accuracy of malware detection, malware categorization, and malware family classification was 87.75%, 79.97%, and 66.71%, respectively. The proposed model could be improved by adding a static element. Moreover, feature extraction must be implemented, which converts most network characteristics into CSV files to detect malware at the multilayer level (packet, flow, conversation, and connection). In addition, the existing model needs to be implemented by considering more criteria when identifying Android malware.
2.2 Android Detection Based on Deep Learning
Hussain et al. [32] introduced a new system based on phantom routing technique to detect adversary malware. The system detects malware by processing the bytecode, which is treated as text and then analyzed. The system was based on three different sets of data. The first Dataset was obtained from the Android malware genome project, containing 2,123 applications, of which 863 are benign, and 1,260 are malicious applications that classify 49 types of malware. The second Dataset was obtained from the McAfee labs, consisting of 2,475 malicious programs and 3,627 benign applications. The third Dataset is also from the McAfee labs, comprising information for approximately 18,000 Android applications. The results showed that the system could classify over 3000 applications per second. Furthermore, the system’s accuracy reached 98% when using the first, 80% when using the second, and 87% with the third.
Stiawan et al. [33] developed Android malware detection with autonomous representation learning in another study. The sample set for the examination consisted of 91,000 applications. With 40 samples per family, in the detection task, the highest F1-score achieved was 99%. MalDozer provides automated feature engineering for new malware variants during the training phase. It employs minimum processing, making it suitable for deployment on tiny devices. With comparable speed, MalDozer can trace malware and classify it to the correct malware family. On the other hand, like any static analysis-based detection system, MalDozer is vulnerable to dynamic code loading and reflection obfuscation, where the app gets the malicious script and runs it at runtime. Additionally, MalDozer does not honour natives.
With similar objectives and API calls, Lee et al. [34] used deep neural networks (DNN) to detect Android malware and categorize it as benign or malware. The study used gradient descent for optimization. The model extracts feature from each application’s Android manifest file and other Java files. The contribution of this work consists of using a dataset containing types of malware collected from 2013 to 2017, as well as using features not explored in previous investigations, such as API calls, intent filters, and permission combinations. The number of applications collected is 1,200, of which 600 are benign, and 600 are malicious. The accuracy of the model reached 95.31%.
Furthermore, Feng et al. [35] proposed an artificial neural network (ANN) based model to classify malware types. They built a dataset that includes 20,000 Android malware with 200 features. The Dataset was constructed using virus information service (VIS) reports, and they added new features such as opcodes. This study has classified more than 1,000 types based on their characteristics. However, some types have been repeated for small numbers and expressed as “others.” Thus, the total number of malware was 223. The results showed that the accuracy of the proposed model reached 85.76%. Feng et al. [35] aimed to improve Android malware detection using 16479 apps containing benign and malware samples. They implemented a two-tier model, where the first tier uses permission, intent, and component information-based static malware detection model. Through the combination of static features and fully connected neural networks, it was able to detect the malware and test its efficacy with 95.22%. In the second tire, they used a combination of CNN and AutoEncoder. In the second tier, a binary classification accuracy of 99.3%, a multi-class classification accuracy of 98.2% for malware category detection, and a multi-class classification accuracy of 71.48% for malicious family categorization were yielded.
More recently, Alzaylaee et al. [36] explored the performance of DL-Droid via a series of experiments that aimed to increase the accuracy of zero-day Android malware detection using a dataset consisting of 31125 samples. The authors concluded that adding static feature permissions enhances the accuracy of DL-detection droids, reaching 98.5%. This model can potentially improve self-adaptation to the performance of DL-based malware detection systems. The findings also emphasize improving input generation for dynamic analysis systems that use machine learning to detect Android malware. Furthermore, Kim et al. [37] proposed a malware analysis system that can be deployed in mobile devices with low computation. The proposed system uses CNN to detect shared features among malware API call graphs. It also uses a lightweight learner that computes the similarity between API call graphs utilized in malicious operations and API call graphs of apps to be categorized. The results demonstrated the effectiveness of the proposed system, achieving an accuracy of 91.27%. Additionally, the system can classify the applications 145.8% faster, with a memory consumption of 10 times less than previous models.
Albakri et al. [38] combined DL with rock hyrax swarm optimization (RHSO) for detecting Android malware attacks. The RHSO was mainly used to select the most contributing features to the target class. The DL model used for classification is the attention recurrent autoencoder optimized using the Adamax optimizer. The proposed model achieved an accuracy of 99.05%.
Lately, Xie et al. [39] utilized two open-source datasets: CIC-AndMal2017 and CICMalDroid2020, to build a classification model for detecting Android malware. The authors used InfoGain and Chi-square test for feature selection. After that, they optimized five classifiers using a genetic algorithm and combined them in a stacking ensemble. The proposed stacking model achieved an accuracy of 98.43% using the first Dataset and 98.66% using the second Dataset.
According to the literature, some studies have been undertaken for Android malware detection to determine whether an application is malware or benign [40]. Some other studies classified malware applications based on their families. Although most previous studies performed well, updated malware has some limitations. The limitations can be resolved by using an updated dataset considering the sequence in which the rules come and observing how different approaches interact to produce a better result, such as integrating static and dynamic application analysis. Furthermore, as malware becomes more complex and the classifier’s performance may gradually reduce, it is recommended to keep the Dataset up to date to train the model with more evolved malware and extract the most relevant features to attain more accurate results. Accordingly, this study aimed to utilize a study not investigated in previous studies. ML classifiers were trained using the selected Dataset with a hypothesis to avoid previous studies’ drawbacks and yield an outstanding result. Furthermore, most reviewed studies have been found to use black-box models such as RF, DNN, SVM, ET, and ANN. Therefore, in the current study, we have used post hoc EAI to add transparency to the ET classifier. Table 1 below summarizes all studies mentioned in this section.

This study aimed to implement an ML-based model for detecting Android malware that provides timely prediction. The proposed methodology is illustrated in Fig. 1, where a new dataset, TUANDROMD, was utilized, consisting of 4465 different apps classified into malware and goodware [46]. Three ML classifiers: Extra tree (ET), random forest (RF), and support vector machine (SVM) was trained and compared in terms of six measures: accuracy, precision, sensitivity, F1-score, Cohen’s Kappa, and elapsed time.
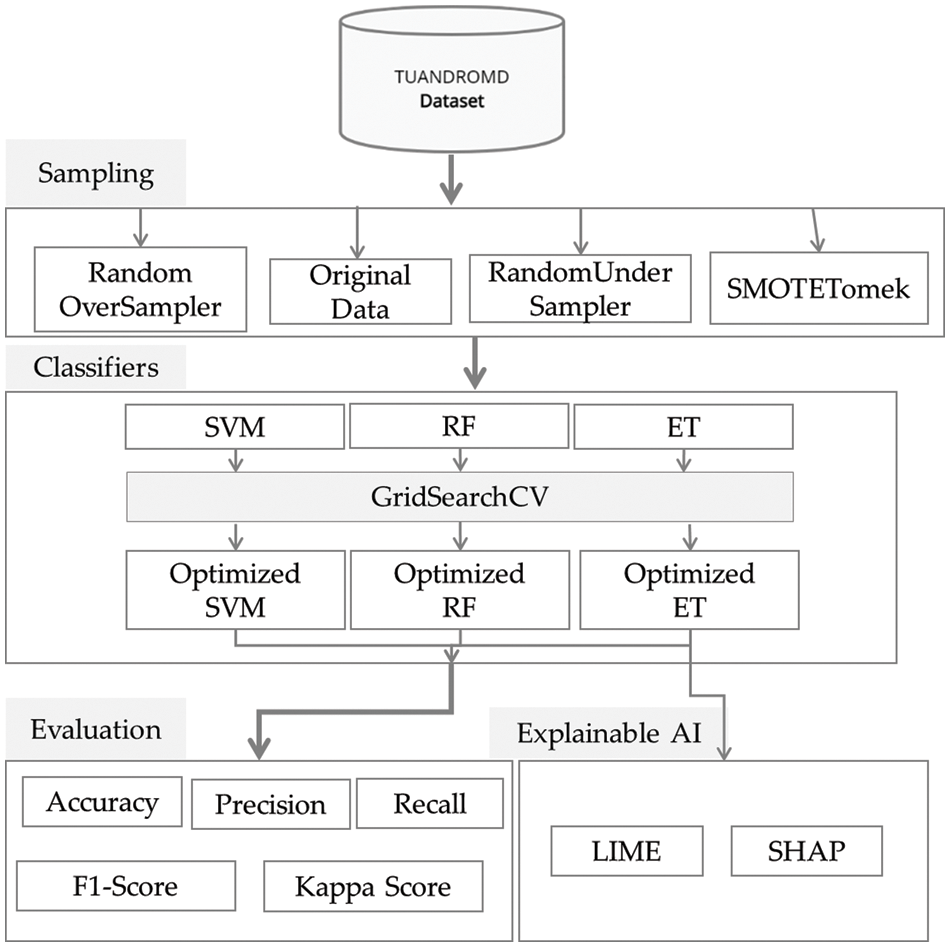
Figure 1: Block diagram of proposed study methodology
3.1 Description of the Dataset
The TUANDROMD dataset is used in this study, comprising 178 permission-based and 186 API-based features relevant for differentiating between malware and benign Android apps. The Dataset contains 4465 applications divided into 135 categories and 71 malware families, with around 900 applications classified as goodware. There are 242 binary attributes in the Dataset, with 71 labels related to the malware family. The Dataset comprises 3565 malware records and 899 goodware records, as shown in Fig. 2. It was observed that the data is highly imbalanced. Therefore, three sampling techniques were performed to balance the Dataset: RandomOversampler SMOTETomek, and RandomUndersampler. Fig. 2 demonstrates the number of samples per category before and after applying the sampling techniques. Furthermore, since the Dataset had already been pre-processed before publication, no pre-processing steps were applied in this study.
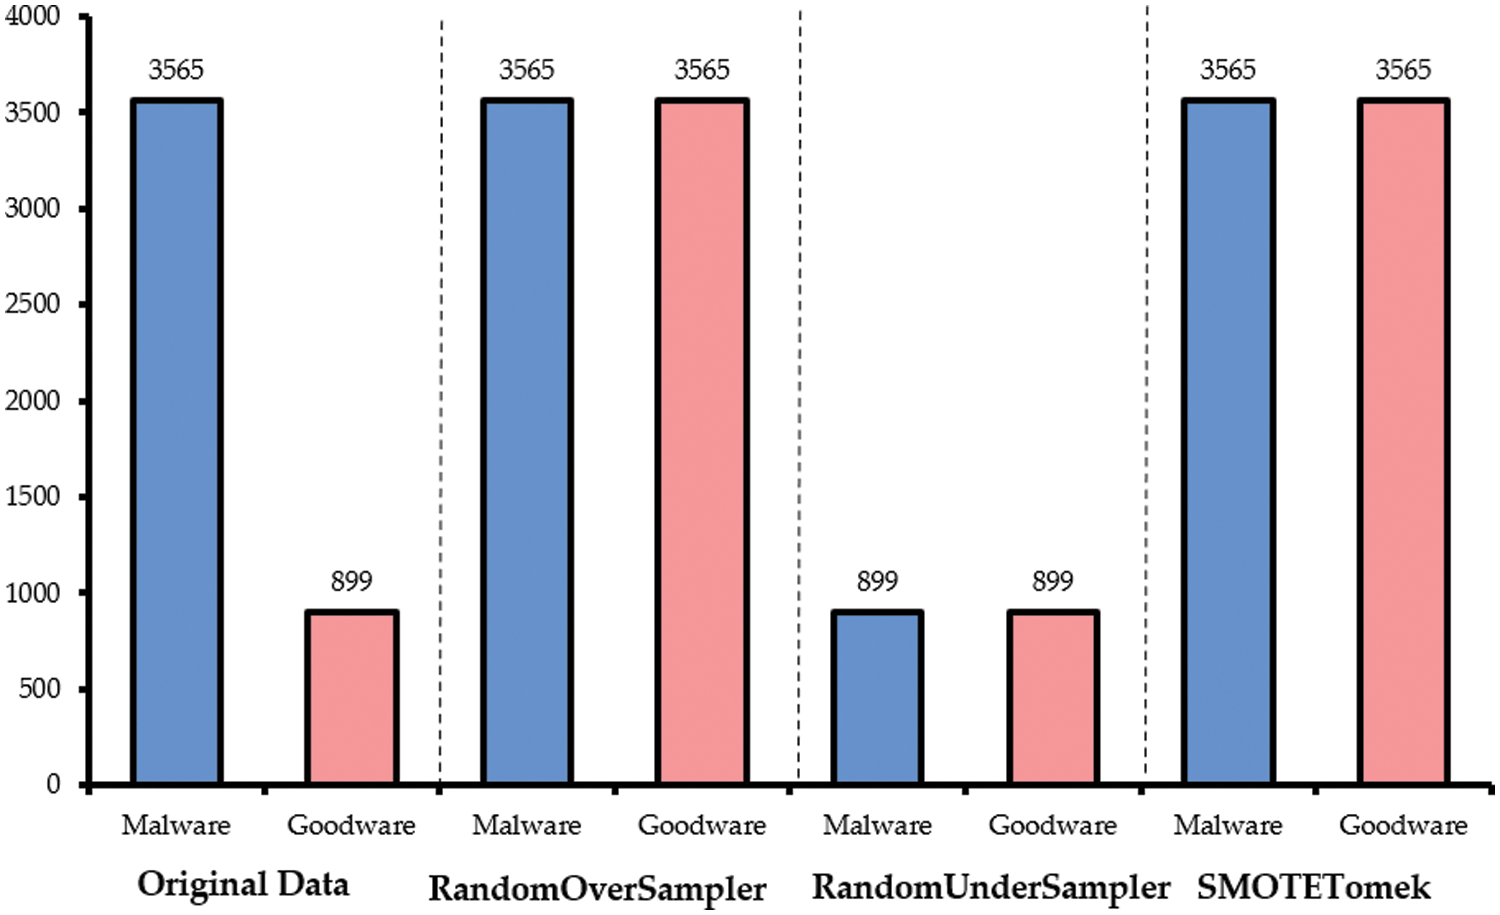
Figure 2: Number of samples per category before and after applying the data balancing techniques
According to Borah et al. [12], the Dataset they collected is not balanced but can be balanced by collecting more samples or using sampling techniques. Therefore, the effect of applying three sampling techniques, namely, RandomOversampler, RandomUnderSampler, and SMOTETomek, were investigated by measuring the proposed models’ performances.
RandomOverSampler is a non-heuristic method that replicates minority class instances at random to balance class distribution. Consequently, RandomOverSampler added 2,666 positive samples to the Dataset with 899 positives and 3,565 negative cases. However, since RandomOverSampler produces the exact copies of minority class examples, it can increase the likelihood of overfitting [47].
RandomUnderSampler is a non-heuristic method that reduces most class instances at random to balance the classes’ distribution. Consequently, RandomUnderSasmpler eliminated 2,666 negative samples from the utilized Dataset, resulting in 899 malware and 899 goodware instances. Undersampling contributes to reducing the computational burden of analyzing massive datasets. However, it may cause the loss of potentially relevant data [48].
3.2.3 Synthetic Minority Oversampling with Tomek Links (SMOTETomek)
SMOTE performs by generating artificial samples using k-nearest neighbours and sampling with replacement to add instances to the minority class. Tomek links is an undersampling technique that eliminates samples belonging to the majority class that is too close to those belonging to the minority class [48]. Accordingly, combining SMOTE with Tomek links is considered an over-under-sampling technique. After applying SMOTETomek, the positive class comprised 3,565 samples, and the negative class comprised 3,565.
3.3 Description of the Classifiers
Three classification techniques, ET, RF, and SVM, were trained and compared to find the best-performing model for classifying malware in Android devices. The following section discusses the classifiers theoretically.
ET, also called Extremely Randomized Trees, is a form of ensemble learning that outputs a classification result by combining the outcomes of several de-correlated decision trees gathered in a “forest.” It is similar to RF but enhances the variation using a different approach to building trees. Each decision stump is constructed using a specific criterion: as follows. First, use all available data to build the stump. Second, take the square root of the feature number to create a subset of randomly selected features of equal size that can be used to select the best split, and that can be used to build the root node or any node. Third, one is the maximum depth of the decision stump. Considering this approach, the randomized selection of the features and tree creation is the power of this classifier, making it computationally inexpensive compared to the RF classifier. The information gain is used as a decision criterion that first calculates the entropy using the following formula in Eq. (1):
where c is the output label, n is the number of unique class labels, and
Finally, using the information to gain maximum value results, the ET forest is the most important variable to determine the output label [49,50].
3.3.2 Random Forest Classifier
RF is one of the most effective ML algorithms that use many decision trees. It is an ensemble of trees built from a training set and verified to classify the target class. It reduces the model sensitivity to the original data by bootstrapping and decreases variance using random feature selection. RF comes in various forms, but the basic one works as follows. First, it generates many datasets from the original, each containing random rows with the same number of records as the original Dataset. This step is called bootstrapping. Each decision tree is then trained separately by selecting random features from each bootstrapping Dataset. The next step is to build the trees using information gain criteria to choose the splitting features as explained in the previous classifier. Finally, all predictions must be combined using the majority vote as the final result, known as aggregation [50].
SVM is an ML algorithm based on Vapnik’s statistical learning theory that seeks to improve the model’s ability in the generalization process. The most important feature of this method is its ability to overcome local minimum limits and the curse of dimensionality. Based on the training set, the SVM tries to find a line that separates two labels, known as the “hyperplane line,” and support vectors are the points closest to the hyperplane. There can be multiple lines between category labels, but the one with the widest margin between the two labels is chosen. Thus, when the classifier is applied to the test set, SVM compares each record to the hyperplane line and classifies it with either the first or second class. The formula for SVM is mentioned in Eq. (3)
where each input has weight, then calculate the corresponding output value based on the weight and bias/intercept. Moreover, the formula of each label lying above the hyperplane is
Each ML model has two types of parameters: hyper-parameters and model parameters. Hyper-parameters are the values the programmer configures using trial-and-error that contribute to increasing the algorithm’s learning performance. On the other hand, a model’s parameters alter independently based on the optimal hyper-parameter found. One of the most popular hyper-parameters tuning techniques is GridSearchCV, which tries all possible combinations of values defined in a grid to find the best using cross-validation. This study, 10-fold cross-validation was applied to the training set to find the optimal hyper-parameters for each algorithm in all experiments. Table 2 outlines the optimal hyper-parameter values for each algorithm in the different sets of experiments.

This study utilized six performance measures to compare the performance of the proposed ML models: accuracy, precision, recall, F1-score, Cohen’s kappa, and elapsed time. Accuracy refers to the percentage of cases correctly classified. However, it can be misleading in the case of highly imbalanced datasets. Precision refers to how well a model produces positive outcomes, whereas recall refers to how well a model categorizes positive samples. In an imbalanced dataset, F1-score gives a better indicator than accuracy, combining the results of the precision and recall scores in a single score. The agreement between predicted and real labels is measured by Cohen’s kappa score, which
4 Experimental Setup and Result
The experiment was implemented using the Python version 3.8.5, Sklearn version 1.0.2, and imbalanced-learn version 0.8.0, with a fixed seed value of 42. Four experiments were conducted: Using original data, over-sampled data using RandomOverSampler, over-under-sampled data using SMOTETomek, and under-sampled data using RandomUnderSampler. All experiments’ data were split into 70% for training and 30% for testing. GridSearchCV with 10-fold cross-validation was utilized to tune the algorithms’ hyper-parameters. The three models in each experiment were evaluated using six performance measures. Table 3 Represents the proposed classifiers’ performance without applying data sampling techniques to the Dataset, Table 4 Represents the proposed classifiers’ performance with RandomOverSampler, and Table 5 Shows the classifiers’ performance after the SMOTETomek over-undersampling technique, and Table 6 Represents the performance of the classifiers using RandomUnderSampler.


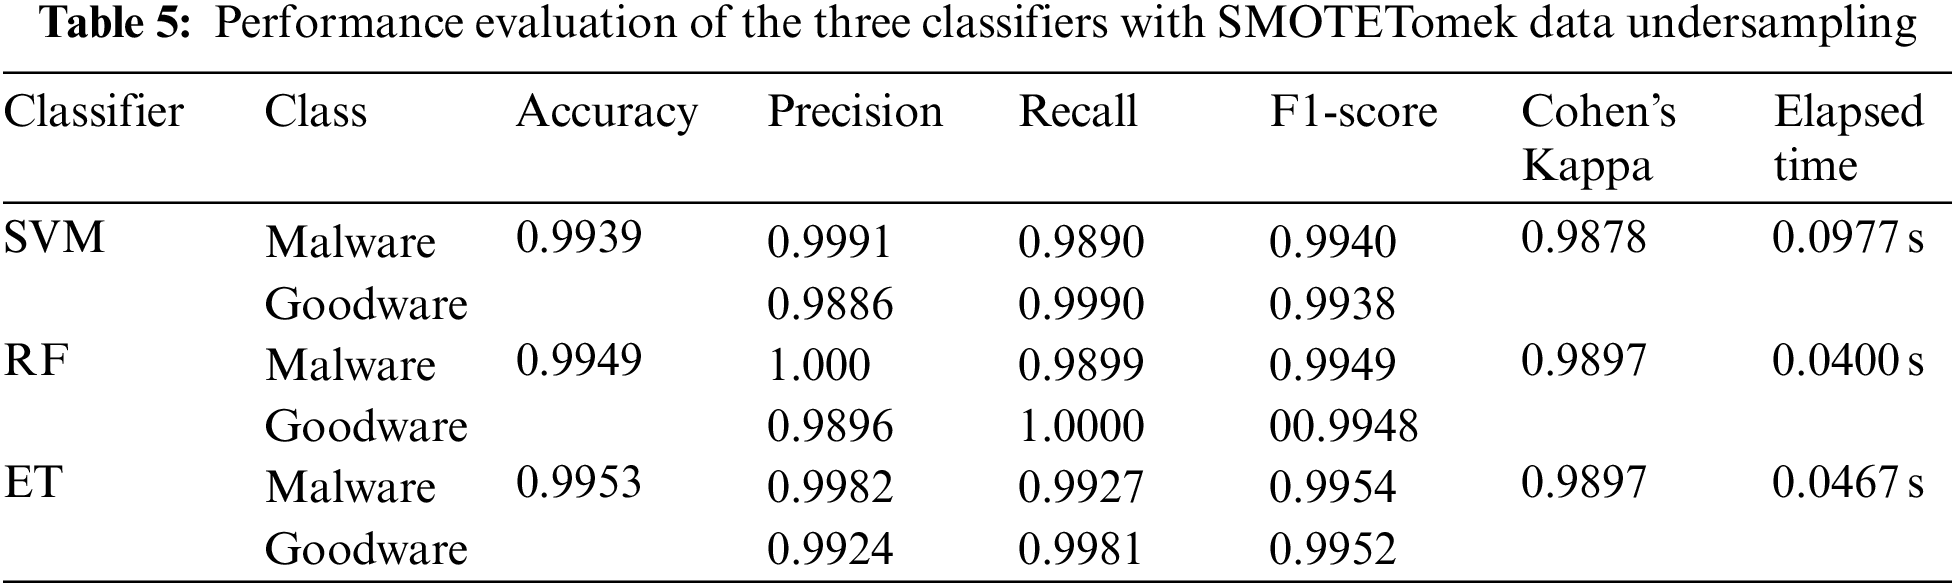
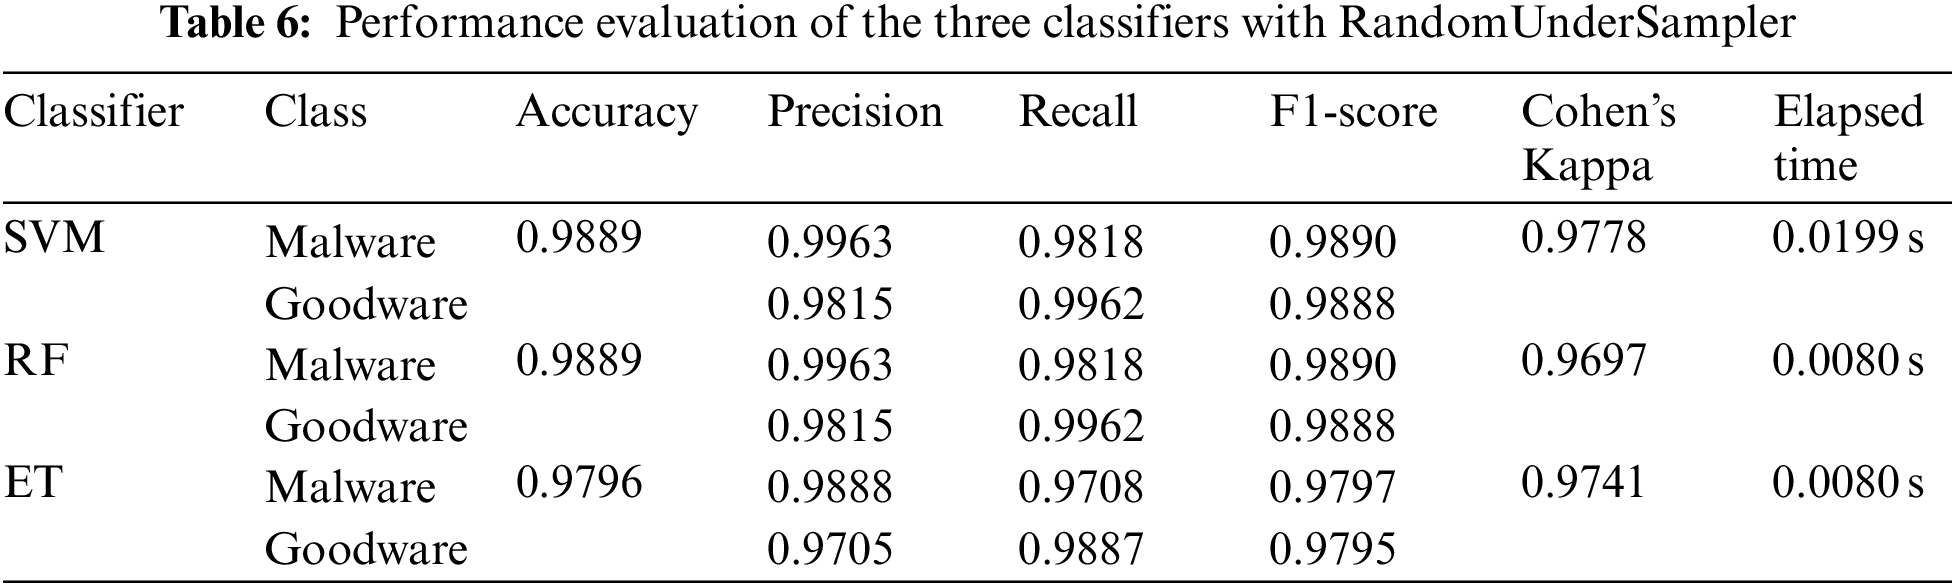
Overall, the results indicate that the highest accuracy is achieved in experiments 2 and 3, where the RandomOverSampler and SMOTEtomek sampling techniques were applied to the Dataset before training the algorithms. On the other hand, the least performance is recorded when using the RandomUnderSampler technique. The highest accuracy of 99.53% is obtained using the SVM and ET models in experiment 2 and the ET model in experiment 3. However, since malware detection is one of the security issues requiring fast performance, it is concluded that the ET model outperformed the SVM model with an elapsed time of 0.0198 s. Even though ensemble learners have a higher time complexity than base learners, SVM recorded a higher elapsed time than the ensemble learners since the data was not normalized in the pre-processing stage. To further compare the results in terms of true positive, true negative, false positive, and false negative counts, confusion matrices were constructed and represented in Fig. 3.
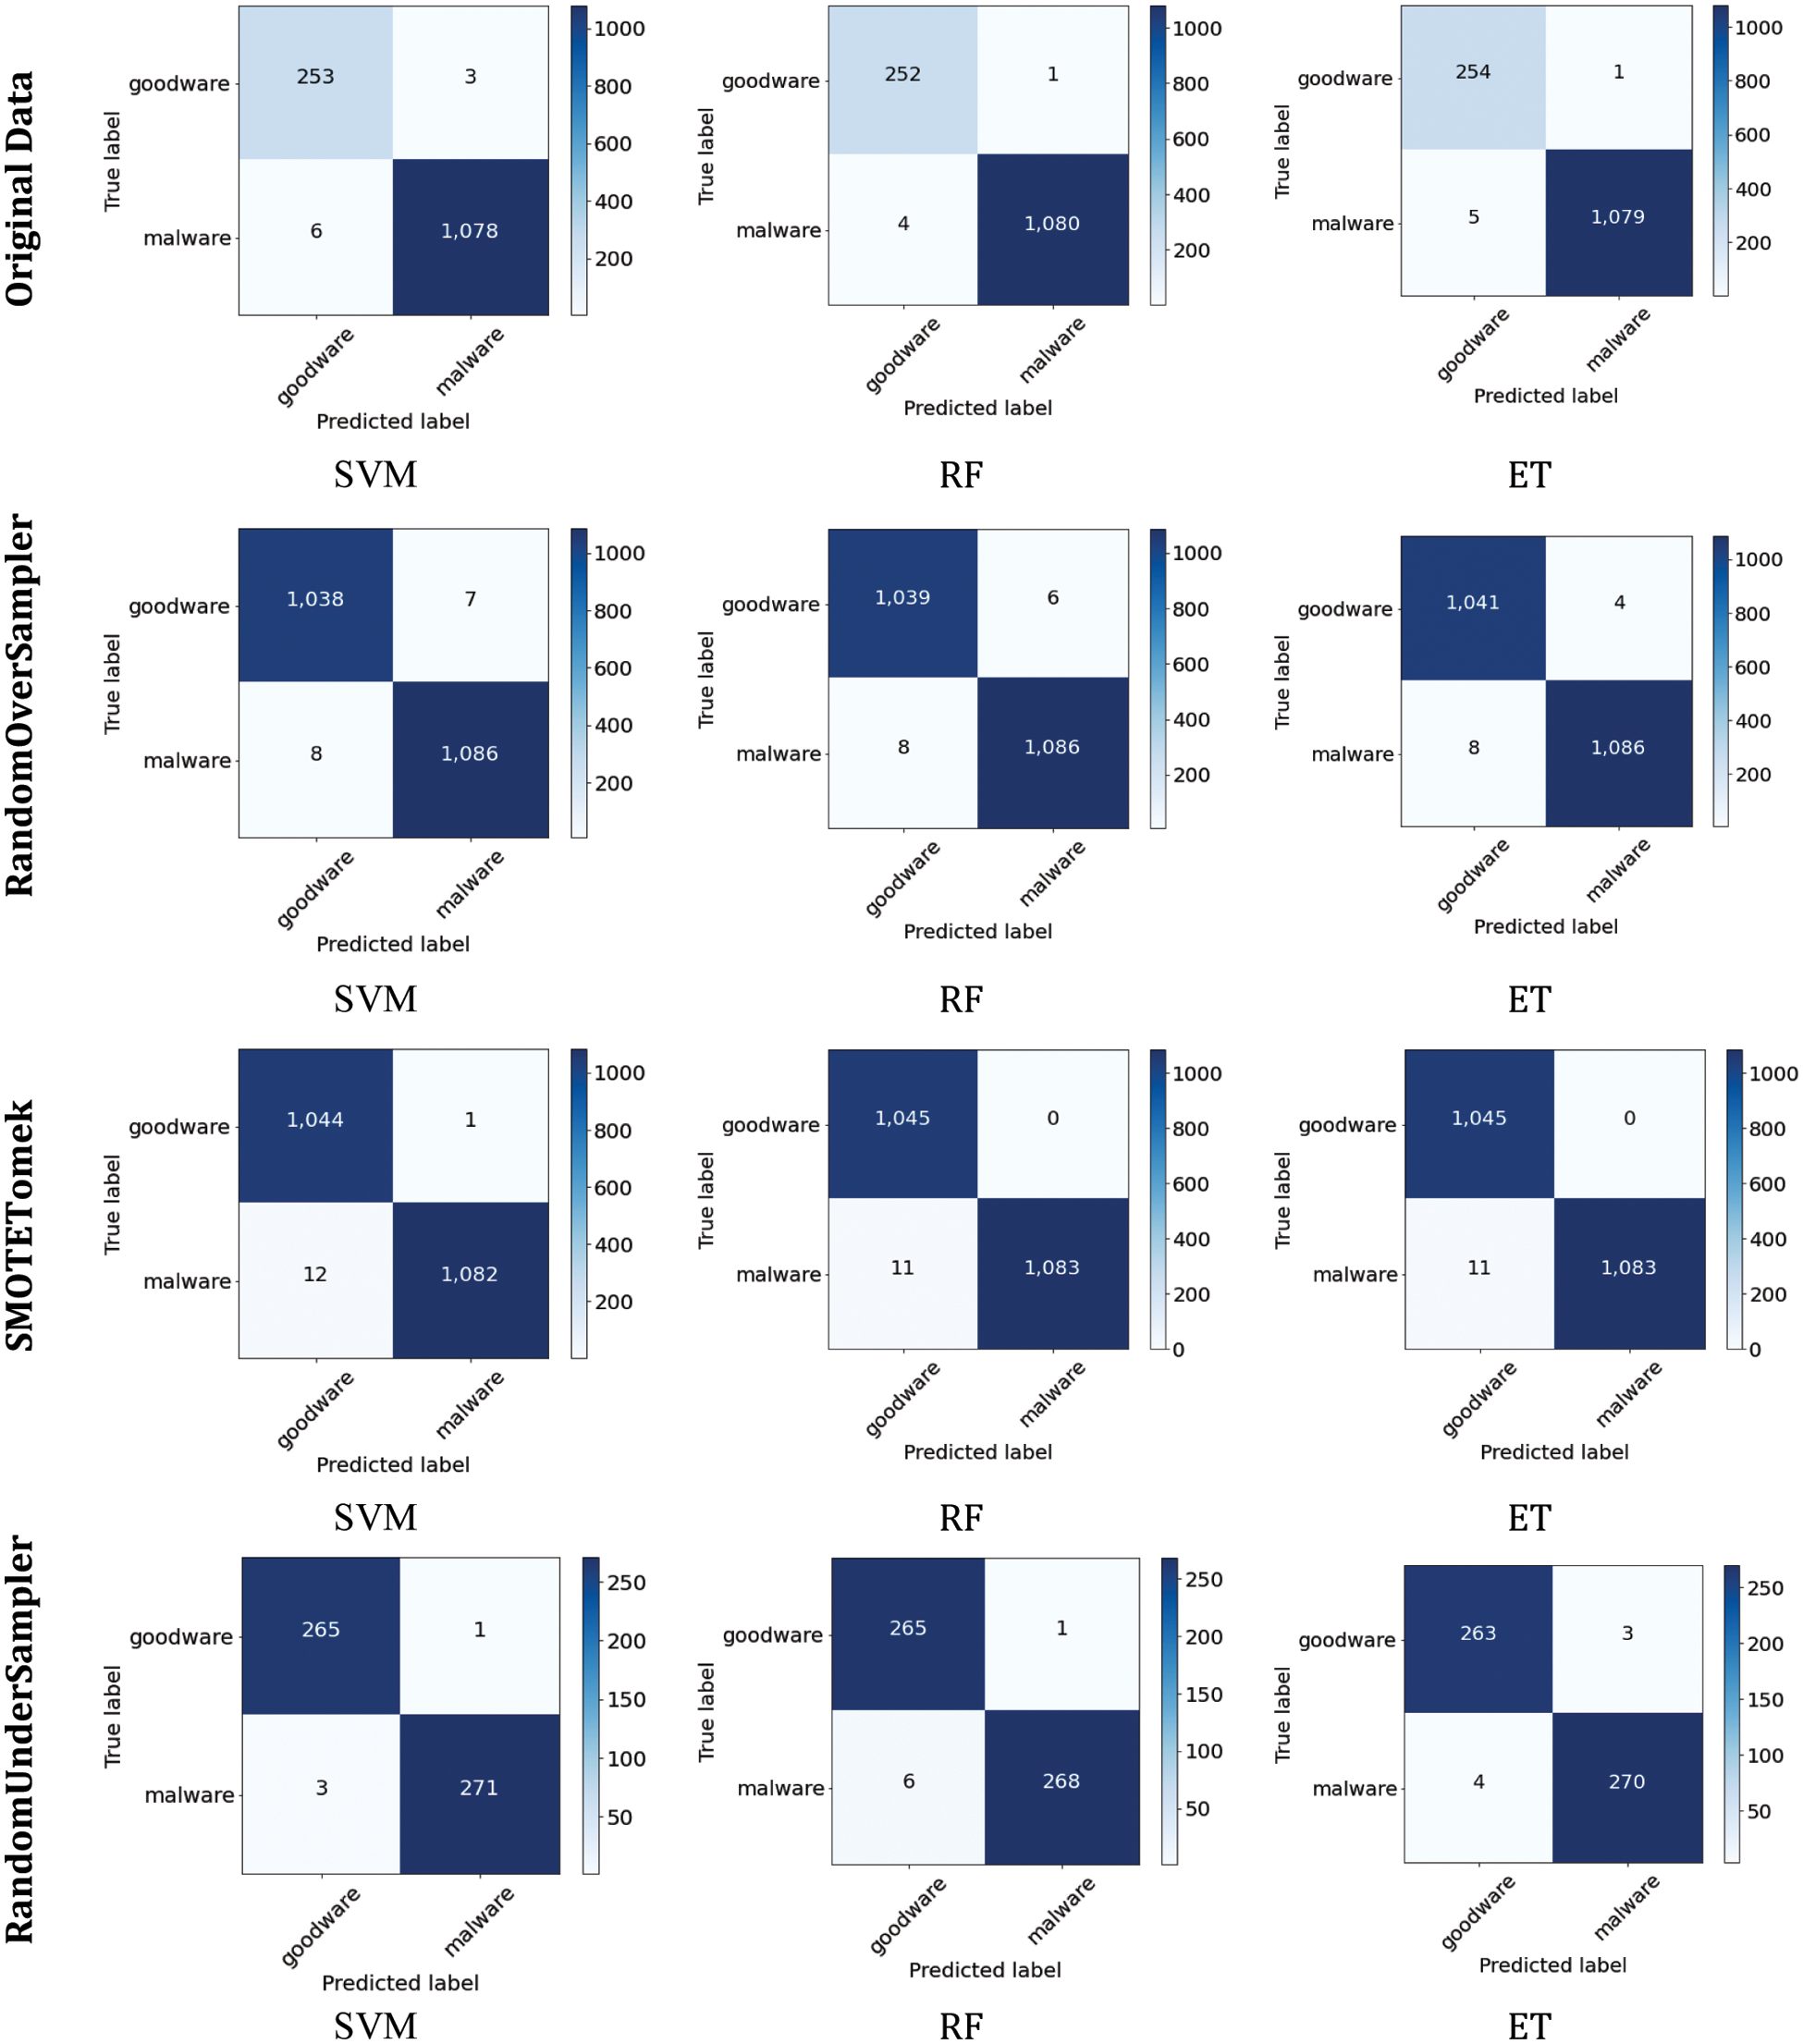
Figure 3: Confusion matrix for classifiers in three different cases
By comparing the results of the models in each experiment, it is evident that all models performed equally well in experiment 1. Furthermore, it is marked that all models performed equally in identifying malware events in experiment 2, whereas ET achieved the lowest false-positive counts. On the other hand, it is shown that ensemble learners outperformed in experiment 3, whereas SVM achieved the best results in experiment 4. From Table 3 it was concluded that ET performed the best in experiments 2 and 3. Failure to detect malware events could lead to serious consequences, including critical information getting compromised, intelligent systems, and slowing down daily business operations. Accordingly, looking in-depth into the false positive and false negative counts, it is indicated that ET performed better in experiment 2 since it achieved a lower false negative count.
Based on the literature review results, it is found that the study by Alzaylaee et al. [36] used an RF classifier and achieved an F-score of 92.6%. Another study by Martín et al. [28] used RF to obtain an F-score of 89%. Yang et al. [30] and Stiawan et al. [33] conducted a study on malware detection on Android devices and achieved the highest F-score of 95.1% and 95.3% accuracy, respectively, utilizing the same classifier. Compared with the TUANDROMD dataset, this study achieved an F-score of 99.58% for detecting malware events and 98.25% for detecting goodware events using the RF classifier with an elapsed time of 0.0240 s. Several data sampling techniques were applied to improve the results since the Dataset utilized was imbalanced. ET outperformed other classifiers after utilizing the RandomOverSampler technique, achieving an accuracy of 99.53%. Comparing our study to the test results published in the literature, ours outperforms them all before and after applying the sampling techniques, with an elapsed time of less than one millisecond. Although McLaughlin et al. [31] achieved higher accuracy than our study, the Dataset utilized in their study is considered outdated since more sophisticated Android malware was developed after 2017.
The suggested approach can be useful in detecting Android malware efficiently while identifying the most contributing features to the given prediction. As a result, it may be quite beneficial to analyze the nature of malware events and lower their likelihood at high speed. However, some limitations accompany the model’s performance, including the number of features and its inability to classify the malware type.
5 Explainable Artificial Intelligence
ML models’ current evolution and rapid advancements proved to be highly effective in cyber security, including intrusion detection, malware detection, and spam filtering. Despite their impressive performance, ML models lack explainability, which reduces users’ confidence in the models used to defend against cyberattacks, particularly in today’s increasingly complex and diverse cyberattacks [28]. To overcome this burden, EAI has been introduced to analyze and understand the decisions made by ML models. There are two categories of EAI techniques: global and local explanations. Global explanations provide insight into the model’s behaviour and explain the effect of each feature on the class label. On the other hand, local explanations justify the model’s explanation for one instance. In this study, the Shapely additive explanation (SHAP) was utilized for the global explanation, whereas the local interpretable model-agnostic explanation (LIME) was used for the local explanation.
SHAP is an EAI technique that provides a global explanation by calculating Shapley values as a game theory concept based on players and rewards. Based on each feature’s Shapley value, it can be estimated how much each feature contributed to the result [17]. The SHAP library was utilized in this study to form the explanation for the ET-RandomOverSampler model, as illustrated in Fig. 4, which shows the top 20 features contributing to the model’s performance. It is concluded that the top three features contributing to the goodware class are: Ljava/net/URL;->openConnection, Landroid/location/LocationManager;->getLastKgoodwarewnLocation, and Vibrate. On the other hand, the top three features contributing to the malware class are Receive_Boot_Completed, Get_Tasks, and Kill_Background_Processes.
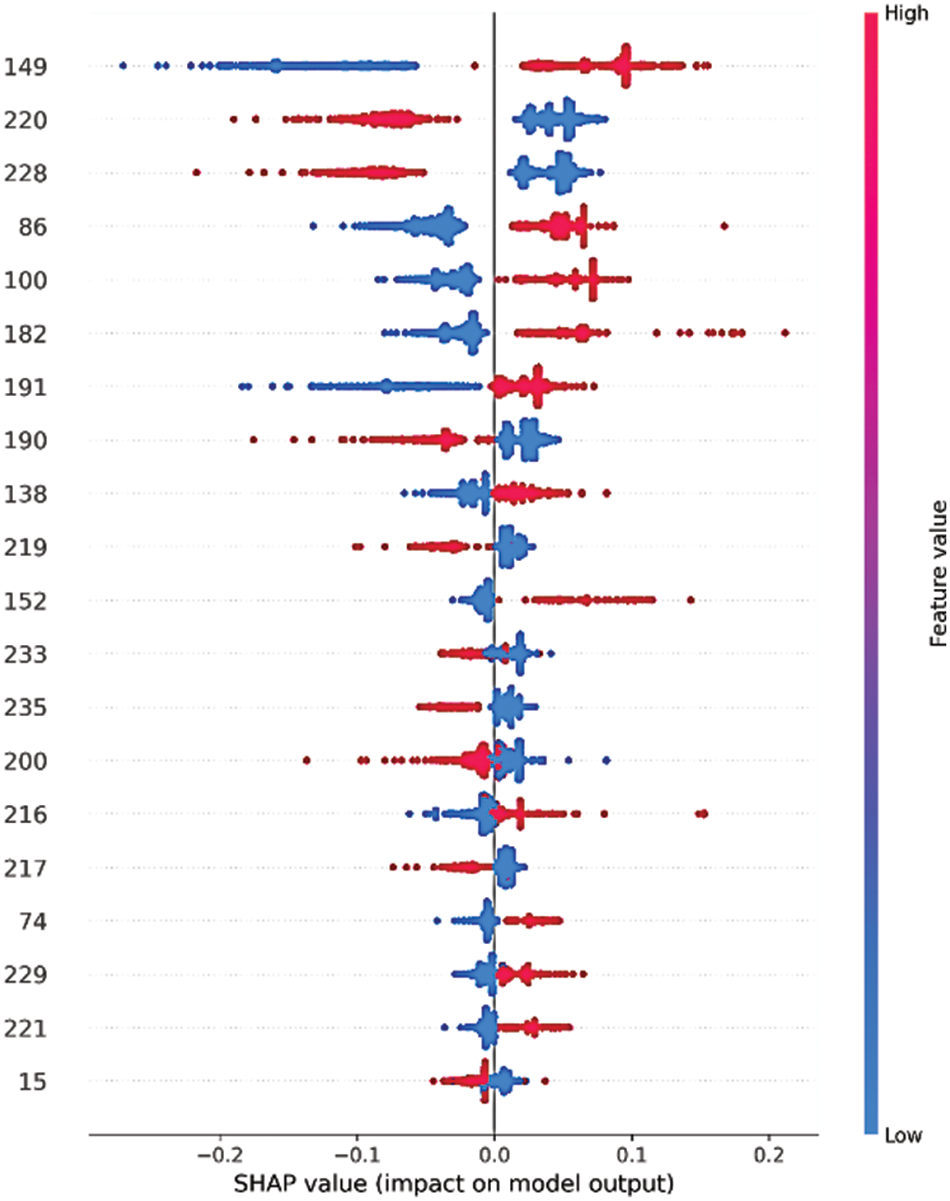
Figure 4: The shapely values of the top 20 contributing features using the ET-RandomOverSampler model
LIME is one of the popular EAI techniques that provides a local explanation using Lasso or short trees. This technique analyzes the model’s behaviour in predicting a single instance [16], as illustrated in Figs. 5 and 6, which shows the top 10 features contributing to the model’s performance. It is indicated that all features except Landroid/location/LocationManager;->getLastKgoodwarewnLocation, Ljava/net/URL;->openConnection, and Sdcard Write contributed to predicting the instance as goodware. Conversely, all the instances, except for System_Alert_Windows, Receive_SMS, and Media_Button, contributed to categorizing the instance as malware.
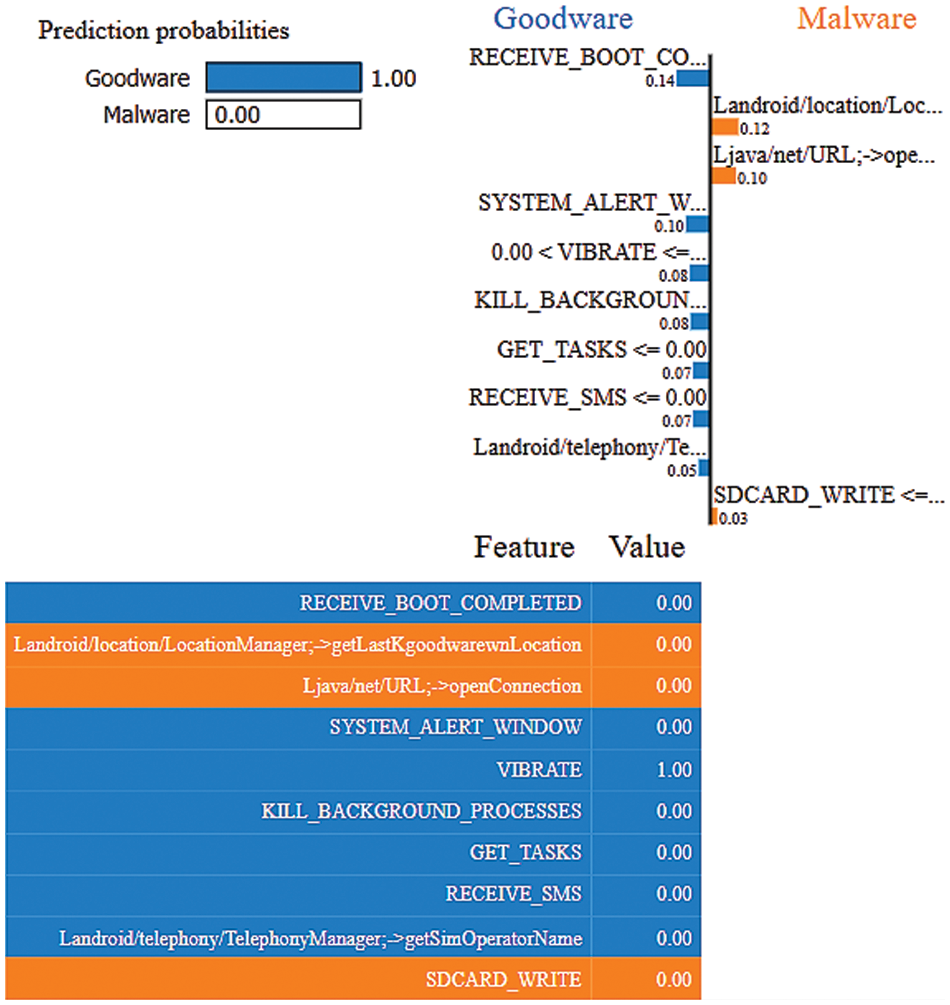
Figure 5: LIME results using the ET-RandomOverSampler model for the goodware event
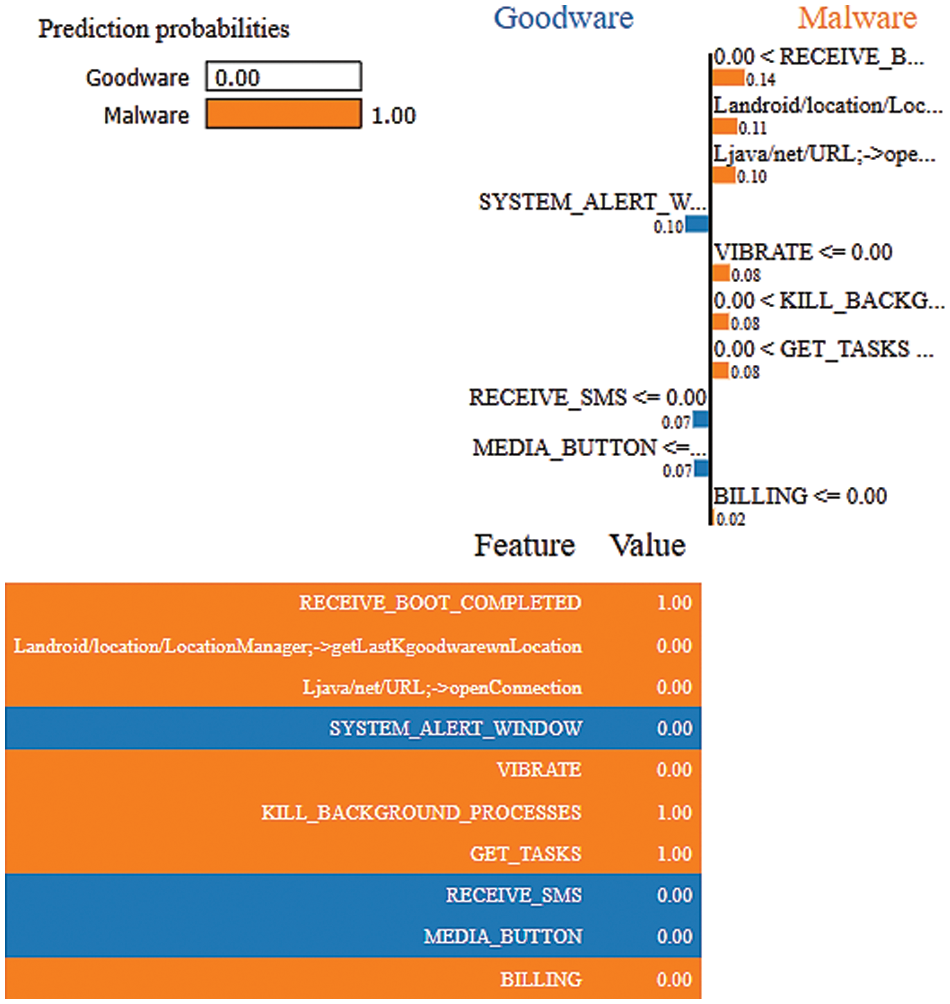
Figure 6: LIME results using the ET-RandomOverSampler model for malware event
Malware has been forming dangerous threats to Android users over the last few years, stealing their personal information and slowing their devices. ML algorithms showed promising results in the real-time detection of malware events. Accordingly, this study aimed to classify Android programs into malware and goodware. The performance of three classifiers, SVM, RF, and ET, were compared and evaluated in four experiments using the up-to-date TUANDROMD dataset. This research showed that different sampling techniques had diverse effects on the performance of ML algorithms. Four experiments were done in this study, where the imbalanced data was used to train the algorithms in the first experiment. In contrast, RandomOverSampler, SMOTETomek, and RandomUnderSampler were applied in the second, third, and fourth experiments, respectively. Additionally, the study proved the ability of ML to accurately and rapidly identify Android malware, where the results demonstrated the reliability of the ET-RandomOverSampler model in differentiating between malware and goodware events with an accuracy of 99.53% with an elapsed time of 0.0198 s. Furthermore, EAI techniques were employed to understand the proposed model’s decisions better. Despite the promising results, there is room for improvement by incorporating more applications to overcome the imbalance issue. Additionally, the effect of different feature selection techniques could be investigated to reduce the time complexity. Besides, the proposed paradigm could be deployed in a web-based application for real-time applications.
Acknowledgement: We would like to thank SAUDI ARAMCO Cybersecurity Chair for funding this project.
Funding Statement: This work was funded by the SAUDI ARAMCO Cybersecurity Chair at Imam Abdulrahman Bin Faisal University, Saudi Arabia.
Author Contributions: Conceptualization, N.A. and I.U.K.; methodology, S.A.B.; software, A.A.; validation, L.A.A., R.M.K.; formal analysis, Z.A.A.; investigation, T.H.; resources, S.S.A.; data curation, N.A.; writing—original draft preparation, I.U.K.; writing—review and editing, T.H.; visualization, S.S.A.; supervision, N.A.; project administration, S.S.A.; funding acquisition, I.U.K. All authors have read and agreed to the published version of the manuscript.
Availability of Data and Materials: The study used an open-source dataset.
Conflicts of Interest: The authors declare that they have no conflicts of interest to report regarding the present study.
References
1. “Interview with mobile phone inventor Marty Cooper—BBC News,” 2022. [Online]. Available: https://www.bbc.com/news/av/technology-22020666 [Google Scholar]
2. J. Khan, H. Abbas and J. Al-Muhtadi, “Survey on mobile user’s data privacy threats and defense mechanisms,” Procedia Computer Science, vol. 56, no. 1, pp. 376–383, 2015. [Google Scholar]
3. “Forecast number of mobile users worldwide 2020–2025|Statista,” 2022. [Online]. Available: https://www.statista.com/statistics/218984/number-of-global-mobile-users-since-2010/ [Google Scholar]
4. “IDC—Smartphone Market Share—Market Share,” 2022. [Online]. Available: https://www.idc.com/promo/smartphone-market-share/market-share [Google Scholar]
5. “Newsroom, Announcements and Media Contacts|Gartner,” 2022. [Online]. Available: https://www.gartner.com/en/newsroom [Google Scholar]
6. H. Wang, Z. Liu, J. Liang, N. V. Rodriguez, Y. Guo et al., “Beyond google play: A large-scale comparative study of Chinese android app markets,” in Proc. of IMC, New York, NY, USA, pp. 293–307, 2018. [Google Scholar]
7. F. Wei, Y. Li, S. Roy, X. Ou and W. Zhou, “Deep ground truth analysis of current android malware,” in Lecture Notes in Computer Science, Cham, Springer, vol. 10327, pp. 252–276, 2017. [Google Scholar]
8. D. Dinkar, “McAfee Labs Threats Report: March 2016,” 2016. [Online]. Available: www.mcafee.com/us/mcafee-labs.aspx [Google Scholar]
9. M. Abuthawabeh and K. Mahmoud, “Enhanced android malware detection and family classification, using conversation-level network traffic features,” The International Arab Journal of Information Technology, vol. 17, no. 4, pp. 607–614, 2020. [Google Scholar]
10. B. Rashidi and C. J. Fung, “A survey of android security threats and defenses,” Journal of Wireless Mobile Networks, Ubiquitous Computing, and Dependable Applications, vol. 6, no. 3, pp. 3–35, 2015. [Google Scholar]
11. K. Iman, M. Kassiri and M. Salleh, “Preventing collusion attack in android,” International Arab Journal of Information Technology, vol. 12, no. 6, pp. 719–727, 2015. [Google Scholar]
12. P. Borah, D. Bhattacharyya and J. Kalita, “Malware dataset generation and evaluation,” in 2020 IEEE 4th Conf. on Information & Communication Technology (CICT), Chennai, India, pp. 1–6, 2020. https://doi.org/10.1109/CICT51604.2020.9312053 [Google Scholar] [CrossRef]
13. “Mobile Device Security and Data Protection—Android,” 2022. [Online]. Available: https://www.android.com/safety/ [Google Scholar]
14. “Half a million Android users tricked into downloading malware from Google Play|TechCrunch,” 2022. [Online]. Available: https://techcrunch.com/2018/11/20/half-a-million-android-users-tricked-into-downloading-malware-from-google-play/ [Google Scholar]
15. D. Dasgupta, Z. Akhtar and S. Sen, “Machine learning in cybersecurity: A comprehensive survey,” The Journal of Defense Modeling and Simulation, vol. 19, no. 1, pp. 57–106, 2020. [Google Scholar]
16. N. Aslam, I. U. Khan, S. Mirza, A. AlOwayed, F. M. Anis et al., “Interpretable machine learning models for malicious domains detection using explainable artificial intelligence (XAI),” Sustainability, vol. 14, no. 12, pp. 7375, 2022. [Google Scholar]
17. N. Aslam, I. U. Khan, R. F. Aljishi, Z. M. Alnamer, Z. M. Alzawad et al., “Explainable computational intelligence model for antepartum fetal monitoring to predict the risk of IUGR,” Electronics, vol. 11, no. 4, pp. 593, 2022. [Google Scholar]
18. I. U. Khan, N. Aslam, R. AlShedayed, D. AlFrayan, R. AlEssa et al., “A proactive attack detection for heating, ventilation, and air conditioning (HVAC) system using explainable extreme gradient boosting model (XGBoost),” Sensors, vol. 22, no. 23, pp. 9235, 2022. [Google Scholar] [PubMed]
19. S. Alwarthan, N. Aslam and I. U. Khan, “An explainable model for identifying at-risk student at higher education,” IEEE Access, vol. 10, pp. 107649–107668, 2022. [Google Scholar]
20. I. U. Khan, “Explainable artificial intelligence (XAI) model for the diagnosis of urinary tract infections in emergency care patients,” Mathematical Modelling of Engineering Problems, vol. 9, no. 4, pp. 971–978, 2022. [Google Scholar]
21. Z. Zhang, H. Al Hamadi, E. Damiani, C. Y. Yeun and F. Taher, “Explainable artificial intelligence applications in cyber security: State-of-the-art in research,” IEEE Access, vol. 10, pp. 93104–93139, 2022. [Google Scholar]
22. M. K. Alzaylaee, S. Y. Yerima and S. Sezer, “Emulator vs real phone: Android malware detection using machine learning,” in Proc. of the 3rd ACM on Int. Workshop on Security and Privacy Analytics, IWSPA, New York, NY, USA, pp. 65–72, 2017. [Google Scholar]
23. N. Milosevic, A. Dehghantanha and K. K. R. Choo, “Machine learning aided android malware classification,” Computers & Electrical Engineering, vol. 61, pp. 266–274, 2017. [Google Scholar]
24. A. Gosiewska and P. Biecek, “IBreakDown: Uncertainty of model explanations for non-additive predictive models,” 2019. https://doi.org/10.48550/arxiv.1903.11420 [Google Scholar] [CrossRef]
25. G. Suarez-Tangil, S. K. Dash, M. Ahmadi, J. Kinder, G. Giacinto et al., “DroidSieve: Fast and accurate classification of obfuscated android malware,” in Proc. of the Seventh ACM on Conf. on Data and Application Security and Privacy, New York, USA, pp. 309–320, 2017. [Google Scholar]
26. I. Martín, J. A. Hernández, A. Muñoz and A. Guzmán, “Android malware characterization using metadata and machine learning techniques,” Security and Communication Networks, vol. 2018, 5749481, 2018. [Google Scholar]
27. M. Fang, J. Liu, X. Luo, K. Chen, Z. Tian et al., “Android malware familial classification and representative sample selection via frequent subgraph analysis,” IEEE Transactions on Information Forensics and Security, vol. 13, no. 8, pp. 1890–1905, 2018. [Google Scholar]
28. I. Martín, J. A. Hernández and S. de los Santos, “Machine-learning based analysis and classification of android malware signatures,” Future Generation Computer Systems, vol. 97, pp. 295–305, 2019. [Google Scholar]
29. A. Mehtab, W. B. Shahid, T. Yaqoob, M. Amjad, H. Abbas et al., “AdDroid: Rule-based machine learning framework for android malware analysis,” Mobile Networks and Applications, vol. 25, pp. 180–192, 2020. [Google Scholar]
30. M. Yang, X. Chen, Y. Luo and H. Zhang, “An android malware detection model based on DT-SVM,” Security and Communication Networks, vol. 2020, Article ID 8841233, 2020. [Google Scholar]
31. N. McLaughlin, J. M. D. Rincon, B. Kang, S. Yerima, P. Miller et al., “Deep android malware detection,” in Proc. of the Seventh ACM on Conf. on Data and Application Security and Privacy, NY, USA, pp. 301–308, 2017. [Google Scholar]
32. T. Hussain, B. Yang, H. U. Rahman, A. Iqbal, F. Ali et al., “Improving source location privacy in social Internet of Things using a hybrid phantom routing technique,” Computers & Security, vol. 123, pp. 102917, 2022. [Google Scholar]
33. D. Stiawan, S. M. Daely, A. Heryanto, N. Afifah, M. Y. Idris et al., “Ransomware detection based on opcode behavior using k-nearest neighbors algorithm,” Information Technology and Control, vol. 50, pp. 495–506, 2021. [Google Scholar]
34. Y. Lee, Y. Kim, S. Lee, J. Heo and J. Hong, “Machine learning based android malware classification,” in Proc. of the Conf. on Research in Adaptive and Convergent Systems (RACS ’19), New York, NY, USA, Association for Computing Machinery, pp. 300–302, 2019. [Google Scholar]
35. J. Feng, L. Shen, Z. Chen, Y. Wang and H. Li, “A two-layer deep learning method for android malware detection using network traffic,” IEEE Access, vol. 8, pp. 125786–125796, 2020. [Google Scholar]
36. M. K. Alzaylaee, S. Y. Yerima and S. Sezer, “DL-Droid: Deep learning based android malware detection using real devices,” Computers & Security, vol. 89, pp. 101663, 2020. [Google Scholar]
37. J. Kim, Y. Ban, E. Ko, H. Cho and J. H. Yi, “MAPAS: A practical deep learning-based android malware detection system,” International Journal of Information Security, vol. 21, no. 4, pp. 725–738, 2022. [Google Scholar]
38. A. Albakri, F. Alhayan, N. Alturki, S. Ahamed and S. Shamsudheen, “Metaheuristics with deep learning model for cybersecurity and android malware detection and classification,” Applied Sciences, vol. 13, no. 4, pp. 2172, 2023. [Google Scholar]
39. N. Xie, Z. Qin and X. Di, “GA-stackingMD: Android malware detection method based on genetic algorithm optimized stacking,” Applied Sciences, vol. 13, no. 4, pp. 2629, 2023. [Google Scholar]
40. “UCI machine Learning Repository: TUANDROMD (Tezpur University Android Malware Dataset) Data Set,” 2022. [Online]. Available: https://archive.ics.uci.edu/dataset/855/tuandromd+(tezpur+university+android+malware+dataset) [Google Scholar]
41. G. E. A. P. A. Batista, R. Prati and M. C. Monard, “A study of the behavior of several methods for balancing machine learning training data,” ACM SIGKDD Explorations Newsletter, NY, USA, vol. 6, no. 1, pp. 20–29, 2004. [Google Scholar]
42. H. U. Khan, M. Sohail, F. Ali, S. Nazir, Y. Y. Ghadi et al., “Prioritizing the multi-criterial features based on comparative approaches for enhancing security of IoT devices,” Physical Communication, vol. 59, pp. 102084, 2023. [Google Scholar]
43. G. Lemaître, F. Nogueira and C. K. Aridas, “Imbalanced-learn: A python toolbox to tackle the curse of imbalanced datasets in machine learning,” Journal of Machine Learning Research 1, vol. 18, no. 17, pp. 1–5, 2017. [Google Scholar]
44. P. Geurts, D. Ernst and L. Wehenkel, “Extremely randomized trees,” Machine Learning, vol. 63, pp. 3–42, 2006. [Google Scholar]
45. A. L. Boulesteix, S. Janitza, J. Kruppa and I. R. König, “Overview of random forest methodology and practical guidance with emphasis on computational biology and bioinformatics,” Wiley Interdisciplinary Reviews: Data Mining and Knowledge Discovery, vol. 2, no. 6, pp. 493–507, 2012. [Google Scholar]
46. S. Agarwal, “Data mining: Data mining concepts and techniques,” in Int. Conf. on Machine Intelligence and Research Advancement, Katra, India, pp. 203–207, 2013. [Google Scholar]
47. Y. Nohara, K. Matsumoto, H. Soejima and N. Nakashima, “Explanation of machine learning models using shapley additive explanation and application for real data in hospital,” Computer Methods and Programs in Biomedicine, vol. 214, pp. 106584, 2022. [Google Scholar] [PubMed]
48. R. Damaševičius, A. Venčkauskas, J. Toldinas and Š. Grigaliūnas, “Ensemble-based classification using neural networks and machine learning models for windows PE malware detection,” Electronics, vol. 10, no. 4, pp. 485, 2021. [Google Scholar]
49. N. A. Azeez, O. E. Odufuwa, S. Misra, J. Oluranti and R. Damaševičius, “Windows PE malware detection using ensemble learning,” Informatics, vol. 8, no. 1, pp. 1–10, 2021. [Google Scholar]
50. S. Han, M. Gu, B. Yang, J. Lin, H. Hong et al., “A secure trust-based key distribution with self-healing for internet of things,” IEEE Access, vol. 7, pp. 114060–114076, 2019. [Google Scholar]
Cite This Article
 Copyright © 2023 The Author(s). Published by Tech Science Press.
This work is licensed under a Creative Commons Attribution 4.0 International License , which permits unrestricted use, distribution, and reproduction in any medium, provided the original work is properly cited.
 Downloads
 Citation Tools