
 Submit a Paper
 Propose a Special lssue
 Open Access
ARTICLE
Solar Power Plant Network Packet-Based Anomaly Detection System for Cybersecurity
1 Department of Information Security, Gachon University, Seongnam, 13120, Korea
2 Police Science Institute, Korean National Police University, Asan, 31539, Korea
3 Department of Computer Engineering, Gachon University, Seongnam, 13120, Korea
* Corresponding Author: Jung Taek Seo. Email:
(This article belongs to the Special Issue: Advances in Information Security Application)
Computers, Materials & Continua 2023, 77(1), 757-779. https://doi.org/10.32604/cmc.2023.039461
Received 31 January 2023; Accepted 21 June 2023; Issue published 31 October 2023
 View Full Text
 Download PDF
Abstract
As energy-related problems continue to emerge, the need for stable energy supplies and issues regarding both environmental and safety require urgent consideration. Renewable energy is becoming increasingly important, with solar power accounting for the most significant proportion of renewables. As the scale and importance of solar energy have increased, cyber threats against solar power plants have also increased. So, we need an anomaly detection system that effectively detects cyber threats to solar power plants. However, as mentioned earlier, the existing solar power plant anomaly detection system monitors only operating information such as power generation, making it difficult to detect cyberattacks. To address this issue, in this paper, we propose a network packet-based anomaly detection system for the Programmable Logic Controller (PLC) of the inverter, an essential system of photovoltaic plants, to detect cyber threats. Cyberattacks and vulnerabilities in solar power plants were analyzed to identify cyber threats in solar power plants. The analysis shows that Denial of Service (DoS) and Man-in-the-Middle (MitM) attacks are primarily carried out on inverters, aiming to disrupt solar plant operations. To develop an anomaly detection system, we performed preprocessing, such as correlation analysis and normalization for PLC network packets data and trained various machine learning-based classification models on such data. The Random Forest model showed the best performance with an accuracy of 97.36%. The proposed system can detect anomalies based on network packets, identify potential cyber threats that cannot be identified by the anomaly detection system currently in use in solar power plants, and enhance the security of solar plants.Keywords
As energy problems continue to surface, the need for a stable energy supply and the related environmental and safety issues requires serious consideration. These problems are contributing to the increased interest shown in renewable energy. The International Energy Agency’s (IEA) renewable energy market update shows a year-on-year increase in renewable power capacity in 2022 of 45%, despite the supply chain disruption and delays attributed to the spread of COVID-19 [1]. In addition, the “IEA’s mid-term (2023) outlook for renewable energy supply” indicates that renewable electricity generation is expected to increase by 37% between 2018 and 2023, reaching a total of 8,641 terawatt-hours (TWh), which will account for 30% of total generation by 2023 [2]. According to the Federal Energy Regulatory Commission, the California Independent System Operator (CAISO) noted renewables would supply 45% of summer loads in 2022 [3]. As indicated, the proportion of electrical energy from renewable energy sources is steadily increasing, and every country actively applies itself to its utilization. Solar power accounts for the most significant proportion of renewable energy in this context.
However, with solar power’s rapid growth and increasing importance, cyber threats, such as cyberattacks and vulnerabilities, have also steadily grown. For example, sPower, an energy provider working with solar power plants and wind farms in the United States (US), was hit by a cyberattack that disconnected communication between the central control center and the power generation facilities [4]. According to the “Roadmap for PV System Cyber Security,” published by Sandia National Laboratories, internet-based solar power plants are becoming increasingly vulnerable to cyber threats, such as denial of service (DoS) attacks, ransomware, and malicious control [5]. One of the reasons for this cyber threat is that today’s solar power plants focus primarily on monitoring power generation, not detecting and responding to cyber threats. Therefore, cyber threat detection and response systems have become increasingly necessary to ensure cybersecurity. For this reason, this paper analyzes fatal threats to solar power plants while proposing a network packet-based anomaly detection system to detect and respond to threats that conventional solar power plant anomaly detection systems cannot detect.
In this paper, artificial intelligence (AI) aided network packet-based anomaly detection systems are proposed to protect the Programmable Logic Controller (PLC) that controls the inverters in solar power plants, making it possible to detect cyber threats to them early. Initially, the vulnerabilities of solar power plants and the cyberattacks made on them are analyzed to identify the elements that are exposed to cyber threats and to specify the types of threats before going on to understand the attack methods and their ripple effects. Based on our analysis and results, we select two possible cyberattacks (DoS and Man-in-the-Middle (MitM)) in solar power plants. And then, we propose a machine learning-based anomaly detection system for network packets of inverters PLC to detect cyberattacks. We conducted experiments with the preprocessed dataset of PLC network packets from the Supervisory Control and Data Acquisition (SCADA) system. Machine learning is a branch of AI that can distinguish between normal and anomaly motion by learning patterns from input data, which are then applied to anomaly detection in potential cyber threats [6]. The proposed anomaly detection system can enhance the security of solar power plants because it can detect potential cyber threats that have not been previously detected by detecting cyberattacks based on network packets.
This paper’s primary contributions are as follows:
• We select potential or fatal cyberattacks (DoS and MitM) through analysis of solar plant systems and cyber threats. Then, we propose a network packet-based anomaly detection system for solar plant cybersecurity.
• We implemented the proposed anomaly detection system consisting of the following pipeline for PLC network packet data from the SCADA system: Correlation analysis, feature extraction, normalization, and anomaly detection.
• In the series of experiments with benchmark datasets, among the anomaly detection models we developed, the random forest model showed the highest accuracy at 97.36% and the F1-score at 96.18%.
The remainder of this paper consists of the following: Section 2 analyzes the structure of the photovoltaic plant and how it is currently monitored. Section 3 reviews existing studies and suggests improvements. Section 4 analyzes cyberattacks and vulnerabilities in solar plants to identify targets for cyberattacks and different types of threats. In Section 5, network packet-based anomaly detection models are proposed to detect anomaly network packets passing between the PLC and the controller in the inverter. This is implemented through machine learning and network packets. Section 6 verifies the performance of the developed model.
2.1 Solar Power Plant Structure
A solar power plant consists of inverters and solar panels that utilize solar energy for electricity production. The station can operate as an independent home or a grid-connected power system that delivers generated power [7,8]. The data explaining the solar power plant components were analyzed and reconstructed, as shown in Fig. 1.
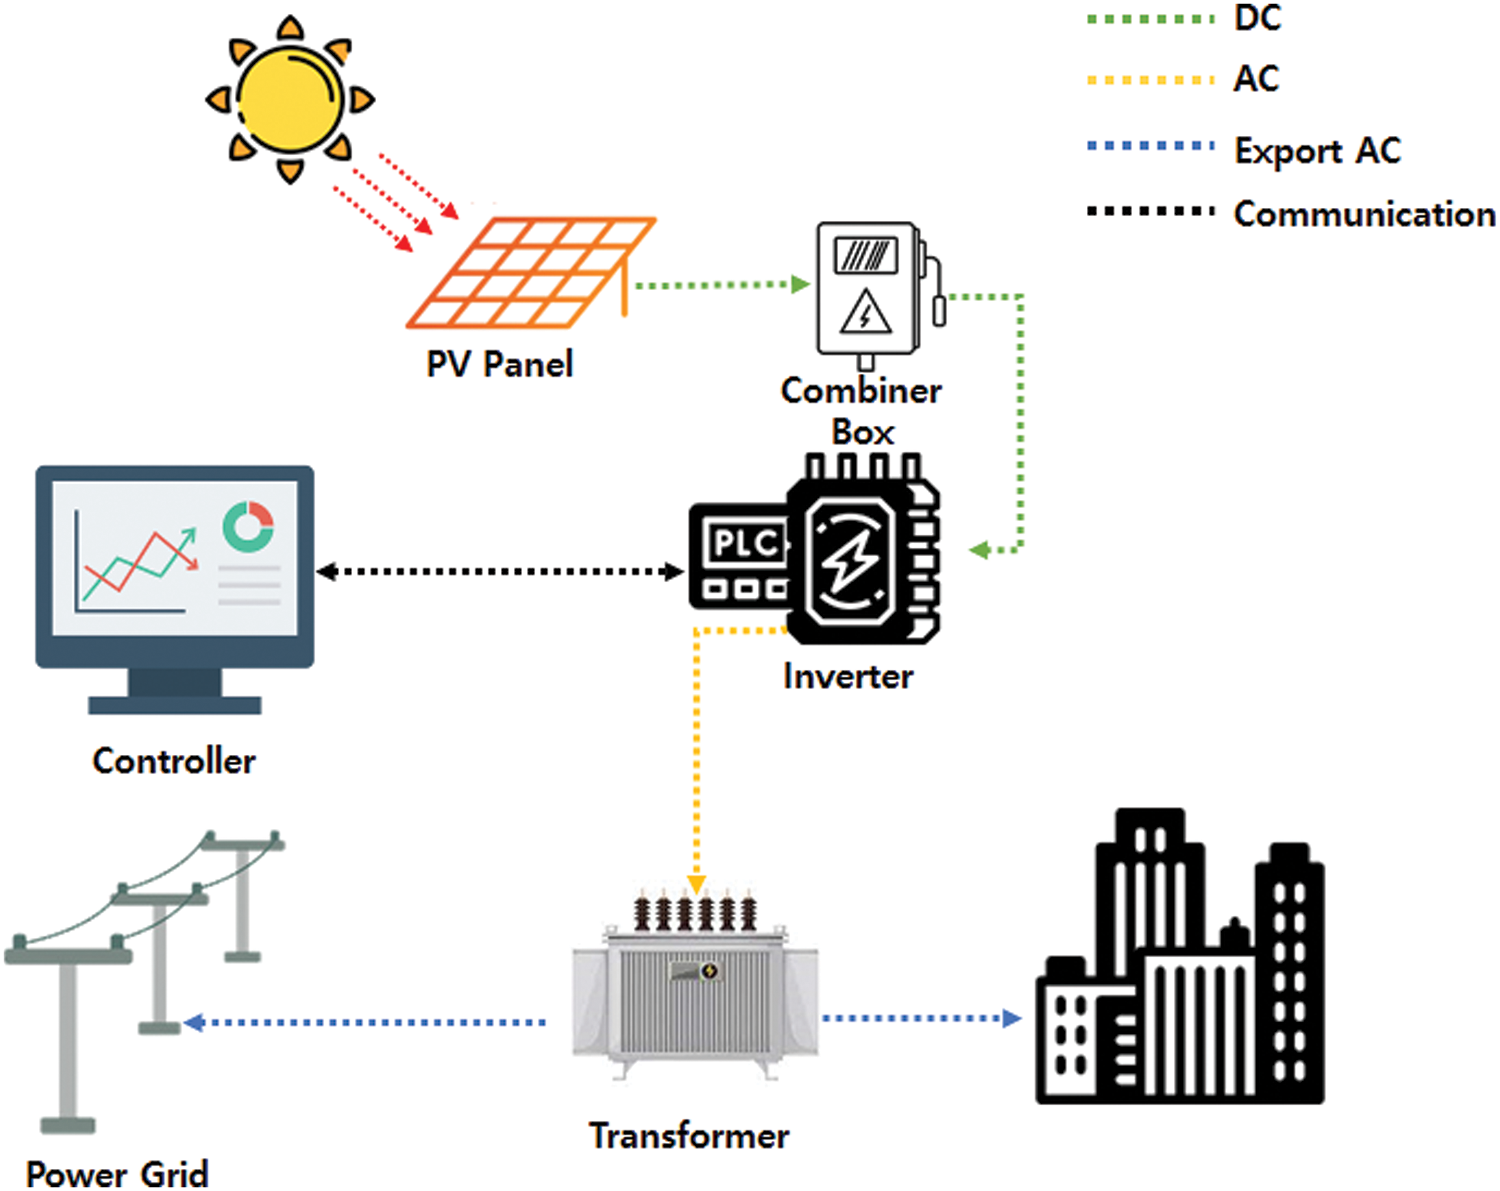
Figure 1: Solar power plant structure
The components of the solar plant are described below. The photovoltaic (PV) panel converts solar energy into alternating current (AC), and the Combiner box stores the PV panel’s power in one place. The inverter converts AC into direct current (DC), and the distribution box distributes electricity from the DC to the power system or city. Finally, the controller controls the flow of power in the invert. Solar energy from PV panels is generally converted into electricity in the form of DC. A combiner box collects this electricity, which is then transferred to inverters that convert the DC into AC. The distribution panel then transmits the AC to the electrical power grid or home users (in the city).
An inverter is essential to most electrical devices or connections to electrical grids because DC must be converted into AC before electricity can be used daily or distributed to an electrical power grid. In addition, this device is essential because its failure or malfunction can change the flow of the electrical charge or even block electric power production and transmission. Therefore, a controller manages the inverter and controls the output voltage [9].
Large-scale solar power plants require solar monitoring systems for efficient management. Solar monitoring systems collect and monitor various factors, such as power, voltage, transformers, inverters, solar irradiance, ambient temperature, and wind speed and direction. This system allows the manager to monitor and manage the power station’s normal operation and electricity generation in real-time [10]. The solar monitoring structure can be expressed as shown in Fig. 2.
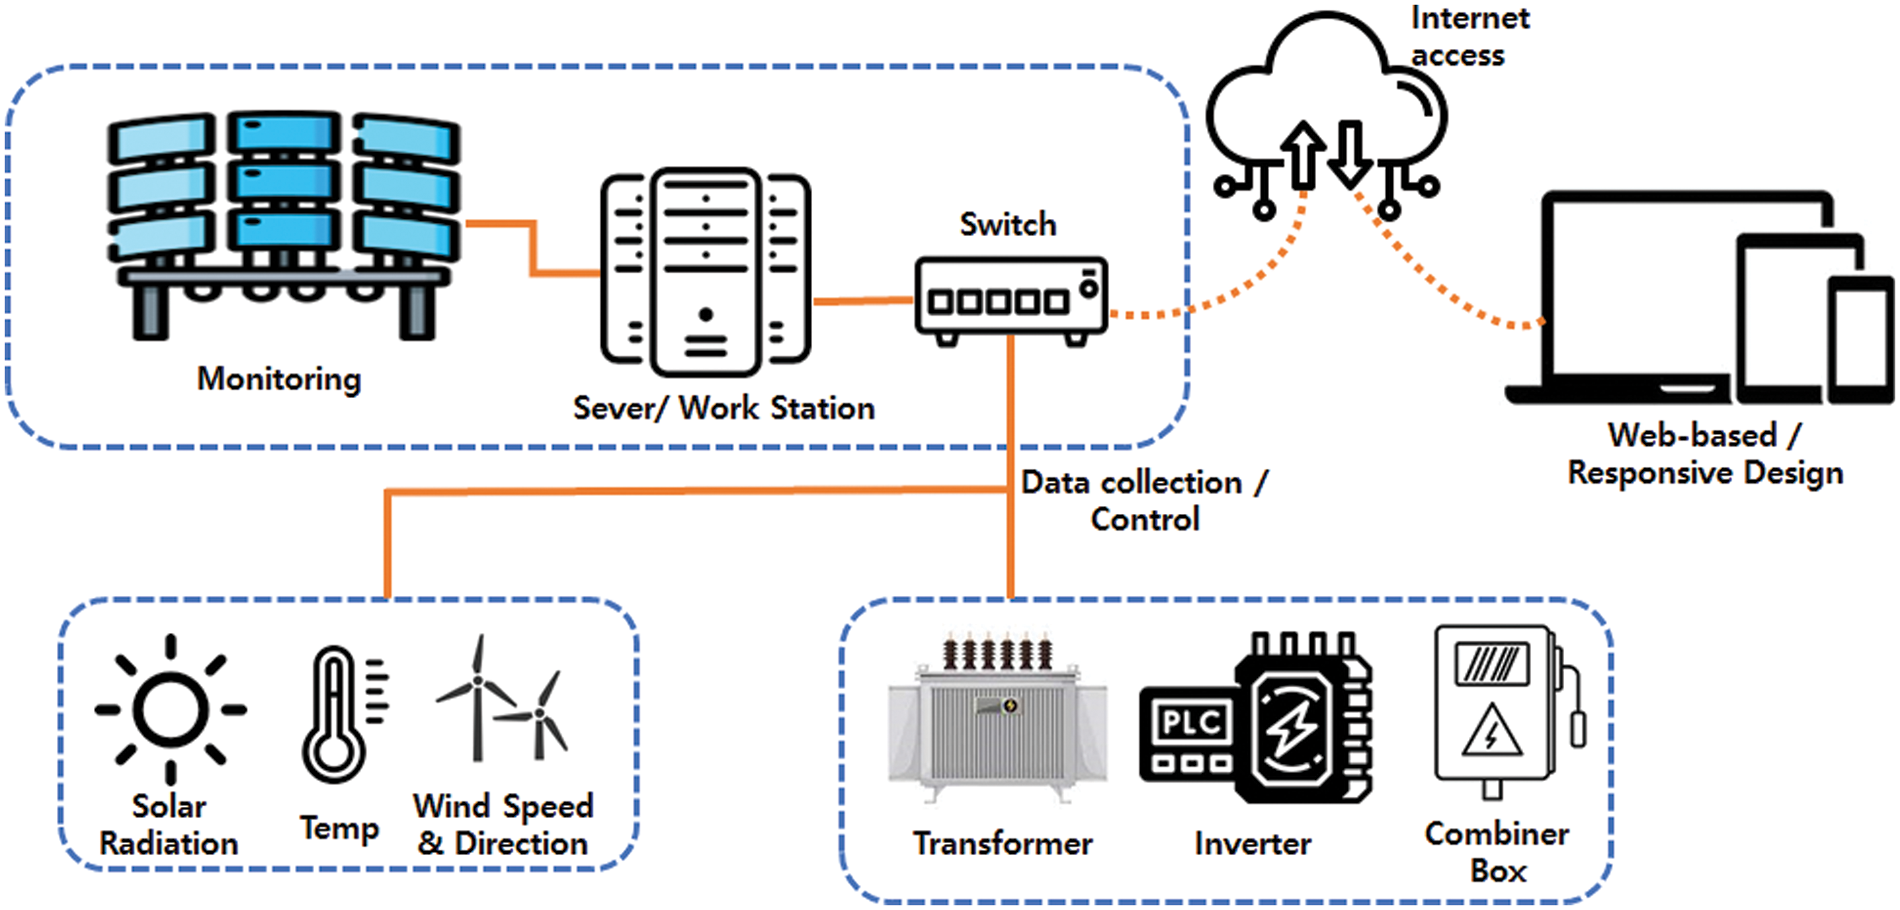
Figure 2: Solar monitoring system
In addition to data collection, the solar monitoring system also features a circuit breaker with a controller and a remote-control function for the inverter. Although this monitoring structure is efficient and convenient in the maintenance of the solar power plant and for data collection, as the inverter control is conducted through the web or mobile monitoring can be either via the central monitoring system or via the external internet, the number of networks involved increases exponentially. This increases the interface size between the inverter and the outside world, creating risks. Suppose malicious users access the inverter via the interface between the inverter and the external networks. In that case, they can manipulate the current flow by issuing an output control command to the inverter and then transmitting malicious code or increasing the control traffic so that it causes the inverter to malfunction, eventually adversely affecting the function of the solar power plant.
Multiple previous studies have suggested anomaly detection systems for solar power plants. An anomaly detection system based on autoencoder long short-term memory (AE-LSTM), the Facebook-Prophet, and Isolation Forest were designed to identify anomalies in the electricity generation of solar power plants [11]. An artificial neural network (ANN)-based anomaly detection system has been suggested that can predict and maintain the electricity generation of a solar power plant [12], and another method has been proposed to verify a specific outlier and its candidate for processed data on electricity generation by utilizing correlation analysis of the attribute values for solar power generation and its K-nearest neighbors (K-NN) [13]. Monitoring systems have also been developed to manage and maintain solar power plants. Based on big data, operations management was carried out in these studies at all stages, ranging from electricity generation prediction to monitoring, automatic recovery, and disposal diagnosis [14]. The impacts of cyberattacks on solar power generation have also been analyzed and evaluated. Specifically, the effects of cyberattacks on the electric energy of PV inverters were examined [15]. A convolutional neural network (CNN)-based anomaly detection model was proposed for PV panels to detect power losses in solar power plants and to identify the causes of anomalies [16]. One study developed a DC power line communication system to monitor PV panels in solar plants, where monitoring data is uploaded to cloud storage and panel output is normalized to monitor distribution to detect anomalies [17]. A technique for permanently controlling the measured voltage of the inverter was presented to strengthen the cybersecurity of the PV inverter. This technique is the product of machine learning by applying linear and lasso-based regression methods. After machine learning, it compares the predicted data with the measured voltage before sending an alarm to the operator should a specific deviation occur [18].
Jones et al. also built a test environment to experiment with cyberattacks on PV inverters, and an intrusion detection system (IDS) was utilized to monitor and detect malicious network traffic [19]. This work presents the same attack scenario as “Unauthorized client”, “Invalid packet”, “Spoofing TCP handshake”, “MitM Denial-of-service”, and “MitM Data spoofing” through experiments. This work provides five possible cyberattack scenarios for the experiment. The scenarios describe adverse effects affecting the confidentiality, integrity, and availability of the PV inverter, any of which may lead to anomaly operations. An unauthorized client and Invalid packet indicate that a malicious attacker can access and control a general PV inverter via Modbus. Spoofing TCP handshake attempts to flood the PV inverter with TCP/IP for a DoS attack. MitM Denial-of-service and MitM Data spoofing carry out a DoS or a spoofing attack through a MitM attack. As indicated above, the experiment showed that cyberattacks could threaten PV inverters.
Based on recent research, we selected two critical attack scenarios (MitM, Dos) for solar power plants as the study targets. Since most previous studies have focused on monitoring the electricity generation of a solar power plant, including current and voltage, they are limited in that they can only detect or predict anomalies in power generation. In such cases, detection is confined to anomalies in electricity generation caused by a cyberattack. Furthermore, it is difficult to determine whether the anomaly detected arose from a simple error, aging equipment, or a cyberattack. In addition, with a static or dynamic I DS, only attacks that have been reported or are known to have affected the system can be detected. A system that can efficiently detect cyber threats at the network level is sorely needed.
For this reason, it has become necessary to use anomaly detection to respond to cyber threats by monitoring network packets in solar power plants. Network packet-based anomaly detection can detect threats at the network level before cyberattacks begin, preventing potential damage. Suppose there is an anomaly in the power generation in this case. It can analyze network packets simultaneously to determine if there is a potential cyber threat that can identify the cause. Therefore, this paper proposes a system for detecting anomaly network packets in a solar power plant.
4 Analysis of Cyber Attacks and Vulnerabilities in Solar Power Plants
This section analyzes cyberattacks and the vulnerabilities of solar power plants. The analysis results are used to determine targets at risk of cyberattacks and the types of threats and to understand the attack methods and ripple effects.
4.1 sPower Solar Power Plant Cyberattack
In April 2019, sPower, an energy provider for solar power plants and wind farms in the US, was hit with a cyberattack. On March 05, 2019, a malicious attacker attempted a DoS attack, exploiting the vulnerability of the Cisco firewall. A DoS attack floods a target system or network with traffic or induces collisions, making it inaccessible [20]. This resulted in a loss of communication between the 500 MW (megawatt) solar/wind power plant and the company’s control center. It was the first cyberattack on renewable energy, such as solar and wind power [4]. The attack on the control center that managed the solar power plants shut down its communication with its power generation facilities. This indicates that an external network interface is connected to a solar plant and allows for cyberattacks through that interface.
4.2 Vulnerabilities of Solar Power Plants
At Still Hacking Anyway (SHA2017), Willem Westerhof presented 21 inverter vulnerabilities. SHA2017 is a non-profit hacker conference held in the Netherlands. Westerhof had built a test bed of two inverters to experiment with, and his test confirmed that a hacker could remotely control the inverter and change the current flow. He noted that a hacker’s attempt to launch a large-scale cyberattack on an inverter could threaten a power grid [21]. In this study, the target inverters were connected to the internet for remote control and monitoring. The test results indicate that a malicious attacker can control the inverter, thus causing anomaly solar power plant operation.
The Common Vulnerabilities and Exposures (CVE) program provides information on publicly known security vulnerabilities. Table 1 shows several vulnerabilities of solar power systems as disclosed by CVE [22].
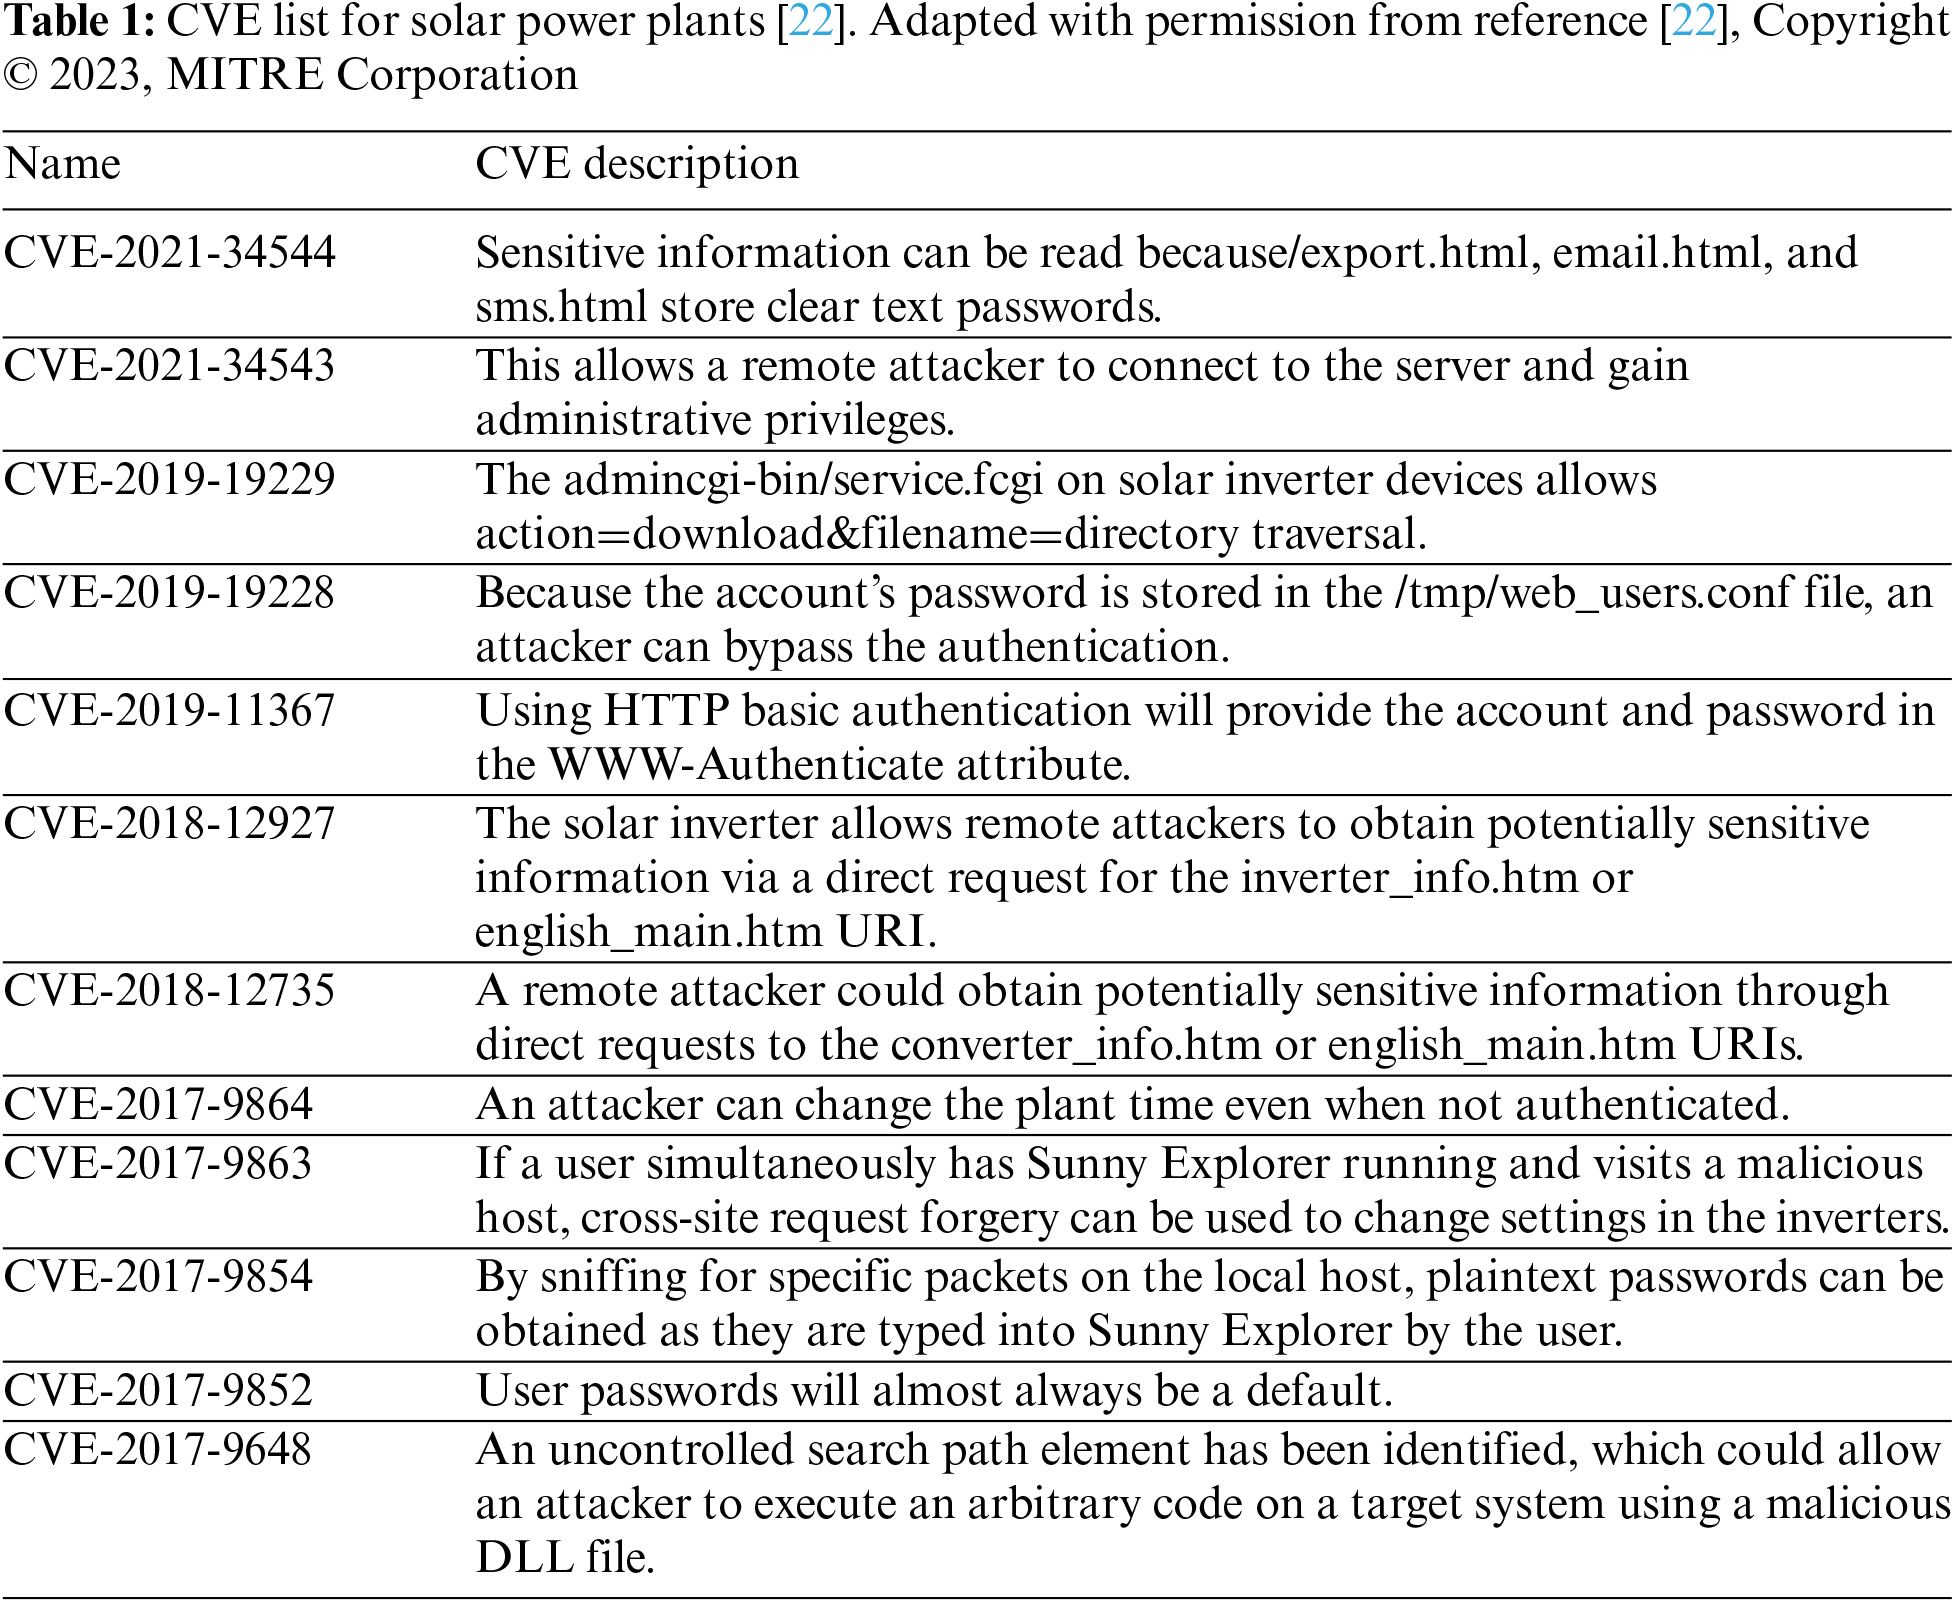
Most of the vulnerabilities of a solar power plant described as CVE are threats caused by a default password set to access sensitive information or insufficient security settings. Most threats can be counteracted through password changes and access control. Still, a MitM attack, such as sniffing, is difficult for solar power plants to counter because it can intercept packets or transmit malicious commands. A malicious attacker can exploit the corresponding cyberattack vulnerability if a solar power plant has an unwanted external interface.
To summarize the results mentioned above, most cyberattacks on a solar power plant occur through external network interfaces, and the types of threats include a DoS attack and a MitM attack, both of which interfere with the operation. External network connections for data transmission or control for solar plant management increase the likelihood of exposure to the above threats. In a solar power plant, the PV inverter will be the principal target of cyber threats, and several studies have been conducted to analyze inverter-related cyberattacks and vulnerabilities. According to the results analyzed in Section 4, cyber threats, such as a DoS attack or a MitM attack on a PV inverter, must be detected through analysis and monitoring at the network level to ensure that the cybersecurity of the solar power plant is protected.
5 Proposal for a Network Packet-Based Anomaly Detection System
This section proposes network packet-based anomaly detection models for solar power plants. As detailed in Sections 2 and 4, these models are meant to detect anomalies in the network packets targeting the communication section of the PLC in the PV inverter when exposed to threats. The controller or monitoring system controls the inverter through the PLC in the inverter. This means the communication between the controller and the PLC can be identified as the network communication interval. Therefore, when a cyberattack occurs against the inverter, it is detected in the network communication section of the PLC in the inverter and the controller, so it is necessary to monitor the PLC’s network packets to detect cyber threats to the inverter.
For this reason, the datasets to be used in the proposed network packet-based anomaly detection models utilize PLC network packets from SCADA systems provided by the University of Coimbra (Portugal) [23,24]. The PLC network packet was converted into a CSV file using CICFlowMeter [25]. Since cyberattacks on solar power plants are typically a DoS or MitM attack, as shown in Section 4, anomaly datasets were selected to identify a MitM attack, a Query2 flooding attack, and a ping flooding attack. Algorithms used to develop the anomaly detection models included Random Forest, K-NN, Kernel-Support Vector Machine (K-SVM), XGBoost, Isolation Forest, and the Local Outlier Factor (LOF). The workflow for the proposed anomaly detection model is shown in Fig. 3.
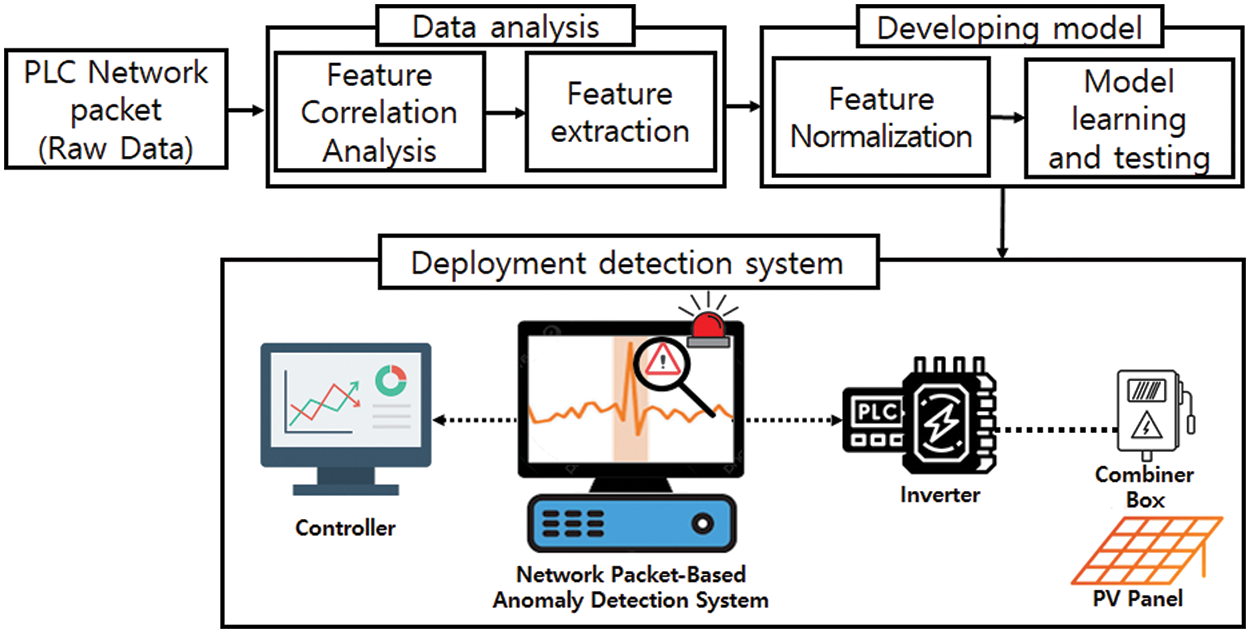
Figure 3: The proposed anomaly detection model workflow
1) Collecting raw data: we collect PLC network packets (Raw Data) and perform preprocessing on the data. 2) Analyzing data: A correlation analysis and feature extraction are conducted to generate the rectified dataset on the collected data. 3) Developing anomaly detection model: we developed an anomaly detection model using the rectified dataset after normalizing the data. The detection model performs classification and clustering using various machine learning models. 4) Deploying detection system: Using the developed anomaly detection model, an anomaly detection system is established in the solar plant to monitor network packets between the controller and the inverter to detect anomaly data. The following Sections 5.2 and 5.3 describe the steps to develop anomaly detection models.
5.2 Feature Selection Based on Dataset Correlation Coefficient Analysis
The correlation coefficient is a quantitative statistical value that shows a linear relationship between two variables. One example is the Pearson correlation coefficient (PCC), which measures how strong a relationship is between two data sets and returns a value between −1 and +1. 1 indicates a strong positive relationship, and −1 indicates a strong negative one. When the value is 0, there is no relationship at all. If the absolute value of the correlation coefficient is high, it indicates a strong relationship between the two variables. The PCC values can be used to identify linear relationships between each feature in the data, which, in turn, are utilized to remove unnecessary features or analyze ones with high relationships when detecting anomalies. The PCC coefficients for the two variables X and Y can be expressed as follows [26]:
This step determines the linear relationships between each feature data in the datasets and any unnecessary feature data in the data learning. The correlation matrix for the feature data is shown in Fig. 4. The features for Fig. 4 are presented below in Table 2. These features represent the relatively small labels in Fig. 4.
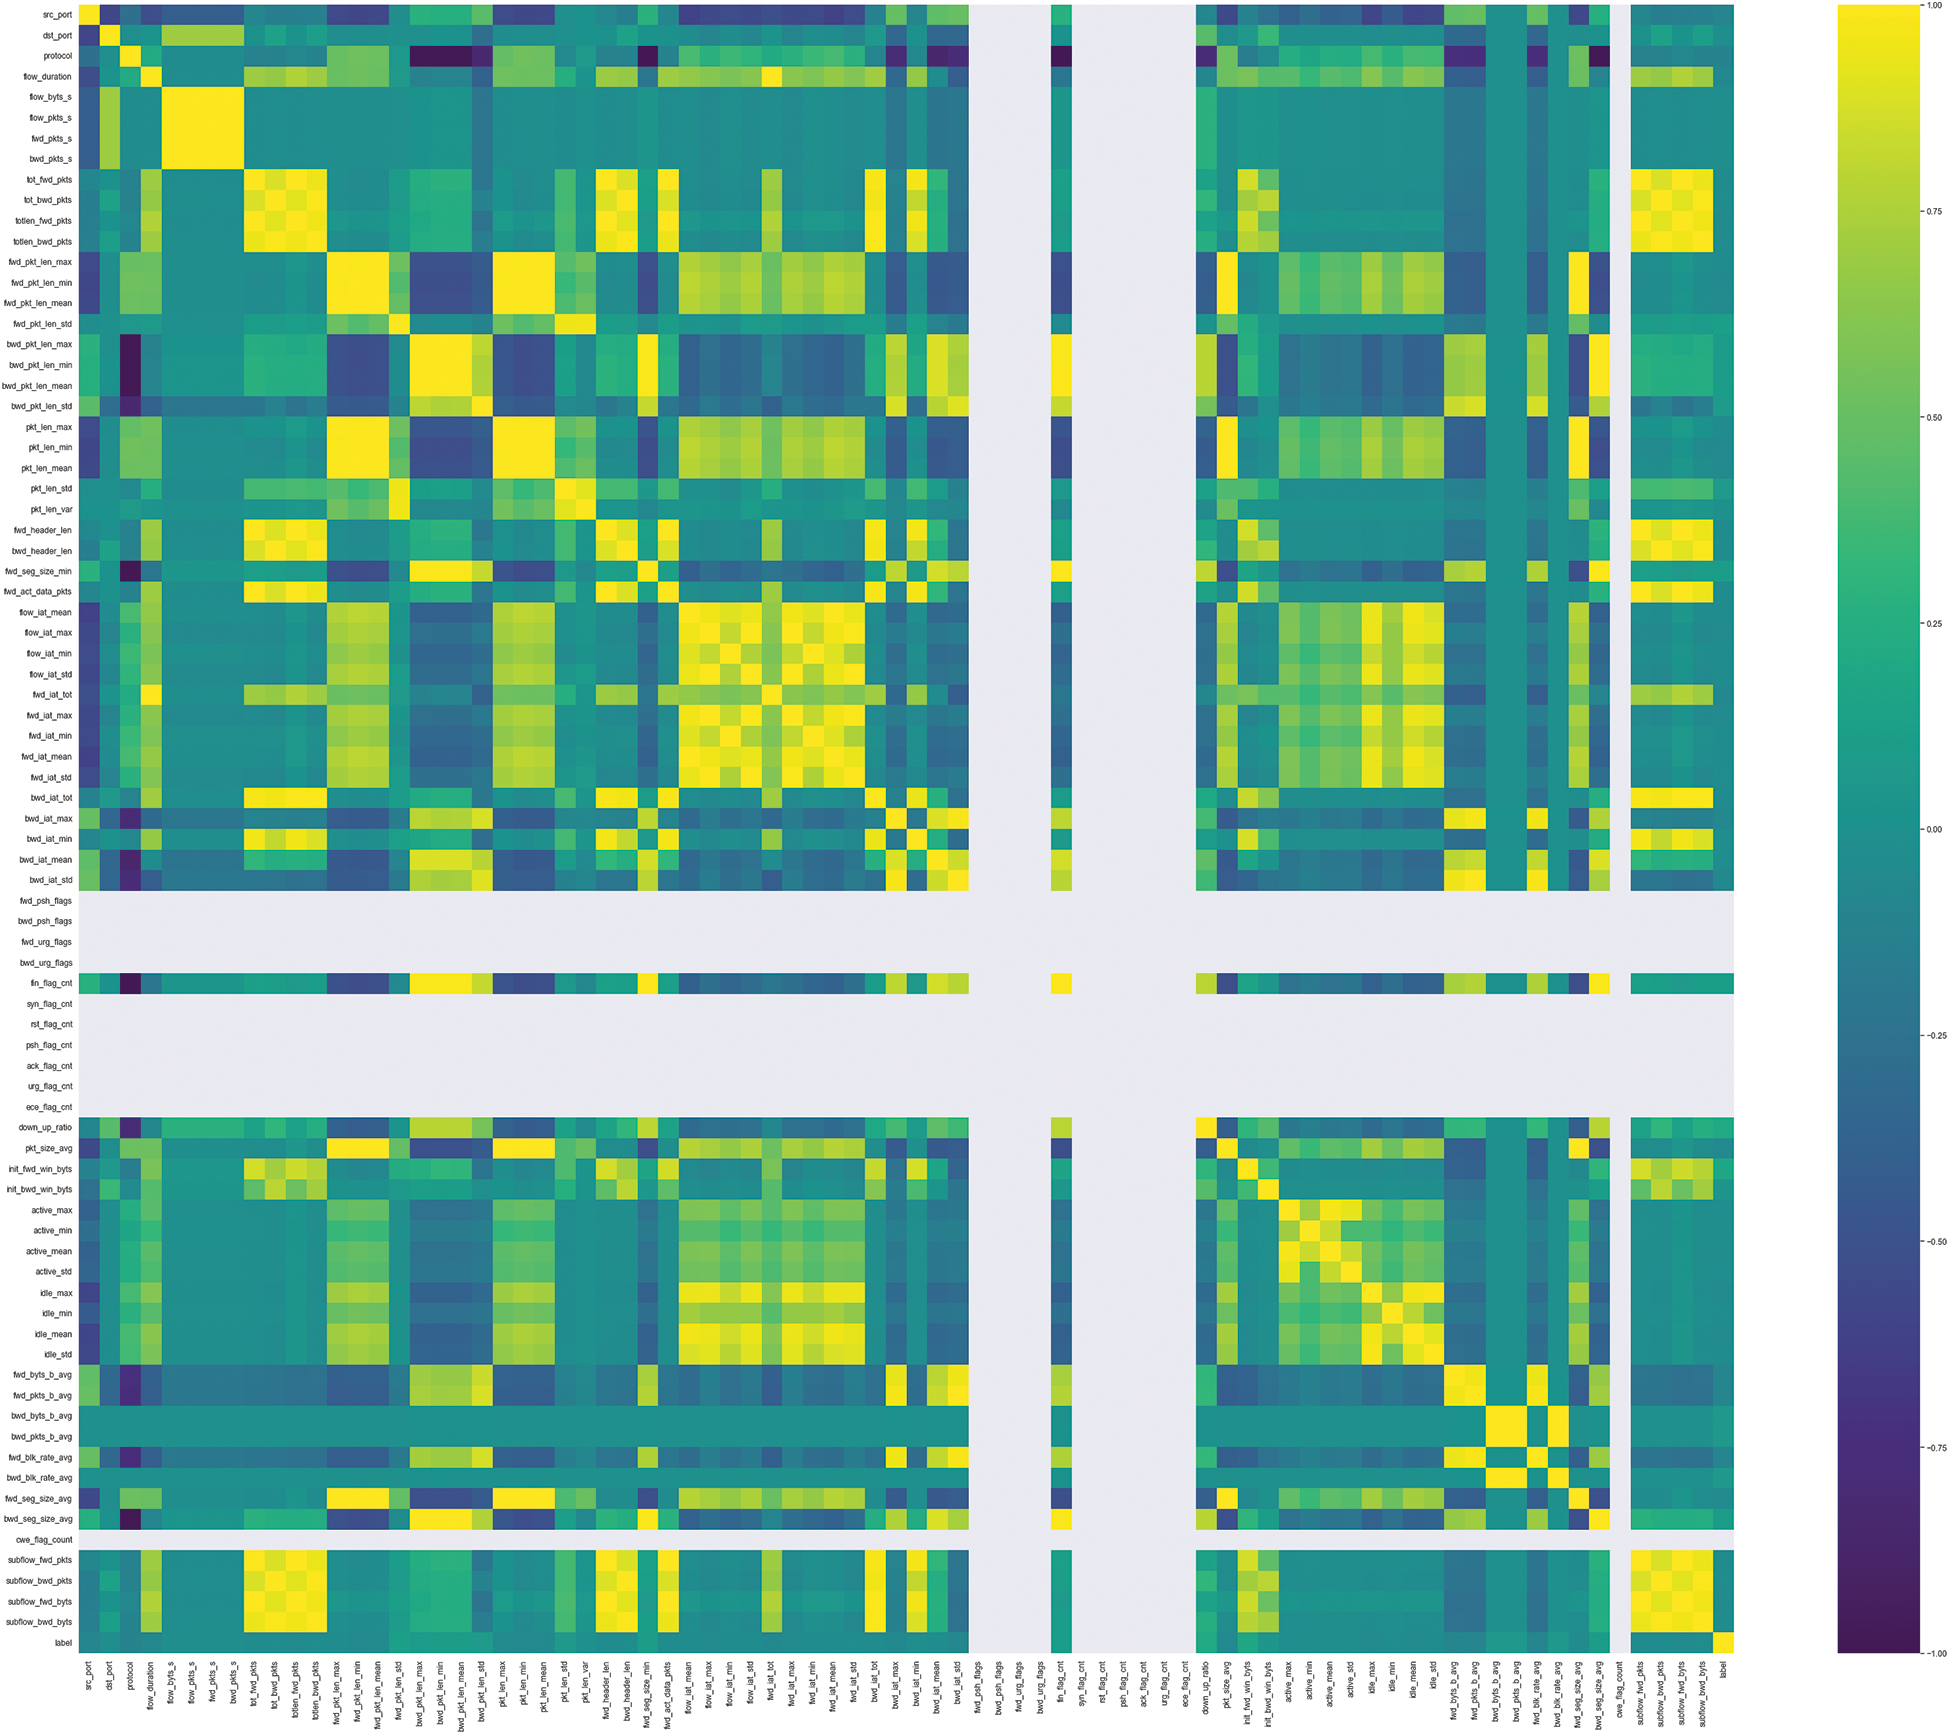
Figure 4: PCC heatmap for PLC network dataset
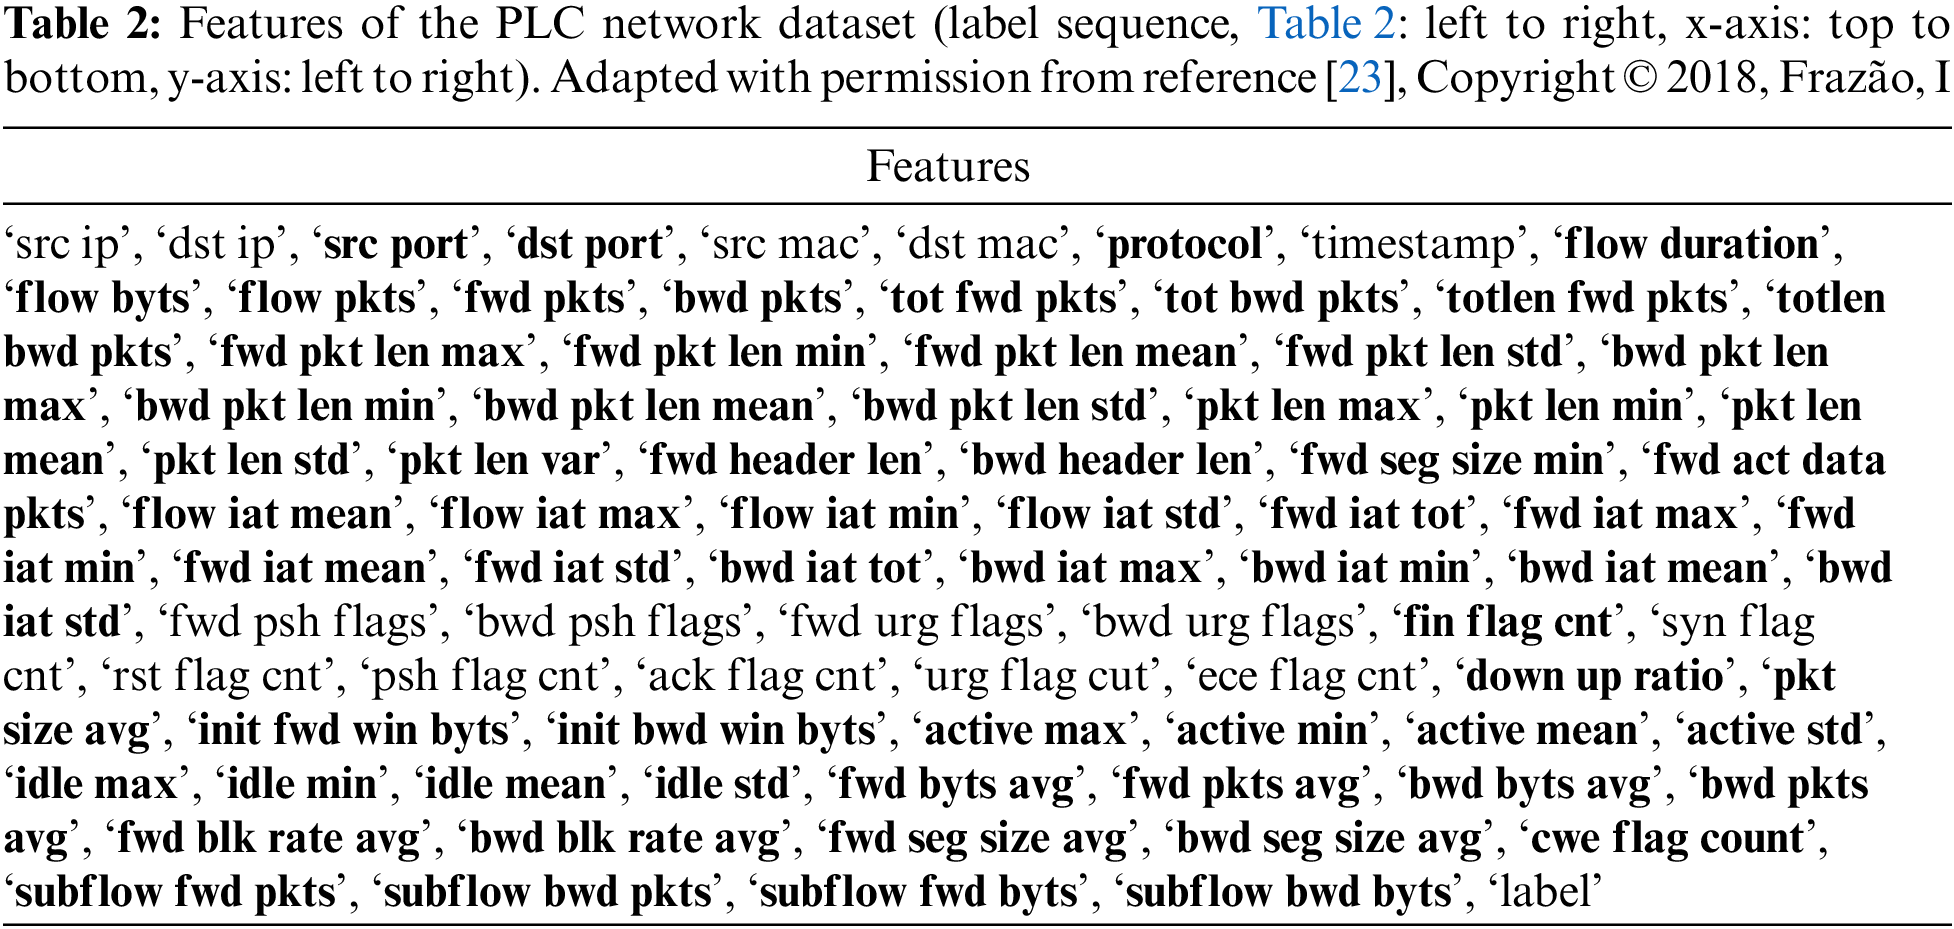
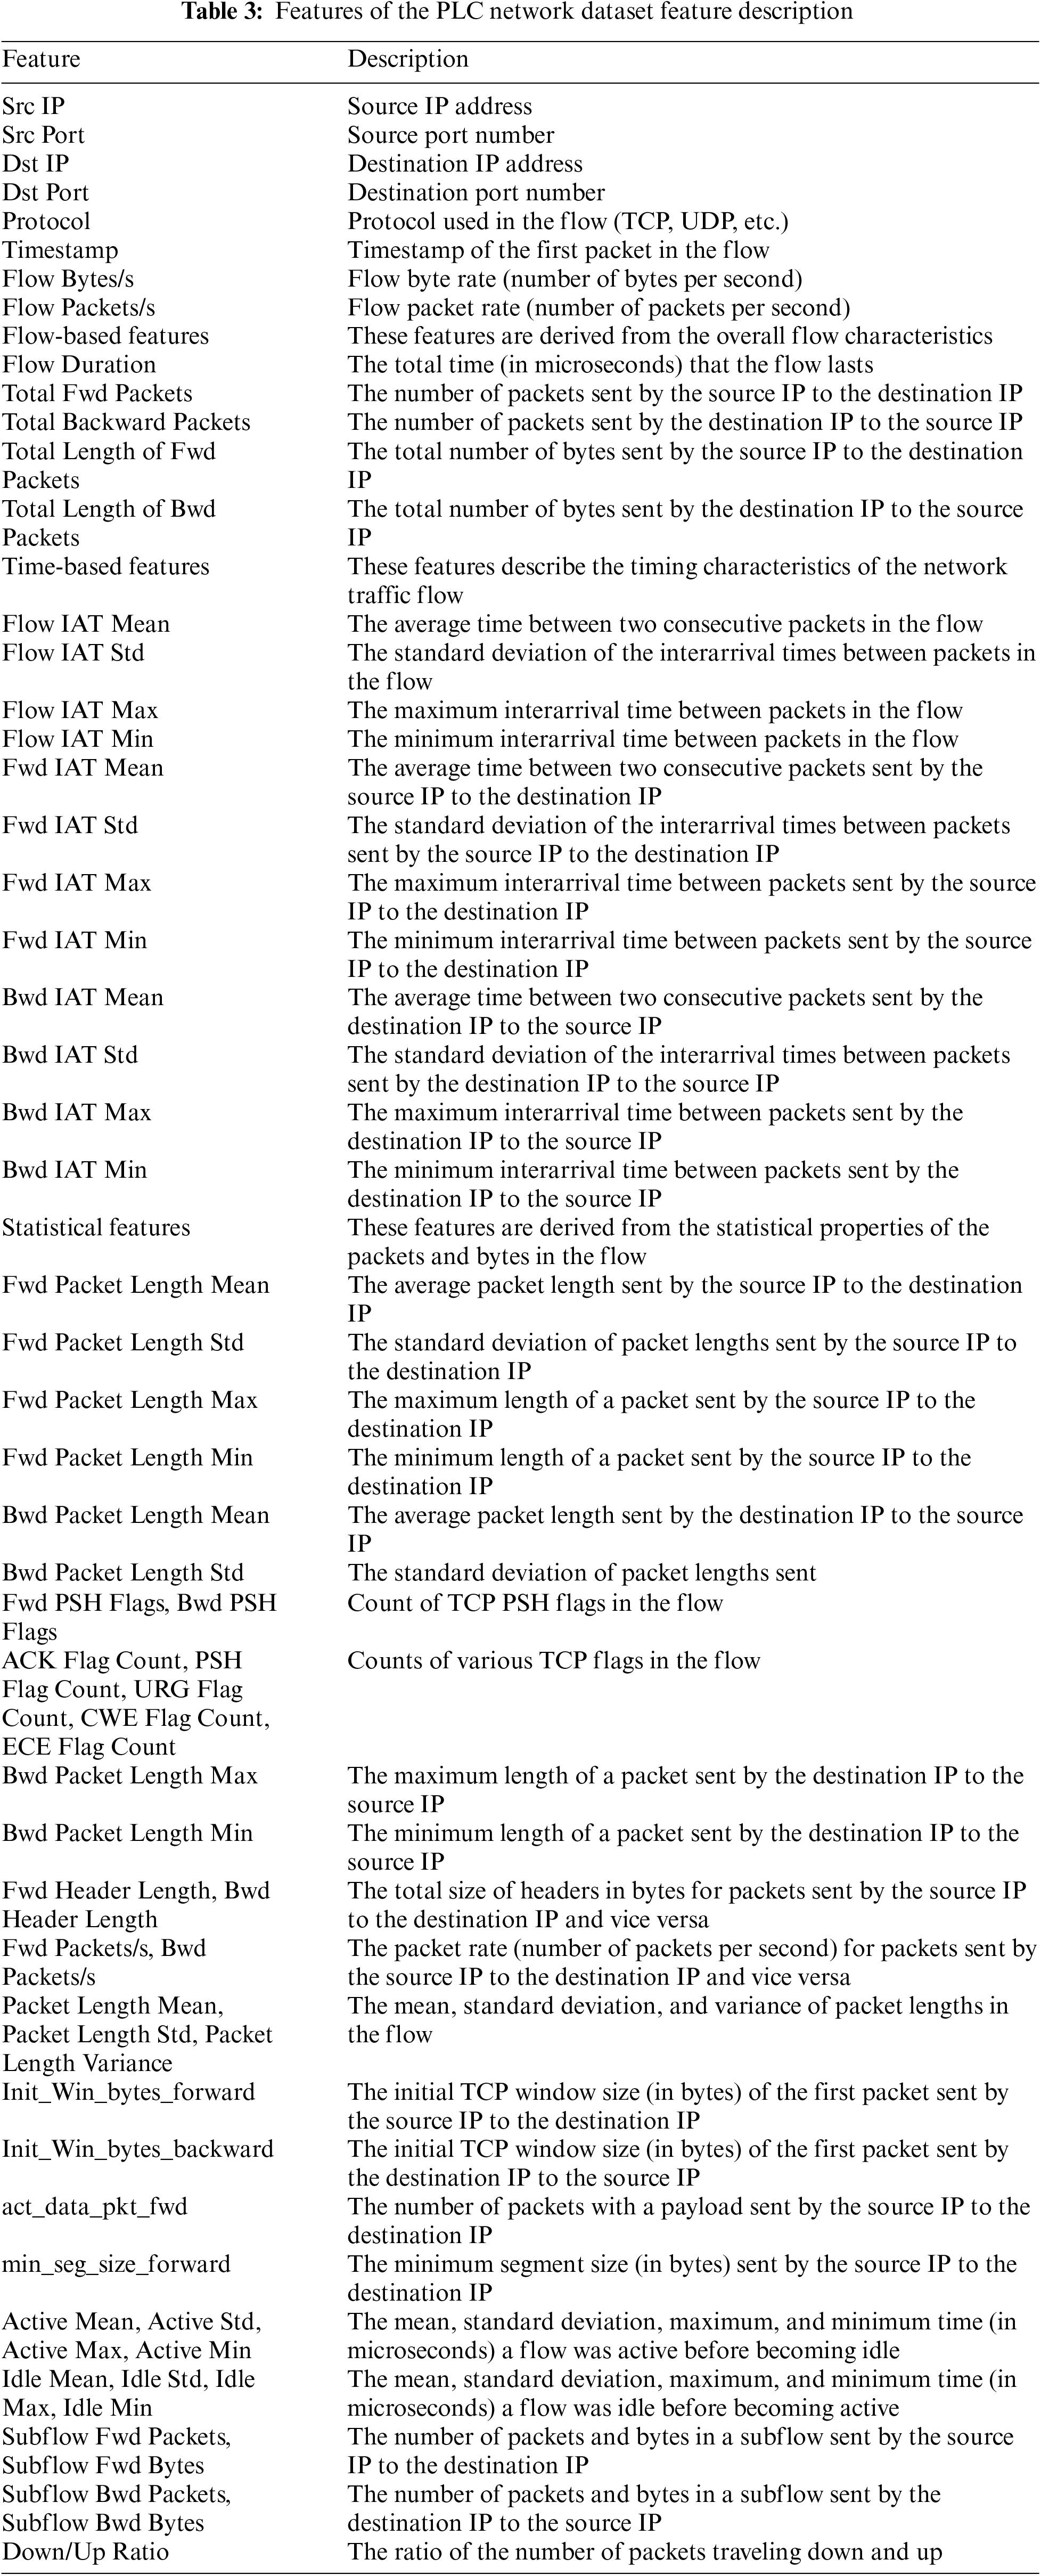
In Fig. 4, a brighter color indicates a stronger positive linear relationship, while a darker color indicates a stronger negative linear relationship. In addition, the empty areas in Fig. 4 indicate the absence of data values or repetitively continued ones. The PCC analysis results helped remove unnecessary features during the data learning, such as a section with a certain value, and selected feature data to be learned around a point where the absolute value of PCC was not zero. Grouping feature data with coefficients with high absolute values before learning can help determine a causal relationship for a specific phenomenon and improve model performance. Among the features shown in Table 2, 69 units of feature data were selected, including port numbers, protocols, the header length of each packet, and the payload length. The set features are bolded in Table 2. The feature in Table 2 is described in detail in Table 3.
5.3 Classification Algorithm and Clustering Algorithm for Data Training
The anomaly detection models for network packets learned the data based on supervised learning (SL) and unsupervised learning (UL). SL is used to learn algorithms for data classification or accurate prediction of result values. SL algorithms can detect anomalies by learning what is labeled normal and anomaly data, and these are classified into specific categories and then divided into normal and anomaly values [27]. The SL algorithms used included K-NN, Random Forest, K-SVMs, and XGBoost. The K-NN algorithm is a basic and simple classifier used when there is little prior knowledge of data distributions. This algorithm stems from the assumption that similar data are distributed close to each other. As a result, the distance between the points where the data are distributed is calculated through Euclidean distance, and the set K value determines the number of neighbors. For a given two data points (
In Eq. (2),
Random Forest is an SL algorithm used for classification and regression. Random Forest is a type of ensemble model. It contains a collection of unrelated decision trees for analysis and combination to reduce variance and predict data more accurately. It makes optimizing the number of trees and the maximum acceptable depth (number of nodes) from the root node to the end possible to avoid underfitting or overfitting [29].
K-SVMs are algorithms used for classification, regression, and outlier detection. They define a decision boundary for the classification. Therefore, if new data are unclassified, they will be classified according to which side of the boundary they belong to [30].
XGBoost, which stands for eXtreme gradient boosting, supports parallel gradient boosting, an algorithm implemented using an ensemble technique that combines multiple decision trees. XGBoost is another type of ensemble model. Parallel processing ensures fast learning and classification, and ensemble modeling improves the capacity for prediction in classification and regression models [31].
UL algorithm learns patterns and correlations from unlabeled input datasets to output result values. It includes clustering algorithms that learn unlabeled feature data from anomaly detection models and categorize the data. After learning, the models determine whether the data are normal or abnormal [32]. Most power stations currently in operation are not labeled for network packets, so UL algorithms are used more than SL algorithms to implement anomaly detection models. In particular, UL algorithms are more appropriate for power generation control systems that repeat a certain motion, including the Isolation Forest and the LOF.
Isolation Forest is a decision tree-based anomaly detection algorithm. It detects anomalies by taking advantage of the fact that a normal feature keeps branching binary decision trees, but an anomaly one does not, cutting off at the top of the trees [33].
The LOF is an anomaly detection algorithm that learns features to distinguish between normal categories and to detect outliers by considering the relative density of a feature. Since it considers the densities of features if a given feature point deviates from its neighbors, it can be detected as an outlier [34]. We created a figure in Fig. 5 to conceptually represent how LOF detects anomaly data. In the figure, each data point is represented as a two-dimensional feature (Features 1 and 2), which can be any feature in a real-world anomaly detection situation. LOF models are trained with regular observations (empty white circles). The trained model classifies new data as regular (green circle) or outlier (red circle). Suppose the data is not a point adjacent to an empty white circle. In that case, it is considered a different type of data than previously learned (white circles), classified as outliers (red circles), and detected as anomaly data.
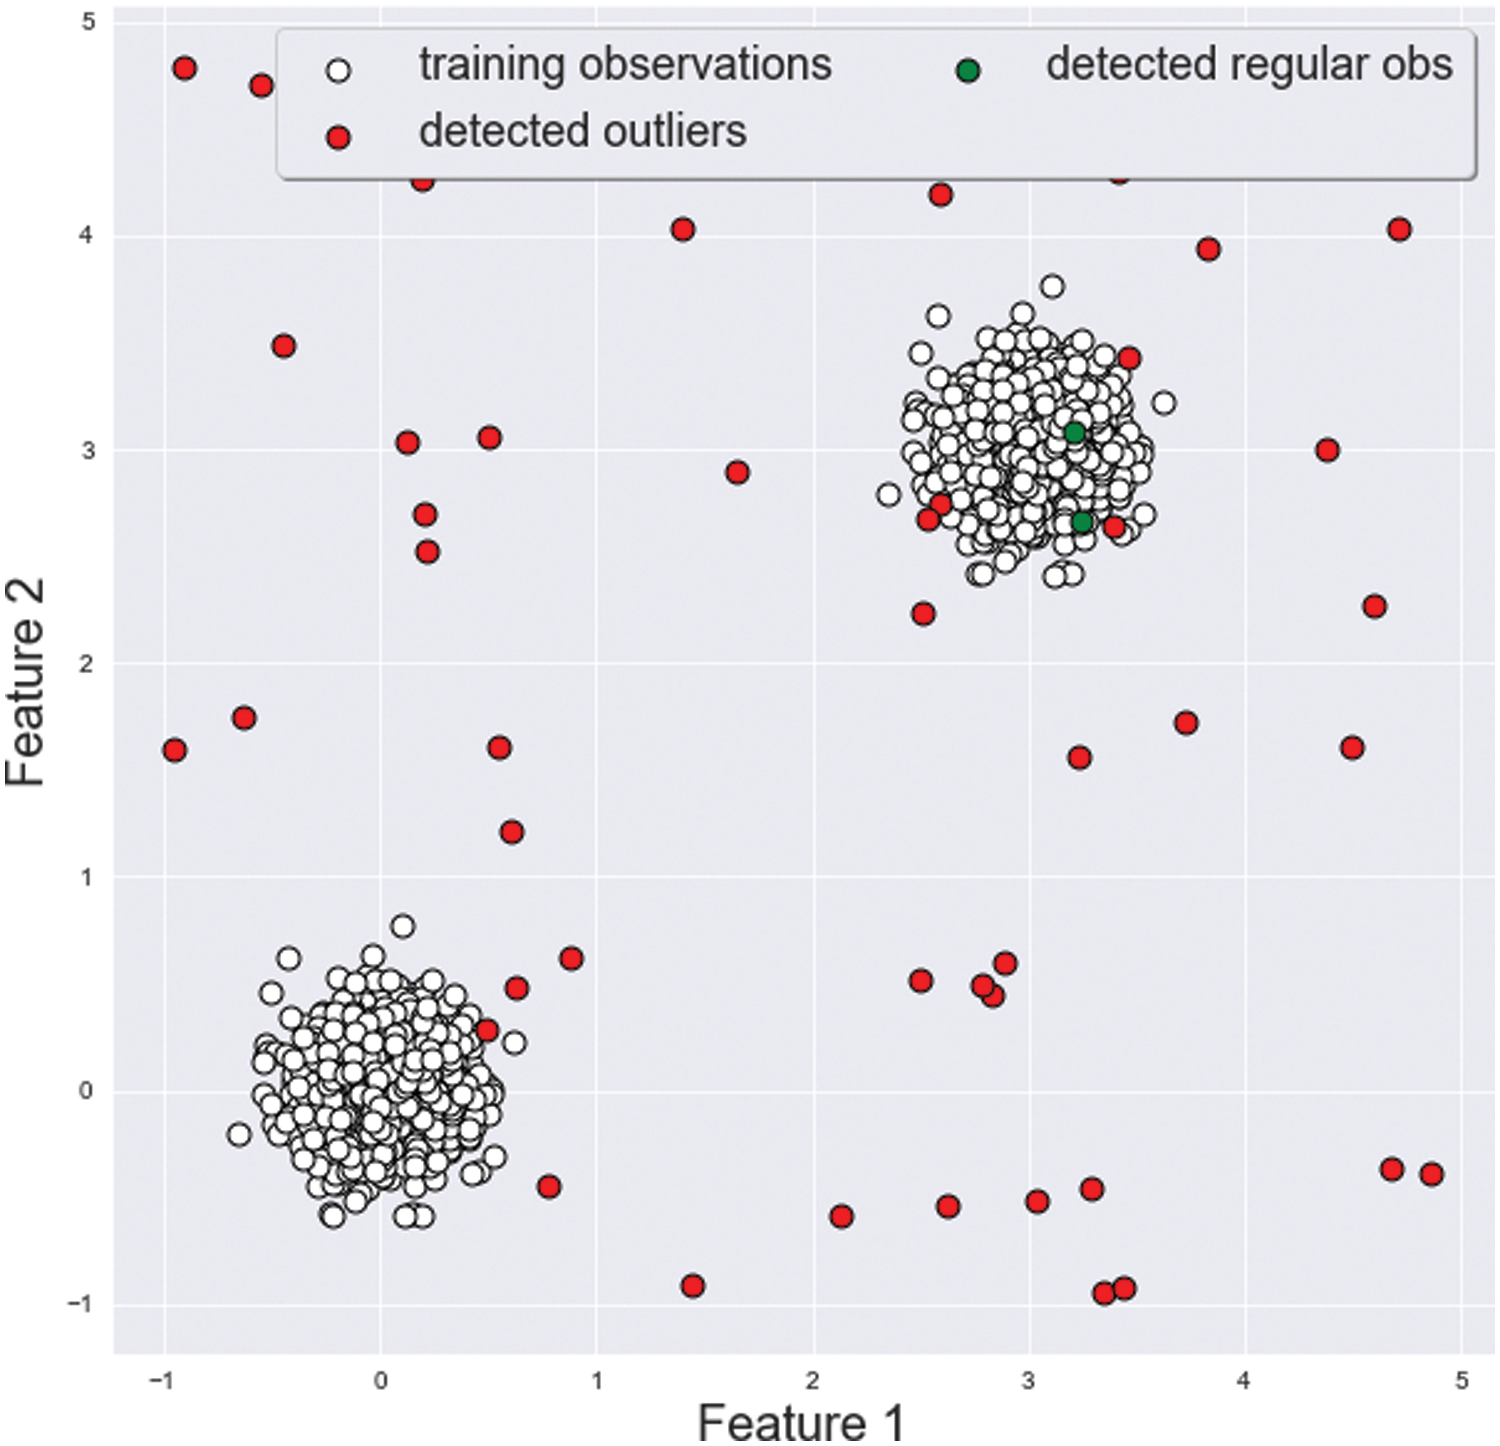
Figure 5: Local outlier factor (LOF) example
This section describes anomaly detection algorithms. SL algorithms learn from labeled data so that SL can classify data according to labels. This makes it possible to identify normal data and various types of attack data. In contrast, UL algorithms detect anomaly network packets by learning and clustering unlabeled data. Section 6 presents anomaly detection systems using relevant algorithms and feature data previously selected through correlation analysis.
6 Network-Based Anomaly Detection Model Results
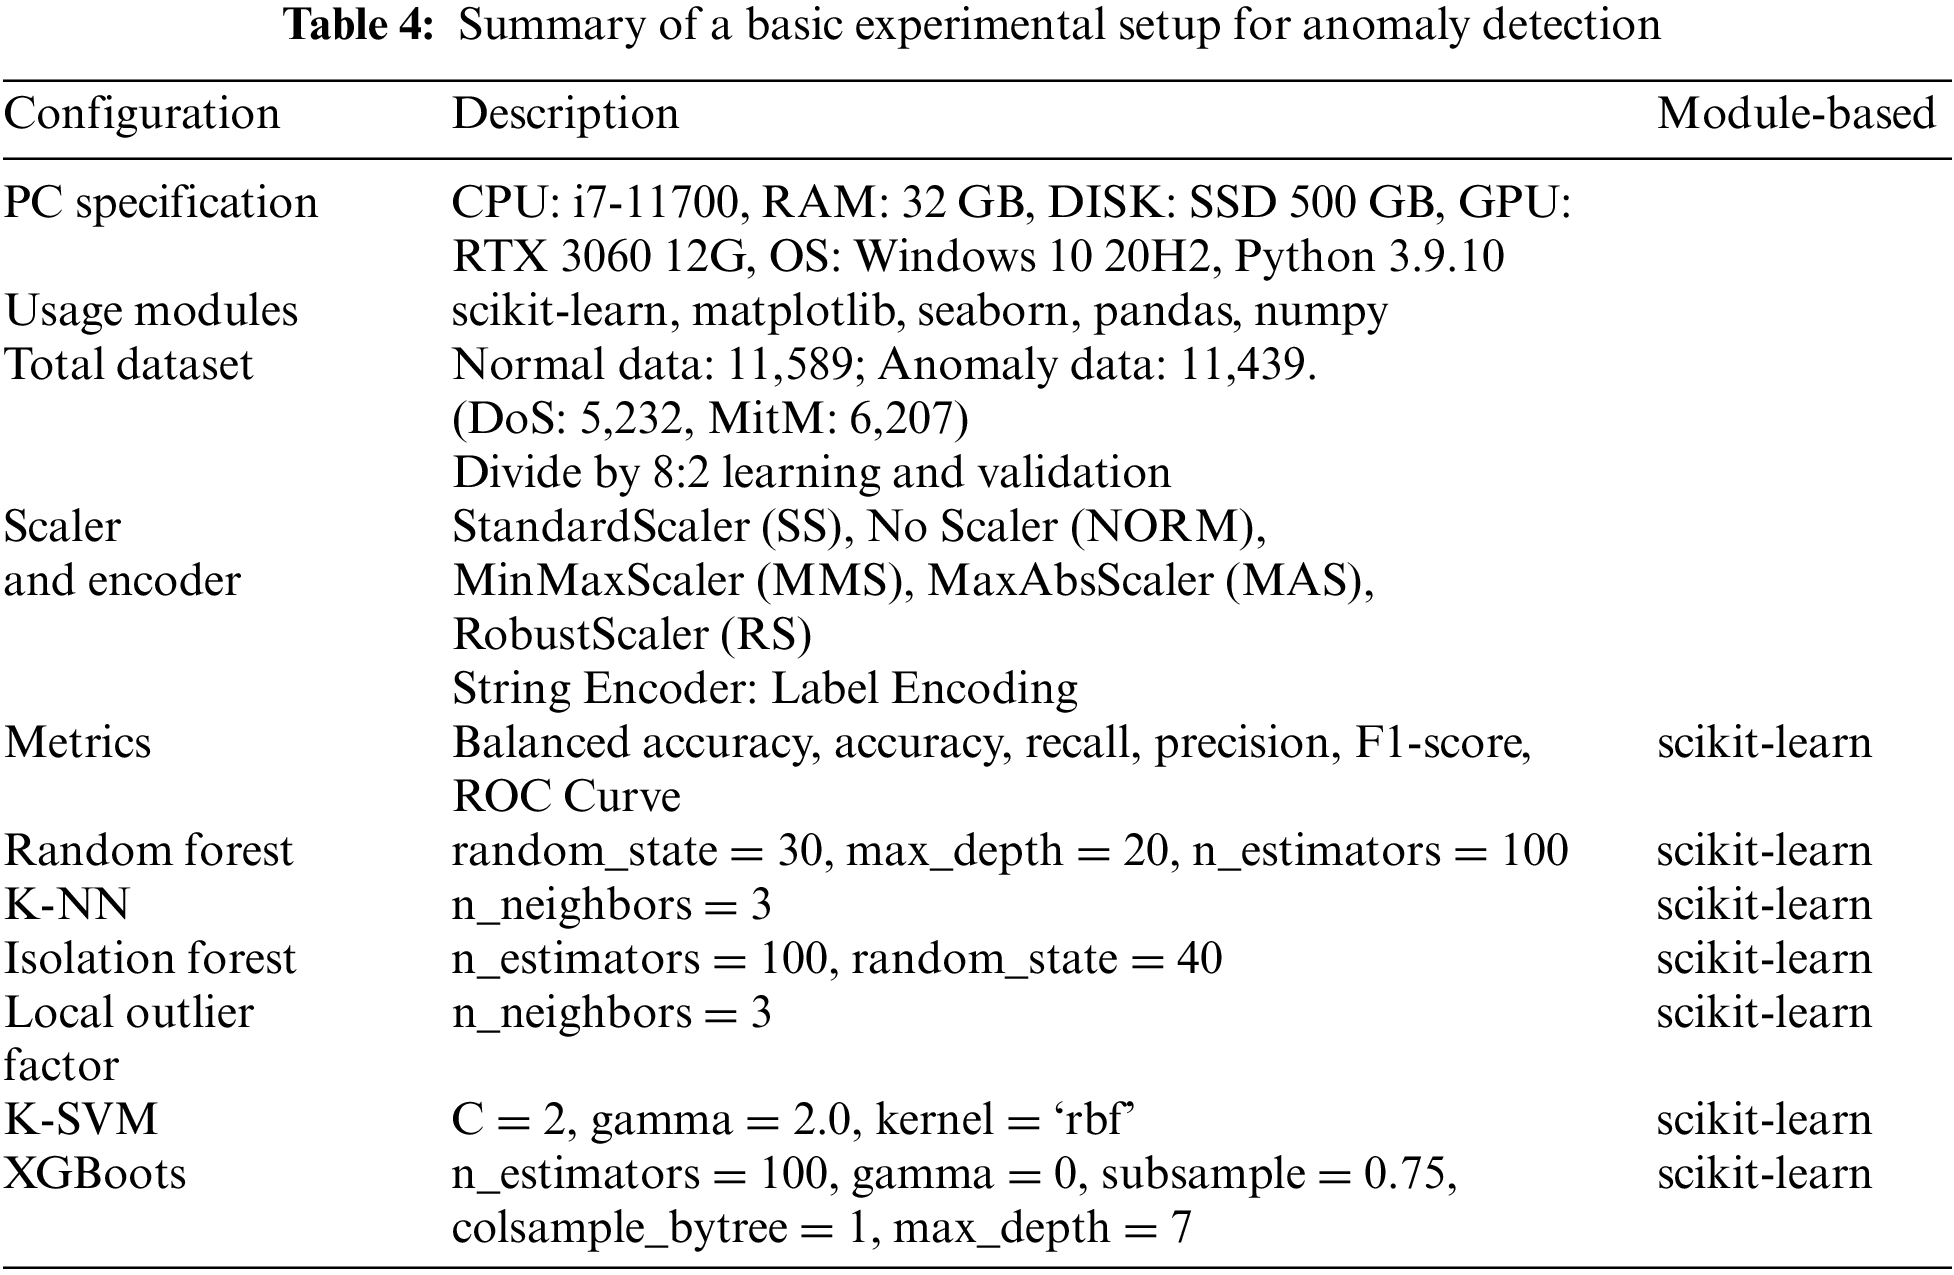
This section presents the results of developing and verifying the solar power plant network-based anomaly detection models. The environments and settings in which the anomaly detection models were implemented are presented in Table 4.
The major metrics used to verify the anomaly detection models proposed in this project include balanced accuracy (Eq. (3)), accuracy (Eq. (4)), recall (Eq. (5)), precision (Eq. (6)), F1-score (Eq. (7)), and the ROC curve. Verification was based on the result values of true positives (TP), true negatives (TN), false positives (FP), and false negatives (FN).
In addition, the reliability of results was ensured by correctly identifying the real positives predicted among all positives predicted through balanced accuracy (BA) and a correct prediction of real negatives among predicted negatives [35]. Label encoding was applied to categorical data before the data were used for learning. After that, the feature data to be used for learning were selected through correlation analysis, and various scalers were applied to the learning data for preprocessing. The scaler is an essential factor that influences model performance. The scaling techniques included StandardScaler (SS), MinMaxScaler (MMS), MaxAbsScaler (MAS), and RobustScaler (RS), all of which are commonly used for normalization. After normalization, the anomaly detection models were trained with the final preprocessed datasets, eventually improving several algorithms’ performance. The SL algorithms used for the proposed models included K-NN, Random Forest, K-SVMs, and XGBoost. The UL algorithms for the proposed models were Isolation Forest and the LOF.
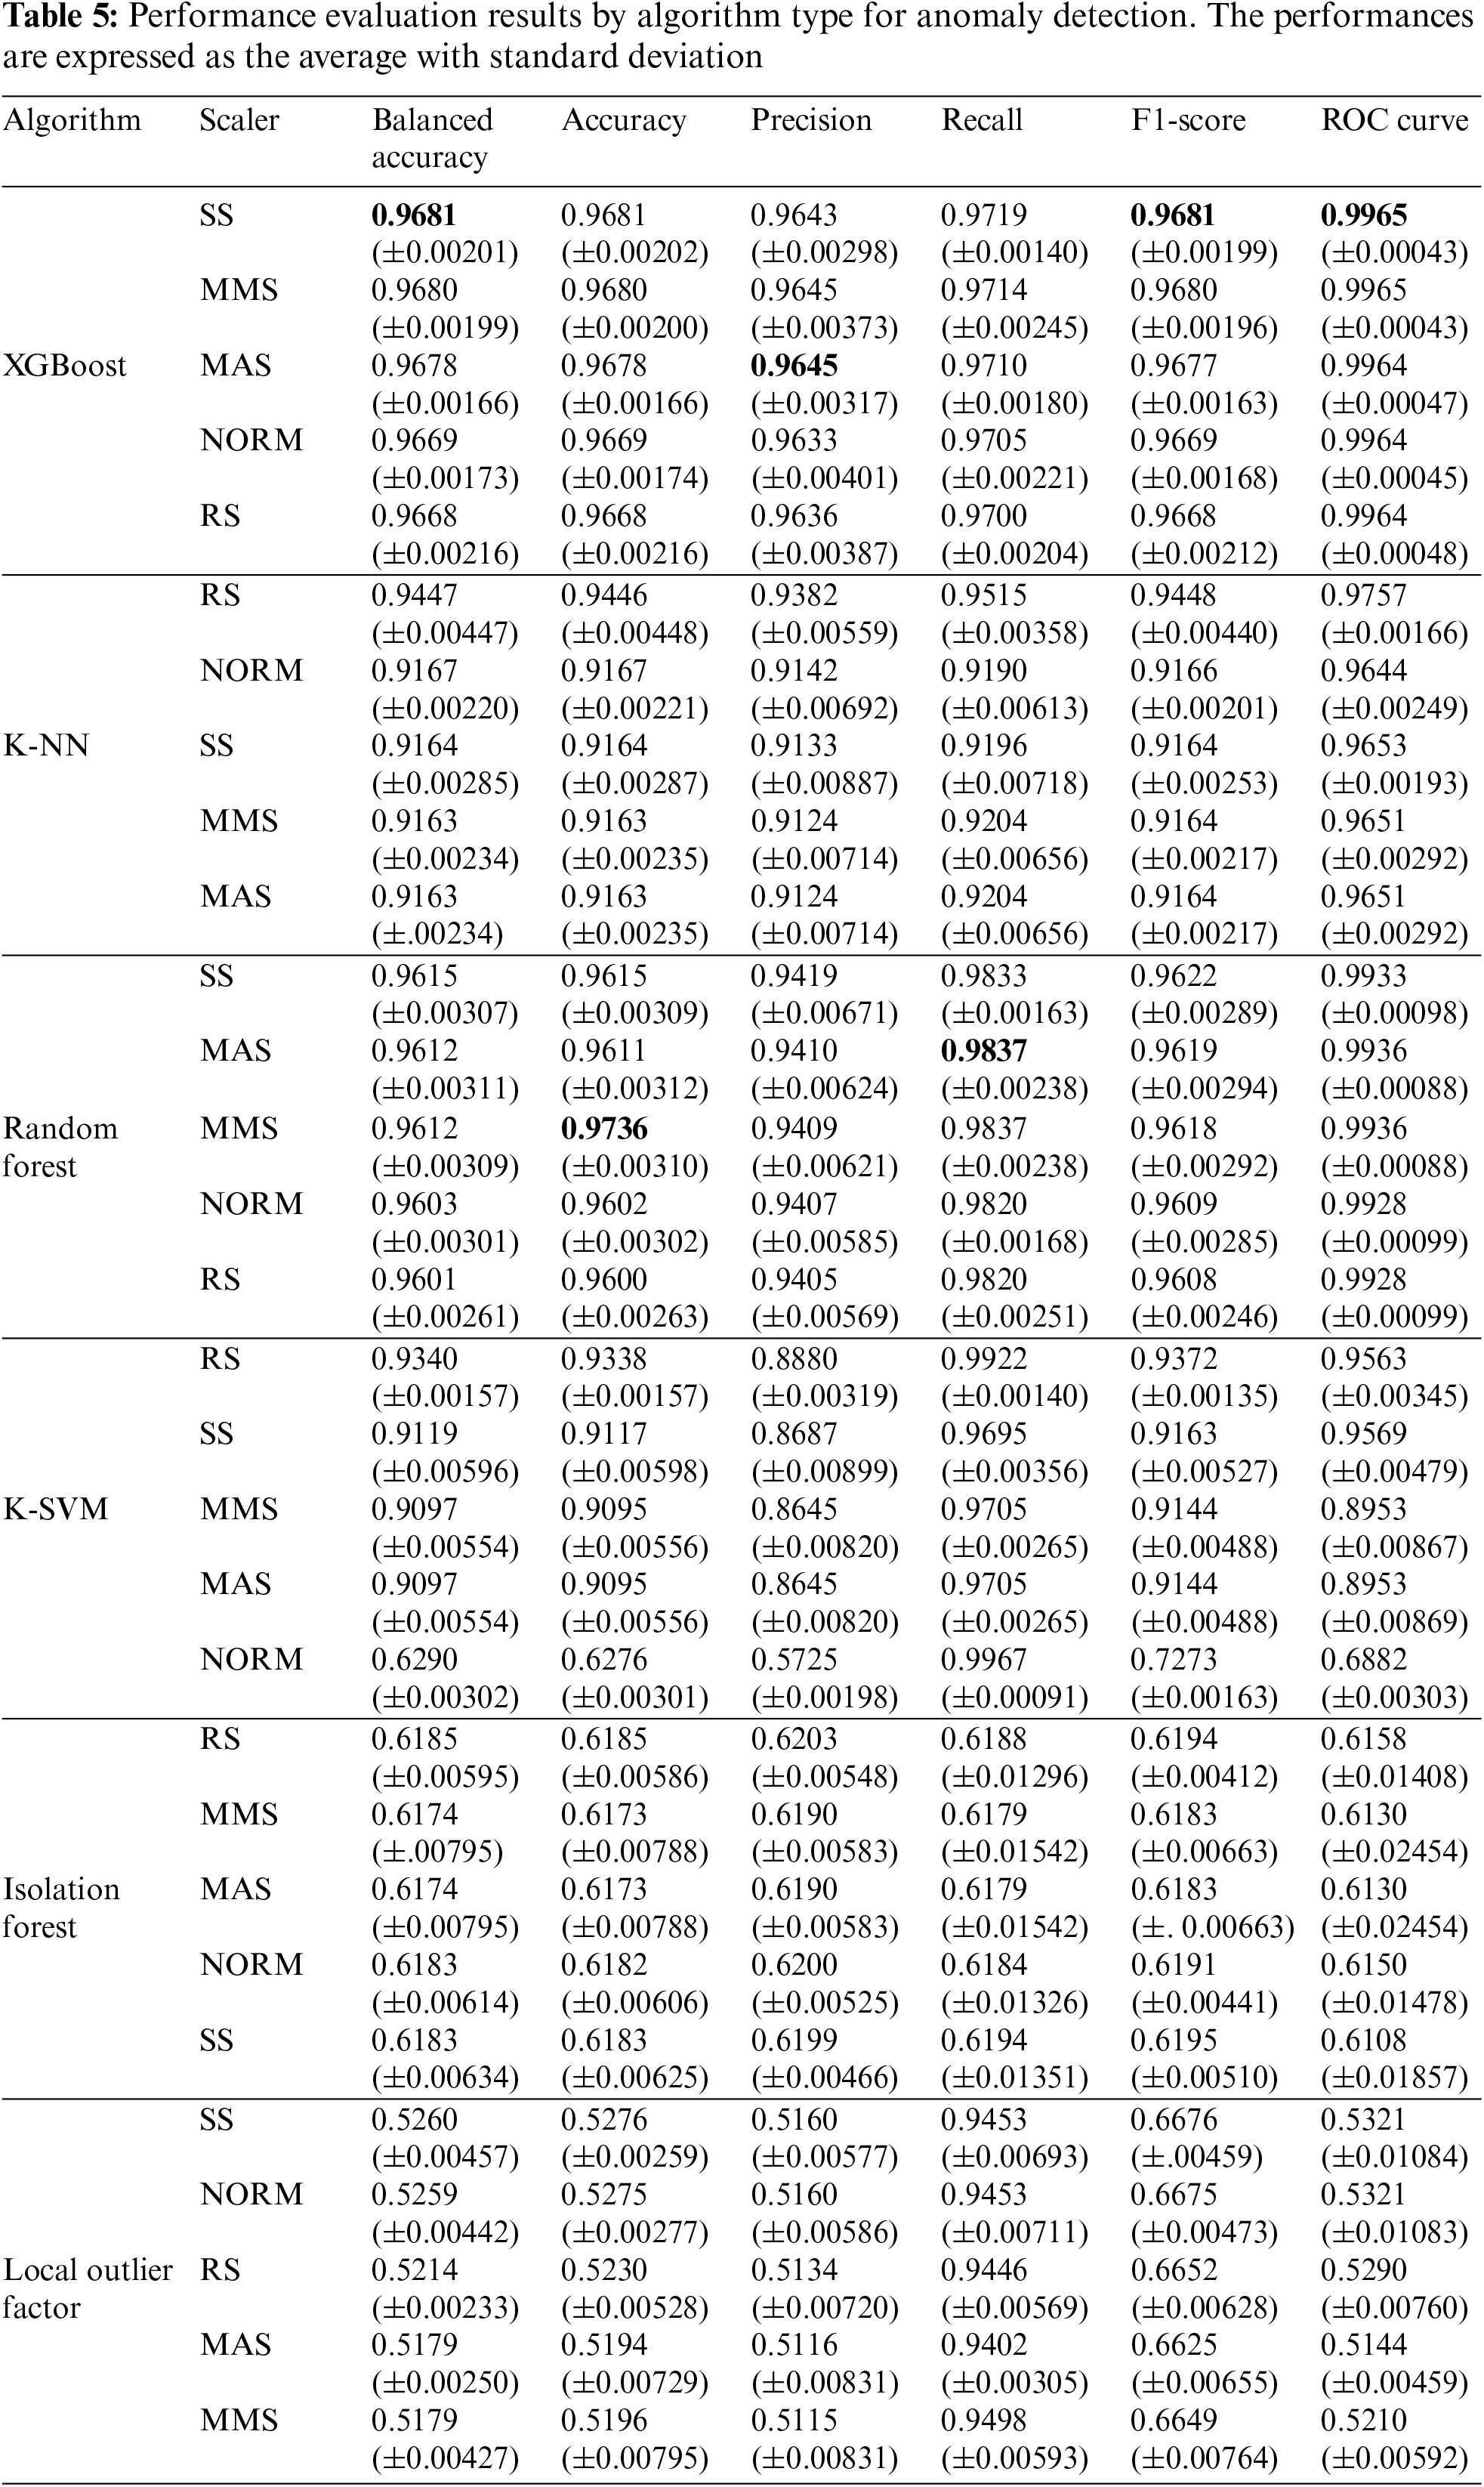
Each model was trained and verified with 11,589 normal datasets and 11,439 anomaly datasets. Labeled data were used to train SL models, and UL models were trained with separate unlabeled datasets. The performance was measured by inputting labeled data during verification. Table 5 shows the results of data learning and anomaly detection performance evaluations, which are models of the experimental environment mentioned above. All models performed k-fold cross-validation (k = 5), and the average detection performance and standard deviation were presented in the table. Most algorithmic models showed high performance in terms of accuracy, and among them, XGBoost had the highest BA when using SS as the scaler, with an F1-score of 0.9681, an accuracy of 0.9681, and a ROC curve of 0.9965. Also, In Random Forest with MMS, the accuracy was the highest at 0.9736. The UL algorithm performed lower than the SL algorithm because it learned unlabeled data. However, the choice of learning algorithms depends on the operating environment and datasets. It is important to avoid judging SL as being better than UL simply by looking at the performance table.
The performance of each model is expressed using a ROC curve graph. The ROC curve graph is in which the x-axis is the false positive rate, and the y-axis is the actual positive rate. The ROC curve is a representative performance indicator because it can visualize a classifier’s performance by changing various classification thresholds. Fig. 6 shows the ROC curve for (a) K-NN, (b) Random Forest, (c) K-SVM, (d) Local Outlier Factor, (e) Isolation Forest, and (f) XGBoost. Fig. 7 shows the model representing the maximum ROC curve for each algorithm.
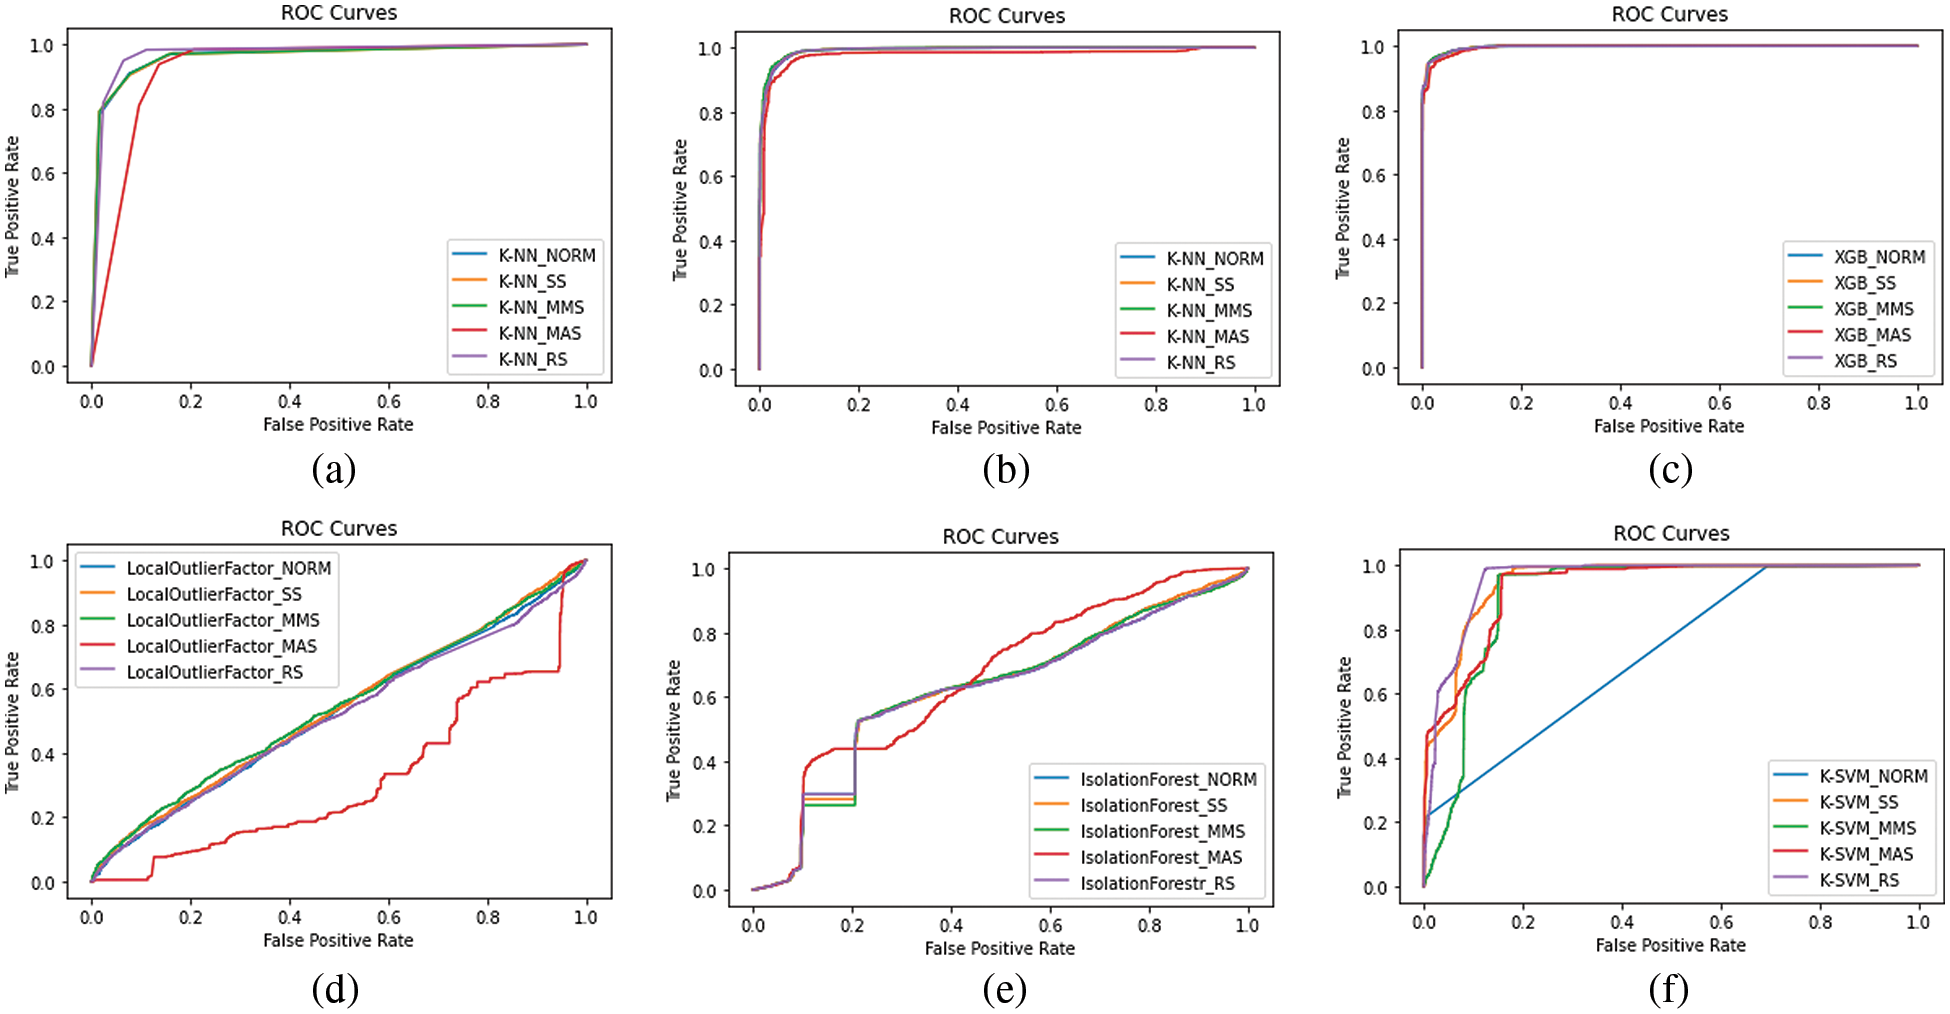
Figure 6: ROC curves of the proposed learning models
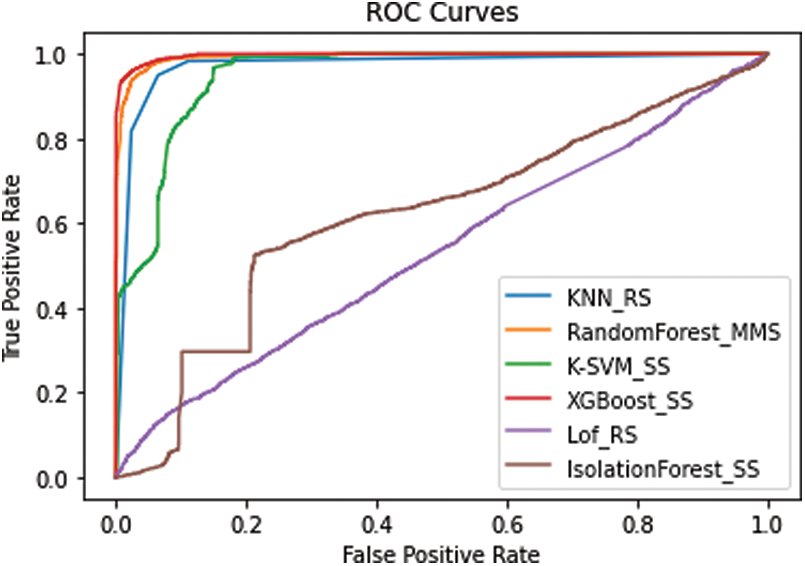
Figure 7: Best ROC curve models for each algorithm
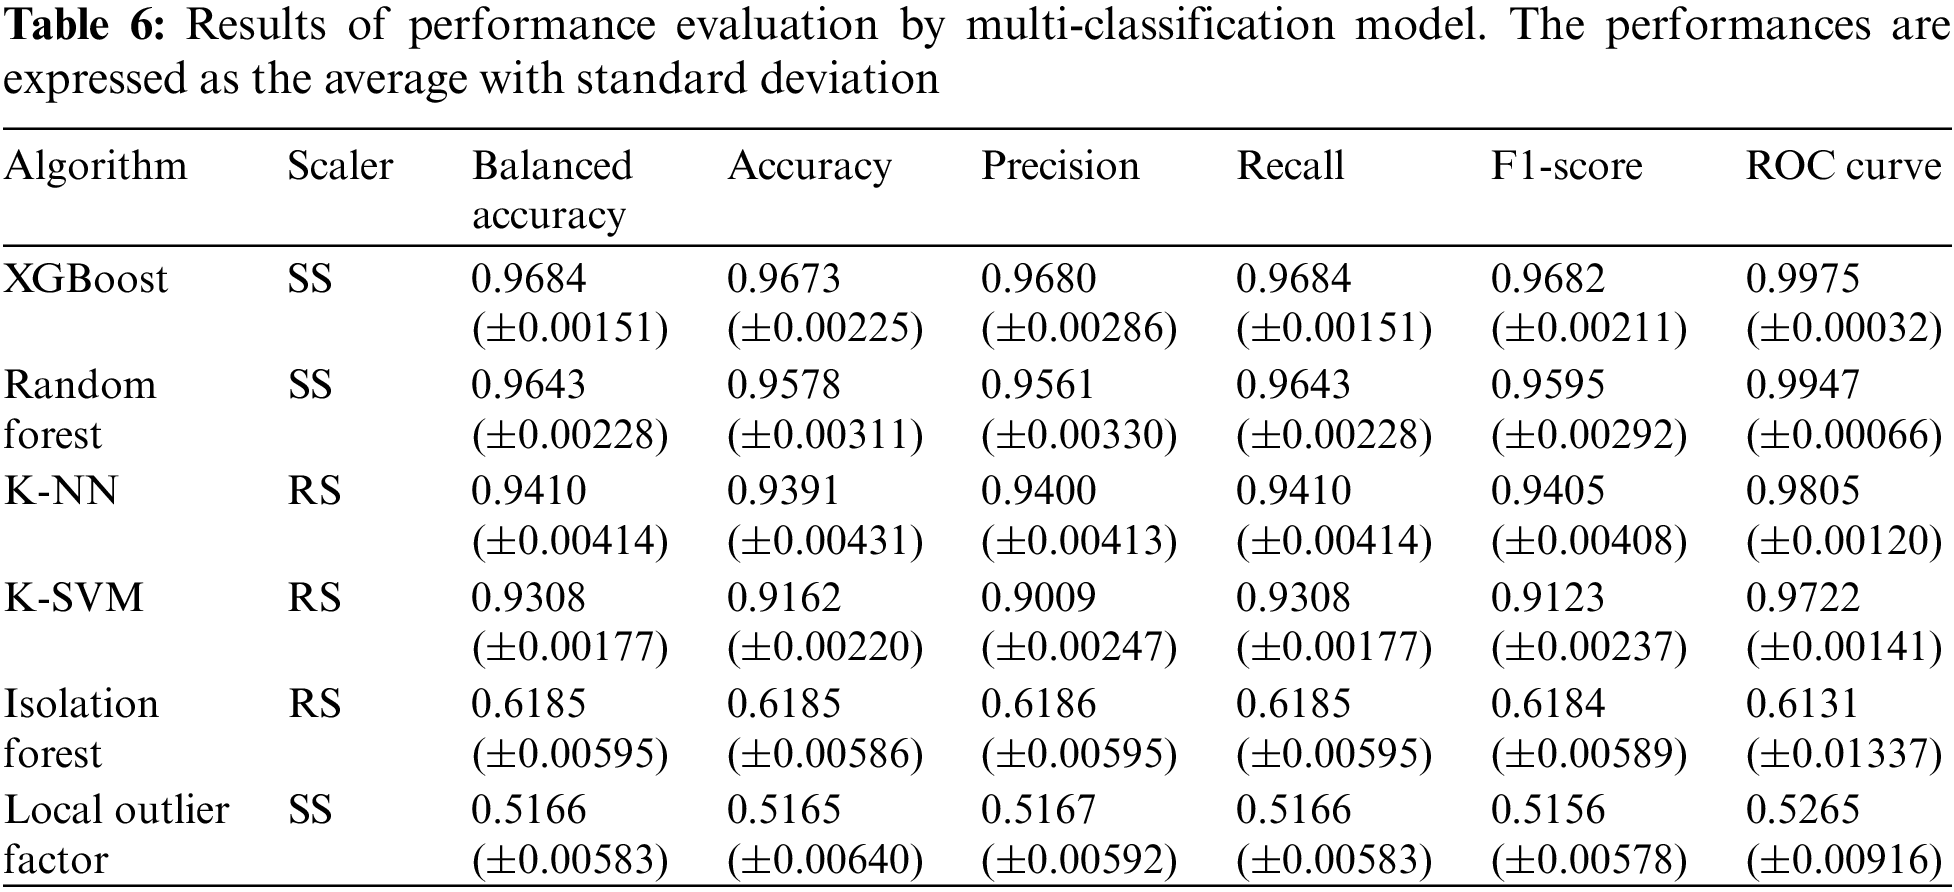
We developed multi-classification models based on the models with the highest BA in binary classification (normal vs. anomaly). Labels were divided into three categories: normal, DoS attack, and MitM attack. Table 6 shows the performance of an anomaly detection model that detects cyberattack network packets from multi-label datasets.
Finally, we compared our anomaly detection model to existing and representative anomaly detection models used in solar power plants. Existing anomaly detection models use different features or different classification models. For example, existing anomaly detection models use solar power plant operation information as data, whereas our model uses network packets for anomaly detection. We conducted an indirect comparison based on the performance presented in each study referenced.
Table 7 compares the performance of existing anomaly detection models used in solar power plants and our new model. Ibrahim [11] proposed anomaly detection for PV systems using AC power, yield, and temperature. Anomaly detection models were then developed using AE-LSTM, Facebook-Prophet, and Isolation Forest. Of these, the model that presented the most accurate performance was Isolation Forest, so Isolation Forest was selected as our first comparison index. The accuracy of the model was 0.8963. Benedetti et al. [12] proposed anomaly detection for ANN-based PV systems using AC power, a pyranometer, and temperature. The accuracy of this model was more excellent than 0.9000, so it was included as a comparison index. Seo et al. [13] proposed an anomaly detection system for solar power plant generation using solar radiation and temperature. This anomaly detection model was developed using K-NN. The accuracy of the model was 0.8800. Vlaminck et al. [16] used solar panel images for anomaly detection in solar panels. Their anomaly detection model was developed using CNN, with an accuracy of 0.9680.
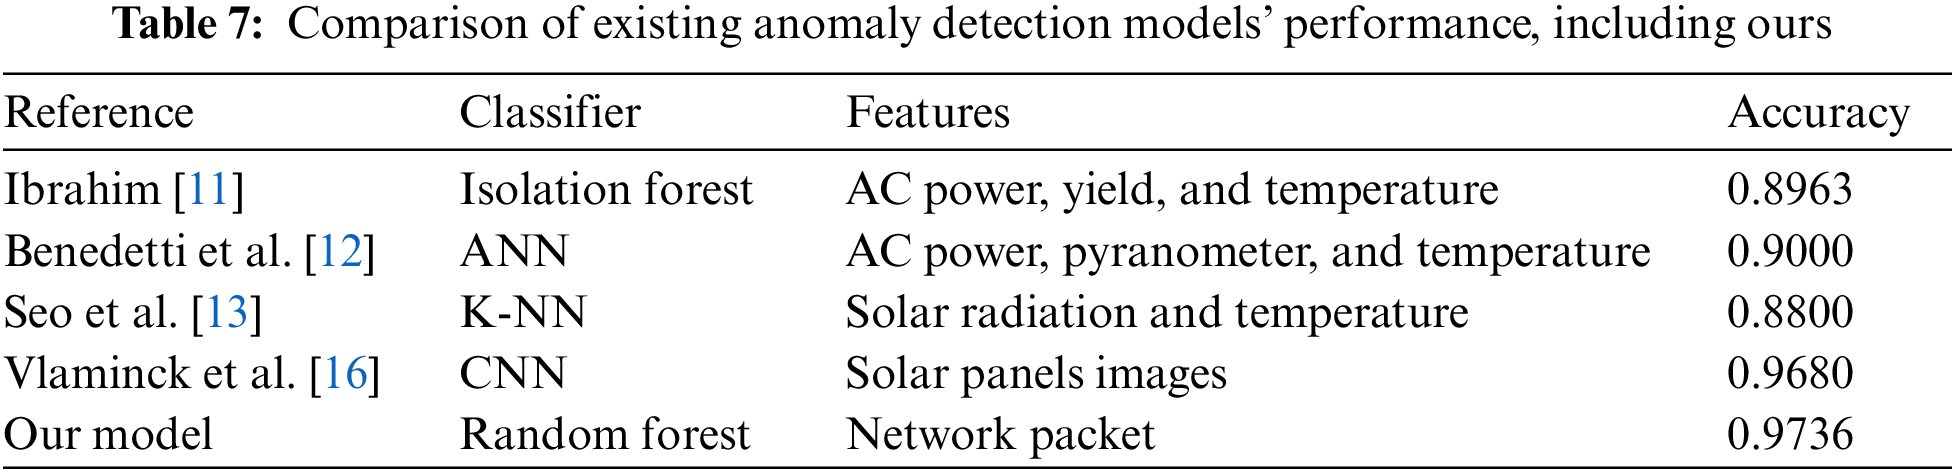
These existing anomaly detection models were not developed for cybersecurity purposes because they only detect power generation anomalies in PV systems. However, our anomaly detection model focuses on cybersecurity using network packets within the inverters. Regarding cybersecurity, the proposed method is more efficient than any existing anomaly detection model. In addition, the results were meaningful because the RF model had the highest accuracy of 0.9736, which is higher than the performance of any existing anomaly detection model.
As mentioned earlier, machine learning algorithms can be used to implement network packet-based anomaly detection systems, and since the status of the network packet datasets will differ depending on the particular solar power plant, an appropriate algorithm model and preprocessing method should be selected when introducing and utilizing anomaly detection systems with PV inverters. The existing anomaly detection systems for solar power plants work only when an anomaly occurs in the electricity generation. In other words, damage can be detected only after a cyberattack. However, the network-based anomaly detection systems proposed have the potential to minimize the impact of attacks because their capacity to monitor at the network level makes it possible to detect cyberattacks well in advance. In particular, the proposed system can detect attacks such as a DoS or MitM attack on a solar power plant. Thus, if a network packet-based anomaly detection system is used together with an existing anomaly detection system, it would provide more efficient monitoring, thus enhancing the overall security of the solar power plant.
7 Conclusion and Future Research
Cyber threats continue to increase proportionally to the growing importance and scale of solar power plants. This paper proposes an anomaly detection system on the solar power plant network for cybersecurity. The anomaly detection system makes it more effective in responding to cyber threats. First, we analyzed the structure of the solar power plant and identified the operation method and major systems. Cyberattacks on solar plants, published vulnerabilities, and various related studies were then analyzed to identify where cyber threats occur, the types of attacks, and their ripple effects. The analysis identified cyber threats to the inverters in the solar power plant, including DoS and MitM attacks, as major threats. Since the inverter controls the flow of power through the PLC, this threat to the inverter should be further emphasized, and therefore, if the inverter is exploited, it can lead to fatal events. On this basis, PLC network packet-based anomaly detection systems were proposed to detect possible cyber threats in solar power plants, such as DoS and MitM attacks on inverters. We preprocessed the dataset with correlation analysis and normalization and then developed a proposed anomaly detection system using supervised and unsupervised machine learning-based algorithms. The experimental results show that, among various classification models, Random Forest with MMS had the highest anomaly detection performance (accuracy of 97.36% and F1-score of 96.18%). The results show these numbers are high enough to detect anomalies and respond to cyber threats. Existing anomaly detection systems for the electricity generation of solar power plants cannot detect cyber threats, such as MitM and DoS attacks. However, the network-based anomaly detection systems proposed in this paper can help improve the security of solar power plants by detecting cyber threats at the network level.
In this paper, PLC data from an existing SCADA system were used instead of the network packets of the PLC in the inverter to prove anomaly detection. There is a need for further testing and verifying the actual packets used in the solar power plant. In this regard, future research should focus on establishing a test bed for a solar power plant to collect and experiment with normal and attack packets.
Acknowledgement: The authors thank the CPS Security Center at Gachon University for advice on experimental design.
Funding Statement: This work was partly supported by the Korea Institute of Energy Technology Evaluation and Planning (KETEP) grant funded by the Korea government (MOTIE) (20224B10100140, 50%) and the Nuclear Safety Research Program through the Korea Foundation of Nuclear Safety (KoFONS) using the financial resource granted by the Nuclear Safety and Security Commission (NSSC) of the Republic of Korea (No. 2106058, 40%) and the Gachon University Research Fund of 2023 (GCU-202110280001, 10%).
Author Contributions: Study conception and design: Ju Hyeon Lee, Jiho Shin; data collection: Ju Hyeon Lee; analysis and interpretation of results: Ju Hyeon Lee, Jiho Shin, Jung Taek Seo; draft manuscript preparation: Ju Hyeon Lee, Jiho Shin, Jung Taek Seo. All authors reviewed the results and approved the final version of the manuscript.
Availability of Data and Materials: Data is openly available in a public repository. The data supporting this study’s findings are openly available in (ICS Cybersecurity PCAP repository) at (https://github.com/tjcruz-dei/ICS_PCAPS).
Conflicts of Interest: The authors declare that they have no conflicts of interest to report regarding the present study.
References
1. Y. Abdelilah, P. Bojek, F. Briens, C. Cheng, T. Criswell et al., “Renewable energy market update: Outlook for 2021 and 2022,” Paris, France: International Energy Agency, 2021. [Online]. Available: https://iea.blob.core.windows.net/assets/18a6041d-bf13-4667-a4c2-8fc008974008/RenewableEnergyMarketUpdate-Outlookfor2021and2022.pdf [Google Scholar]
2. H. Bahar, Y. Abdelilah, U. Collier, K. Daszkiewicz, P. L. Feuvre et al., “IEA renewables 2018-analysis and forecast to 2023,” Paris, France: International Energy Agency, 2018. [Online]. Available: https://www.iea.org/reports/renewables-2018 [Google Scholar]
3. C. M. Miller, “Summer energy market and reliability assessment 2022,” Washington DC, USA: Federal Energy Regulatory Commission, 2022. [Online]. Available: https://www.ferc.gov/news-events/news/presentation-report-2022-summer-energy-market-and-reliability-assessment [Google Scholar]
4. B. Sobczak, “First-of-a-kind U.S. grid cyberattack hit wind, solar,” Houston, TX, USA: E&E News, 2019. [Online]. Available: https://subscriber.politicopro.com/article/eenews/1061421301 [Google Scholar]
5. J. Johnson, “Roadmap for photovoltaic cyber security,” Albuquerque, New Mexico, USA: Sandia National Laboratories, 2017. [Online]. Available: https://sunspec.org/wp-content/uploads/2020/01/Roadmap-for-Photovoltaic-Cyber-Security-SAND2017-13262-4-10-2018.pdf [Google Scholar]
6. A. B. Nassif, M. A. Talib, Q. Nasir and F. M. Dakalbab, “Machine learning for anomaly detection: A systematic review,” IEEE Access, vol. 9, pp. 78658–78700, 2021. [Google Scholar]
7. B. S. Kumar and K. Sudhakar, “Performance evaluation of 10 MW grid connected solar photovoltaic power plant in India,” Energy Reports, vol. 1, no. 21, pp. 184–192, 2015. [Google Scholar]
8. K. H. Nam and M. J. Jeong, “A development of the maintenance function for the solar power plant based on IoT,” The Journal of the Korea Institute of Electronic Communication Sciences, vol. 10, no. 10, pp. 1157–1162, 2015 (In Korean). [Google Scholar]
9. D. Lauria and M. Coppola, “Design and control of an advanced PV inverter,” Solar Energy, vol. 110, no. 3, pp. 533–542, 2014. [Google Scholar]
10. C. Jamroen, N. Yonsiri, T. Odthon, N. Wisitthiwong and S. Janreung, “A standalone photovoltaic/battery energy-powered water quality monitoring system based on narrowband internet of things for aquaculture: Design and implementation,” Smart Agricultural Technology, vol. 3, no. 6, pp. 1–14, 2023. [Google Scholar]
11. M. Ibrahim, “Machine learning schemes for anomaly detection in solar power plants,” Energies, vol. 15, no. 3, pp. 1082–1099, 2022. [Google Scholar]
12. M. D. Benedetti, F. Leonardi, F. Messina, C. Santoro and A. Vasilakos, “Anomaly detection and predictive maintenance for photovoltaic systems,” Neurocomputing, vol. 310, no. Supplement C, pp. 59–68, 2018. [Google Scholar]
13. J. K. Seo, T. I. Lee, W. S. Lee and J. B. Park, “A study on the outlier estimation method for detecting anomalies in solar power generation,” Journal of IKEEE, vol. 24, no. 2, pp. 32–37, 2020 (In Korean). [Google Scholar]
14. I. W. Lee, “Make energy & environment intelligent,” Daejeon, Korea: ETRI, 2020. [Online]. Available: https://www.etri.re.kr/webzine/20200828/sub02.html [Google Scholar]
15. A. Teymouri, A. M. Sani and C. C. Liu, “Cyber security risk assessment of solar PV units with reactive power capability,” in IECON 2018-44th Annual Conf. of the IEEE Industrial Electronics Society, Washington DC, USA, pp. 2872–2877, 2018. [Google Scholar]
16. M. Vlaminck, R. Heidbuchel, W. Philips and H. Luong, “Region-based CNN for anomaly detection in PV power plants using aerial imagery,” Sensors, vol. 22, no. 3, pp. 1244–1262, 2022. [Google Scholar] [PubMed]
17. Y. Akiyama, Y. Kasai, M. Iwata, E. Takahashi, E. Takahashi et al., “Anomaly detection of solar power generation systems based on the normalization of the amount of generated electricity,” in 2015 IEEE 29th Int. Conf. on Advanced Information Networking and Applications, Gwangju, Korea, pp. 294–301, 2015. [Google Scholar]
18. S. Ebrahimi, S. M. Safayet Ullah, F. Ferdowsi and M. Barati, “Machine learning-aided anomaly detection for secure smartification of solar inverters,” in 2022 IEEE Kansas Power and Energy Conf. (KPEC), Manhattan, KS, USA, pp. 1–6, 2022. [Google Scholar]
19. C. B. Jones, A. R. Chavez, R. D. Zamora and S. H. McKenzie, “Implementation of intrusion detection methods for distributed photovoltaic inverters at the grid-edge,” in 2020 IEEE Power & Energy Society Innovative Smart Grid Technologies Conf. (ISGT), Washington DC, USA, pp. 1–5, 2020. [Google Scholar]
20. X. Chen, J. Zhou, M. Shi, Y. Chen and J. Wen, “Distributed resilient control against denial of service attacks in DC microgrids with constant power load,” Renewable and Sustainable Energy Reviews, vol. 153, no. 24, pp. 1–12, 2022. [Google Scholar]
21. W. Westerhof, “How an intern hacked the powergrid,” Amsterdam, Netherlands: SHA 2017, 2017. [Online]. Available: https://program.sha2017.org/events/434.html [Google Scholar]
22. MITRE, “Common vulnerabilities and exposures,” Bedford, MA, USA: Miter Corporation, 2023. [Online]. Available: https://cve.mitre.org [Google Scholar]
23. GitHub. tjcruz-dei/ICS_PCAPS, 1st Session, “ICS cybersecurity PCAP repository,” 2019. [Online]. Available: https://github.com/tjcruz-dei/ICS_PCAPS/releases/tag/MODBUSTCP%231 [Google Scholar]
24. I. Frazã, P. H. Abreu, T. Cruz, H. Araújo and P. Simões, “Denial of service attacks: Detecting the frailties of machine learning algorithms in the classification process,” in CRITIS 2018: Critical Information Infrastructures Security, Kaunas, Lithuania, pp. 230–235, 2018. [Google Scholar]
25. CICFlowMeter, “CICFlowMeter (formerly ISCXFlowMeter),” Fredericton, Canada: Canadian Institute for Cybersecurity, 2023. [Online]. Available: https://www.unb.ca/cic/research/applications.html#CICFlowMeter [Google Scholar]
26. D. Edelmann, T. F. Móri and G. J. Székely, “On relationships between the Pearson and the distance correlation coefficients,” Statistics & Probability Letters, vol. 169, pp. 1–6, 2021. [Google Scholar]
27. S. Eltanbouly, M. Bashendy, N. AlNaimi, Z. Chkirbene and A. Erbad, “Machine learning techniques for network anomaly detection: A survey,” in 2020 IEEE Int. Conf. on Informatics, IoT, and Enabling Technologies (ICIoT), Doha, Qatar, pp. 156–162, 2020. [Google Scholar]
28. E. Y. Boateng, J. Otoo and D. A. Abaye, “Basic tenets of classification algorithms K-nearest-neighbor, support vector machine, random forest and neural network: A review,” Journal of Data Analysis and Information Processing, vol. 8, no. 4, pp. 341–357, 2020. [Google Scholar]
29. N. M. Abdulkareem and A. M. Abdulazeez, “Machine learning classification based on radom forest algorithm: A review,” International Journal of Science and Business, vol. 5, no. 2, pp. 128–142, 2021. [Google Scholar]
30. M. Hosseinzadeh, A. M. Rahmani, B. Vo, M. Bidaki, M. Masdari et al., “Improving security using SVM-based anomaly detection: Issues and challenges,” Soft Computing, vol. 25, no. 4, pp. 3195–3223, 2021. [Google Scholar]
31. B. S. Bhati, G. Chugh, F. A. Turjman and N. S. Bhati, “An improved ensemble based intrusion detection technique using XGBoost,” Transactions on Emerging Telecommunications Technologies, vol. 32, no. 6, pp. 1–15, 2020. [Google Scholar]
32. O. I. Provotar, Y. M. Linder and M. M. Veres, “Unsupervised anomaly detection in time series using LSTM-based autoencoders,” in 2019 IEEE Int. Conf. on Advanced Trends in Information Theory (ATIT), Kyiv, Ukraine, pp. 513–517, 2019. [Google Scholar]
33. J. Lesouple, C. Baudoin, M. Spigai and J. Y. Tourneret, “Generalized isolation forest for anomaly detection,” Pattern Recognition Letters, vol. 149, no. 3, pp. 109–119, 2021. [Google Scholar]
34. L. Boukela, G. Zhang, M. Yacoub, S. Bouzefrane, S. B. B. Ahmadi et al., “A modified LOF-based approach for outlier characterization in IoT,” Annals of Telecommunications, vol. 76, no. 3–4, pp. 145–153, 2021. [Google Scholar]
35. W. Wegier and P. Ksieniewicz, “Application of imbalanced data classification quality metrics as weighting methods of the ensemble data stream classification algorithms,” Entropy, vol. 22, no. 8, pp. 1–17, 2020. [Google Scholar]
Cite This Article
 Copyright © 2023 The Author(s). Published by Tech Science Press.
This work is licensed under a Creative Commons Attribution 4.0 International License , which permits unrestricted use, distribution, and reproduction in any medium, provided the original work is properly cited.
 Downloads
 Citation Tools