
 Submit a Paper
 Propose a Special lssue
 Open Access
ARTICLE
Fusion of Region Extraction and Cross-Entropy SVM Models for Wheat Rust Diseases Classification
1
Department of Computer Science & Engineering, Chitkara University Institute of Engineering and Technology, Chitkara
University, Punjab, 140401, India
2
Department of Electronics & Communication Engineering, Chandigarh University, Punjab, 140413, India
3
Department of Dental Industry Techniques, Al-Noor University College, Nineveh, 41018, Iraq
* Corresponding Author: Ayush Dogra. Email:
Computers, Materials & Continua 2023, 77(2), 2097-2121. https://doi.org/10.32604/cmc.2023.044287
Received 26 July 2023; Accepted 12 October 2023; Issue published 29 November 2023
 View Full Text
 Download PDF
Abstract
Wheat rust diseases are one of the major types of fungal diseases that cause substantial yield quality losses of 15%–20% every year. The wheat rust diseases are identified either through experienced evaluators or computerassisted techniques. The experienced evaluators take time to identify the disease which is highly laborious and too costly. If wheat rust diseases are predicted at the development stages, then fungicides are sprayed earlier which helps to increase wheat yield quality. To solve the experienced evaluator issues, a combined region extraction and cross-entropy support vector machine (CE-SVM) model is proposed for wheat rust disease identification. In the proposed system, a total of 2300 secondary source images were augmented through flipping, cropping, and rotation techniques. The augmented images are preprocessed by histogram equalization. As a result, preprocessed images have been applied to region extraction convolutional neural networks (RCNN); Fast-RCNN, Faster-RCNN, and Mask-RCNN models for wheat plant patch extraction. Different layers of region extraction models construct a feature vector that is later passed to the CE-SVM model. As a result, the Gaussian kernel function in CE-SVM achieves high F1-score (88.43%) and accuracy (93.60%) for wheat stripe rust disease classification.Keywords
Wheat is one of the most important staple crops in the world [1], providing a major source of food for billions of people. However, the growth and productivity of wheat crops are often threatened by a variety of diseases, including fungal, bacterial, and viral infections [2]. These diseases can cause significant damage to plants, leading to reduced yields and decreased grain quality. Generally, professionals are responsible for making decisions about the need to use pesticides. There are several methods for recognizing wheat diseases [3,4] including visual inspection, laboratory analysis, and the use of digital tools such as image analysis. Image analysis, in particular, has gained increasing attention as a promising approach for the rapid and accurate recognition of wheat diseases. By leveraging the power of computer vision and machine learning [5], image analysis can assist in the early detection and diagnosis of diseases, which helps to reduce yield quality losses. Over the past few years, automated solutions that incorporate artificial intelligence techniques and smartphone applications have been used in automated plant protection [6]. Among all types of wheat diseases, wheat rust diseases are a major threat to the global food supply, and their recognition is crucial for efficient crop management. Wheat rust [7,8] is a plant disease caused by fungal pathogens belonging to the genus Puccinia. There are three main types of wheat rust: stem rust, leaf rust, and stripe rust. These diseases can cause significant yield loss and reduce the quality of wheat grain. Stem rust is the most damaging, as it can kill the entire plant [9], while leaf rust and stripe rust mainly affect the leaves and stems, respectively. To control wheat rust diseases, farmers [10] can use different fungicides to control the disease in the flowering stage. Image processing, image segmentation, machine learning, and deep learning have become increasingly popular tools in the field of plant disease recognition. Image processing techniques are used to preprocess and enhance the quality of the images captured of the wheat plant. Image segmentation [11] is then used to separate the infected parts of the plant from the healthy parts. Machine learning and deep learning algorithms are then trained on these segmented images to accurately recognize and classify the type of rust disease present in wheat plants.
Rust is a fungal disease that spreads through resistant cultivars and environmental conditions [12]. Even, wheat rust diseases are caused by fungal pathogens that can be transmitted in a few different ways. The main mode of transmission for wheat rust is through the airborne spores of the fungal pathogen. When the spores are released from infected wheat plants, they can be carried by wind currents to infect other nearby wheat plants. There are three main types of wheat rust diseases: stem rust, stripe rust, and leaf rust diseases.
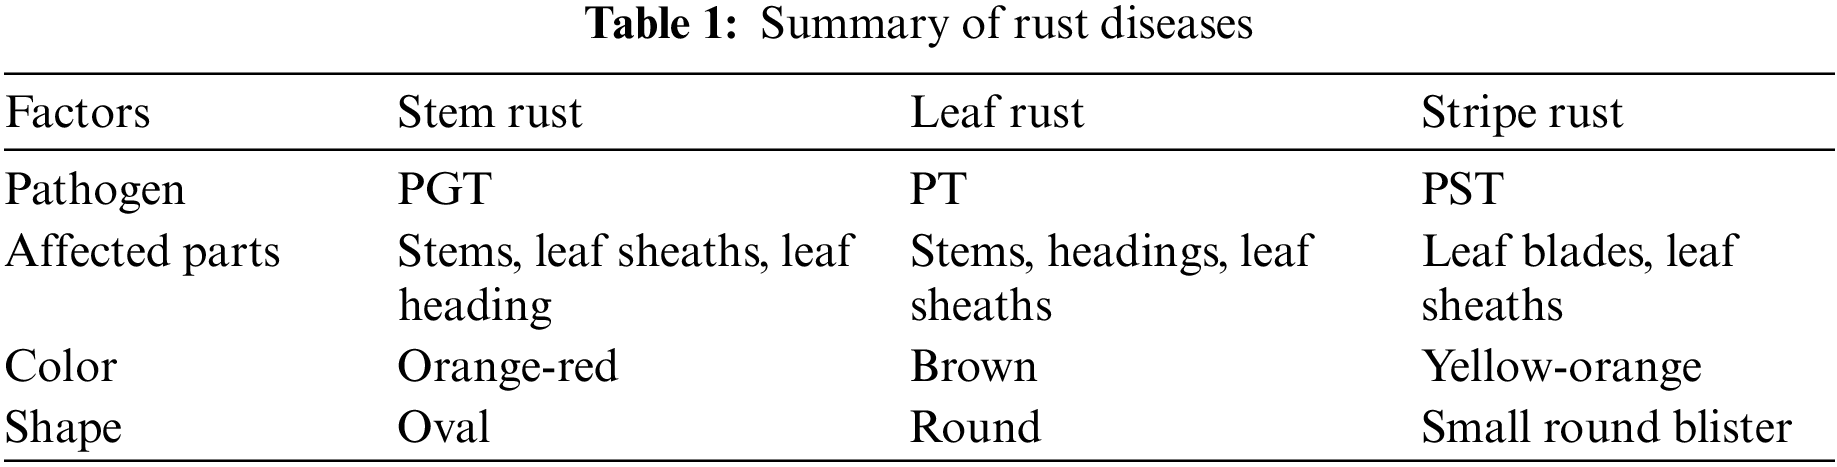
This disease is caused by the fungus Puccinia graminis f. sp. tritici known as PGT [13], which attacks the stems, leaves, and spikes of wheat plants. It can cause significant damage to the crop, leading to yield losses of up to 100%. PGT is typically discovered in warm, moist environments and symptoms of infection are typically expressed as masses of red-brick urediniospores on the leaf sheaths.
This disease is affected by the fungus Puccinia striiformis (PST), which attacks the leaves and spikes of wheat plants. It can cause yellow stripes on the leaves and lead to yield losses of up to 60%. The PST pathogen is germinated in temperate regions along with cool and wet weather [14]. Yellow-orange spores are generated as the pustules mature stage. As the disease grows, the tissues surrounding the pustules become brown and dry.
Leaf rust is produced by the fungus Puccinia triticina (PT) [14], which attacks the leaves of wheat plants. The yellowish-orange pustules appear on the leaves, leading to defoliation and yield losses of up to 50%. The pathogen grows in areas with mild temperatures and high humidity. The summary of rust diseases along with their pathogen has been presented in Table 1.
1.2 Deep Learning-Based Image Recognition Process
To recognize the type of rust diseases, one way to approach for recognize the rust diseases is to develop a deep learning-based image recognition process, which involves breaking down the disease [2,15] into its parts and identifying the visual features that distinguish it from other diseases or healthy plants. The recognition process involves image preprocessing, image segmentation, feature extraction, and image classification phases. The description of recognition process along with its phases has been described as:
It is an important step in image recognition tasks. It involves applying a set of techniques to improve the quality of images. Image preprocessing techniques are applied to improve the visibility of the features [16–18] in the image and to remove any unwanted noise to produce enhanced images.
Image segmentation is the process of dividing an image into multiple segments or regions of interest, and it is a common technique used in computer vision for disease detection in crops [19]. One-stage segmentation models such as YOLACT [6], RetinaNet [20], and YOLOV5 [21] can simultaneously perform both feature extraction and object detection in a single pass. These models have shown promising results in detecting wheat rust diseases in images. Two-stage segmentation models include the region extraction models and their variants such as Region-based convolutional neural networks (RCNN) Mask-RCNN [12], Fast-RCNN [16], Faster-RCNN [17], models separate feature extraction and object detection into two stages. The first stage generates region proposals, and the second stage classifies each proposal as either a disease or a nondisease infection. These models typically require more computational resources, but they can provide more accurate and fine-grained segmentation results compared to one-stage models. Hence, one-stage and two-stage segmentation techniques allow for highly automated and accurate recognition of wheat rust diseases, contributing to improved crop management and increased food security.
• Simple segmentation: It is a basic segmentation technique that divides an image into different regions based on simple features [17]. This type of segmentation is useful for computer vision object detection and tracking tasks.
• Stage-wise segmentation: In stage-wise segmentation, it finds multiple objects and separates each object into the same object class [18,19]. The recognition result shows that the large variety of object-related categories in the real scenario can be distinguished and that instances of objects belonging to the same class, which is subject to intraclass appearance variation, may describe the computing cost of the segmentation algorithm. However, it refers to efficient real-time computational expenses, such as lower memory/storage needs and reduced CPU load in seconds.
• Process of stage-wise segmentation: Instance segmentation is a two-way process. First, it takes the input as an image. After inputting an image, the region proposal network (RPN) aligns the region of interest (ROI) in an image. The second process of instance segmentation is known as the classification process. The classification and localization [20] of an image are achieved through a fully connected network layer. With the help of the softmax function, multiple classes of the image can be classified. The regression in the fully connected network (FCN) layer makes the bounding boxes of each classified class in an image. With the development of deep learning techniques, many frameworks based on instance segmentation have been developed. The process of instance segmentation in terms of classification and localization is shown in Fig. 1.

Figure 1: Process of stage-wise segmentation
This involves identifying the visual features that distinguish the disease from other parts of the image. This can include texture, color, shape, and size features. It is often necessary to extract features from segmented regions after performing image segmentation [21,22]. Feature extraction involves identifying and quantifying certain properties of the image segments that can be used for various purposes, such as object recognition and classification.
It is the process of categorizing an image into a predetermined set of classes. This involves analyzing the image and identifying its distinguishing features [23–25] such as color, texture, and shape, to determine which category it belongs to. Once these features have been extracted, they can be used as input to a machine learning model or deep learning model to perform image classification. The purpose of image classification after feature extraction is to predict the category or class of a new image based on the extracted features.
Color contrast and noise variance are the important factors that create issues in the image recognition process. Image background complexity describes the characteristics of an image. There are many aspects, such as different types of noises, and color contrast, which often resemble the area of interest itself [26,27]. Because of the presence of undesirable or random fluctuations in pixel values, this can damage image quality and generate noise variance in images. Color contrast issues are caused by a lack of diversity in color intensity, which can result in a muted appearance [28]. There is a need to handle the above-mentioned issues in a better way.
• This study designs a combined approach of region extraction and CE-SVM model to improve the classification accuracy for wheat rust disease recognition. The CE-SVM model performs a multi-class classification by classifying different types of rust diseases effectively.
• Using an augmented rust disease dataset ensures a complex feature learning which improves the rust disease differentiation.
• The study offers early identification and quick disease control strategies that increase the crop production rate.
1.5 The Major Contribution of This Study
The major contribution of this study is described as:
• The current study improves classification accuracy by recognizing wheat rust diseases through the integration of region extraction and CE-SVM models.
• The application of CE-SVM shows the machine learning flexibility for multiclass rust disease classification and helps accurate choice-making in farming environments.
• The proposed model helps minimize crop losses, optimizing resource allocation and supporting sustainable agricultural practices.
The structure of this paper is as follows: The related work has been described in Section 2. Even, the proposed method along with materials and methods details has been described in Section 3. The results of the system assessment have been represented in Section 4. Lastly, the conclusion has been narrated in Section 5.
Crop diseases greatly affect the local crop production agricultural environment. The first group of methods uses handmade features to distinguish the symbols of disease. The second group of methods uses digital imaging to diagnose diseases as well as examine diseased components from a microscopic to regional scale. In addition, estimates of the various types of crop leaf characteristics are also considered for consideration of the magnitude of the leaf damage to the plant. There have been several recent studies on recognizing wheat rust diseases using image segmentation models. These studies have used various deep-learning techniques such as YOLOV5, YOLACT, and Mask-RCNN, among others. These studies demonstrate the effectiveness of using image segmentation models for recognizing wheat rust diseases and highlight the potential of these techniques for practical applications in agriculture.
The authors [2] detected fusarium head blight wheat disease and its severity in wheat spikes have been found through the Mask-RCNN technique. With the help of the Mask-RCNN technique, a total of 77.76% detection rates have been found on wheat spikes and diseased areas of FHB, respectively.
The study [3] described a study that aimed to improve the accuracy of ear segmentation in winter wheat crops at the flowering stage. The researchers [4] used semantic segmentation, a type of deep learning, to identify and segment the ears in the images. The results showed that the semantic segmentation method improved the accuracy of ear segmentation compared to traditional methods. The improved accuracy could be useful for breeders and agronomists in monitoring crop growth and yield. The detection of FHB wheat disease in wheat spikes has been found through the Mask-RCNN technique [5]. A total of 166 images have been captured in the University of Minnesota location. The Mask-RCNN technique achieves 99.80% in 27,000 iterations for FHB disease recognition.
The severity of Northern leaf blight (NHB) disease in maize leaves has been found [6]. A total of 900 images have been used for training and validation, and 300 images have been used for testing purposes. Out of 300 test images, an NHB disease has been found in 296 images. With the help of YOLACT++, MIoU (84.91%), and recall (98.02%) for NHB disease in maize leaves have been achieved.
Even Wheat heads have been detected through the YOLOV4 model [7]. With the help of YOLOV4, a total of 94.5% accuracy has been achieved in a real-time environment. For the detection of spikes in wheat, the YOLOV5 model is used [8]. This model achieves a 94.10% average accuracy rate for spike detection in the wheat plant.
The FHB disease and its severity from wheat spikes are detected through the Mask-RCNN technique [9]. With the help of the Labelme data annotation technique, a total of 3754 wheat spike sub-images have been annotated. Throughout the experimentation, the Mask-RCNN model achieves 77.16% and 98.81% for wheat spikes and FHB disease subsequently. For wheat ears counting in a complex background, two models such as Faster-RCNN and RetinaNet models have been used [10]. Among the total images, 365 images with filling stage, and 350 mature stages for wheat ears have been used for experimentation purposes. During experimentation, the RetinaNet model (97.22%) achieves high R2 after transfer learning as compared to Faster-RCNN (87.02%). The FHB disease and its severity from wheat spikes are detected through the Mask-RCNN technique [11]. With the help of the Labelme data annotation technique, a total of 3754 wheat spike sub-images have been annotated. Throughout the experimentation, the Mask-RCNN model achieves 77.16% and 98.81% for wheat spikes and FHB disease subsequently.
The macro disease index of wheat stripe rust has been calculated through the Segformer model in the autumn stage [12]. The segmentation rate for stripe rust disease has been effectively increased with the data augmentation technique. With the help of the data augmentation technique, an F1-score (86.60%) of Segformer for wheat stripe rust at the macro disease index has been calculated.
For wheat ears counting in a complex background, two models such as Faster-RCNN and RetinaNet models have been used [17]. Among the total images, 365 images with filling stage, and 350 mature stages for wheat ears have been used for experimentation purposes. During experimentation, the RetinaNet model (97.22%) achieves high R2 after transfer learning as compared to Faster-RCNN (87.02%).
The wheat stripe rust disease is identified through UAV images [20]. With the help of the PSPNET model, a generalization vector of stripe rust disease has been calculated. Even, the PSPNET model has been compared with SVM, and the Unet model and achieves high classification accuracy (98%) than other models.
The main aim of the study [21] is to evaluate the levels of damage caused by Fusarium head blight in wheat crops using an improved YOLOV5 computer vision method. The researchers improved the YoloV5 algorithm, a popular object detection tool, to accurately identify and classify infected wheat heads in digital images. The improved YOLOV5 method was tested on a dataset of wheat head images, and results showed that it was able to accurately assess the levels of damage caused by the disease.
In the study [22], a deep learning model called Mask-RCNN to detect Wheat Mosaic Virus (WMV) in wheat images. The model was trained on a dataset of infected and healthy wheat plant images and was able to detect the virus with high accuracy. The Mask-RCNN model implementation, wheat leaves, and mosaic virus disease have been detected with 97.16% accuracy.
The authors [23] proposed a new network architecture called Automatic Tandem Dual Blendmask Networks (AT-DBMNet) to automatically diagnose the FHB severity level by analyzing images of wheat spikes. The AT-DBMNet architecture consists of two sub-networks, each of which uses a different type of attention mechanism to weigh the importance of different parts of the image. The results of the study showed that the AT-DBMNet outperformed other state-of-the-art methods in terms of accuracy and computational efficiency, demonstrating the potential of this approach for improving FHB diagnosis in wheat crops. The authors [24] collected images of wheat spikes infected with loose smut and used MRCNN to analyze the images and predict the severity of the disease. They compared the results from MRCNN with those from manual inspection and found that MRCNN had a high accuracy, with a coefficient of determination (R²) of 0.93 and a root mean squared error (RMSE) of 4.23%. The authors concluded that MRCNN is a promising method for quantifying the severity of loose smut in wheat crops, offering an efficient and accurate alternative to manual inspection. The authors [29] used an RCNN algorithm to detect and classify wheat aphids in images, which was improved with the addition of a mask-scoring module. The parallel processing allowed for real-time analysis of multiple images. The technique was tested on a dataset of wheat plant images and demonstrated high accuracy in identifying the presence of wheat aphids and their severity.
The novel wheat rust detection model consists of image acquisition, data augmentation, histogram equalization, and four region classifier models. The main aim of the wheat rust detection model is to classify the type of rust in its wheat plant with different region extraction models. The overall flow of the wheat rust detection model is shown in Fig. 2. The wheat rust model consists of six phases: data acquisition, data augmentation, image enhancement, dataset annotation, region extraction models, and a hybrid classifier for wheat rust disease classification.

Figure 2: Novel wheat rust disease detection model
This is the first step of wheat rust disease recognition. There are three types of wheat rust, namely, yellow rust, black rust, and brown rust. Yellow rust disease occurs on wheat a stripe is called stripe rust. Brown rust occurred on wheat leaves. Black rust disease is rectified on the stems of wheat leaves. The dataset was collected from Github, Kaggle, and UCI repository secondary sources [17,30–32]. The dataset details from different secondary sources are shown in Table 2.
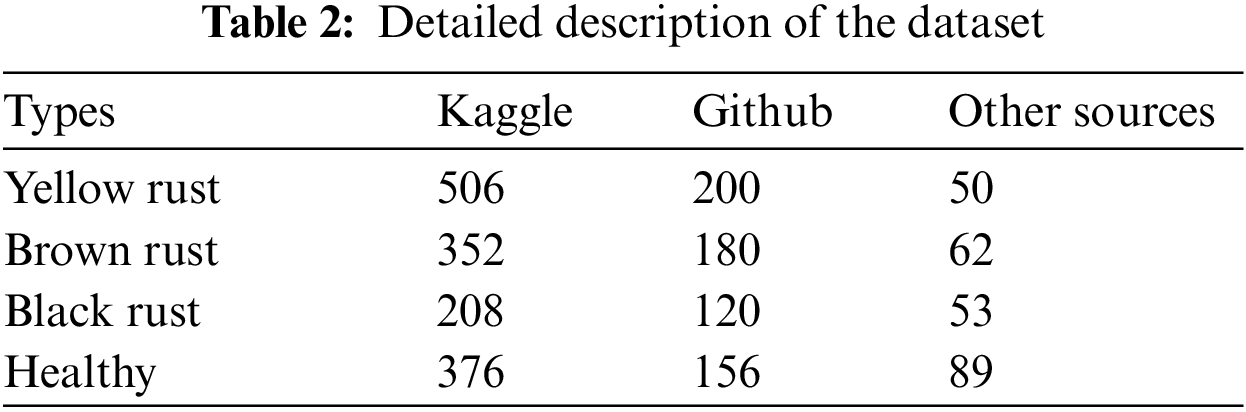
The wheat-healthy and rust disease datasets were collected from Kaggle, GitHub, and other internet sources [30,32]. With the help of secondary sources, 756 images of yellow rust, 594 images of brown rust, 381 black rust, and 621 wheat-healthy images were gathered. The samples of wheat gathered from images from secondary sources are shown in Fig. 3.

Figure 3: Samples of wheat gathered images
The quantity of data supplied during training heavily influences how accurately deep learning models make predictions [20]. The prediction accuracy is improved with a large amount of data. With the help of secondary dataset sources such as Kaggle, GitHub, and other sources, a total of 2352 nearby wheat images were gathered. The goal of data augmentation is to artificially increase the diversity of the training data, making the model more robust to variations in the input data. For example, in object detection, data augmentation can be used to add rotation, scaling, and translation to the original images, to help the model better learn to recognize objects under different conditions. A large number of datasets are directly related to improving disease prediction accuracy. The size of the dataset is increased through data augmentation techniques, which help to improve the rust disease classification accuracy. Data augmentation is the second step of preprocessing. Three main types of data augmentation techniques flipping, cropping, and rotation [33], have been implemented to increase the dataset size. The representation results of flipping, cropping, and rotation augmentation techniques are shown in Fig. 4. The flipping technique flips the image horizontally. The cropping shows the resizing effect on an image. Normally, the images have been cropped to a size of 224 * 224 pixels. The image is rotated right or left on an axis between 1° and 359° to perform rotation augmentations. The rotation degree parameter has a significant impact on the safety of rotation augmentations. First, data augmentation is carried out, and four rotation angles, 45, 135, 210, and 320, are taken into consideration. As a result of data augmentation, more than 60% of the dataset is increased along with the original data, which is more impactful for improving rust disease prediction accuracy. The limitations of rotation techniques have been described as:
• Rotating or flipping an image may result in semantic issues. If an image contains text or objects with certain orientations, for example, flipping or rotating the image may result in incorrect or impossible formations.
• Augmenting an image with rotations or flips might introduce closures or overlaps between different objects that were not there in the original. This may confuse a model during training and result in inaccurate predictions.

Figure 4: Representation results of data augmentation techniques
This is the main step of preprocessing. To improve the rust region visibility, contrast enhancement is important .The enhancement of contrast regions is improved through histogram equalization. Histogram equalization [3] improves the brightness of an image through frequency distribution. The main aim of histogram equalization is to improve the brightness of rust disease on each wheat plant part so that the disease can be easily predicted on each wheat plant part. In histogram equalization, the image is applied as input for histogram generation which is known as histogram computation. Once, the histogram [9] is generated, the local minima of the histogram is to be calculated, which is called the normalized sum minima. Based on local minima, the histogram is to be partitioned. After histogram partitioning, the grayscale levels were determined. Earlier in the process, the grayscale levels were calculated, and then histogram equalization was applied to each partition of an image formerly known as a transformation. The effective results of histogram equalization on or before the image for contrast enhancement are shown in Fig. 5.

Figure 5: Effective results of histogram equalization
As a result of data augmentation, 14,112 images were generated, which is effective for improving the training accuracy. The augmented images have been used for wheat rust disease prediction. During data augmentation, a small number of images are too blurry and noisy, which reduces the prediction accuracy. As a consequence, contrast enhancement is needed to help improve the diagnosis rate. Among the augmented images, a total of 1263 images have been discontinued from the whole augmented data due to low contrast and high blur, which makes it impossible to enhance the contrast of an image through histogram equalization. Thus, a real-time 12,849 augmented wheat disease dataset has been provoked, which has been used to identify rust diseases.
The annotation of wheat plant images was performed using the computer vision annotation tool (CVAT). The CVAT tool is used to annotate the experimental data. Therefore, the performance of each object detection model was compared by annotated mask images with the prediction results of the mask [19]. The labelled images are shown in Fig. 6.

Figure 6: Annotated wheat plant images
For better image representation, computer vision techniques namely deep learning technology, are the most accurate way to address a variety of image recognition functions, including image recognition, fine-grained recognition, object detection classification, and image acquisition, used in a variety of databases [3]. Image annotation is very helpful in the training process, but it requires millions of parameters for estimation. Object classification is performed through the CNN model. However, how many parts of the plant are recognized by rust disease is not done by the CNN model. Finding each object in an image with boundary boxes in terms of their interest and classification is done through object detection models. The object detection models are based on region proposals [7]. Instance segmentation is a combination of object detection and localization. The object detection models are based on RCNN models. Procedures for acquisition based on regional proposals, especially the RCNN series method gained a high segmentation rate in terms of their performance. The descriptions of the RCNN, Fast-RCNN, Faster-RCNN, and Mask-RCNN models are as follows.
Finding the number of regions according to their interest and locating their bounding boxes in an object is achieved through the RCNN model. The RCNN model is designed especially for detecting multiple objects in an image. The RCNN model follows a selective search algorithm. The main aim of the RCNN model is to detect multiple objects and make the boundary boxes [20] around all the objects in an image. With the help of a selective search algorithm, information about the ROI is extracted. Therefore, the ROI is presented with a rectangle. For classification of the objects that are coming under the ROI have been classified through an SVM model. The main backbone of RCNN for classifying each object in an image is achieved through the SVM model. The structure of the RCNN model in terms of classification, feature extraction, and regression is shown in Fig. 7.

Figure 7: Structure of the RCNN model
The RCNN model consists of four modules. The first module is the selective search algorithm. The selective search algorithm combines similar regions and makes the groups based on color, shape, and size. The second module is the ROI. The selective search algorithm extracts multiple regions, and the combination of all regions, namely, R1, and R2, is known as an RPN. The RPN is applied to the CNN model for feature extraction [22]. Three types of features texture, color, and shape, have been extracted by CNN. For feature extraction, CNN uses a pre-trained model such as Resnet-50. The third module consists of classification, which has been achieved through SVM. The SVM performs multiclass classification. Different classes of objects, such as C1 and C2, have been classified by CNN. The fourth module of RCNN is regression. The regression module makes the boundary of each classified object in an image in the form of a rectangle. The boundary box makes the rectangle bounding multiple classified objects in an image. With the help of selective search, Resnet-50, SVM models, and regression, the bounding of each object is made. Based on a selective search algorithm, the RCNN model covers only 2000 regions. Increasing the range of regions in the RCNN takes 47–50 s.
To solve the problems of the RCNN model, the Fast-RCNN model has been developed. The name of this model is Fast-RCNN because it detects objects faster than the RCNN model. This model is known as quick RCNN [7]. Hence, it can increase the accuracy of object detection as well as classification. In the Fast-RCNN model, the input image is given to the CNN model. Mostly, a pre-trained model VGG16 has been used as a CNN model. The pre-trained model of CNN can generate a convolutional feature map. The selective search algorithm extracts the regions from the image. Therefore, VGG16 is the heart of the Fast-RCNN model. The regions are combined to make a region of proposals. Through the ROI pooling layer, the region of proposals is resized [9]. The resized region of proposals is the input given to the fully connected (FC) layer. The FC layer consists of the two-way model. One FC layer is softmax for classification purposes. The second way of the FC layer model is to make the category-specific bounding regression box. The RCNN is slower than the Fast-RCNN because there is no need to extract the 2000 region proposals every time, and these 2000 region proposals are applied to the CNN model. However, in the Fast-RCNN model, the convolution operation is performed on one image, and the feature map is directly accomplished from the image. The structure of the Fast-RCNN model is shown in Fig. 8.

Figure 8: Structure of the Fast-RCNN model
In the Fast-RCNN model, the ROI pooling layer is known as the spatial pyramid pooling layer. The spatial pyramid layer resizes the combined region of proposals into the form of squares. The output from the ROI pooling layer is described as follows:
where Ospp is the output from the ROI pooling layer. N is the number of region proposals. The img_size is the image size in the form of height and width pixels. The bounding box has a target class U. The range of u lies between 0 and 1. If the value of U > 1, then the value of I makes bounding boxes, and then V is used. If the value of u = 0, then no bounding box has been made. The u = 0 indicates that there is a background region in pixels.
The RCNN and Fast-RCNN extract the regions from the image through a selective search algorithm. The selective search algorithm [19,20] takes considerable time to extract the regions from an image. The RCNN model uses region proposal, feature extraction, region classification, and bounding boxes of classified regions. The Fast-RCNN model uses the VGG16 model as the backbone for feature extraction and classifies object proposals. The Fast-RCNN uses the selective search algorithm for region extraction, which has a negative impact and decreases the performance of the Fast-RCNN model.
To overcome the issues of RCNN and Fast-RCNN, a Faster-RCNN model has been developed. The Faster-RCNN is the combination of RPN and Fast-RCNN. The main objective of Faster-RCNN is to detect objects in much less time than RCNN and Faster-RCNN models. The Faster-RCNN model is composed of RPN and feature extraction. The features of an image are extracted through a CNN-pretrained model. The sliding window is used as a target classless object. The main goal of RPN is to produce a set of proposals. The RPN module generates a probability of the class object as well as a label for each object. These proposals have two siblings for the FCN layer: one sibling is classification, and the other sibling is bounding box regression. These are responsible for providing a predetermined set of bounding boxes with various sizes and dimensions used for reference when the first RPN object locations are predicted. These boxes are defined to capture the scale and average class of objects. Anchor boxes usually focus on a sliding window. The RPN generates 2 K classification scores and 4 K coordinates of bounding boxes. The 2 K classification scores have been calculated in terms of the foreground and background of regions. The coordinates of regression bounding boxes are encoded into k regions of proposals.
When translating an item into the image, a recommendation followed by translation, to the same function can be used to predict a recommendation in any case due to the presence of translation fluctuations.
The design of multidimensional anchors is the key to using external features to add more time to solve scale problems. After feature extraction and bounding boxes with relevant objects found in terms of regions, filters were applied to find the top anchors. The ROI pooling layer extracts those features from the regions that correspond to new relevant objects found by RPN as a new tensor. Thus, the Faster-RCNN model classifies the object in bounding box form and its coordinates. Thus, RPN generates the number of region proposals, and Fast-RCNN recognizes the multiple objects in the regions. The structure of the Faster-RCNN model is shown in Fig. 9.

Figure 9: Structure of the Faster-RCNN model
In the Faster-RCNN model, all anchors are extracted with a size of 256 from one image. With the help of anchors, the RPN is trained. Therefore, all anchors of an image may be combined in terms of their similar features. During the combination of anchors in one image, the network may slow and take considerable time.
To overcome the issues of Faster-RCNN, a Mask-RCNN model has been developed. Mask-RCNN is the combination of RPN and classifier [22]. First, the input is an image given to the CNN pre-trained model. Generally, a pre-trained CNN model such as Resnet-50 has been used for feature mapping. With the help of a pre-trained model and binary classifier, multiple regions of interest (proposals) have been generated. The RPN can offer the object bounding boxes, and the classifier can generate the binary mask for every class. The ROI pooling network makes bounding boxes of each object and warps them into fixed-size dimensions. The wrapped features are applied to the FC layer as input [24]. The FC layer performs multiclass classification and bounding box regression of each object in an image. The warp features are embedded as a mask classifier. The mask classifier is the combination of two convolution layers for generating the binary mask of each ROI. Mask Classifier allows the network to produce a mask for each class without competing between classes. Thus, the Mask-RCNN model generates [26] three outputs. The candidate object and warp mask. The candidate object has a class label and bounding box in terms of coordinates. The Mask-RCNN localizes and classifies multiple objects in a single image. The structure of the Mask-RCNN model is shown in Fig. 10.

Figure 10: Structure of the Mask-RCNN model
During training with different iterations, the total loss of mask RCNN is described as:
where Lcls is the classification loss. Lcls and Lbox are losses generated by the RPN.
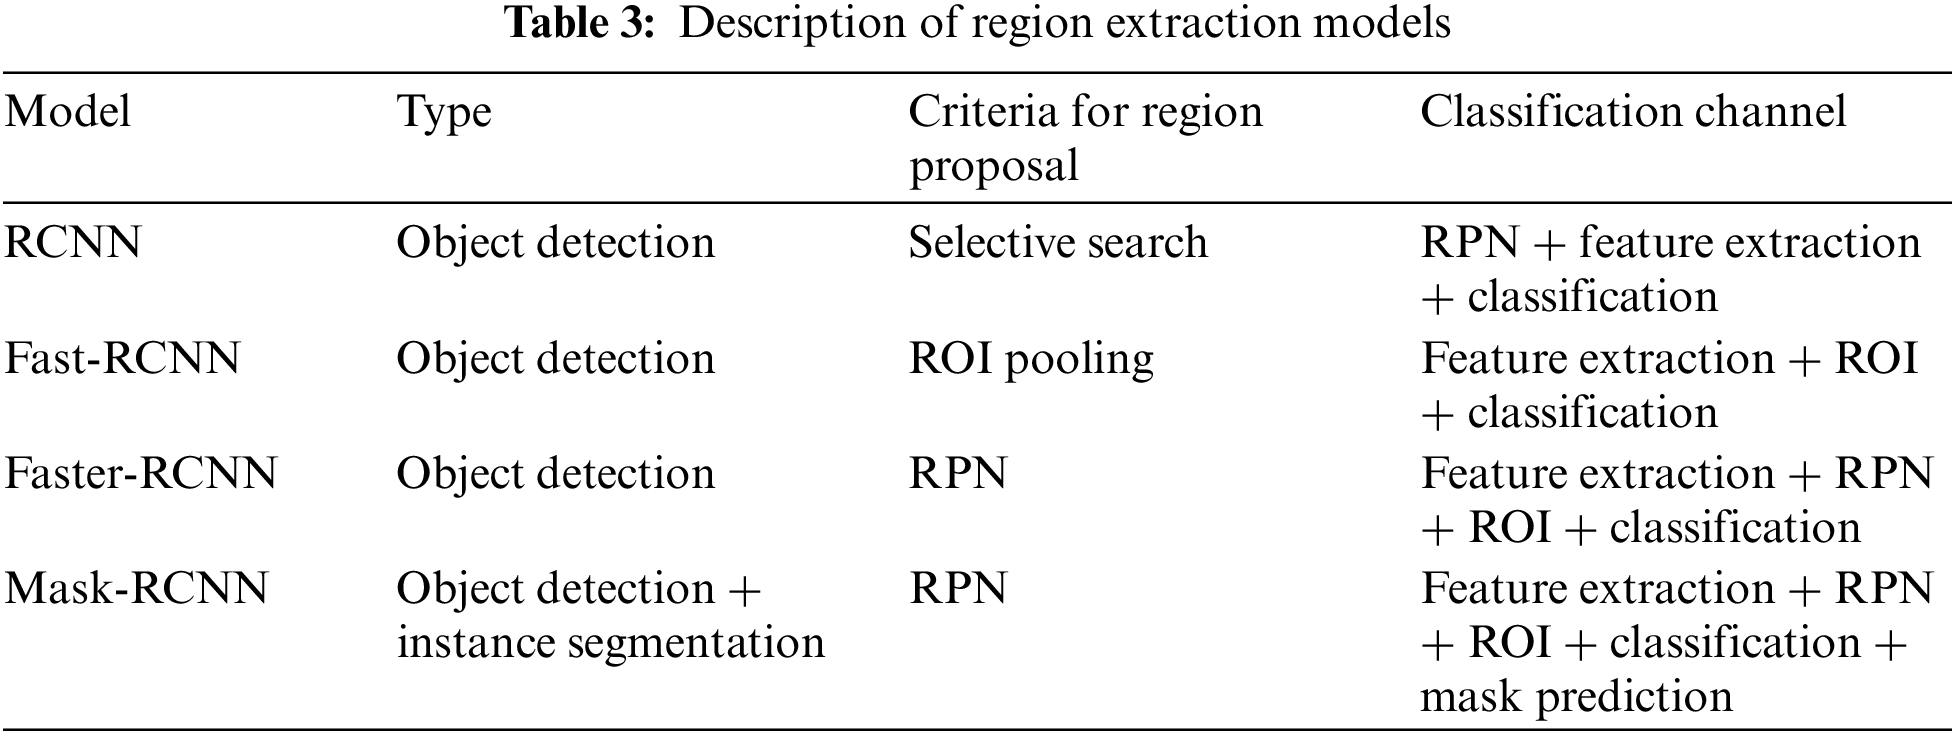
Overall, the description of region extraction models has been described in Table 3.
The hybrid classifier consists of a feature extraction and classification model. After the extraction of segmented regions through region extraction models, the disease features were extracted through the Resnet-50 pre-trained model [23]. Once, the disease features have been extracted, rust diseases can be identified by a cross-entropy support vector machine model [34]. The Resnet-50 model passes the image patches into different convolution layers for feature extraction. After rust disease feature extraction, the CE-SVM model calculates the probability of each rust disease through the probability distribution function. The probability distribution function calculates the cross-entropy vector for each rust disease. Once, the vector of each rust disease has been generated, the set of vectors has been set as input to multiclass SVM. The multiclass SVM has four split margins that have been used to characterize the type of rust disease features. The whole process of disease feature classification is known as the cross-entropy SVM (CE-SVM) algorithm. The diagrammatic representation of the hybrid classifier is shown in Fig. 11.

Figure 11: Hybrid classifier for wheat rust disease detection
In this section, the results obtained from different region extraction models, including RCNN, Fast-RCNN, Faster-RCNN, and Mask-RCNN with different pre-trained models along with their hybrid classifier are used to evaluate their performance analysis through performance parameters to answer the research questions. The research questions are as follows:
RQ1: How do the region extraction models improve the segmentation rate and localization compared with the previous state-of-the-art segmentation techniques?
RQ2: Are there any advantages of region extraction models using data augmentation techniques?
RQ3: Are there any significant changes in the performance of region extraction models along with the hybrid classifier?
RQ4: Is there any comparison between one-stage and two-stage segmentation models?
Towards the answer to each research question, RQ1 defines the segmentation rate comparison of region extraction models along with one-stage and two-stage object detection models. Even, the advantages of augmented data are helpful for region extraction in the form of patches, which is beneficial to increase the segmentation rate as well as training and testing accuracy of the classifier in RQ2. The role of a hybrid classifier with high levels of rust feature extraction and classification of features has been defined in RQ3. In RQ4, the CE-SVM defends the classification accuracy without losing any rust features.
All the region-based classifier experiments were performed on an Ubuntu server 18.04 powered DELLEMC Power Edge R840 four-way rack server with an Intel Xeon(R) Gold 5120 processor and an Nvidia Tesla P100 GPU. The region-based classifiers have been executed on PyTorch python notebook. There are many inbuilt Python libraries, such as Keras, TensorFlow, pandas, and h5py libraries that have been enumerated to run region extraction as well as hybrid classifier models. A total of 12,849 augmented images were used for training and testing purposes. Among the augmented images, a total of 1500 images were randomly selected for data annotation purposes.
This phase is incorporated with region extraction models and hybrid classifier parameters, which is beneficial for estimating the desired output according to the given input in the form of an image. The parameter details of each model have been defined as follows.
4.2.1 A Framework of Region Extraction Models
For the identification and location of each object in a single image, four types of region extraction models RCNN, Fast-RCNN, Faster-RCNN, and Mask-RCNN were used in this study. Based on considerations of each object detection model, the RCNN model uses image size in terms of their height and width dimensions. During training, the RCNN model uses the selective search algorithm for region proposals with learning rate, epochs, and batch size. The Fast-RCNN model uses a selective search algorithm for region proposals and bounding box threshold values, and iterations in terms of epochs for recognition. The Faster-RCNN model uses the RGB image with fixed dimensions (224 * 224) and uses the VGG16 model for feature extraction. For bounding boxes of each object in an image, the Faster-RCNN model uses Intersection over Union (IoU) with a value (0.6). The VGG16 model has 32 filters from the middle layer to the last layer. After applying Faster-RCNN to an image, different images were recognized with pooling output size in [7 * 7] dimensions. Additionally, the Mask-RCNN model uses Resnet-50 for feature maps and takes 2 images per GPU. During iterations, the Mask RCNN model generates RPN and mask loss. Several types of pre-trained network parameters such as image size, epochs, and batch size, have been used in each object detection model as shown in Fig. 12.

Figure 12: Refined pre-trained network parameters of region extraction models
4.2.2 Hybrid Classifier Framework
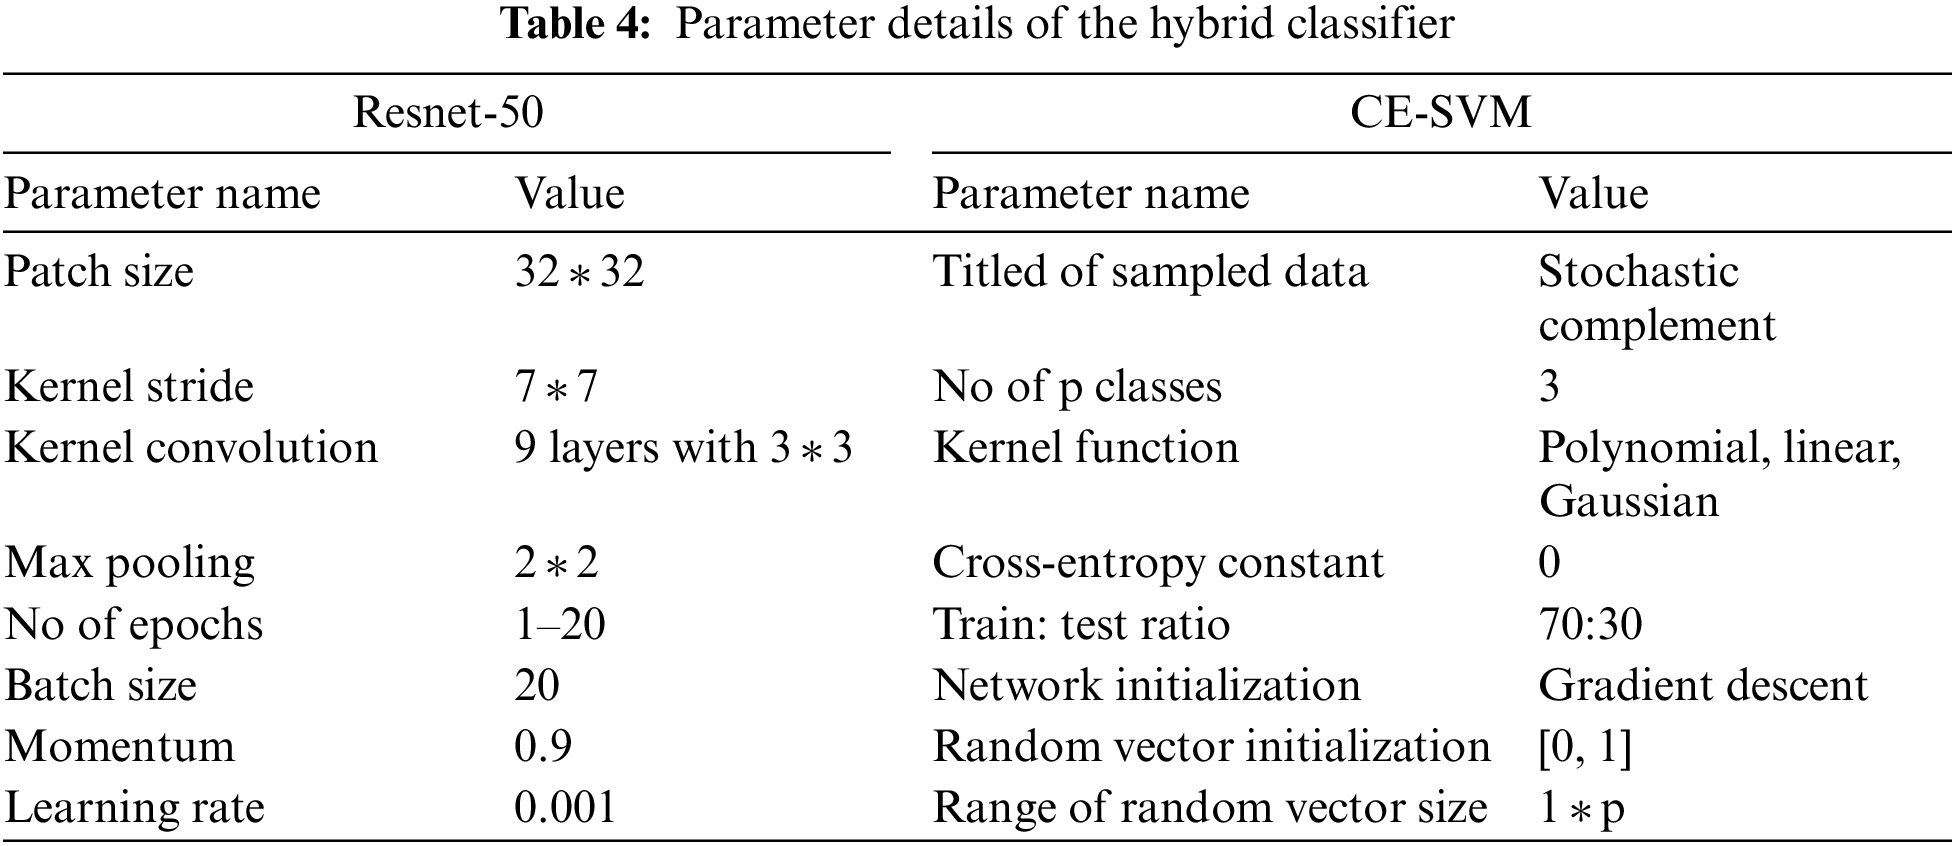
The hybrid classifier is a combined phase consisting of feature extraction as well as the CE-SVM model. The Resnet-50 model is used as the backbone of feature extraction, and the CE-SVM model is employed to classify rust disease features. The parameter details of the hybrid classifier are shown in Table 4.
The main aim of region extraction models is to define the wheat rust disease part along with their bounding box in an effective manner. To analyze the performance of region extraction models and hybrid classifiers, four research questions have been planned. The analysis of each research question is defined in its result-oriented form, which is interpreted as follows.
4.3.1 RQ1: Segmentation Rate and Localization
Region extraction models, such as RCNNs, can improve the segmentation rate and localization compared to previous state-of-the-art segmentation techniques for wheat rust disease recognition by incorporating domain-specific knowledge into the model. In the context of recognizing wheat rust diseases, region extraction models can be trained on annotated images of wheat plants, with the regions of interest (ROIs) being defined as the regions of the plants that contain rust. The model then learns to recognize the characteristic patterns [12]. Two-stage segmentation models such as Mask-RCNN, RCNN, Faster-RCNN, and Fast RCNN have been compared with YOLACT++, YOLOV5, SSRNET, RetinaNet, and R-FCN for wheat rust disease identification in terms of segmentation rate and localization. The segmentation rate and localization of two-stage segmentation models such as RCNN, Fast RCNN, Faster-RCNN, and Mask-RCNN, as well as one-stage models such as YOLACT++, YOLOV5, SSRNET, RetinaNet, and R-FCN for wheat rust disease identification, can vary depending on several factors, including the size and complexity of the dataset [12], the quality of annotations, and the specific architecture and training procedures used for each model.
In general, two-stage segmentation models tend to achieve higher segmentation rates and more accurate localizations compared to one-stage models, as they incorporate additional context from the image and refine the localization of objects. In training two-stage segmentation models, several 1500 labeled images were considered ground truth images for training purposes. The segmentation, as well as localization rate, was determined with the local bounding box in terms of wheat rust objects in an image. With a momentum of 0.9, 50 epochs was the maximum number of iterations for the model’s parameters. The weight decay was set to 0.0001, and the learning rate was set to 0.001, which is better suited for small batches with quick convergence. When an IoU had a ground-truth box greater than 0.5, an ROI was considered positive; otherwise, it was considered negative. Positives outnumbered negatives 1:1. Three ratios, 0.5, 1, and 2, were covered by the RPN anchor. We decided to run the mini-batch with two images per GPU to extract the wheat rust patches.
The segmentation rate and the localization of each rust object in different wheat images along with a different number of epochs are shown in Figs. 13 and 14, respectively. The number of epochs is directly proportional to the localization and segmentation rate improvement. The number of epochs shows that the localization and segmentation rates of the two-stage segmentation models are higher than those of the one-stage segmentation models. Among the two-stage segmentation models, Mask-RCNN has a high number of segmentations (0.97) and localization rates (0.69) with a high number of epochs for wheat rust disease object localization.

Figure 13: Segmentation rate of one-stage and two-stage segmentation models

Figure 14: Localization rate of one-stage and two-stage segmentation models
4.3.2 RQ2: Improving the Generalization of Region Extraction Models
There are several advantages of using region extraction models with data augmentation techniques for wheat rust disease detection:
• Improved Accuracy: Data augmentation techniques such as rotation, cropping, flipping, etc., can help increase the diversity of the training dataset [10,11], which can improve the accuracy of the region extraction model.
• Reduced Overfitting: Overfitting is a common problem in deep learning models. By using data augmentation techniques [12,23], the model can be trained on a larger and more diverse dataset, which can reduce overfitting.
• Robustness to Variations: Data augmentation can also help increase the robustness of the model to variations in the input data, such as different lighting conditions, and angles.
• Better Generalization: By training the model on a larger and more diverse dataset, it can generalize better to unseen data [24,25] resulting in improved performance on new images.
Overall, data augmentation techniques can significantly improve the performance of region extraction models for wheat rust disease detection.
4.3.3 RQ3: Performance Evaluation
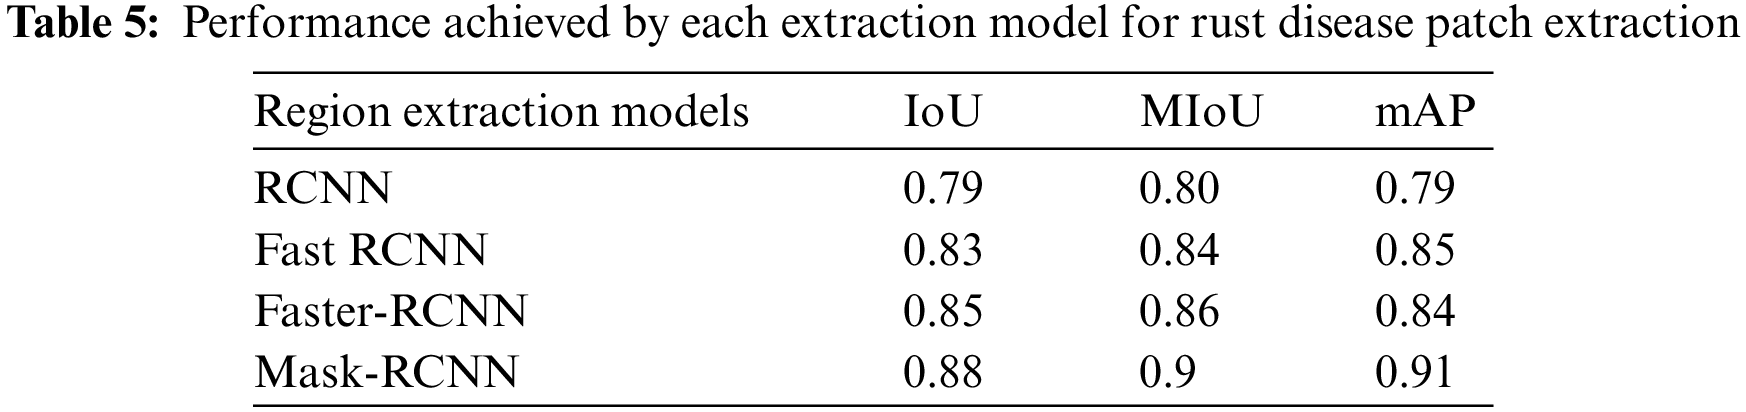
Object rust has been found in the wheat stem, stripe, and leaf parts. Once, the patches have been extracted, the classification of rust disease is easily determined by the hybrid classifier. The performance of region extraction models has been measured through mean IoU, and mean average precision (mAP) has been easily estimated with ground truth and predicted image [21]. The labeled image has been considered a ground truth image. The effective estimation of extracted patches through different region extraction models corresponding to ground truth images is shown in Fig. 15.

Figure 15: Patches extraction by RCNN, fast RCNN, Faster-RCNN, and Mask-RCNN models
The performance of each rust disease extracted patch was measured with ground truth and predicted sub-image, which was evaluated through IoU, mean IoU (MIoU) and mean average precision (mAP) parameters. A detailed description of the performance achieved by each region extraction model is shown in Table 5. In region extraction models, a total of 63,485 different patches of wheat rust diseases have been extracted, which have been useful in extracting the dynamicity of rust disease features.
At each stage of patch extraction, a total of 63,485 rust diseases were used as input to the feature extraction module. The extracted patches have a size of 32 * 32 pixels along with their bounding box location. The Resnet-50 model is used for feature extraction. The extracted features have been helpful for classification purposes. Based on the region extraction model outcome of the extracted patch, the contour of the combined image was extracted. To create the feature vector for rust infections features such as contour area, perimeter, roundness, and Hu invariant moment were extracted through the Resnet-50 feature extraction model. As a result, our work, with the help of trained model feature extraction, shares the same attributes as the trained model and initializes the network using those features. The intended result was accomplished by the trained model. Transfer learning can minimize computing load [2], hasten network convergence, and address the underfitting issue brought on by insufficient tag training data. In this study, a substantial portion of our dataset was used to fine-tune the trained model following the properties of the component image. The extracted features have been used for classification purposes in the CE-SVM classifier. The CE-SVM acts as a multiclassifier that classifies [34] the three types of wheat rust diseases on stem, stripe, and leaf plant parts. The multiclass classifier was trained based on input feature vectors. The CE-SVM was trained according to a different category, and the truly defined category of each rust disease feature vector was set to 0, if no rust disease feature vector was identified, it was set to 0. The iteration of CE-SVM is set to 100, and the polynomial, linear, and Gaussian functions have been trained to measure the accuracy of training the CE-SVM classifier.
In the hybrid classifier, a ratio of 70:30 patches was used for training and testing purposes. Recall that the ratio of true positive occurrences to the total of true positives and false negatives was represented. The proportion of true positive instances to all positive instances was indicated by precision. Precision and recall were combined to create the F1-score. The percentage of correctly anticipated labels was the accuracy. The performance of three different CE-SVM kernel functions for wheat rust disease classification is shown in Table 6.
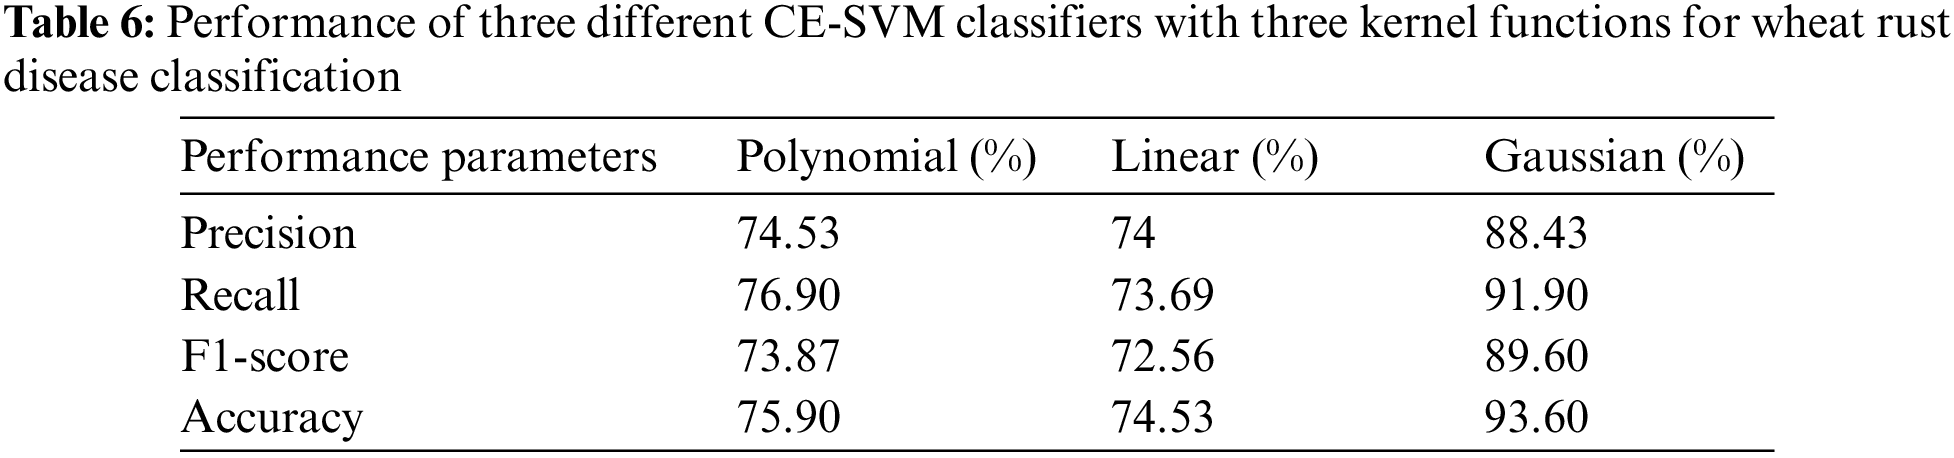
The performance analysis of CE-SVM for different wheat rust disease classifications, along with the different number of feature vector samples was measured with stem, stripe, and leaf rust diseases. Among the three different kernel functions in CE-SVM, the Gaussian function has high precision, recall, F1-score, and accuracy compared to linear and polynomial kernel functions. The higher accuracy achieved by the Gaussian function is 93.60%, which is more sufficient for wheat rust disease classification. Even, if the proposed model has been tested on different datasets such as CGIAR [23,24], and wheat leaf dataset [25] to measure the generalization. During the testing of the proposed model, the CGIAR dataset (83.67%) outperforms the wheat leaf dataset (79.87%) for wheat rust disease classification.
4.3.4 RQ4: Comparison of Two-Stage Segmentation with One-Stage Segmentation Models for Wheat Rust Disease Classification with a Hybrid Classifier
The main factors to compare two-stage segmentation models with one-stage segmentation models along with their cross-entropy support vector machine classifier are as follows:
• Speed: Two-stage models are faster than one-stage models because they do not require multiple forward passes through the network [8,10].
• Accuracy: One-stage models tend to have better accuracy because they have a more complex pipeline, but this comes at the cost of slower speed [11,22].
• Memory: Two-stage models tend to use less memory as they have fewer layers, but again, this may come at the cost of lower accuracy [12,24].
• Flexibility: Two-stage models can be more flexible because they can incorporate different loss functions, such as cross-entropy and support vector machine, which can improve accuracy [34].
• Model size: Two-stage models are typically smaller than one-stage models, which make them easier to deploy in resource-constrained environments [35].
It is important to note that the trade-off between speed, accuracy, memory, flexibility, and model size will depend on the specific use case to classify wheat rust diseases.
4.4 Comparison of the Proposed Method with the Previous State-of-the-Art Approaches
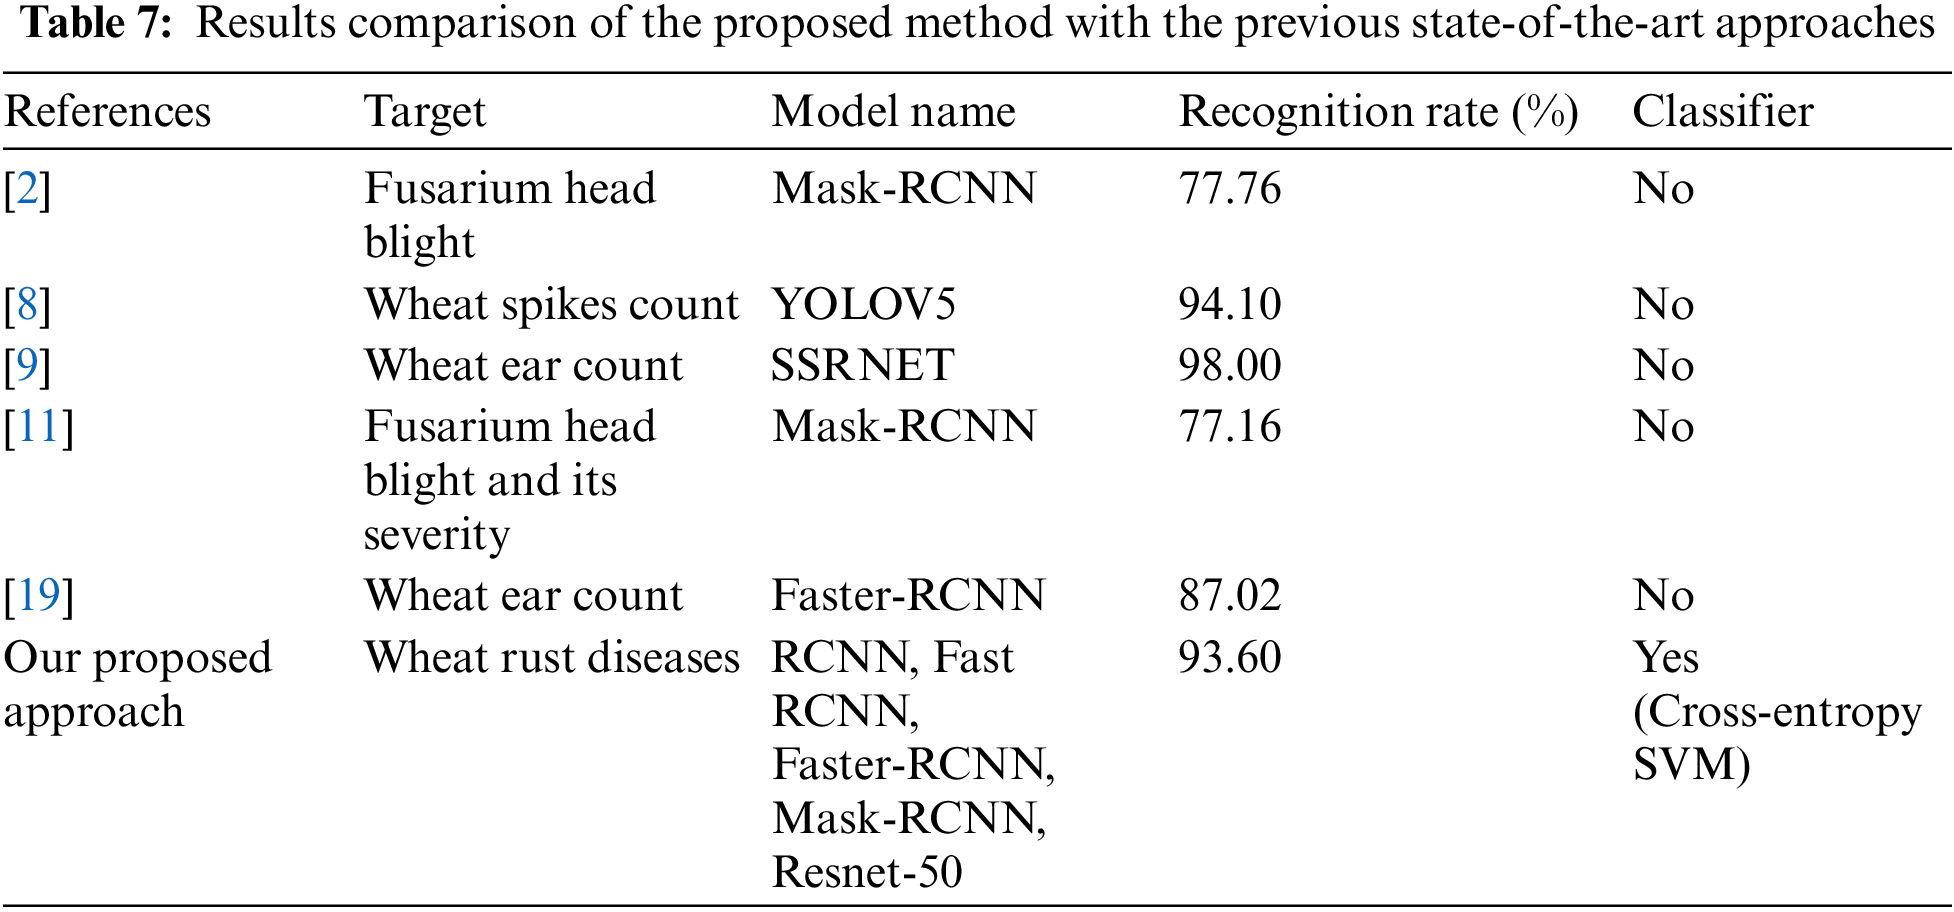
In this section, region extraction models such as RCNN, Fast RCNN, Faster-RCNN, and Mask-RCNN along with the hybrid classifier are compared with previous state-of-the-art approaches. For example: the fusarium head blight is detected through the Mask-RCNN model [2]. With the help of the Mask-RCNN technique, a total of 77.76% detection rates have been found on wheat spikes and diseased areas of FHB, respectively. A single-stage segmentation model YOLOV5 has been used to count the number of wheat spikes in wheat plants. Once, the wheat spikes have been counted, the classification is not performed by the authors [8,9,11,12]. Hence, the classification is performed by the proposed approach to validate the results of the classifier. A detailed comparison is shown in Table 7.
Wheat rust diseases caused by fungal pathogens pose a substantial threat to global wheat production and food security. Early detection and accurate prediction of these diseases can minimize yield quality losses. In this paper, four different region extraction models RCNN, Fast RCNN, Faster-RCNN, and Mask-RCNN, along with the CE-SVM model have been employed to classify the three types of wheat rust diseases. First, a total of 2352 wheat rust and wheat healthy plant images were gathered from secondary sources. Second, three basic data augmentation techniques flipping, cropping, and rotation, have been applied to the secondary source dataset to improve the training speed as well as the classification accuracy. Throughout the usage of data augmentation techniques, a total number of 12,849 augmented images have been used for patch extraction in region extraction models. The patches have been extracted through data annotation in the training phase of the region extraction model. The annotated patches are considered ground truth, and extracted patches are considered predicted patches, which is helpful for IoU calculation. Several types of invariant, hue, and area features have been extracted in informed patches due to ResNet-50 pre-trained models. The CE-SVM method complements the RCNN models by providing a robust classification framework. Among all types of kernel functions, the Gaussian function in the cross-entropy SVM model achieves high classification accuracy (93.60%) for wheat stripe rust disease. In the future, the RCNN models will be fine-tuned to yield results comparable to the kernel functions, supporting that superior segmentation results provide increased classification accuracy. Object detection or segmentation models can successfully extract feature information from images specifically disease-affected regions. The method is strongly reliant on precise disease area localization. Incorrect region extraction might have a negative impact on categorization outcomes. By focusing on key image regions, using region extraction models in conjunction with CE-SVM for wheat rust disease classification has the potential to improve accuracy and interpretability. Even, the proposed combined approach can assist farmers and agronomists in making informed decisions, such as optimizing fungicide application or implementing resistant cultivars to effectively mitigate the impact of wheat rust diseases. Efficient wheat rust disease classification using a hybrid region extraction model and CE-SVM method includes timely disease detection, improved crop management, enhanced decision-making, resource optimization, disease monitoring and surveillance.
Acknowledgement: The author would like to thank the support of Chitkara University.
Funding Statement: The authors received no specific funding for this study.
Author Contributions: Conceptualization, D.K and V.K., A.D., B.G.; methodology, D.K., V.K., A.D., B.G.; software, V.K, A.D., B.G., T.T.; formal analysis, D.K., V.K., A.D., T.T.; data correction, V.K., B.G., T.T.; writing–original draft preparation, D.K, V.K., A.D., B.G., T.T.; writing–review and editing, D.K., V.K., B.G., T.T.; supervision, V.K, A.D., B.G., T.T.
Availability of Data and Materials: There is no associated data with this article.
Conflicts of Interest: The authors declare that they have no conflicts of interest to report regarding the present study.
References
1. H. R. Bukhari, M. Rafia, S. Inayat, U. Shafi, I. U. Haq et al., “Assessing the impact of segmentation on wheat stripe rust disease classification using computer vision and deep learning,” IEEE Access, vol. 9, pp. 164986–165004, 2021. [Google Scholar]
2. W. H. Su, J. Zhang, C. Yang, R. Page, T. Szinyei et al., “Automatic evaluation of wheat resistance to fusarium head blight using dual Mask-RCNN deep learning frameworks in computer vision,” Remote Sensing, vol. 13, no. 1, pp. 1–20, 2020. [Google Scholar]
3. J. Ma, Y. Li, H. Liu, K. Du, F. Zheng et al., “Improving segmentation accuracy for ears of winter wheat at flowering stage by semantic segmentation,” Computer and Electronics in Agriculture, vol. 176, pp. 105662–105674, 2020. [Google Scholar]
4. A. singla and N. bali, “Deep learning based wheat crop yield prediction model in Punjab region of North India,” Applied Artificial Intelligence, vol. 35, no. 15, pp. 1304–1328, 2021. [Google Scholar]
5. W. H. Su, J. Zhang, C. Yang, R. Page, T. Szinyei et al., “Evaluation of Mask-RCNN for learning to detect fusarium head blight in wheat images,” in ASABE 2020 Annual Int. Meeting, Minnesota, USA, pp. 1–3, 2020. [Google Scholar]
6. M. Huang, G. Xu, J. Li and J. Huang, “A method for segmenting disease lesions of maize leaves in real time using attention YOLACT++,” Agriculture, vol. 11, no. 12, pp. 1216–1234, 2021. [Google Scholar]
7. B. Gong, D. Ergu, Y. Cai and B. Ma, “Real-time detection for wheat head applying deep neural network,” Sensors, vol. 21, no. 1, pp. 1–13, 2021. [Google Scholar]
8. J. Zhao, X. Zhang, J. Yan, X. Qiu, X. Yao et al., “A wheat spike detection method in UAV images based on improved YOLOv5,” Remote Sensing, vol. 13, no. 16, pp. 3095–3111, 2021. [Google Scholar]
9. D. Wang, D. Zhang, G. Yang, B. Xu, Y. Luo et al., “SSRNet: In-field counting wheat ears using multi-stage convolutional neural network,” IEEE Transactions on Geosciences and Remote Sensing, vol. 60, pp. 1–11, 2021. [Google Scholar]
10. A. Singla and N. Bali, “Emerging trends in machine learning to predict crop yield and study its influential factors: A survey,” Archives of Computational Methods in Engineering, vol. 29, pp. 95–112, 2022. [Google Scholar]
11. L. Huang, H. Zhang, W. Huang, Y. Dong, Y. Huichun et al., “Identification of fusarium head blight in wheat ears using vertical angle-based reflectance spectroscopy,” Arabian Journal of Geosciences, vol. 14, no. 6, pp. 1–14, 2021. [Google Scholar]
12. J. Deng, X. Lv, L. Yang, B. Zhao, C. Zhou et al., “Assessing macro disease index of wheat stripe rust based on segformer with complex background in the field,” Sensors, vol. 22, no. 15, pp. 5676–5691, 2022. [Google Scholar] [PubMed]
13. Z. Zhang, F. Paulo, F. Andrew, L. Zhaohui, C. Lgathinathane et al., “Enhancing wheat disease diagnosis in a greenhouse using image deep features and parallel feature fusion,” Frontiers in Plant Science, vol. 13, pp. 328–342, 2022. [Google Scholar]
14. J. Deng, H. Zhou, X. Lv, L. Yang, J. Shang et al., “Applying convolutional neural networks for detecting wheat stripe rust transmission centers under complex field conditions using RGB-based high spatial resolution images from UAVs,” Computer and Electronics in Agriculture, vol. 200, pp. 107211–107224, 2022. [Google Scholar]
15. E. Ennadifi, S. Laraba, D. Vincke, B. Mercatoris and B. Gosselin, “Wheat diseases classification and localization using convolutional neural networks and gradcam visualization,” in Int. Conf. on Intelligent Systems and Computer Vision (ISCV), Fez, Morocco, pp. 1–5, 2020. [Google Scholar]
16. D. Zhang, D. Wang, C. Gu, N. Jin, H. Zhao et al., “Using neural network to identify the severity of wheat fusarium head blight in the field environment,” Remote Sensing, vol. 11, no. 20, pp. 2375–2392, 2019. [Google Scholar]
17. Z. Yao, Y. Lei and D. He, “Early visual detection of wheat stripe rust using visible/near-infrared hyperspectral imaging,” Sensors, vol. 19, no. 4, pp. 952–968, 2019. [Google Scholar] [PubMed]
18. D. Zhang, Z. Wang, N. Jin, C. Gu, V. Chen et al., “Evaluation of efficacy of fungicides for control of wheat fusarium head blight based on digital imaging,” IEEE Access, vol. 8, pp. 109876–109890, 2020. [Google Scholar]
19. J. Li, C. Li, S. Fei, C. Ma, W. Chen et al., “Wheat ear recognition based on retinanet and transfer learning,” Sensors, vol. 21, no. 14, pp. 4845–4866, 2021. [Google Scholar] [PubMed]
20. Q. Pan, M. Gao, P. Wu, J. Yan and S. Li, “A deep-learning-based approach for wheat yellow rust disease recognition from unmanned aerial vehicle images,” Sensors, vol. 21, no. 19, pp. 1–17, 2021. [Google Scholar]
21. D. Y. Zhang, H. S. Luo, D. Y. Wang, X. G. Zhou, W. F. Li et al., “Assessment of the levels of damage caused by fusarium head blight in wheat using an improved Yolov5 method,” Computer and Electronics in Agriculture, vol. 198, pp. 107086–107102, 2022. [Google Scholar]
22. D. Kumar and V. Kukreja, “Image-based wheat mosaic virus detection with Mask-RCNN model,” in Int. Conf. on Decision Aid Sciences and Applications, Chiangrai, Thailand, pp. 178–182, 2022. [Google Scholar]
23. Y. Gao, H. Wang, M. Li and W. H. Su, “Automatic tandem dual BlendMask networks for severity assessment of wheat fusarium head blight,” Agriculture, vol. 12, no. 9, pp. 1493–1511, 2022. [Google Scholar]
24. V. Kukreja and D. Kumar, “Quantifying the severity of loose smut in wheat using MRCNN,” in Int. Conf. on Decision Aid Sciences and Applications, Chiangrai, Thailand, pp. 630–634, 2022. [Google Scholar]
25. W. H. Su, J. Zhang, C. Yang, R. Page, T. Szinyei et al., “Automatic evaluation of wheat resistance to fusarium head blight using dual Mask-RCNN deep learning frameworks in computer vision,” Remote Sensing, vol. 13, no. 1, pp. 26–42, 2021. [Google Scholar]
26. V. G. Krishnan, M. V. V. Saradhi, G. Dhanalakshmi and C. S. Somu, “Design of M3FCM based convolutional neural network for prediction of wheat disease,” International Journal of Intelligent Systems and Applications in Engineering, vol. 11, no. 2, pp. 203–210, 2023. [Google Scholar]
27. H. Wang, Q. Jiang, Z. Sun, S. Cao and H. Wang, “Identification of stripe rust and leaf rust on different wheat varieties based on image processing technology,” Agronomy, vol. 13, no. 1, pp. 260–299, 2023. [Google Scholar]
28. S. T. Pouria, N. Virlet, E. M. Ampe, P. Reyns and M. J. Hawkesford, “DeepCount: In-field automatic quantification of wheat spikes using simple linear iterative clustering and deep convolutional neural networks,” Frontiers in Plant Science, vol. 10, pp. 1176–1192, 2019. [Google Scholar]
29. V. Kukreja, D. Kumar, A. Bansal and V. Solanki, “Recognizing wheat aphid disease using a novel parallel real-time technique based on mask scoring RCNN,” in 2nd Int. Conf. on Advance Computing and Innovative Technologies in Engineering, Greater Noida, India, pp. 1372–1377, 2022. [Google Scholar]
30. O. Getch, “Wheat Leaf dataset,” Kaggle, 2021. [Online]. Available: https://www.kaggle.com/datasets/olyadgetch/wheat-leaf-dataset [Google Scholar]
31. S. Hussain, “Computer Vision for Crop Disease,” Kaggle, 2020. [Online]. Available: https://www.kaggle.com/shadabhussain/cgiar-computer-vision-for-crop-disease [Google Scholar]
32. S. Hussain, “CGIAR Computer Vision for Crop Disease,” Kaggle, 2021. [Online]. Available: https://www.kaggle.com/shadabhussain/cgiar-computer-vision-for-crop-disease [Google Scholar]
33. W. Haider, A. U. Rehman, N. M. Durrani and S. U. Rehman, “A generic approach for wheat disease classification and verification using expert opinion for knowledge-based decisions,” IEEE Access, vol. 9, pp. 31104–31129, 2021. [Google Scholar]
34. P. Siricharoen, B. Scotney, P. Morrow and G. Parr, “Effects of different mixtures of features, colours and svm kernels on wheat disease classification,” in 16th Irish Machine Vision and Image Processing Conf., Ulster, pp. 43–48, 2014. [Google Scholar]
35. C. Gao, Z. Gong, X. Ji, M. Dang, Q. He et al., “Estimation of fusarium head blight severity based on transfer learning,” Agronomy, vol. 12, no. 8, pp. 1876, 2022. [Google Scholar]
Cite This Article
 Copyright © 2023 The Author(s). Published by Tech Science Press.
This work is licensed under a Creative Commons Attribution 4.0 International License , which permits unrestricted use, distribution, and reproduction in any medium, provided the original work is properly cited.
 Downloads
 Citation Tools