
 Submit a Paper
 Propose a Special lssue
 Open Access
ARTICLE

A Fully Adaptive Active Queue Management Method for Congestion Prevention at the Router Buffer
1 Faculty of Computer Studies, Arab Open University, Riyadh, 11681, Saudi Arabia
2 Faculty of Information Technology, Al-Ahliyya Amman University, Amman, 19111, Jordan
* Corresponding Author: Ahmad Adel Abu-Shareha. Email:
Computers, Materials & Continua 2023, 77(2), 1679-1698. https://doi.org/10.32604/cmc.2023.043545
Received 05 July 2023; Accepted 18 September 2023; Issue published 29 November 2023
 View Full Text
 Download PDF
Abstract
Active queue management (AQM) methods manage the queued packets at the router buffer, prevent buffer congestion, and stabilize the network performance. The bursty nature of the traffic passing by the network routers and the slake behavior of the existing AQM methods leads to unnecessary packet dropping. This paper proposes a fully adaptive active queue management (AAQM) method to maintain stable network performance, avoid congestion and packet loss, and eliminate unnecessary packet dropping. The proposed AAQM method is based on load and queue length indicators and uses an adaptive mechanism to adjust the dropping probability based on the buffer status. The proposed AAQM method adapts to single and multiclass traffic models. Extensive simulation results over two types of traffic showed that the proposed method achieved the best results compared to the existing methods, including Random Early Detection (RED), BLUE, Effective RED (ERED), Fuzzy RED (FRED), Fuzzy Gentle RED (FGRED), and Fuzzy BLUE (FBLUE). The proposed and compared methods achieved similar results with low or moderate traffic load. However, under high traffic load, the proposed AAQM method achieved the best rate of zero loss, similar to BLUE, compared to 0.01 for RED, 0.27 for ERED, 0.04 for FRED, 0.12 for FGRED, and 0.44 for FBLUE. For throughput, the proposed AAQM method achieved the highest rate of 0.54, surpassing the BLUE method’s throughput of 0.43. For delay, the proposed AAQM method achieved the second-best delay of 28.51, while the BLUE method achieved the best delay of 13.18; however, the BLUE results are insufficient because of the low throughput. Consequently, the proposed AAQM method outperformed the compared methods with its superior throughput and acceptable delay.Keywords
Over the computer networks, transmitted data packets are maintained inside a buffer space within the network routers when transferred between the intermediate nodes from the sources to the destinations. Accommodating these packets in the router buffer, with the differences in arrival and departure rates, and the bursty nature of the traffic generated over the Internet, may result in potential congestion. Active Queue Management (AQM) methods manage the router buffer and avoid congestion, as illustrated in Fig. 1. As indicated by the name, AQM methods use an active approach to avoid congestion at an early stage. Yet, predicting network behavior is not trivial, and as a result, these methods commonly suffer from high dropping rates, packet loss, or increasing end-to-end delay [1].

Figure 1: AQM utilization within the computer networks
Various AQM methods have been proposed to predict the networks’ behavior using one or more congestion indicators. Based on the predicted network status, a dropping probability (Dp) is calculated, which is then used for stochastic packet dropping to avoid congestion and prevent the global synchronization problem. However, packet dropping in low traffic reduces the network performance and increases delay and network load. Balancing between these requirements has been addressed using various AQM mechanisms, including the adaptive calculation of the Dp [2].
The adaptive mechanism for Dp calculation depends on increasing and decreasing the Dp value based on the predicted network status. As such, when the utilized indicators refer to increased traffic load or queuing delay inside the router, the Dp value increases, and vice versa. The value is adaptively increased or decreased to avoid unnecessary dropping as the router undergoes a falsely congested status with short bursty traffic, thus maintaining high network performance. Adaptive Dp is calculated using a mathematical equation involving the old Dp value, the indicators’ values, and other constants used to normalize the calculated output. These indicators and the calculation mechanism form the core of the AQM method. Different methods use different indicators and employ different calculation mechanisms. BLUE is a well-known AQM that depends on adaptively calculating the Dp value [3].
BLUE [2] utilizes a counter to monitor the number of packets currently queued in the router buffer, referred to as the queue length, as a congestion indicator, as illustrated in Fig. 2. Additionally, according to [2], BLUE also considers packet loss as an indicator of the queue length. Dp is increased when the queue length exceeds a certain threshold or in the presence of packet loss (in the latter case, packet loss occurs when the queue length exceeds a threshold equal to the length of the queue itself). Conversely, Dp is decreased when the queue is idle or, by other means, when the length is equal to zero. Accordingly, the BLUE method used a mechanism of two cases formulated using IF-THEN. The first case is for increasing Dp, and the other is for decreasing it [4]. There is a case left open in which none of the previous cases occurs; in such a case, Dp remains unchanged [5].

Figure 2: Flowchart of the BLUE method
Besides the previously calculated Dp and the instance queue length, the BLUE method uses three constants to normalize the Dp value: the freeze time, which represents the waiting period between two consecutive Dp modifications, the increase rate, and the decrease rate. While BLUE demonstrates good performance in terms of delay and packet loss, the limitations of the BLUE method arise in high dropping rates, which result from the harsh threshold utilized for packet dropping and the slow response in load reduction [6,7]. As such, after a bursty traffic status, which is associated with a high Dp value, high load reduction will be attended with a slow reduction in Dp value. Besides, with a high Dp value corresponding to the high load traffic, the number of accumulating packets within the router buffer is reduced significantly, which requires reducing Dp significantly to avoid unnecessary dropping. A low decreasing rate characterizes the slow reduction of Dp in BLUE. While a high reduction rate might seem like a potential solution, it could introduce instability in the algorithm dealing with the bursting nature of the traffic [8].
Similar adaptive AQM methods, such as the adaptive fuzzy controller [9] and fuzzy proportional integral [10], depend on responding to the network statuses using different cases isolated by some fixed parameters, such as the threshold utilized in the BLUE method. Yet, adaptiveness is implemented to eliminate the need to impose fixed values, and these fixed parameters significantly affect the method’s adaptiveness. A fully adaptive method is proposed in this paper to overcome the limitation of the AQM methods in which the fixed thresholds are replaced with dynamic variables. This paper proposes a fully adaptive AQM method regarding the predicted network traffic load. The proposed method maintains the arrival and departure rate and the queue length and estimates Dp based on the traffic load to avoid early packet loss. This paper aims to develop a fully adaptive AQM method that utilizes maintained buffer utilization and traffic load statistics.
The drop-tail approach was utilized as a reactive method for queue management based on the length of queued packets, referred to as the instance queue length. When the instance queue length reached a specific threshold, the drop-tail approach reacted by dropping all the packets beyond the determined threshold. Using a high threshold value for drop-tail leads to packet loss, while using a low value can result in unnecessary packet dropping [11]. Consequently, this reactive mechanism affects the network performance as a whole. Accordingly, the proactive RED [12] method was proposed as the first AQM method to overcome the drop-tail limitations. RED predicts congestion using the average queue length indicator. As the average length increases, Dp increases, and vice versa. RED uses a non-adaptive fixed threshold as a reference for comparing the average queue length. Although RED is generally considered a non-adaptive method, it exhibits some adaptiveness due to using the average queue length that is adaptively changed based on the queue length. The Proportional Integral (PI) controller [13], which is among the most utilized AQM methods, extends RED by incorporating delay as a congestion indicator. The experiments proved that RED and PI outperformed the drop-tail but still suffer from unnecessary packet dropping and packet loss [8].
Several AQM methods were proposed to improve the network’s performance using different techniques. CHOose and Kill for unresponsive flows (CHOKe) method [14] was developed based on the Exponentially Weighted Moving Average (EWMA) for calculating the average queue length and enabling connection-specific dropping for fair resource allocation. Extended CHOKe (XCHOKe) [15] extends CHOKe [14] by prior identification of malicious sources. Multiple Average-Multiple Threshold (MAMT) [16] extended RED by implementing different dropping techniques for different traffic types, as each requires different qualities, such as low delay, low loss, or maximum utilization. Dynamic Queue RED (DQRED) [17] and Probability RED (PRED) [18] use various queues, each for a different traffic type, to achieve high quality of service (QoS). Predictive Hebb AQM (PHAQM) [19] was developed based on model predictive control (MPC) and optimized using Hebb learning rules from the neural network control theory with a delay indicator.
The New Version of Adaptive RED (NVARED) [20] was developed to achieve performance goals related to packet loss and dropping, depending on the queue length and the number of active flows. Novel RED (NRED) [21] uses the number of active flows and queue length for Dp calculation. Queued RED (QueuedRED) [22] uses the average queue length, and the rate of queue length changes. The Robust Active Queue (RaQ) [23] was developed based on the average queue length and the estimated load. Effective RED (ERED) [24] extended RED using the average and the instance queue lengths. Variable Structure Control (VSC) [25] uses the queue length, and the estimated queue length error in TCP connections. Novel Proportional and Differential RED (NPD) [26] uses the queue length and its changes as congestion indicators for managing the wireless networks where the available resources are less than the wired networks. Adaptive Queue Management with Random Dropping (AQMRD) [27] uses the average and instance queue lengths for buffer management. The stability of RED (S-RED) [28] reduces the loss by using a quadratic function to make its variability smoother compared to RED [29].
An early adaptive method was the Adaptive RED (ARED) [30], which utilizes adaptive tuning of the parameters used with the RED method using a target variable. The introduced target variable is adaptively modified based on the load at the router buffer. Similarly, Dynamic RED (DRED) [31] enabled self-adaptation of the threshold value. If high traffic is detected, the threshold is increased to reduce the sensitivity of the algorithm to short-term false congestion. On the other hand, if the traffic is relatively low, the threshold is decreased, making the algorithm more responsive to changes in congestion levels. A novel adaptive approach was presented in BLUE [32], which uses the previously calculated dropping probability with the queue length to calculate a new probability adaptively. GREEN [33] relied on fair allocation, similar to Stabilized RED (SRED) [34], and round-trip time for each connection, side by side with the number of active flows, link capacity, and segment size to estimate Dp. GREEN increases and decreases Dp adaptively, similar to BLUE [32], based on the utilized indicators. Intelligent QoS-Aware AQM (IQA) [35] uses an optimization function to determine the dropping rate based on the length of the queued packets. IQA was proposed to optimize the QoS in the 5G Mobile Network. Dynamic RED (DyRED) [36] uses a dynamic value for the maximum threshold used in RED. Accordingly, calculating Dp is adaptively modified based on the length of the queued packets. Thus, DyRED reduces the packet loss and improves the throughput. The adaptive neuro-fuzzy inference system (ANFIS) [37] adaptively calculates the values of the PID parameters using genetic algorithms (GAs) and particle swarm optimization (PSO) [38].
Adaptive Threshold RED (ATRED) [39] and Cloud-based Random Early Detection (CRED) [40] adaptively calculate certain parameters instead of using fixed values, reducing the sensitivity of parameter initialization. Adaptive AQMRD (AAQMRD) [41] calculates RED’s parameters adaptively to reduce loss. Length Threshold RED (LTRED) [42] adaptively calculates the average queue length depending on the buffer’s status. Weighted Queue Dynamic Active Queue Management (WQDAQM) [43] extends RED, introducing a queue weight to calculate the average queue length and dynamically adjusting the thresholds based on the traffic load. Beta Distribution Drop Functions (BetaRED) [44] extend RED using a novel queue averaging calculation. The recently proposed AC-RED (Average Queue Length Change Rate-RED) method [45] extends RED by incorporating the dynamically calculated average queue length change rate. A dynamic approach for calculating the average queue length, as proved by [46], utilizes exponential calculation and leads to improved results compared to the linear function used in RED. Similarly, the exponential packet-dropping mechanism in Aggressive RED (AgRED) [47] improved the results of RED, as proved in [48]. Modified RED (MD-RED) uses an adaptive selection of the dropping function based on the traffic load. A Linear dropping is utilized when the traffic load is light or moderate. Conversely, exponential dropping function is used when a high traffic load is encountered [49].
In summary, AQM methods were proposed to minimize the loss and dropping rate [50]. Existing AQM methods can be classified into non-adaptive and adaptive categories. The non-adaptive methods extend RED to reduce delay or loss and improve the dropping rate while making minimal modifications to RED. However, these methods exhibit performance issues under bursty traffic conditions. The adaptive methods stabilize the AQM performance by enabling self-adaptation based on traffic or queue status [8]. The problem with these methods is using equal increasing and decreasing rates, leading to a slow response in sudden network load changes. A survey of the existing AQM methods was presented in [51]. Accordingly, to overcome this problem, adaptiveness should be built based on the status of the load at the router buffer.
The adaptive active queue management (AAQM) method avoids congestion and improves network performance. The AAQM monitors the load at the router using a congestion indicator that estimates congestion based on the queue length and the traffic load. This indicator is used for monitoring the buffer status and making dropping decisions by calculating the Dp value. To ensure the adaptiveness of the proposed method, the previously calculated Dp is used to calculate the new value with a modification rate.
In computer networks, the traffic load and the queue length factors affect the congestion status at the router and the network performance as a whole. These factors are assessed by parameters and used to calculate the unified indicator for the proposed AAQM. Two factors affect the traffic load factor; these are 1) arrival rate and 2) departure rate at the router buffer. While other parameters affect the queue length, these are 1) instance queue length (IQL) and 2) the buffer capacity. These parameters are maintained and updated with every change in the buffer status (i.e., arrival and departure events). Using these parameters ensures that the queue management method closely monitors the buffer status, responds immediately to any congestion or near congestion status, and avoids performance falls at the whole network.
The traffic load factor is represented by a parameter called queue length alteration (QLA), calculated based on the previously mentioned factors: the arrival and departure rates, as given in Eq. (1). The value range of QLA is [−1, 1], where −1 represents the occurrences of packet departure only, while the value of 1 indicates the occurrence of packet arrival only. The value of 0 indicates equal departure and arrival rates, and values in between indicate a greater number of departure packets than arrival for negative values and vice versa for positive values.
To capture the status of the traffic load over time, avoid false indications of low or high traffic, and thus avoid wrong decisions in queue management, the proposed method is designed to use the average queue alteration instead of the instance alteration. The queue length alteration is calculated as the average values at the new and old time slots, called the average queue length alteration (AQLA). The AQLA is calculated as the weighted sum of the new QLA and the previously calculated value in the previous time slot, as given in Eq. (2). Similar to the QLA, the value range of the AQLA is [−1, 1].
The queue length factor is represented by the estimated queue length (EQL) parameter, which is calculated based on the IQL and the value of the AQLA, as given in Eq. (3). The EQL value is then normalized by the buffer capacity to produce an output in the range of [−1–1]. Besides, EQL used AQLA are utilized to determine the queue length at a time range.
Finally, the congestion indicator (Ci) is calculated as the sum of the EQL and normalized IQL as given in Eq. (4), where this calculation yields a value in the range of [0–1], where zero indicates no congestion and 1 indicates severe congestion.
3.2 Adaptive-Based Active Queue Management (AAQM)
The proposed AAQM components are illustrated in Fig. 3. AAQM calculates the value of the Dp at each packet arrival event based on the value of Ci. The queuing model represents the environment in which the AAQM is implemented. The packet arrival event is the trigger to calculate Dp, as queue management depends on making decisions for the newly arrived packets. Accordingly, when there is no packet arrived at the router, packet dropping is never implemented as the status of the queue length will be either maintained in case no packet departure occurs or the length will be decreased when departure occurs. Besides the Ci, three parameters are used and initialized before running the AAQM on the router buffer: the modification rate and two thresholds.

Figure 3: The components of the proposed AAQM
The modification rate is used to adjust the Dp incrementally or decrementally based on the value of the Ci. Two thresholds are used to create different indications for the buffer status, similar to RED. Accordingly, these thresholds deceptively divide the buffer into three regions, as illustrated in Fig. 4. The IQL is compared with the thresholds to determine the current region of the buffer among three categories: low traffic region, medium traffic region, and high traffic region.
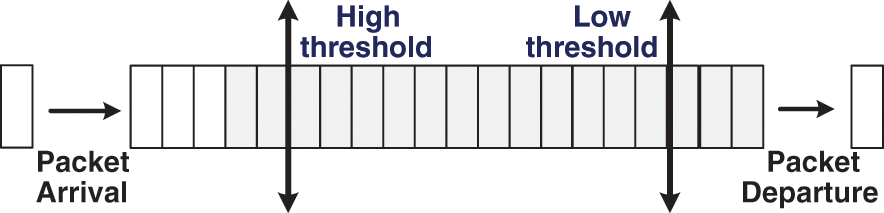
Figure 4: Illustration of buffer regions based on the thresholds
The proposed technique stochastically implements four dropping/no dropping actions based on the buffer status: 1) When the IQL is below or equal to the low threshold, no action is taken, and the dropping probability is set to zero. In this status, the router is considered to be in a non-congestion state, and the proposed method avoids packet dropping to maintain high network performance. 2) When the IQL is between the low and high thresholds, and the congestion indicator is greater than 0.5. Dp is increased based on the modification rate multiplied by the value of the congestion indicator. The dropping rate is increased systematically to reduce the queue length and eliminate any possible congestion. 3) When the IQL is between the two thresholds, and the congestion indicator is less than 0.5. Dp is decreased based on the modification rate multiplied by the value of the congestion indicator. In this case, the dropping rate is decreased systematically as the queue is still in a moderate length state. 4) When the IQL is greater than or equal to the high threshold, the dropping probability is set to one. This case presents severe, or possible, congestion, and dropping should be high to maintain high network performance. The AAQM is given in Algorithm 1.
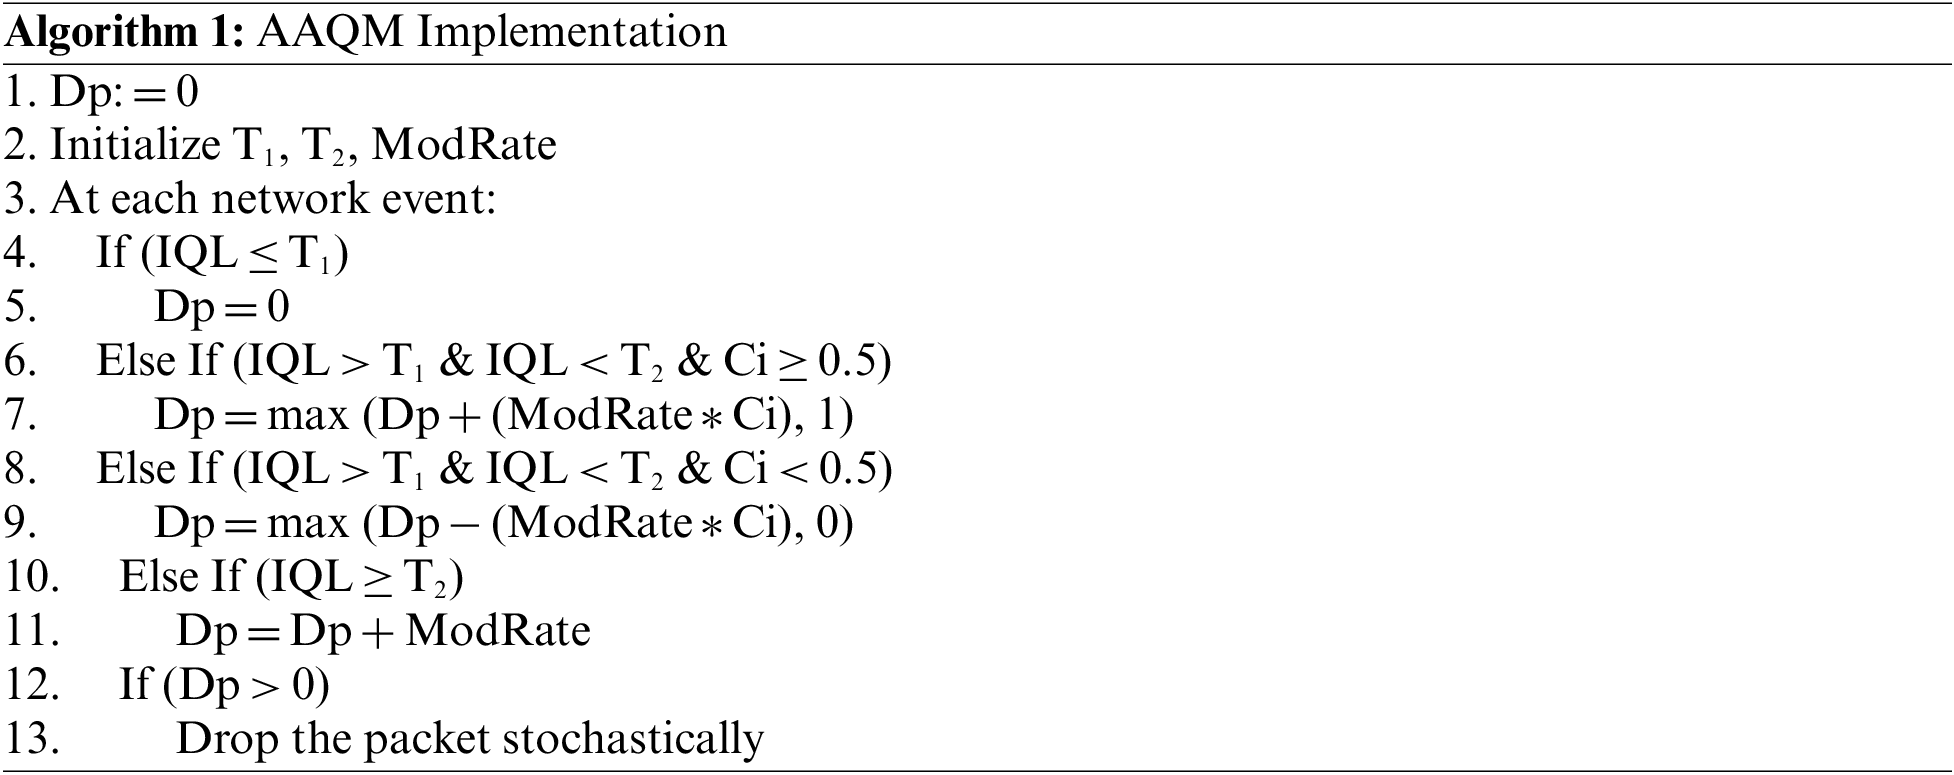
In Algorithm 1, lines 1 and 2 set the values for the parameters utilized in the proposed AAQM. The modification rate and the threshold values are estimated empirically. The initial value of Dp is initialized to 0 value. The four scenarios for calculating Dp are given in lines 4–11. The first scenario in lines 4–5 represents the 0-dropping scenario. The second scenario is given in lines 6–7, in which the value of Dp is calculated based on the Ci and the previously calculated Dp adaptively. The third scenario is given in lines 8–9; the max and min functions are used to maintain the probability value for Dp in the range of [0–1]. The fourth scenario is given in lines 10–11. In lines 12–13, packet dropping is implemented stochastically based on the value of Dp.
For the queuing models, a single traffic class and multiclass traffic based on the Markov model with two classes are developed based on a discrete-time queue model. In the discrete-time queue model, the environment consists of unequal time slots; in each slot, an event of packet arrival or departure or both occurs. The departure occurs before the arrival, and stochastic processes are used to model both arrival and departure. The difference between the single and multiclass models lies in the arrival processes only. In the single-class model, the arrival process is represented by the Bernoulli distribution, while in the multiclass, the Markov model represents the arrival process. In the first case, the arrival rate is controlled by one state, and its probability value can be adjusted to create congestion and non-congested scenarios. In the second case, the arrival process is controlled by two states in a Markov model with different probabilities, as illustrated in Fig. 5.

Figure 5: Markov model of the arrival process
The arrival process in the Markov model is represented by the initial and transition matrices in Eq. (5), in which the initial probabilities are represented by α, and the transition probabilities between states are denoted by λ.
The proposed and compared methods are evaluated using simulation for the following reasons: 1) Simulation allows for implementing a discrete-time queue model, providing a controlled and well-defined environment to study the behavior and performance of the proposed AQM method and the compared methods and enabling the calculation of the measures accurately. 2) Simulation overcomes the resource constraints, facing the development of the AQM methods and facilitating extensive testing and analysis. 3) Isolate the effects of the AQM method under study from other factors, such as the transmission protocol and network topology. This isolation ensures that the evaluation focuses solely on the performance of the AQM method itself, enabling a clear measure of its effectiveness.
The simulation uses Java programming language with Apache NetBeans Integrated Development Environment (IDE) 11.2. The simulated network comprises a single router with a small buffer capacity of 20 packets, represented as first-in-first-out (FIFO). Packets arrived at the utilized router with an arrival probability of α in a single-state modeling process. In contrast, in the two-state model, the arrival probabilities are represented by α1 and α2. The values of these parameters and the rest are listed in Table 1 [52].
3.5 The Scalability of the Proposed Method
The simulation uses variable packet arrival and departure rates from 0.3 up to 0.95, with two models providing expensive network traffic scenarios and generalizable results. AQM methods that operate well in highly congested environments can handle less congested states. Utilizing a small buffer size also allows generalization of the results, as small buffers congested faster than large ones. As the buffer size or the number of routers increases, the congested router experiences less significant impacts than the simulated single router with a small buffer environment.
Unlike the existing AQM methods, the proposed method adaptively updates the value of the Dp and utilizes all traffic and router evidence. The non-adaptive methods, including CHOKe [14], XCHOKe [15], MAMT [16], DQRED [17], PRED [18], NVARED [20], NRED [21], QueuedRED [22], RaQ [23], Effective RED (ERED) [24], VSC [25] NPD [26], AQMRD [27], and S-RED [28] rely on non-adaptive queue length information, which may influence the stability and performance of temporary traffic changes. The PHAQM [19] method solely utilizes delay as an indicator in non-adaptive mechanism. On the other hand, the adaptive methods, including ARED [30], DRED [31], BLUE [32], GREEN [33], SRED [34], ATRED [39], CRED [40], AAQMRD [41], LTRED [42], WQDAQM [43], BetaRED [44] AC-RED [45], and AgRED [47] do not consider queue and traffic statuses explicitly, instead, focusing on adaptively calculating or estimating certain parameters to stabilize the performance while mitigating high packet dropping in high congested networks.
The results are evaluated using delay, loss, throughput, and overall processing time. The delay is measured as the packets’ average waiting time (in time slots) within the router buffer. Loss, dropping, and throughput are proportional to the packets transmitted to the router. The experiments are formed into four categories: single-class modulation, heavy load with single-class modulation, two-class modulation, and heavy traffic load with two-class modulation.
4.1 Results of Single-Class Modulation
In the first experimental set, the arrival process is modeled as the Bernoulli process with a departure rate of 0.5 and 14 arrival rates of {0.3, 0.35, 0.4,…, 0.95}. These rates correspond to no congestion states when the arrival rate is below 0.5, medium congestion when the value is around 0.5, and high congestion with higher arrival rates. The results based on loss, dropping, throughput, delay, and overall processing time are illustrated in Figs. 6–10.

Figure 6: Packet loss-based comparison at a departure rate of 0.5

Figure 7: Packet dropping-based comparison at a departure rate of 0.5
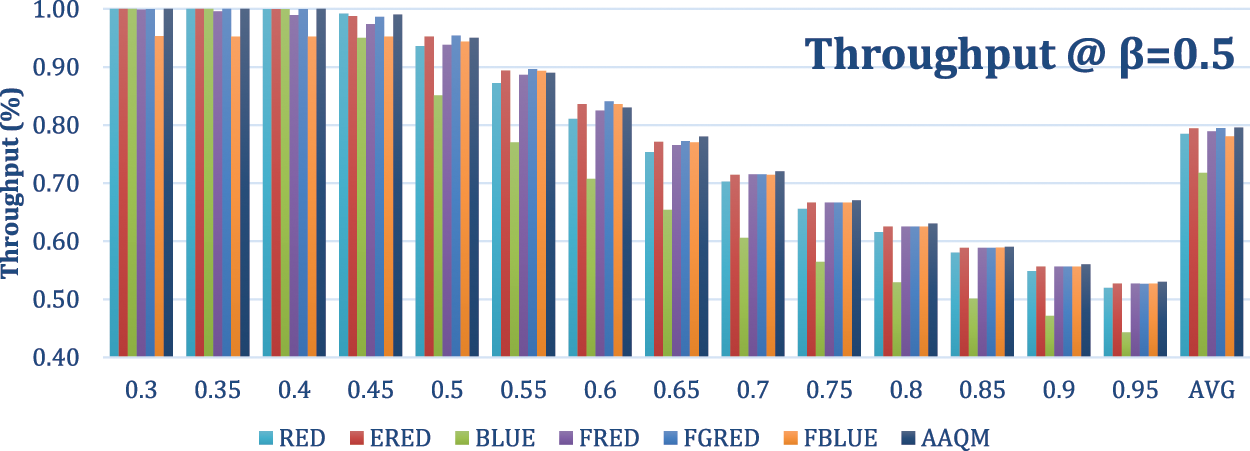
Figure 8: Throughput-based comparison at a departure rate of 0.5

Figure 9: Delay-based comparison at a departure rate of 0.5

Figure 10: Overall time-based comparison at a departure rate of 0.5
For the packet loss, as illustrated in Fig. 6, the proposed AAQM method achieved the best results with zero loss on average, similar to BLUE and FRED. The reported average loss for RED was 0.01, ERED was 0.06, FGRED was 0.01, and FBLUE reported a high loss of 0.18 on average. All the compared methods had zero loss at low traffic with an arrival rate below 0.5. The loss at a high arrival rate of 0.95 was zero for the proposed method, BLUE and FRED. The reported loss for RED at such a high arrival rate was 0.01, ERED was 0.21, FGRED was 0.03, and FBLUE was 0.45.
As for the dropping rate, as illustrated in Fig. 7, ERED achieved the best results with an average of 0.15; however, this result cannot be considered without referring back to the loss, which reported a high loss of the ERED method. The proposed AAQM method achieved an average dropping rate of 0.2, similar to FGRED. The results of the rest of the methods were as follows: RED and FRED were 0.21, BLUE was 0.28, and FBLUE was 0.04. To provide a comprehensive view of dropping and loss collectively, the packet loss results, as illustrated in Fig. 6, should be correlated with Fig. 8, which illustrates the throughput of the compared methods. This correlation will offer a more thorough understanding of how each method’s drop rate and packet loss contribute to their overall performance, thus validating that the proposed method’s dropping rate, though higher than some methods, is the most effective rate for avoiding loss.
As for the throughput, as illustrated in Fig. 7, the proposed AAQM method achieved the best throughput of 0.80. The BLUE method achieved 0.72, and FRED achieved 0.79. As mentioned, AAQM, BLUE, and FRED methods achieved the best loss (zero-loss). The AAQM exclusively achieved the best throughput, which indicates that the proposed method outperformed the rest of the methods, maintaining an optimal balance between loss and dropping. The results of the rest of the methods were as follows: RED and FBLUE achieved a throughput of 0.78, which indicates acceptable performance for the RED method with a low dropping rate (0.01), while the throughput for FBLUE resulted from a higher dropping rate (0.18). ERED, FRED, and FGRED also achieved a throughput of 0.79, which indicates good performance, especially in the FGRED, which reported a low packet loss (0.01).
As illustrated in Fig. 9, BLUE achieved the best delay, which resulted from the high dropping and low throughput, influencing the delay measure. The AAQM and FRED achieved the second-best results, with 13.29 and 13.42, respectively. FRED has shown good performance for delay, throughput, and loss. However, AAQM outperformed the FRED in terms of these measures. The results of the rest of the methods were as follows: RED was 14.76, ERED 21.96, FGRED 20.54, and FBLUE 26.42.
In terms of the overall processing time, as illustrated in Fig. 10, the proposed AAQM and BLUE achieved the shortest processing time using simple operations, reducing resource consumption. In contrast, the fuzz-based methods, FRED, FGRED, and FBLUE, required a longer process time, given their dependency on complex fuzzy inference processes. Overall, the results demonstrate that the implemented adaptive method effectively reacts to increasing and decreasing traffic, ensuring optimal dropping rates that outperformed the compared methods.
4.2 Results of Heavy Traffic Load with Single-Class Modulation
In the second experimental set, the arrival process is modeled as the Bernoulli process with a departure rate of 0.3 and varying arrival rates. The results based on loss, dropping, throughput, delay, and overall processing time are illustrated in Figs. 11–15.

Figure 11: Packet loss-based comparison at a departure rate of 0.3

Figure 12: Packet dropping-based comparison at a departure rate of 0.3
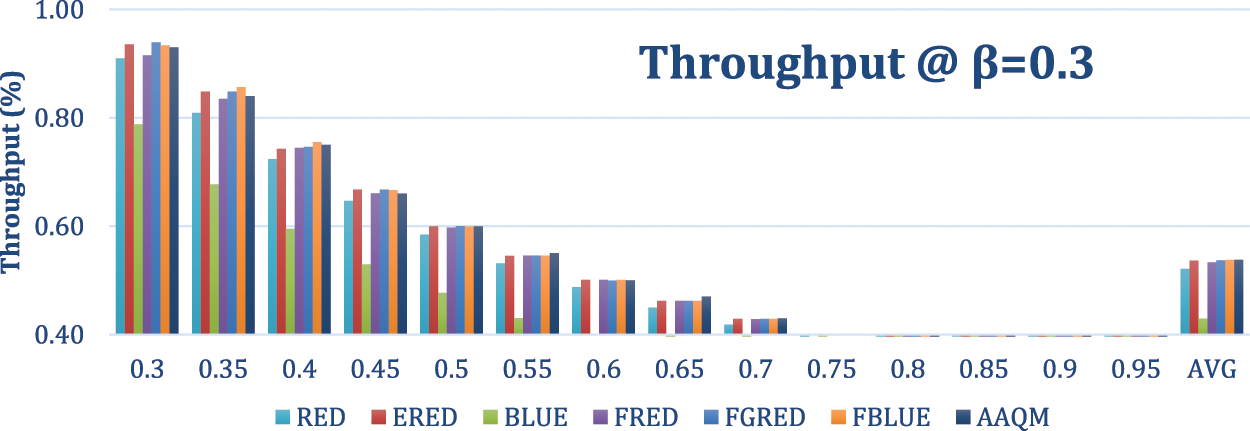
Figure 13: Throughput-based comparison at a departure rate of 0.3
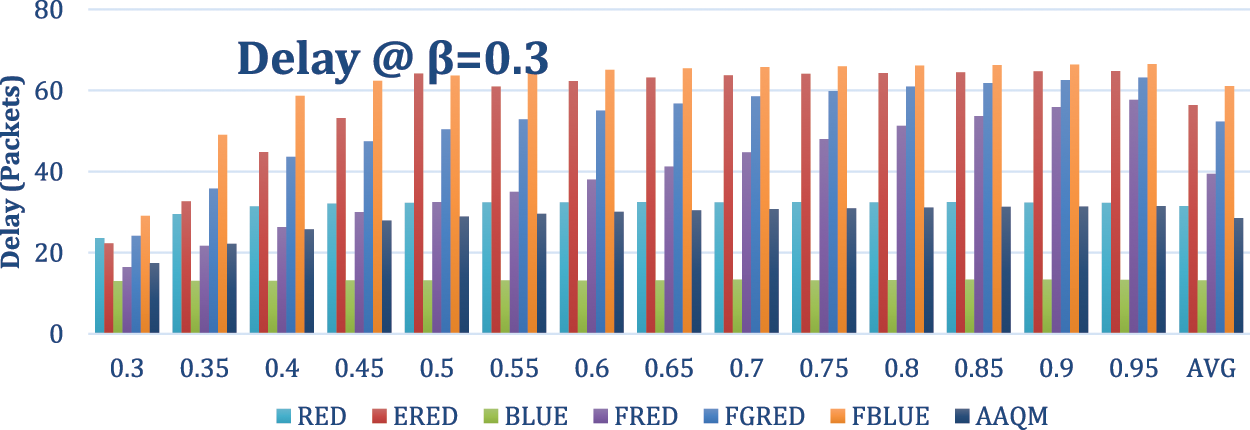
Figure 14: Delay-based comparison at a departure rate of 0.3
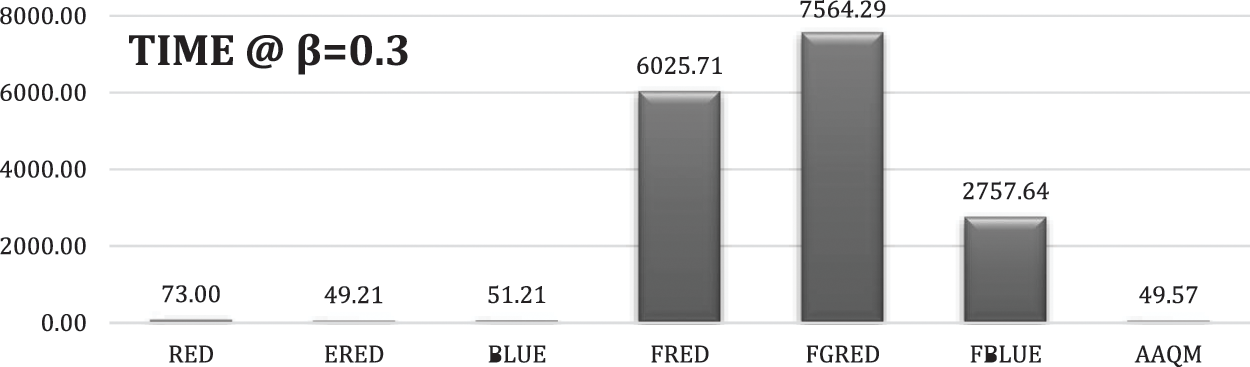
Figure 15: Overall time-based comparison at a departure rate of 0.3
For the packet loss, as illustrated in Fig. 11, the proposed AAQM method achieved the best results with zero loss on average, similar to BLUE. FRED, which achieved zero loss with a 0.5 departure rate (as given in Fig. 6), experienced packet loss when the traffic load increased. The reported average loss values were as follows: RED-0.01, ERED-0.27, FGRED-0.12, and FBLUE-a higher loss of 0.44. At a high arrival rate of 0.95, the proposed method and BLUE exhibited zero loss. The loss values at an arrival rate of 0.95 were: RED-0.01, ERED-0.43, FRED-0.15, FGRED-0.32, and FBLUE-0.67.
As illustrated in Fig. 12, the proposed AAQM and RED achieved an average dropping rate of 0.46. The best dropping rate was reported for FBLUE, with an average of 0.03. However, despite FBLUE’s low dropping rate, it resulted in a surprisingly high loss (0.44). On the other hand, the proposed method’s average dropping rate of 0.46, though higher than some methods, proved to be the most effective rate for avoiding loss. The average dropping rate values of the rest of the methods were as follows: ERED-0.20, BLUE-0.57, FRED-0.43, and FGRED-0.34.
As illustrated in Fig. 13, the proposed AAQM method achieved the best throughput of 0.54, similar to ERED, FGRED, and FBLUE. The average throughput values of the other methods were as follows: RED-0.52, BLUE-0.43, and FRED-0.53. While the AAQM, ERED, FGRED, and FBLUE achieved the best throughput, the AAQM exclusively achieved the best loss. Accordingly, under higher traffic loads, the proposed AAQM exhibited superior performance with the best throughput and loss.
Regarding the delay, as illustrated in Fig. 14, BLUE achieved the best delay of 13.18. The AAQM achieved the second-best results with 28.51. The average delay values of the other methods were as follows: RED-31.47, FRED-39.46, FGRED-52.35, ERED-56.41, and FBLUE-61.08.
Regarding the overall time, as illustrated in Fig. 15, the proposed AAQM and ERED achieved the best processing time, while the fuzz-based methods (FRED, FGRED, and FBLUE) were the worst.
4.3 Results of Two-Class Modulation
In this experiment, the Markov process is used as the arrival process with a departure rate of 0.5 and arrival rate of {0.3, 0.35, 0.4, …, 0.95} for the first and 0.5 for the second states. The results are illustrated in Figs. 16–20. The results concur with the previous results, with stability shown for AAQM and RED; however, AAQM achieved the best results regarding throughput and delay with a low dropping rate.

Figure 16: Packet loss-based comparison of two-class at a departure rate of 0.5
Figure 17: Packet dropping-based comparison of two-class at a departure rate of 0.5

Figure 18: Throughput-based comparison of two-class at a departure rate of 0.5
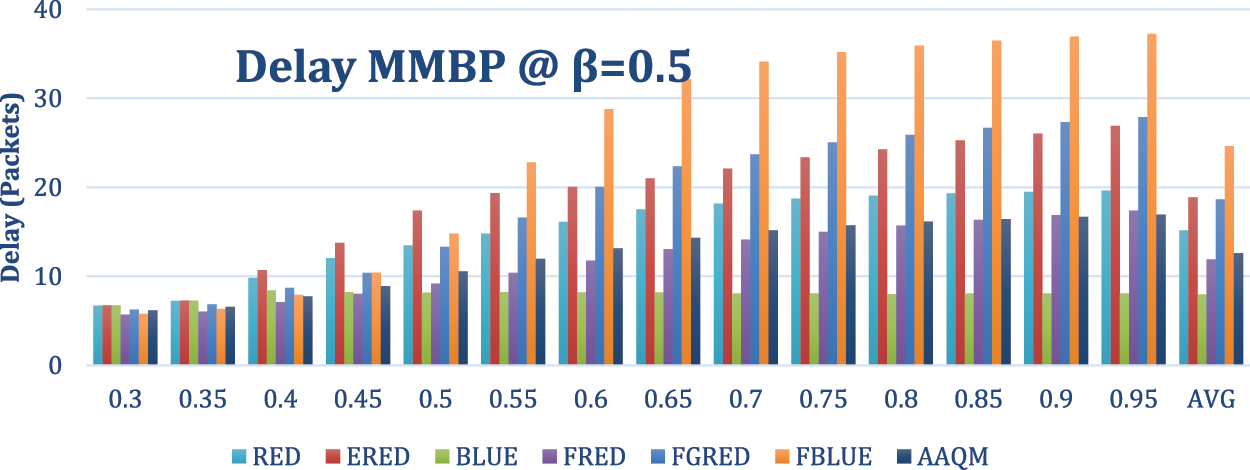
Figure 19: Delay-based comparison of two-class at a departure rate of 0.5
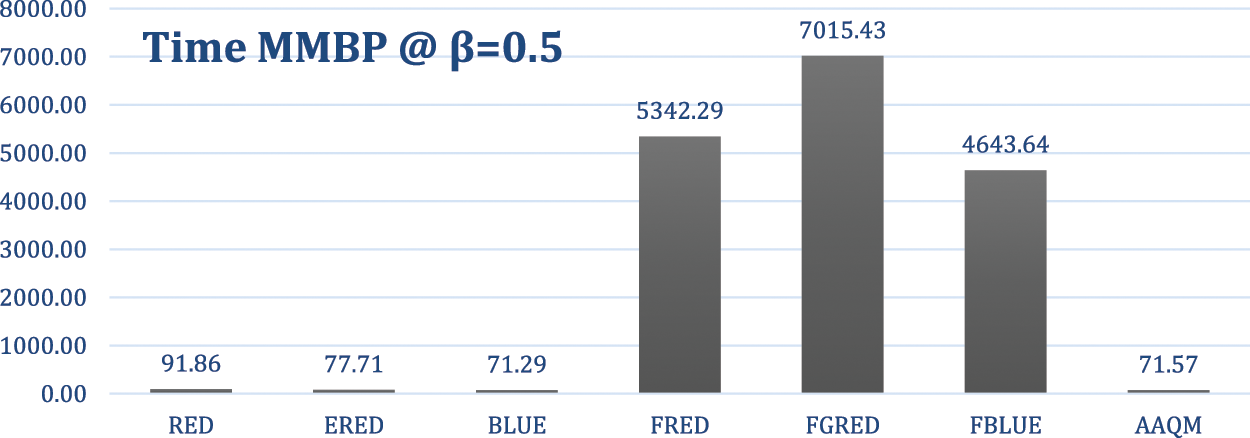
Figure 20: Overall time-based comparison of two-class at a departure rate of 0.5
4.4 Results of Heavy Traffic Load with Two-Class Modulation
In this experiment, the Markov process is used as the arrival process with a departure rate of 0.3 and two arrival probabilities as in the previous experiments. The results are illustrated in Figs. 21–25. The results demonstrate the outstanding results of the AAQM.
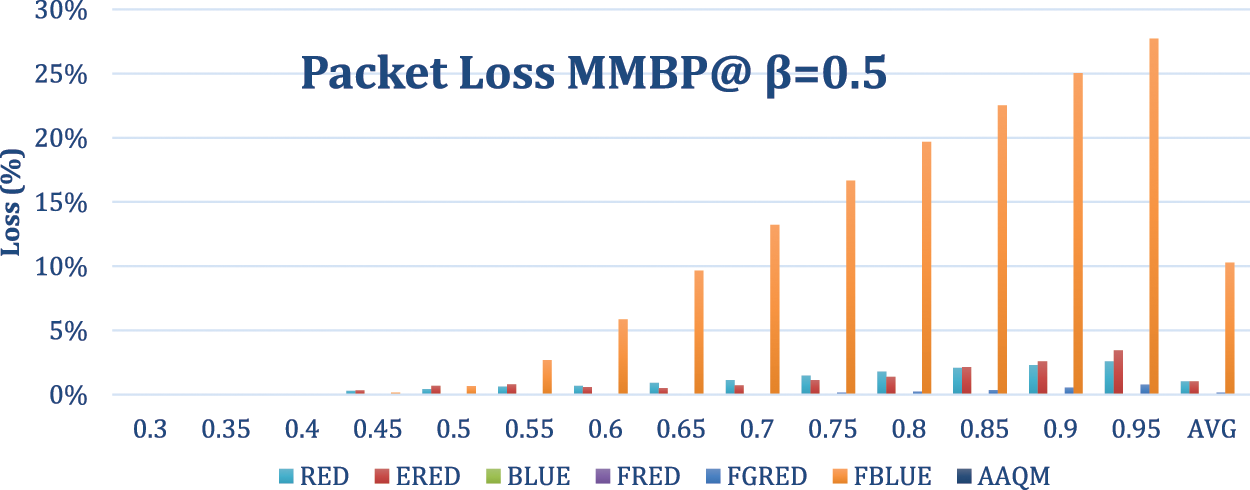
Figure 21: Packet loss-based comparison of two-class at a departure rate of 0.3

Figure 22: Packet dropping-based comparison of two-class at a departure rate of 0.3
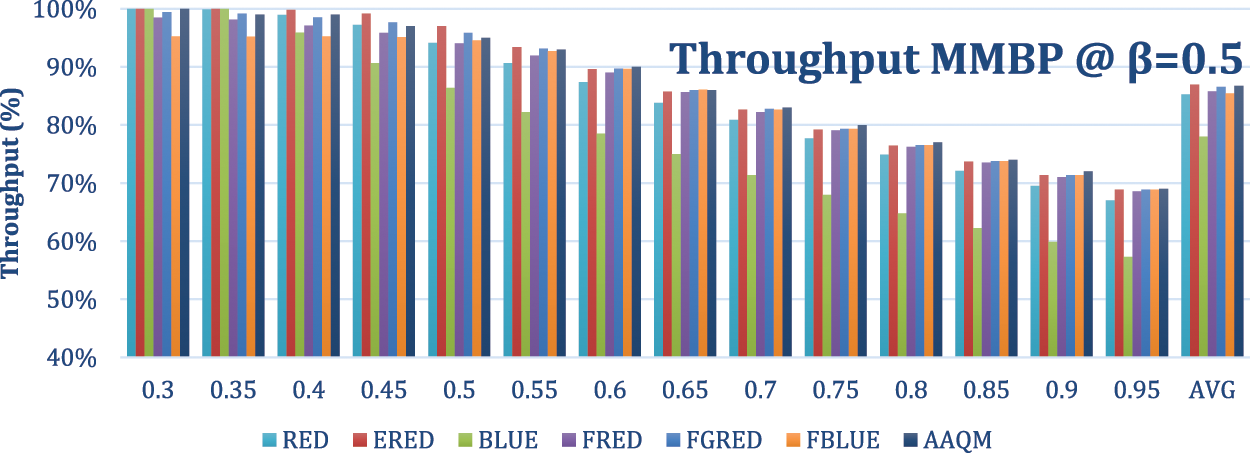
Figure 23: Throughput-based comparison of two-class at a departure rate of 0.3

Figure 24: Delay-based comparison of two-class at a departure rate of 0.3
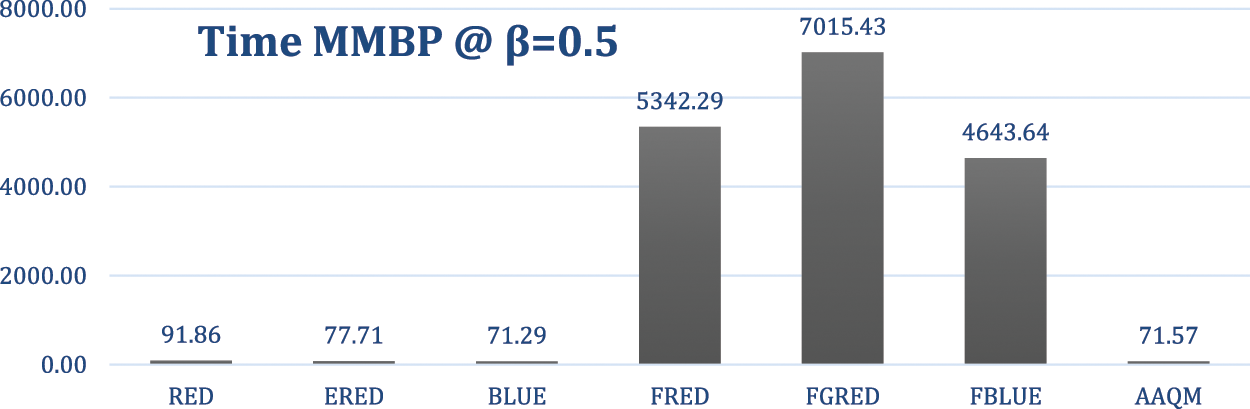
Figure 25: Overall time-based comparison of two-class at a departure rate of 0.3
The overall complexity for the simple methods (RED, ERED, BLUE, AAQM) is O(n), where n is the number of packets that arrive at the router and O(n) represents a linear time complexity, indicating that the time required to process packets increases proportionally with the number of packets. In fuzzy methods (FRED, FGRED, FBLUE), the time complexity is O(n * m * r * t), where m represents the number of linguistic variables used in the fuzzy logic, r is the number of fuzzy rules, and t is the number of defuzzification points, contributing to higher computational overhead compared to the simple methods. While RED, ERED, BLUE, and AAQM share the same linear time complexity of O(n), differences exist in the computational requirements of specific operations within the RED method.
An Adaptive Active Queue Management (AAQM) method is proposed in this paper, utilizing indicators that capture the queue length and the load at the router over a time window to avoid false alarms. Moreover, the increasing and decreasing rate, by which the dropping probability is not prefixed, is adjusted proportionally to the increase and decrease in the load. The proposed method consists of four steps, starting with calculating the indicators based on counters and parameters that are maintained and updated systematically. Then, these indicators are utilized to adjust the dropping probability incrementally or decrementally based on the queue and traffic statuses. The simulation was conducted using single- and two-classes traffic to mimic the burstiness bursty of the network flow. The two-class traffic mimics the sudden increase and decrease of the traffic and allows the simulation of multiple congestion and non-congestion status. Compared to existing AQM methods, the results demonstrate that the proposed method outperforms the other methods in terms of delay, loss, and dropping rate.
Acknowledgement: The authors extend their appreciation to the Arab Open University.
Funding Statement: This research was funded by Arab Open University Grant Number (AOURG-2023–005).
Author Contributions: The authors confirm contribution to the paper as follows: study conception and design: Ahmad Adel Abu-Shareha; methodology: Ali Alshahrani, Ahmad Adel Abu-Shareha, Basil Al-Kasasbeh; software: Qusai Y. Shambour, Ahmad Adel Abu-Shareha; validation: Ali Alshahrani, and Basil Al-Kasasbeh; analysis and interpretation of results: Ahmad Adel Abu-Shareha, Qusai Y. Shambour; draft manuscript preparation: Ahmad Adel Abu-Shareha; All authors reviewed the results and approved the final version of the manuscript.
Availability of Data and Materials: Data sharing not applicable.
Conflicts of Interest: The authors declare that they have no conflicts of interest to report regarding the present study.
References
1. H. M. Kadhim and A. A. Oglah, “Congestion avoidance and control in internet router based on fuzzy AQM,” Engineering and Technology Journal, vol. 39, no. 2, pp. 233–247, 2021. [Google Scholar]
2. W. C. Feng, K. G. Shin, D. D. Kandlur and D. Saha, “The BLUE active queue management algorithms,” IEEE/ACM Transactions on Networking, vol. 10, no. 4, pp. 513–528, 2002. [Google Scholar]
3. S. O. Hassan, “RED-LE: A revised algorithm for active queue management,” Journal of Telecommunications and Information Technology, vol. 2, no. 1, pp. 91–97, 2022. [Google Scholar]
4. A. A. Abu-Shareha, “Integrated random early detection for congestion control at the router buffer,” Computer Systems Science and Engineering, vol. 40, no. 2, pp. 719–734, 2022. [Google Scholar]
5. H. Mounier, C. Join, E. Delaleau and M. Fliess, “Active queue management for alleviating internet congestion via a nonlinear differential equation with a variable delay,” Annual Reviews in Control, vol. 55, no. 1, pp. 61–69, 2023. [Google Scholar]
6. A. Vijayaraj, H. K. Bhuyan, P. T. Vasanth-Raj and M. V. Anand, “Congestion avoidance using enhanced blue algorithm,” Wireless Personal Communications, vol. 128, no. 3, pp. 1963–1984, 2023. [Google Scholar]
7. U. R. Pujeri, “Advanced AQM blue algorithm in wireless network,” International Journal of Wireless Network Security, vol. 6, no. 1, pp. 16–24, 2020. [Google Scholar]
8. A. A. Abu-Shareha, B. Al-Kasasbeh, Q. Y. Shambour, M. M. Abualhaj and S. N. Al-Khatib, “Fuzzy comprehensive random early detection of router congestion,” Information Technology and Control, vol. 51, no. 2, pp. 252–267, 2022. [Google Scholar]
9. K. Wang, Y. Liu, X. Liu, Y. Jing and S. Zhang, “Adaptive fuzzy funnel congestion control for TCP/AQM network,” ISA Transactions, vol. 95, no. 1, pp. 11–17, 2019. [Google Scholar] [PubMed]
10. M. K. Oudah, M. Q. Sulttan and S. W. Shneen, “Fuzzy type 1 PID controllers design for TCP/AQM wireless networks,” Indonesian Journal of Electrical Engineering and Computer Science, vol. 21, no. 1, pp. 118–127, 2021. [Google Scholar]
11. Y. Monakhov and A. Kuznetsova, “On the behavior of drop-tail queue management algorithms under high packet loss,” WSEAS Transactions on Systems and Control, vol. 14, no. 12, pp. 90–96, 2019. [Google Scholar]
12. S. Floyd and V. Jacobson, “Random early detection gateways for congestion avoidance,” IEEE/ACM Transactions on Networking, vol. 1, no. 4, pp. 397–413, 1993. [Google Scholar]
13. C. V. Hollot, V. Misra, D. Towsley and W. B. Gong, “On designing improved controllers for AQM routers supporting TCP flows,” in Twentieth Annual Joint Conf. of the IEEE Computer and Communications Societies, Anchorage, AK, USA, pp. 1726–1734, 2001. [Google Scholar]
14. R. Pan, C. Nair, B. Yang and B. Prabhakar, “Packet dropping mechanisms: Some examples and analysis,” in The Annual Allerton Conf. on Communication Control and Computing, Allerton House, Illinois, USA, pp. 563–572, 2001. [Google Scholar]
15. P. Chhabra, S. Chuig, A. Goel, A. John, A. Kumar et al., “XCHOKe: Malicious source control for congestion avoidance at internet gateways,” in The 10th IEEE Int. Conf. on Network Protocols, Paris, France, pp. 186–187, 2002. [Google Scholar]
16. M. Joshi, A. Mansata, S. Talauliker and C. Beard, “Design and analysis of multi-level active queue management mechanisms for emergency traffic,” Computer Communications, vol. 28, no. 2, pp. 162–173, 2005. [Google Scholar]
17. H. Mohammed, G. Attiya and S. El-Dolil, “Active queue management for congestion control: Performance evaluation, new approach, and comparative study,” International Journal of Computing and Network Technology, vol. 5, no. 2, pp. 37–49, 2017. [Google Scholar]
18. N. Sharma, S. S. Rajput, A. K. Dwivedi and M. Shrimali, “P-RED: Probability based random early detection algorithm for queue management in MANET,” in Advances in Computer and Computational Sciences, Singapore, pp. 637–643, 2018. [Google Scholar]
19. Q. Xu, G. Ma, K. Ding and B. Xu, “An adaptive active queue management based on model predictive control,” IEEE Access, vol. 8, pp. 174489–174494, 2020. [Google Scholar]
20. M. H. Etbega, M. Woodward, H. Abdel-Jaber and A. G. Ali, “A new version of adaptive RED with reduced dependency on parameterisation,” University of Bradford, Bradford, UK, Technical Report WP/10, 2004. [Google Scholar]
21. J. S. Li and Y. S. Su, “Random early detection with flow number estimation and queue length feedback control,” Journal of Systems Architecture, vol. 52, no. 6, pp. 359–372, 2006. [Google Scholar]
22. J. Hong, C. Joo and S. Bahk, “Active queue management algorithm considering queue and load states,” Computer Communications, vol. 30, no. 4, pp. 886–892, 2007. [Google Scholar]
23. J. Sun and M. Zukerman, “RaQ: A robust active queue management scheme based on rate and queue length,” Computer Communications, vol. 30, no. 8, pp. 1731–1741, 2007. [Google Scholar]
24. B. Abbasov and S. Korukoglu, “Effective RED: An algorithm to improve RED’s performance by reducing packet loss rate,” Journal of Network and Computer Applications, vol. 32, no. 3, pp. 703–709, 2009. [Google Scholar]
25. C. K. Chen, T. L. Liao and J. J. Yan, “Active queue management controller design for TCP communication networks: Variable structure control approach,” Chaos, Solitons & Fractals, vol. 40, no. 1, pp. 277–285, 2009. [Google Scholar]
26. N. Xiong, A. V. Vasilakos, L. T. Yang, C. X. Wang, R. Kannan et al., “A novel self-tuning feedback controller for active queue management supporting TCP flows,” Information Sciences, vol. 180, no. 11, pp. 2249–2263, 2010. [Google Scholar]
27. S. Patel and S. Bhatnagar, “Adaptive mean queue size and its rate of change: Queue management with random dropping,” arXiv preprint arXiv:1602.02241, 2016. [Google Scholar]
28. Z. Y. Hong, Z. X. Feng and T. X. Yan, “Research on the improved way of RED algorithm S-RED,” International Journal of u- and e- Service, Science and Technology, vol. 9, no. 2, pp. 375–384, 2016. [Google Scholar]
29. S. O. Hassan, A. U. Rufai, V. O. Nwaocha, S. O. Ogunlere, A. A. Adegbenjo et al., “Quadratic exponential random early detection: A new enhanced random early detection-oriented congestion control algorithm for routers,” International Journal of Electrical & Computer Engineering, vol. 13, no. 1, pp. 669–679, 2023. [Google Scholar]
30. S. Floyd, R. Gummadi and S. Shenker, “Adaptive RED: An algorithm for increasing the robustness of RED’s active queue management,” AT&T Center for Internet Research at ICSI, Technical Report, 2001. [Google Scholar]
31. J. Aweya, M. Ouellette and D. Y. Montuno, “A control theoretic approach to active queue management,” Computer Networks, vol. 36, no. 2–3, pp. 203–235, 2001. [Google Scholar]
32. W. C. Feng, D. D. Kandlur, D. Saha and K. G. Shin, “BLUE: A New class of active queue management algorithms,” University of Michigan, Ann Arbor, MI, Technical Report, 1999. [Google Scholar]
33. W. C. Feng, A. Kapadia and S. Thulasidasan, “GREEN: Proactive queue management over a best-effort network,” in Global Telecommunications Conf., Taipei, Taiwan, pp. 1774–1778, 2002. [Google Scholar]
34. T. J. Ott, T. V. Lakshman and L. Wong, “SRED: Stabilized RED,” in Eighteenth Annual Joint Conf. of the IEEE Computer and Communications Societies, New York, NY, USA, pp. 1346–1355, 1999. [Google Scholar]
35. S. Jung, J. Kim and J. H. Kim, “Intelligent active queue management for stabilized QoS guarantees in 5G mobile networks,” IEEE Systems Journal, vol. 15, no. 3, pp. 4293–4302, 2020. [Google Scholar]
36. S. B. Danladi and F. U. Ambursa, “DyRED: An enhanced random early detection based on a new adaptive congestion control,” in 15th Int. Conf. on Electronics, Computer and Computation (ICECCO), Abuja, Nigeria, pp. 1–5, 2019. [Google Scholar]
37. M. Berbek and A. Oglah, “Adaptive neuro-fuzzy controller trained by genetic-particle swarm for active queue management in internet congestion,” Indonesian Journal of Electrical Engineering and Computer Science, vol. 26, no. 1, pp. 229–242, 2022. [Google Scholar]
38. A. Jarrah, M. O. Alshiab and M. M. Shurman, “High performance changeable dynamic gentle random early detection (CDGRED) for congestion control at router buffer,” International Journal of Grid and High Performance Computing, vol. 14, no. 1, pp. 1–14, 2022. [Google Scholar]
39. Z. M. Patel, “Queue occupancy estimation technique for adaptive threshold based RED,” in 2017 IEEE Int. Conf. on Circuits and Systems (ICCS), Kerala, India, pp. 437–440, 2017. [Google Scholar]
40. Y. Zhao, Z. Ma, X. Zheng and X. Tu, “An improved algorithm of nonlinear red based on membership cloud theory,” Chinese Journal of Electronics, vol. 26, no. 3, pp. 537–543, 2017. [Google Scholar]
41. S. Bhatnagar and S. Patel, “A stochastic approximation approach to active queue management,” Telecommunication Systems, vol. 68, no. 1, pp. 89–104, 2018. [Google Scholar]
42. K. Chhabra, M. Kshirsagar and A. Zadgaonkar, “An improved RED algorithm with input sensitivity,” in Cyber Security, Singapore, pp. 35–45, 2018. [Google Scholar]
43. M. Baklizi, “Weight queue dynamic active queue management algorithm,” Symmetry, vol. 12, no. 12, pp. 2077, 2020. [Google Scholar]
44. A. Giménez, M. A. Murcia, J. M. Amigó, O. Martínez-Bonastre and J. Valero, “New RED-type TCP-AQM algorithms based on beta distribution drop functions,” arXiv preprint arXiv:2201.01105, 2022. [Google Scholar]
45. C. Pan, S. Zhang, C. Zhao, H. Shi, Z. Kong et al., “A novel active queue management algorithm based on average queue length change rate,” IEEE Access, vol. 10, pp. 75558–75570, 2022. [Google Scholar]
46. A. Waheed, N. H. Khan, M. Zareei, S. U. Islam, L. Jan et al., “Traffic queuing management in the Internet of Things: An optimized RED algorithm based approach,” Computers, Materials & Continua, vol. 66, no. 1, pp. 359–372, 2021. [Google Scholar]
47. S. T. A. Jafri, I. Ahmed and S. Ali, “Queue-buffer optimization based on aggressive random early detection in massive NB-IoT MANET for 5G applications,” Electronics, vol. 11, no. 18, pp. 2955, 2022. [Google Scholar]
48. S. T. A. Jafri, I. Ahmed, S. Ali and F. Qamar, “Analysis of AgRED performance in LR-WPAN dense Ad-hoc networks,” Engineering Proceedings, vol. 32, no. 1, pp. 5, 2023. [Google Scholar]
49. S. Hassan and A. Rufai, “Modified dropping-random early detection (MD-REDA modified algorithm for controlling network congestion,” International Journal of Information Technology, vol. 15, no. 3, pp. 1499–1508, 2023. [Google Scholar]
50. W. G. De-Morais, C. E. M. Santos and C. M. Pedroso, “Application of active queue management for real-time adaptive video streaming,” Telecommunication Systems, vol. 79, no. 1, pp. 261–270, 2022. [Google Scholar] [PubMed]
51. M. Khatari, A. A. Zaidan, B. B. Zaidan, O. S. Albahri and M. A. Alsalem, “Multi-criteria evaluation and benchmarking for active queue management methods: Open issues, challenges and recommended pathway solutions,” International Journal of Information Technology & Decision Making, vol. 18, no. 4, pp. 1187–1242, 2019. [Google Scholar]
52. S. Anwar, S. Akhtar and G. Badshah, “Evaluation of active queue management methods based on integrated AHP, TOPSIS and fuzzy TOPSIS,” Journal of Computing & Biomedical Informatics, vol. 3, no. 1, pp. 267–281, 2022. [Google Scholar]
Cite This Article
 Copyright © 2023 The Author(s). Published by Tech Science Press.
This work is licensed under a Creative Commons Attribution 4.0 International License , which permits unrestricted use, distribution, and reproduction in any medium, provided the original work is properly cited.
 Downloads
 Citation Tools