
 Submit a Paper
 Propose a Special lssue
 Open Access
ARTICLE

Force Sensitive Resistors-Based Real-Time Posture Detection System Using Machine Learning Algorithms
1 Department of Electrical and Computer Engineering, COMSATS University Islamabad, Lahore Campus, Lahore, 54000, Pakistan
2 College of Computing and Informatics, Saudi Electronic University, Riyadh, 11673, Saudi Arabia
3 Department of Electrical and Computer Engineering, College of Engineering, Dhofar University, Salalah, 211, Oman
* Corresponding Authors: Mohammad Khalid Imam Rahmani. Email: ; Abdulbasid S. Banga. Email:
Computers, Materials & Continua 2023, 77(2), 1795-1814. https://doi.org/10.32604/cmc.2023.044140
Received 22 July 2023; Accepted 19 September 2023; Issue published 29 November 2023
 View Full Text
 Download PDF
Abstract
To detect the improper sitting posture of a person sitting on a chair, a posture detection system using machine learning classification has been proposed in this work. The addressed problem correlates to the third Sustainable Development Goal (SDG), ensuring healthy lives and promoting well-being for all ages, as specified by the World Health Organization (WHO). An improper sitting position can be fatal if one sits for a long time in the wrong position, and it can be dangerous for ulcers and lower spine discomfort. This novel study includes a practical implementation of a cushion consisting of a grid of 3 × 3 force-sensitive resistors (FSR) embedded to read the pressure of the person sitting on it. Additionally, the Body Mass Index (BMI) has been included to increase the resilience of the system across individual physical variances and to identify the incorrect postures (backward, front, left, and right-leaning) based on the five machine learning algorithms: ensemble boosted trees, ensemble bagged trees, ensemble subspace K-Nearest Neighbors (KNN), ensemble subspace discriminant, and ensemble RUSBoosted trees. The proposed arrangement is novel as existing works have only provided simulations without practical implementation, whereas we have implemented the proposed design in Simulink. The results validate the proposed sensor placements, and the machine learning (ML) model reaches a maximum accuracy of 99.99%, which considerably outperforms the existing works. The proposed concept is valuable as it makes it easier for people in workplaces or even at individual household levels to work for long periods without suffering from severe harmful effects from poor posture.Keywords
Technology has brought many benefits to humans. Our lifestyles increasingly rely on technology for almost every task without our knowing it [1]. We have mastered the art of texting, emailing, and web surfing on our devices. However, with that digital competence, we have picked up an unexpected side effect: “poor posture” [2]. Although technology is crucial for digital progress, it can have a detrimental effect on posture. Healthy posture keeps vital muscles such as the neck and lower back aligned and balanced [3].
Maintaining adequate posture maintains optimal spine and vertebral alignment, positively impacting general well-being. Researchers discovered that individuals who exhibited a slumped posture showed a substantial decrease in the transversus abdominis muscle thickness [4]. Low back pain has been correlated with transversus abdominis muscle dysfunction. Back pain’s prevalence and incapacitating effect lead to its long-term presence, impacting around 70% to 85% of people throughout their lives [5]. Approximately $50 billion is spent annually on treating back pain in the United States of America. Another study found that individuals who received instruction to keep a hunched posture reported increased stress levels, leading to a decline in overall performance [6]. Sitting in an incorrect or bad posture for an extended period leads to several diseases like severe pain in the neck and back, pressure ulcers, bed sores and muscles, high blood pressure, severe headaches, and the risk of diabetes [7]. In addition to people with a sedentary lifestyle, 1% of the world’s population uses a wheelchair. A pressure ulcer is the most common disease faced by wheelchair users if they sit in the wrong posture for an extended period. People with pressure ulcers have 5–6 times the death risk of people without pressure ulcers. Pressure ulcers cause 60,000 deaths per year [8]. The risk of pressure ulcers can be reduced by correcting the posture of wheelchair users. Due to the importance of correct sitting posture in everyone’s life, various health-related organizations like the American Chiropractic Association (ACA), WHO, and the Occupational Safety and Health Administration (OSHA) have officially proposed an ergonomic guideline for healthy posture [9–12]. The proposed posture detection system utilizes the nine FSR sensors in a 3 × 3 grid configuration. An FSR sensor changes its resistance when a force is applied to it; a change in resistance can determine that the force is being exerted on it. The key contributions to this work are as follows:
• An optimization technique is presented to improve the accuracy of sitting position recognition by strategically installing pressure sensors.
• The research thoroughly analyzed different classification algorithms to identify the most efficient posture classifier for the proposed posture detection system.
• In contrast with previous studies, the proposed system incorporates BMI as a factor to evaluate its overall effectiveness and durability across different body shapes.
Our system not only helps to prevent the side effects of bad posture but also realizes the third SDG established by the United Nations: “ensuring healthy lives and promoting well-being for all ages” [13]. Whether used in homes, offices, or rehabilitation centers, it helps promote wellness and human health and contributes to international efforts. Accurate posture detection has been the subject of many studies by scientists and researchers, particularly for wheelchair users. Many systems have been created to classify sitting postures using various machine learning (ML) algorithms, i.e., the Convolutional Neural Network (CNN) algorithm, in addition to the Conventional Naive Bayes (NB) classifier, Decision Tree (DT), Neural Network (NN), Multinomial Logistic Regression (MLR), and Support Vector Machine (SVM) algorithms.
Smartphone-based inertial sensors and the five ML algorithms have been used to detect the posture of the user [14]. A sitting posture monitoring system uses the load cells on the seat and multiple classifier algorithms to detect the wrong posture of a sitting person [15]. The effectiveness of the system in real-time circumstances was not assessed by the study. Although quick feedback and action are essential for monitoring sitting postures in real-time, the system’s efficacy in these situations is uncertain. A dedicated hardware system that uses convolutional neural networks to analyze video in real-time detects the position of the neck, shoulders, and arms and advises a worker to minimize any health issues caused by bad posture [16], but the real-time performance of the system is not discussed in the study.
A non-contact wireless sitting position recognition system that recognizes five habitual sitting postures using only radio frequency signals and one light and moderate radio-frequency identification tag [17], the Sitsen system uses radio frequency identification (RFID), necessitating the installation of RFID tags and antennae. As it relies on specific equipment, the system is less adaptable and flexible in various situations or places where such infrastructure might not be easily accessible or suitable. An infrared array (IRA) sensor was used to detect the posture pressure array sensor. It has created a deep learning-based sitting posture detection method that uses a feature-level fusion technique and does not need a sophisticated handmade feature extraction procedure [18]. People who are concerned with the thought of having their sitting postures continuously monitored and collected as data may find this to be a privacy problem; therefore, options like an FSR sensor are much better choices. In [19], sixteen screen-printed pressure sensors were used, which were collected and analyzed in real-time using read-out electronics to gather pressure data. Various machine-learning algorithms were applied. However, the limited number of observations for the dataset raises questions regarding the system’s generalizability and the capacity of a system to accurately identify postures in people outside of the training dataset.
The decision tree classifier displayed the most optimistic model performance, with an effectiveness of 96.13% and a kappa of 0.921 [20]. The study emphasizes a particular set of students with various body types, which may restrict the model’s applicability to people with other body types. The textile pressure sensor system categorizes sitting positions in a chair. The data from nine patients were categorized using the Naïve Bayes classifier [21]. Even after using the Preisach model to account for hysteresis, the textile pressure sensor still shows a considerable amount of inaccuracy. For numerous purposes, especially those needing accurate pressure measurements, the average inaccuracy of 24% is intolerably high. To ensure dependable and precise data acquisition, the functionality of the sensor needs to be significantly improved.
Further, a smart cushion gathers pressure photos to train a CNN to distinguish five different human sitting positions. Collecting pressure pictures several times optimized the time independence of the data set [22]. The trained model’s functionality is inadequate for real-time applications. A real-time sitting posture identification and seated stretching coaching through a mobile app interface and ML. After identifying more than thirteen distinct sitting positions using a quick and robust supervised learning method [23], regular calibration, maintenance, and troubleshooting of the pressure sensors and data processing components are necessary to guarantee the good functioning of the system. An SVM using a Radial Basis Function (RBF) kernel was produced [24]. Although the system shows above-average efficiency, a few observations that were made prompt questions about how well it would work in actual situations.
Moreover, a hybrid strategy of ML-based and deep-learning classifiers was used to identify posture detection [25]. The experimental findings on a comprehensive benchmark dataset were presented [25]. The system is evaluated on a limited dataset gathered from a select group of people. Therefore, despite promising results, concerns regarding the applicability of the system to various demographics, body types, and postural variances are raised by the need for more variety in the dataset. For the system to be practical and useful in real-world settings, it must operate consistently across a broad spectrum of users. The posture classification algorithm operates on fuzzy logic to assess whether the user has a good or terrible posture for specified periods [26]. The sitting postures are detected using a Kinect sensor, and the data is then fed into posture detection models, which include SVM and artificial neural networks (ANN) [27]. For practical applications such as posture monitoring, real-time performance is critical, and the system’s capacity to provide prompt feedback to users may affect its practical suitability. Three tri-axial accelerometers mounted on the back of the subject were utilized to classify nine different sitting and standing postures. For posture classification, a combined deep learning model composed of a fully convolutional network (FCN) and a long-short-term model (LSTM) was proposed [28]. Despite promising results, the system’s lack of real-time implementation limits its practical use for fast posture correction, which is a critical feature of a posture-detecting system. The deep transfer learning-based categorization model uses picture dataset properties to identify and categorize human poses. The paradigm aims to categorize the four basic postures of lying, leaning, sitting, and standing [29]. Despite their excellent accuracy, camera-based systems raise privacy issues and the possibility of complaints because they continuously monitor and record behaviors.
The process of detecting posture may be carried out in various ways, including the one proposed in this work. The proposed methodology incorporates real-time analysis and is a helpful tool for enhancing sitting postures in various settings, including wheelchairs and chairs. The utilization of an FSR system enables accurate posture detection for people seated in chairs and wheelchairs. The system makes excellent evaluations and classifications of various possible sitting positions because of the strategic arrangement of FSR sensors, which is essential for precisely determining the distribution of body weight.
Applications like human posture recognition require real-time restrictions. This innovative study incorporates a real-world application of a cushion with an embedded grid of 3 × 3 FSR sensors to measure the pressure of the person seated on it. In addition, the BMI has been added to improve the system’s resilience to individual physical variations and to forecast the four incorrect seating patterns: forward bending, backward bending, left bending, right bending, and ideal posture, based on five machine learning algorithms: ensemble boosted trees, ensemble bagged trees, ensemble subspace KNN, ensemble subspace discriminant, and ensemble RUSBoosted trees. Depending on how a person sits on a chair, the weight distribution on that chair is either even or uneven. The recommended arrangement is unique because earlier research just offered simulations with no actual practical application. However, we have implemented the suggested architecture in Simulink.
Postures can be easily seen when using a laptop or a computer in a wheelchair, at home, in the office, or in any other setting. The FSR sensors utilize a conductive polymer substance that exhibits varying output values depending on the force applied to it. Mounting it on a regular or wheelchair seat causes the output to change according to the weight of the person and their sitting posture. The force operating on FSR sensors according to Eq. (1) is depicted as the pressure times area. The output voltage fluctuates with changes in the force acting on the sensor.
As the FSR sensors are tiny in size, nobody will be bothered or irritated by them. Consequently, it is a simple and effective way to identify the posture of a person when seated on a chair; therefore, it can be utilized in office settings. Nine FSR sensors are positioned in a 3 × 3 grid configuration to cover the major pressure points on the human body (the sides, hip joints, and areas beneath the thighs), as illustrated in Fig. 1.

Figure 1: Configuration of sensors on a chair
The pressure distribution approach is used to identify the incorrect posture. The FSR sensors are placed so that when a user is leaning forward, pressure on the front three sensors rises, comparable to leaning backward. Similarly, left-leaning and right-leaning postures are determined by left and right sensors, as shown in Fig. 2 in [30].
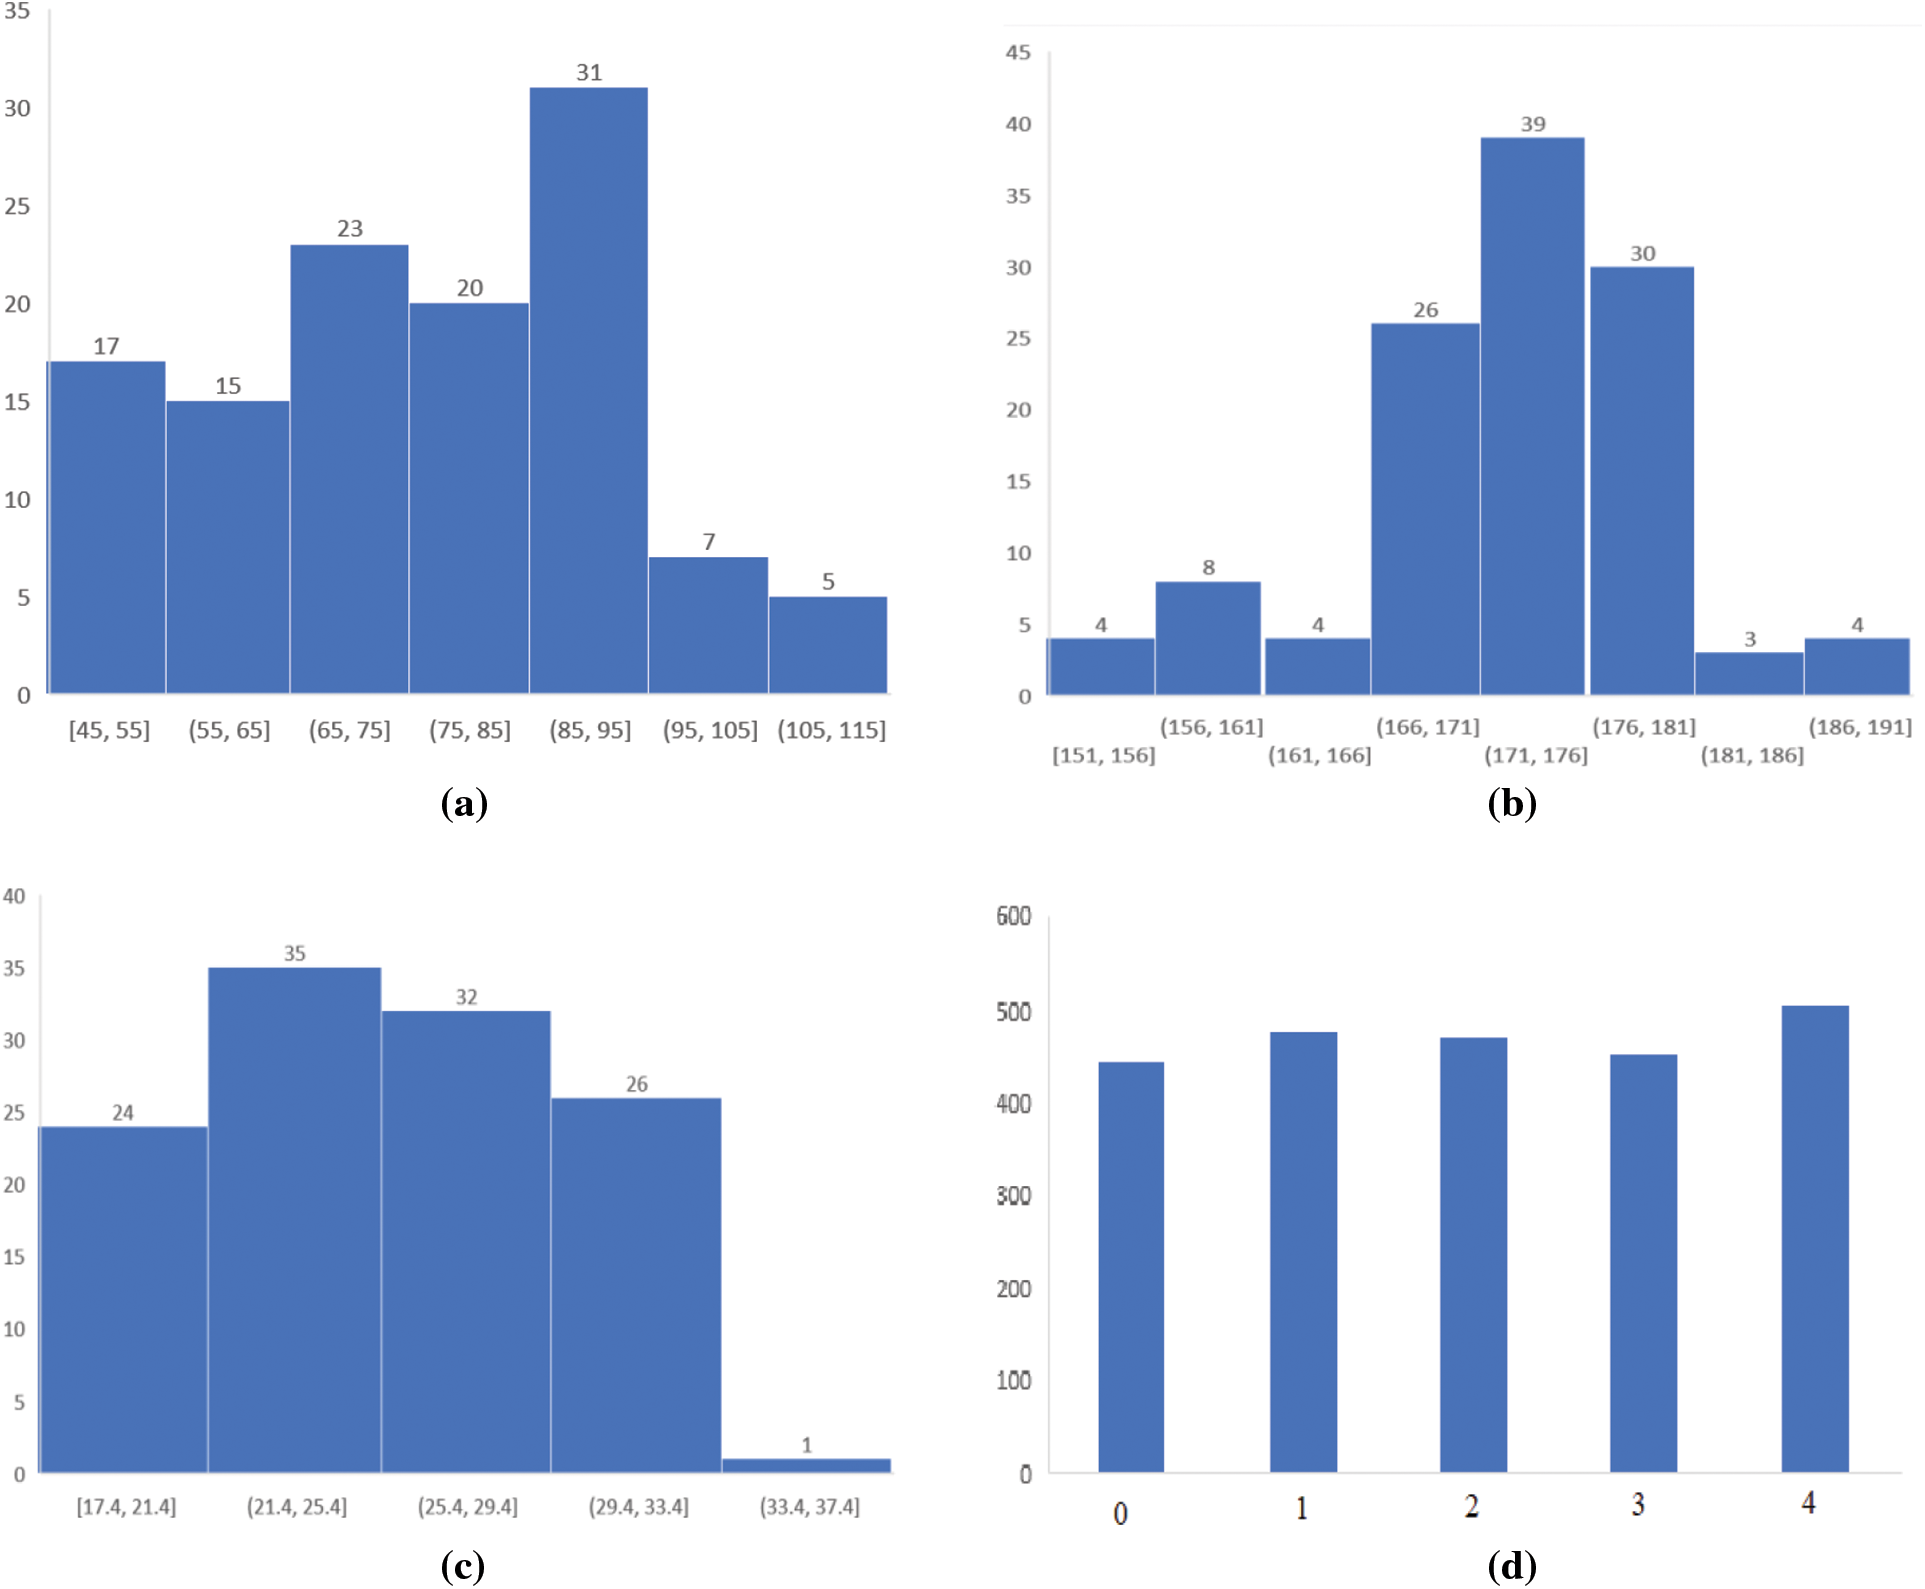
Figure 2: This figure shows the graphical representation of dataset parameters as follows: (a) weight (kg), (b) height (cm), (c) BMI, and (d) samples per posture
In this research, males and females participated, having different heights and weights. The dataset was created with the help of 81 males and 37 females; 1610 male and 740 female samples of five different postures were collected, as shown in Table 1.

During data collection sessions, participants were given clear instructions to maintain a regular and comfortable sitting position. The FSR sensors continuously measured pressure at predetermined intervals, documenting changes in weight distribution. Individuals with excessive movement or postural instability were removed to guarantee data quality. The samples are taken in the optimal position, leaning forward, leaning backward, bending to the left, and leaning to the right. The subject’s height, weight, and BMI fall between the following ranges: 150–190 cm, 47–112 kg, and 15–35 kg/m2. Fig. 2 depicts the graphical representation.
This study categorizes individuals into the following four groups based on their height and weight: underweight (BMI < 20), healthy weight (20 ≤ BMI < 25), overweight (25 ≤ BMI ≤ 30), and obese (BMI > 30). Table 2 and Fig. 2 both include the height, body weight, BMI ranges, and samples per posture.

Sensor values are stored in columns A, B, C, D, E, F, G, H, and I, while the J, K, L, and M columns show the genders, heights, weights, and BMI respectively of the subject, as shown in Fig. 3.
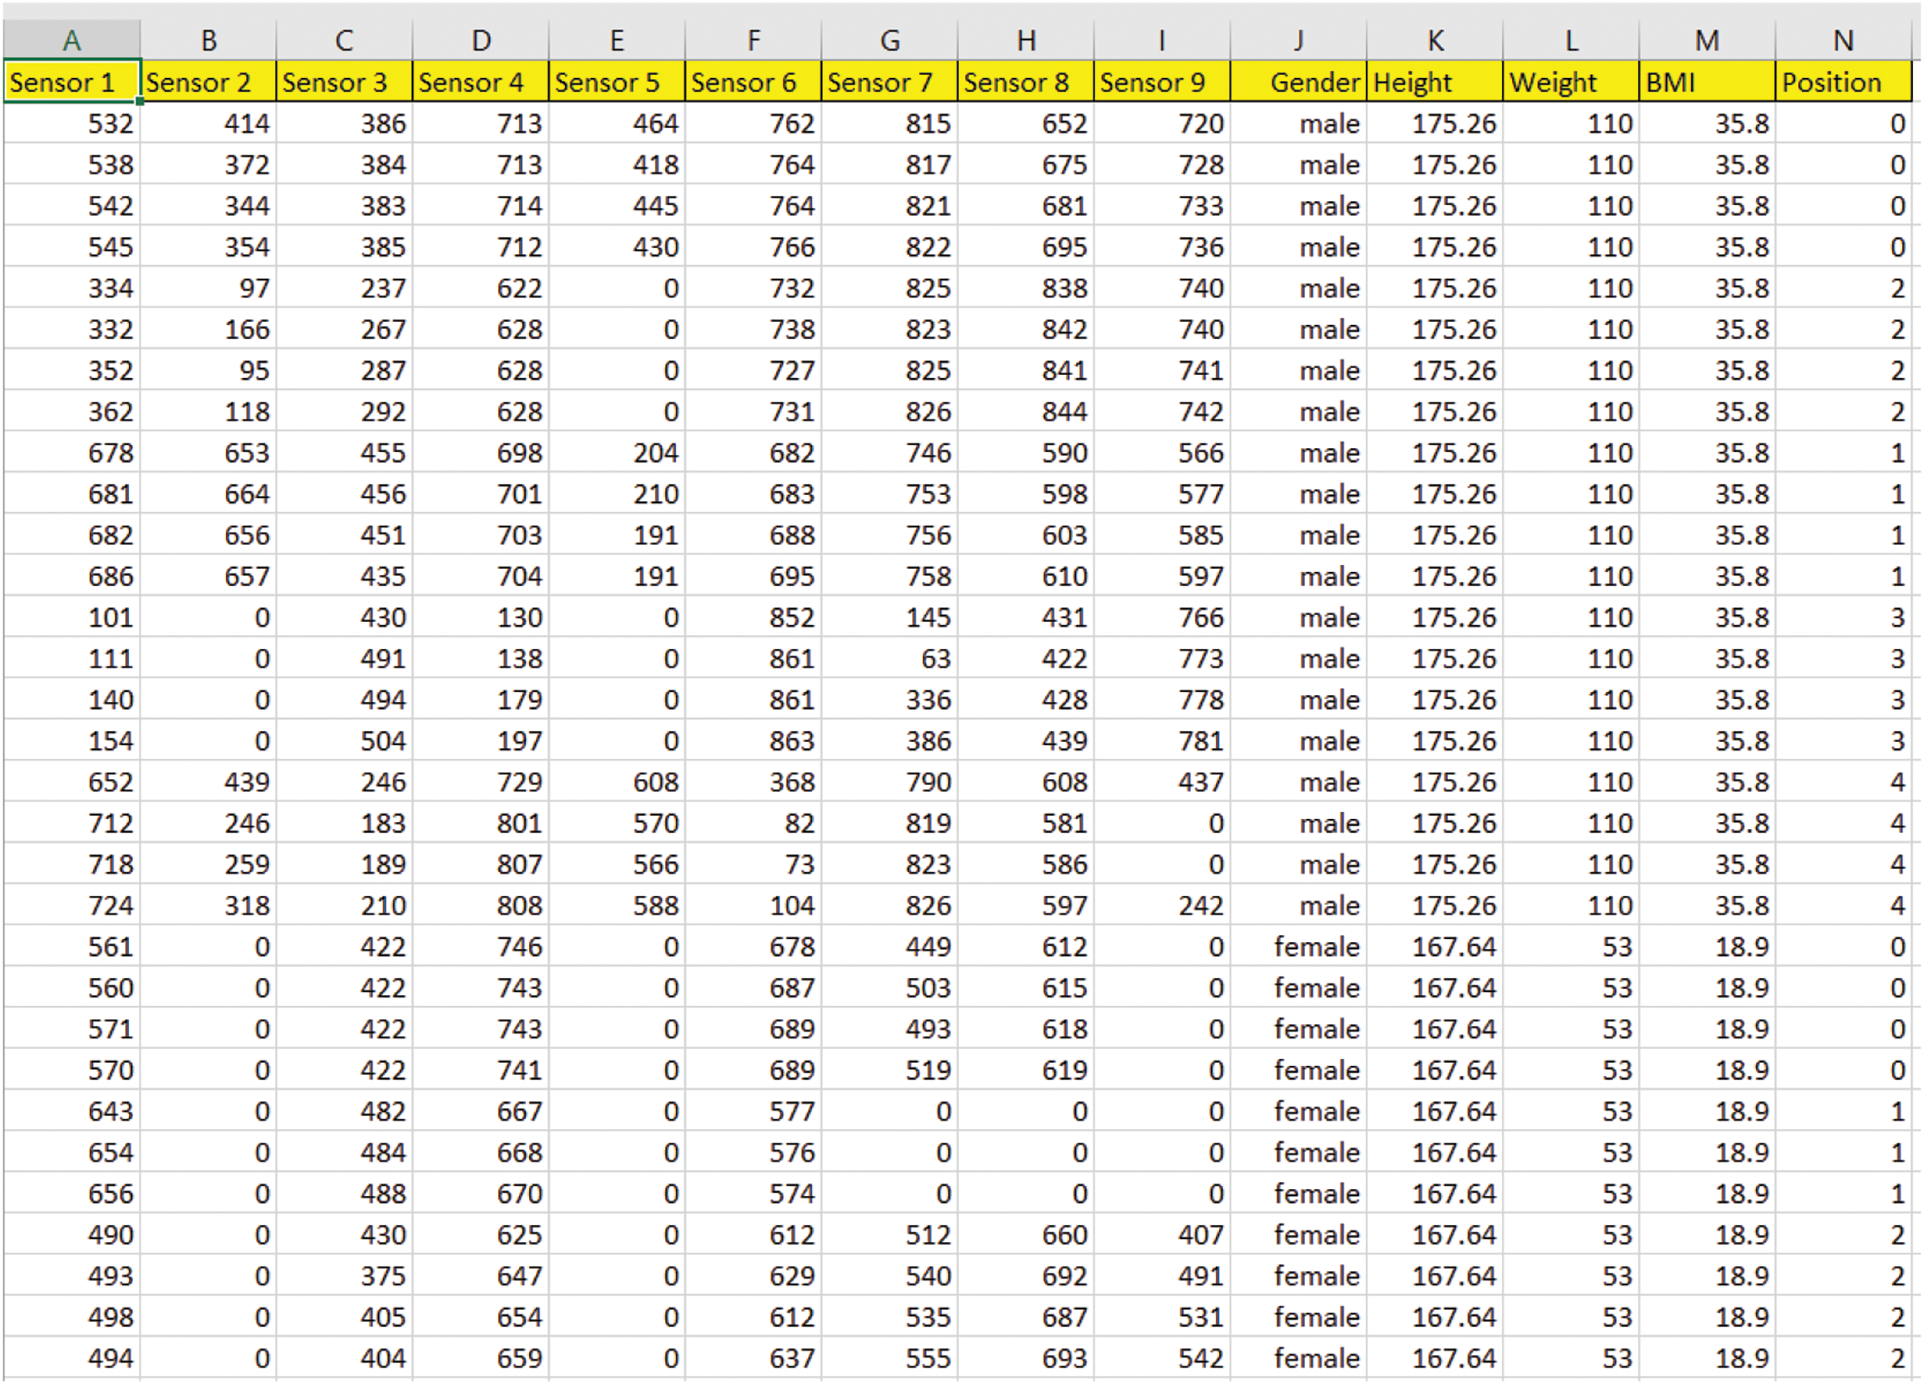
Figure 3: Dataset for posture detection
Our machine learning algorithms were able to analyze and extract the maximum features from the given dataset and detect sitting posture patterns using nine-sensor data and the BMI of a sitting person as input characteristics.
Data preparation converts raw data into usable and meaningful sets. This process refines the dataset and enhances the efficiency of the model by eliminating null, repeated, and random values from the dataset. The elimination of insignificant data is a crucial step in data refinement. Given the nature of FSR sensors, which can generate readings even when no significant force is applied, a threshold has been specified to classify sensor outputs below 100 as “0”. This thresholding method ensures that events of little force are correctly recorded and represented in the dataset. Furthermore, to avoid overfitting and false predictions, outliers are removed. Additionally, early stopping has been utilized to reduce the issue of overfitting, as it prevents the model from overfitting. It terminates the training once the validation performance starts to degrade.
4 Applied Machine Learning Algorithms
The ML and Statistics Toolbox in Matrix Laboratory (MATLAB) was used to train the model. These techniques included ensemble boosted trees, ensemble bagged trees, ensemble subspace KNN, ensemble subspace discriminant, and ensemble RUSBoosted trees. We used ensemble approach strength by utilizing the features of MATLAB’s ML and Statistics Toolbox to improve the precision, resilience, and discriminative capability of our models. We were able to better identify and classify posture patterns by integrating various ensemble methods, which allowed us to tap into the collective wisdom of many models.
In the training and testing procedure, the dataset was split into training and testing subsets using an 80%–20% ratio, with 80% designated for training and 20% for assessment. The machine learning algorithms in the training subset were trained using ensemble approaches. For overall improved performance, these ensemble approaches merged many models. The trained models were assessed using confusion matrices on a different testing subset to gauge the aptitude of algorithms for posture identification, as shown in Section 6. Confusion matrices provide detailed performance analysis of algorithms by presenting the true positive, true negative, false positive, and false negative values. This regress training and evaluation process ensures an unbiased evaluation of the performance of algorithms in precisely identifying and categorizing posture patterns.
Require: Training dataset
Ensure: Ensemble of
1. for
2. Train KNN classifier
3. end for
Compute prediction function
4. For each test example
5. Compute the set of
Compute the weighted average prediction of the
6.
7. end for
8. Return the ensemble of
Require training dataset
Ensure: Ensemble of
1. Initialize a uniform distribution over the training examples.
2. For
3. Train a decision tree
4. Compute the weighted error of
5. Compute the weight of
6. Update the distribution over
7. Normalize the weights of the training examples:
8. End for
9. Return the ensemble of
Require training dataset
Ensure: Ensemble of
1. For
2.
3. Train a decision tree
4. End for
5. For each
6. Compute the average of the predictions of all
7. End for
8. Return the ensemble of
4.4 Ensemble Subspace Discriminant
Require training dataset
Ensure: Ensemble of
1. For
2. Randomly select a subspace
Compute the discriminant function
Compute the weight
3. End for
4. For each test example
5. Compute the score for each subspace discriminant:
6. For
7. Compute the weighted average of the scores:
8. End for
9. Return the ensemble of
Require training dataset
Ensure ensemble of
1. Initialize a uniform distribution over the training examples.
2. For
3. Under-sample the training data
4. Train a decision tree
5. Compute the weighted error of
6. Compute the weight of
7. Update the distribution of the training examples:
8. Normalize the weights of the training examples:
9. End for
10. Return the ensemble of
In developing the machine learning model for our posture detection system, choosing between classification and regression required careful consideration. The classification technique has been chosen for this system as it is supported by firm technical reasoning [37].
Our task revolves around categorizing the distinct sitting postures using the data from sensors and BMI. The distinct nature of the sitting posture aligns naturally with classification, which is for distinct category assignment, whereas regression is well suited for continuous values. This methodology also aligns with the data gathered within the dataset. This alignment highlights its importance. Here are some metrics that were considered in our study. The accuracy of our posture detection technology is a critical performance parameter that directly influences its effectiveness. The receiver operating character (ROC) curve shows how effectively our classification model distinguishes between various postures by comparing the true positive rate against the false positive rate. The confusion matrix illustrates the number of true positives, true negatives, false positives, and false negatives. The split allows us to see where the model succeeds and where it needs to improve.
The posture detection system was implemented by developing a real-time ML model that utilized inputs from nine sensors. The model in Fig. 4 aims to detect and classify various sitting positions based on pressure readings obtained from FSR sensors.
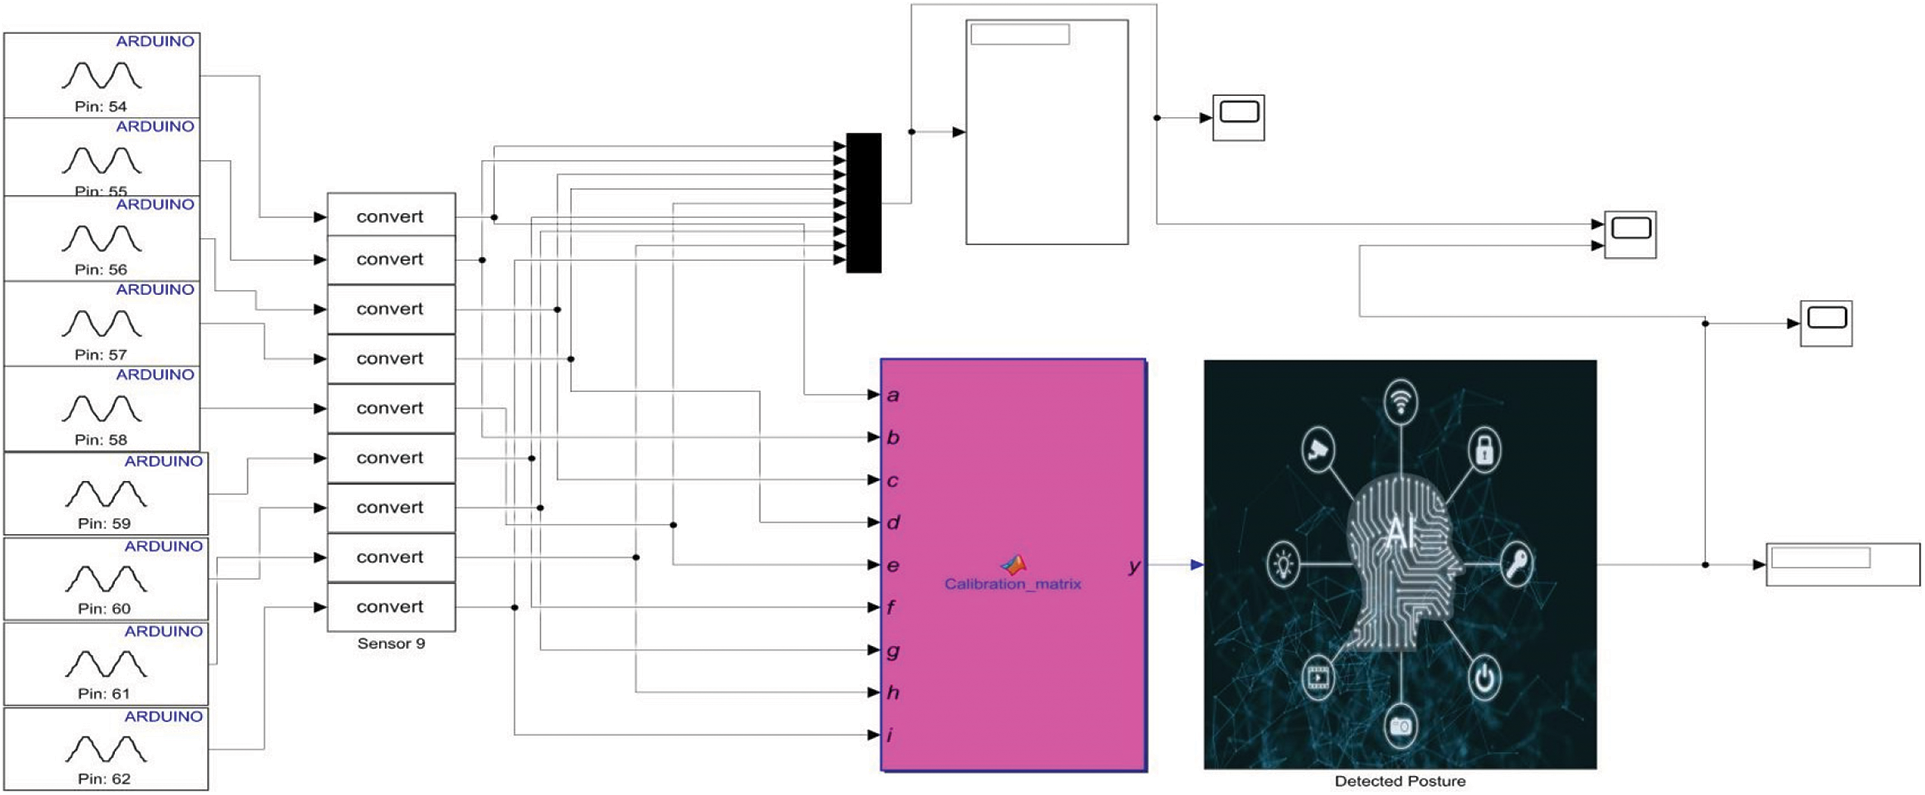
Figure 4: Implementation of the model
The data underwent processing, converting it into integer values. A calibration matrix was applied to ensure precise measurements aligned with reference values. The machine learning model utilized ensemble boosted trees, ensemble bagged trees, ensemble subspace KNN, ensemble subspace discriminant, and ensemble RUSBoosted trees as its algorithms. The model gives numerical outputs that correspond to each sitting position: the ideal position (0), front leaning (1), backward leaning (2), left-leaning (3), and right-leaning (4). When pressure is applied to the FSR sensors, or someone sits on them, the output changes according to the weight distribution, and as shown in the scope in Fig. 5, the output value of each sensor is visible.
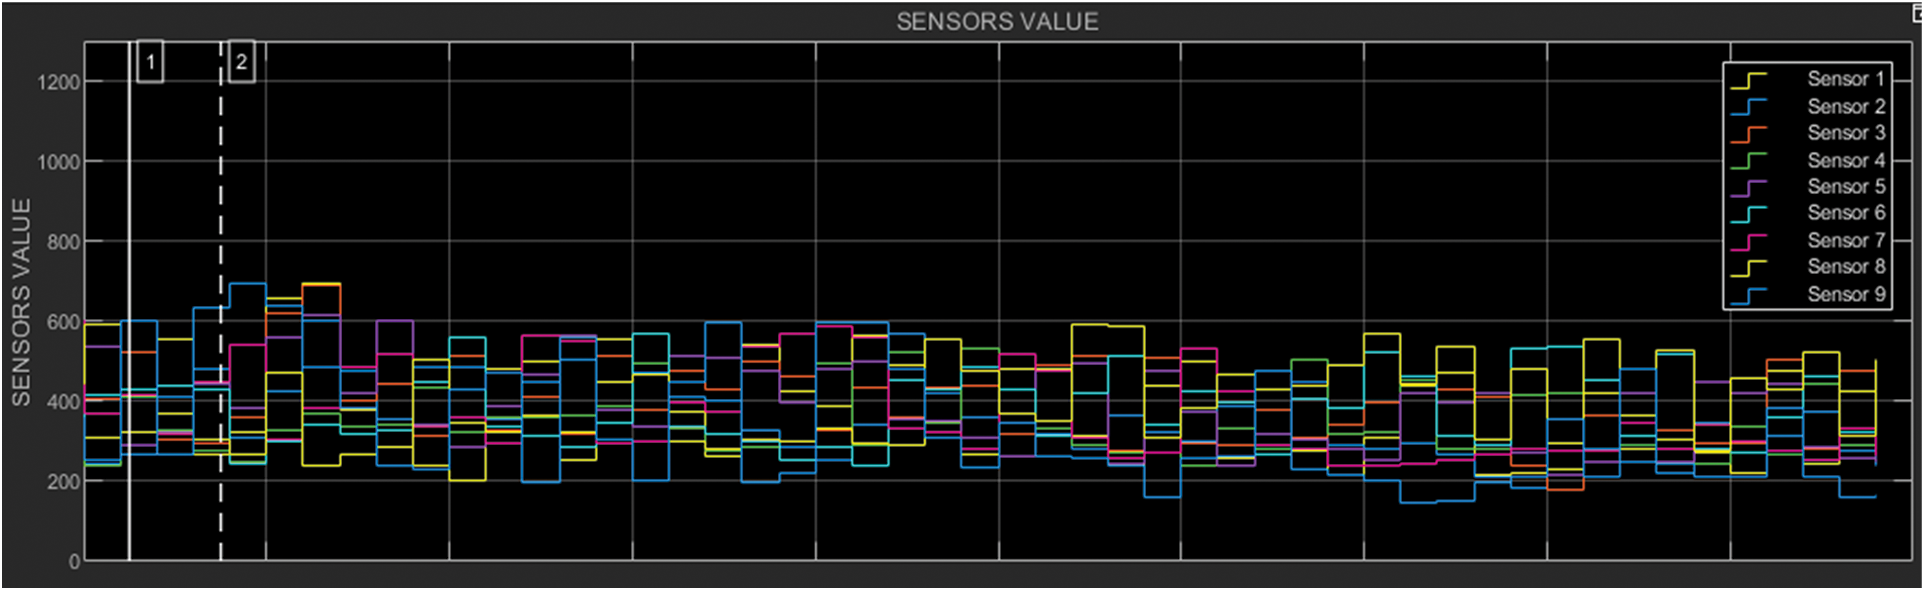
Figure 5: Real-time output changes in the FSR sensors when someone sits on them
The workflow diagram shows a systematic procedure for detecting posture, starting with collecting analog sensor readings. Then, the ML model predicts the posture of the sitting person and gives the discrete numerical outputs corresponding to each sitting position, as shown in Fig. 6.
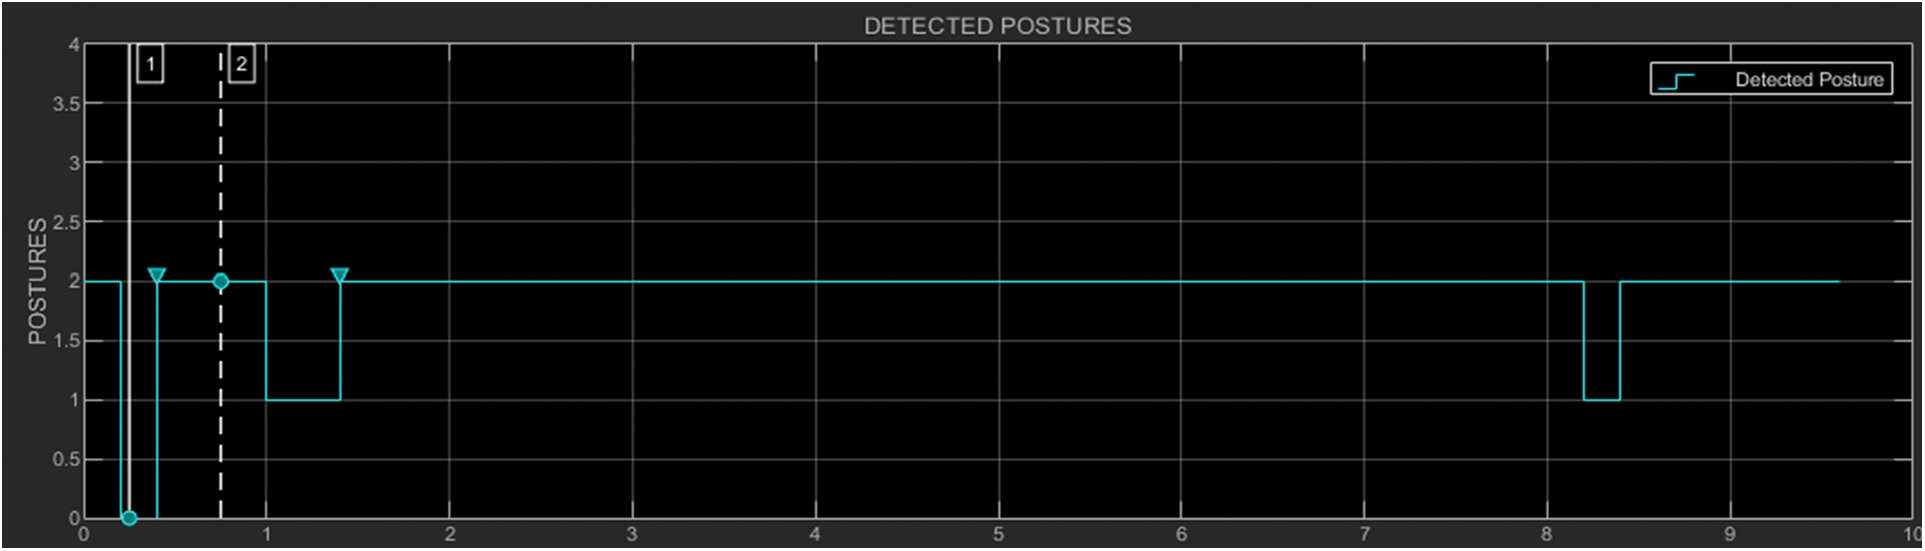
Figure 6: Real-time posture prediction of the sitting person by the ML model
The sensor data is fed into the Arduino microcontroller, which serves as an intermediary between the real-world sensors and a MATLAB ML model. In the next step in the MATLAB model, collected analog sensor data are subsequently transformed into integral values, enabling them to be used in the next processing stages, and then values are converted into a calibration matrix for further processing of the integral data. This matrix aligns and normalizes the sensor data, correcting for possible differences. After that, the calibrated sensor data is fed into the machine learning algorithms, and discrete values are produced as an output from 0 to 4, while each numerical output corresponds to a different sitting position. This implementation is a significant advancement in posture detection, providing a valuable tool for promoting proper sitting habits and preventing adverse health effects from poor posture. The overall working process of the proposed system is shown in Fig. 7.
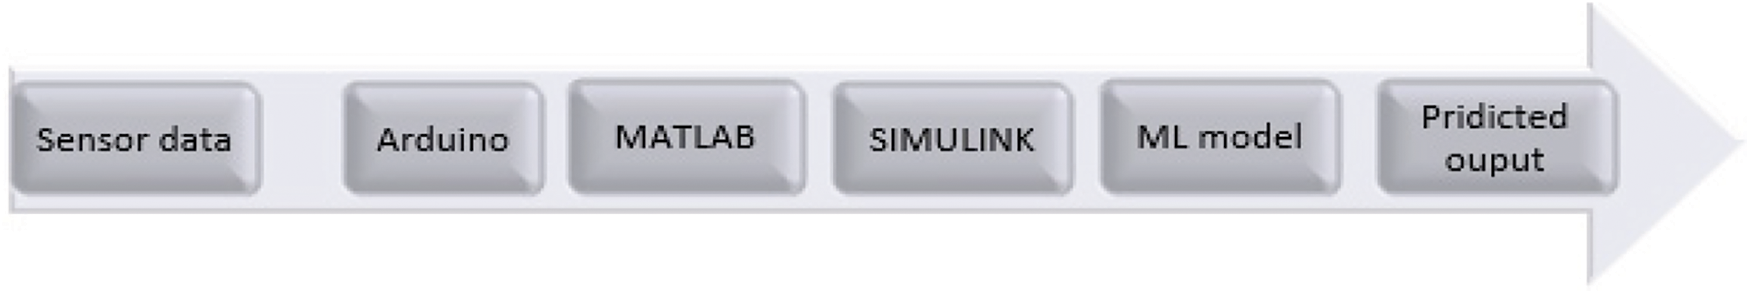
Figure 7: Complete system workflow
Machine learning algorithms are used in this research to predict five sitting postures. The designed system has evaluated classification algorithms: ensemble subspace KNN, ensemble RUSBoosted (random under-sampling boosted) trees, ensemble subspace discriminant, ensemble bagged trees, and ensemble boosted trees. All classifiers are trained to classify the five sitting positions, i.e., ideal, left, right, back, and forward-leaning. The confusion matrix gives insight into how well classifiers have performed and allows us to check how accurately they classified the observed sitting position. Each class represents the specific sitting position assigned to it. Class 0 represents the ideal position, while class 1 represents forward-leaning and backward-leaning, classified as class 2, left-leaning as class 3, and right-leaning as class 4. Ensemble subspace KNN stores the whole data instead of training at the time of classification. In the case of ensemble subspace KNN, the model obtained the highest accuracy of all, reaching 99.9%. The confusion matrix of the model is shown below in Fig. 8a, and the ROC curve with an area under the ROC (AUC) of 1.00 is shown in Fig. 8b.
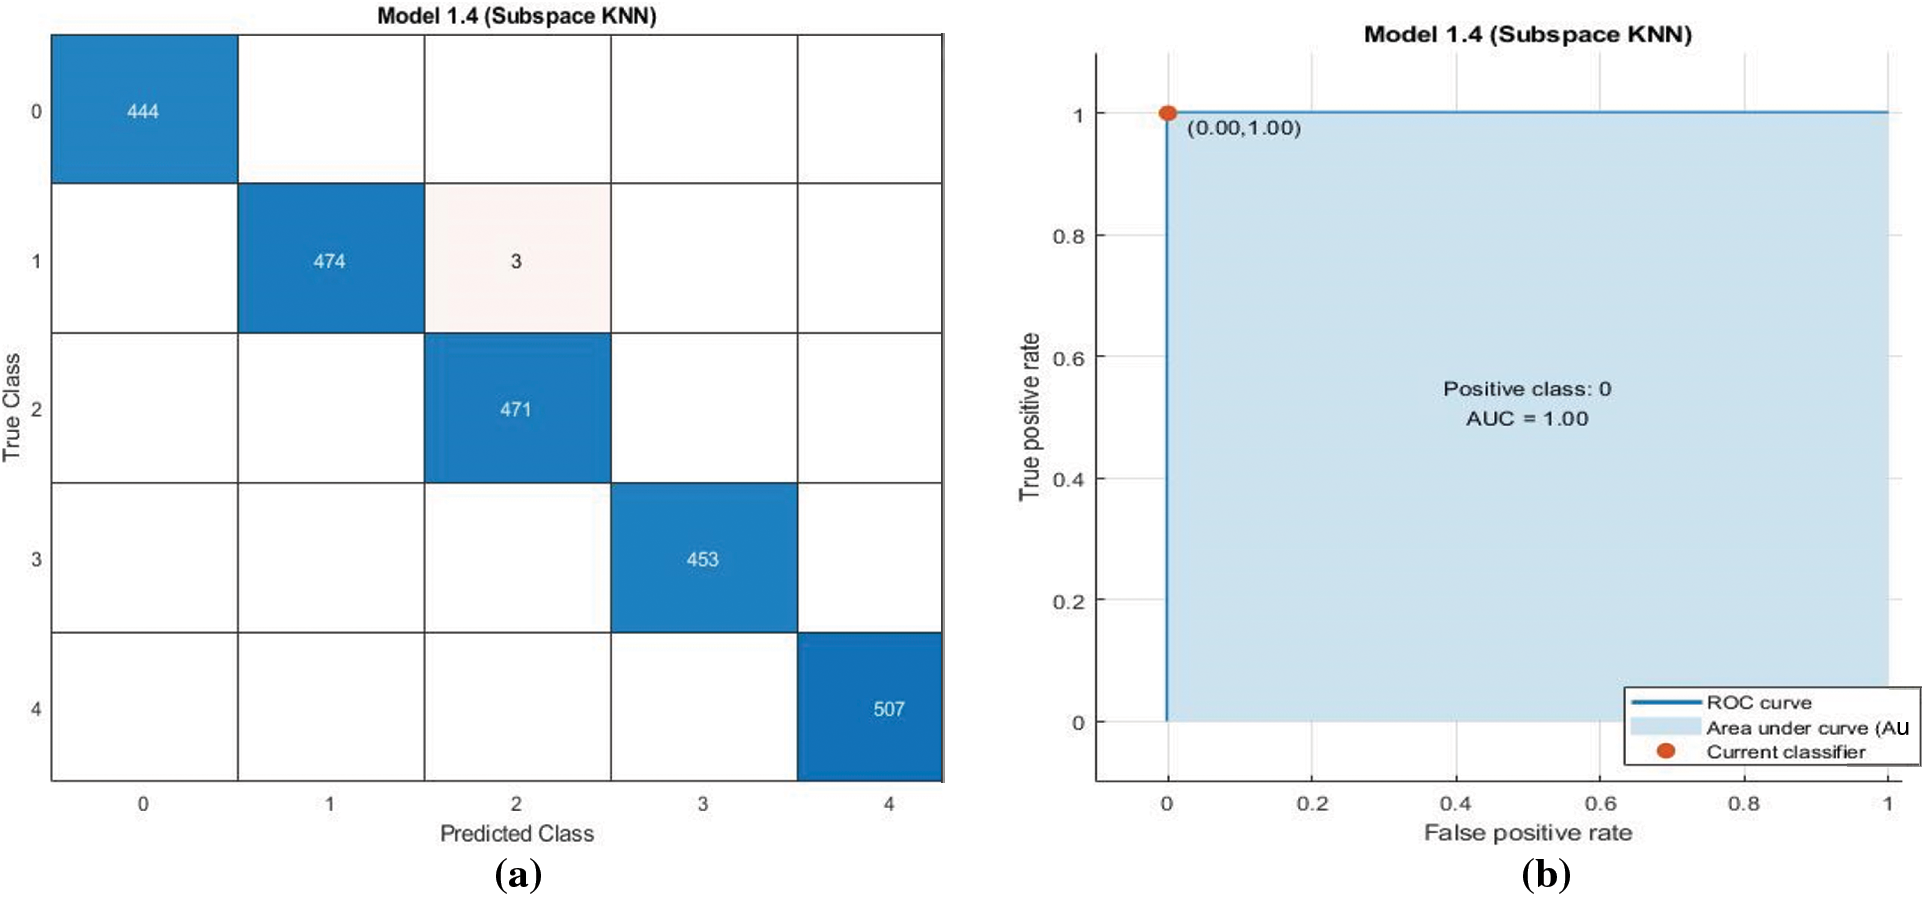
Figure 8: KNN model confusion matrix (a) and ROC curve (b)
The true class values for class 0 were 444, whereas the false class values were 0. The true class values for class 1 were 474, whereas the false values were 3. The true class values for class 2 were 471, whereas the false values were 0. The true class values for class 3 were 453, whereas the false values were 0. The true class values for class 4 were 507, whereas the false values were 0. In the case of ensemble-boosted trees, the accuracy obtained was 89.6%. The confusion matrix of the model is shown below in Fig. 9a. The true class values for class 0 are 327, whereas the false class values are 117. The true class values for class 1 are 444, whereas the false values are 33. The true class values for class 2 are 401, whereas the false values are 70. The true class values for class 3 are 438, whereas the false values are 12. The true class values for class 4 are 498, whereas the false values are 8. The ROC curve, with an AUC of 0.96, is shown in Fig. 9b.
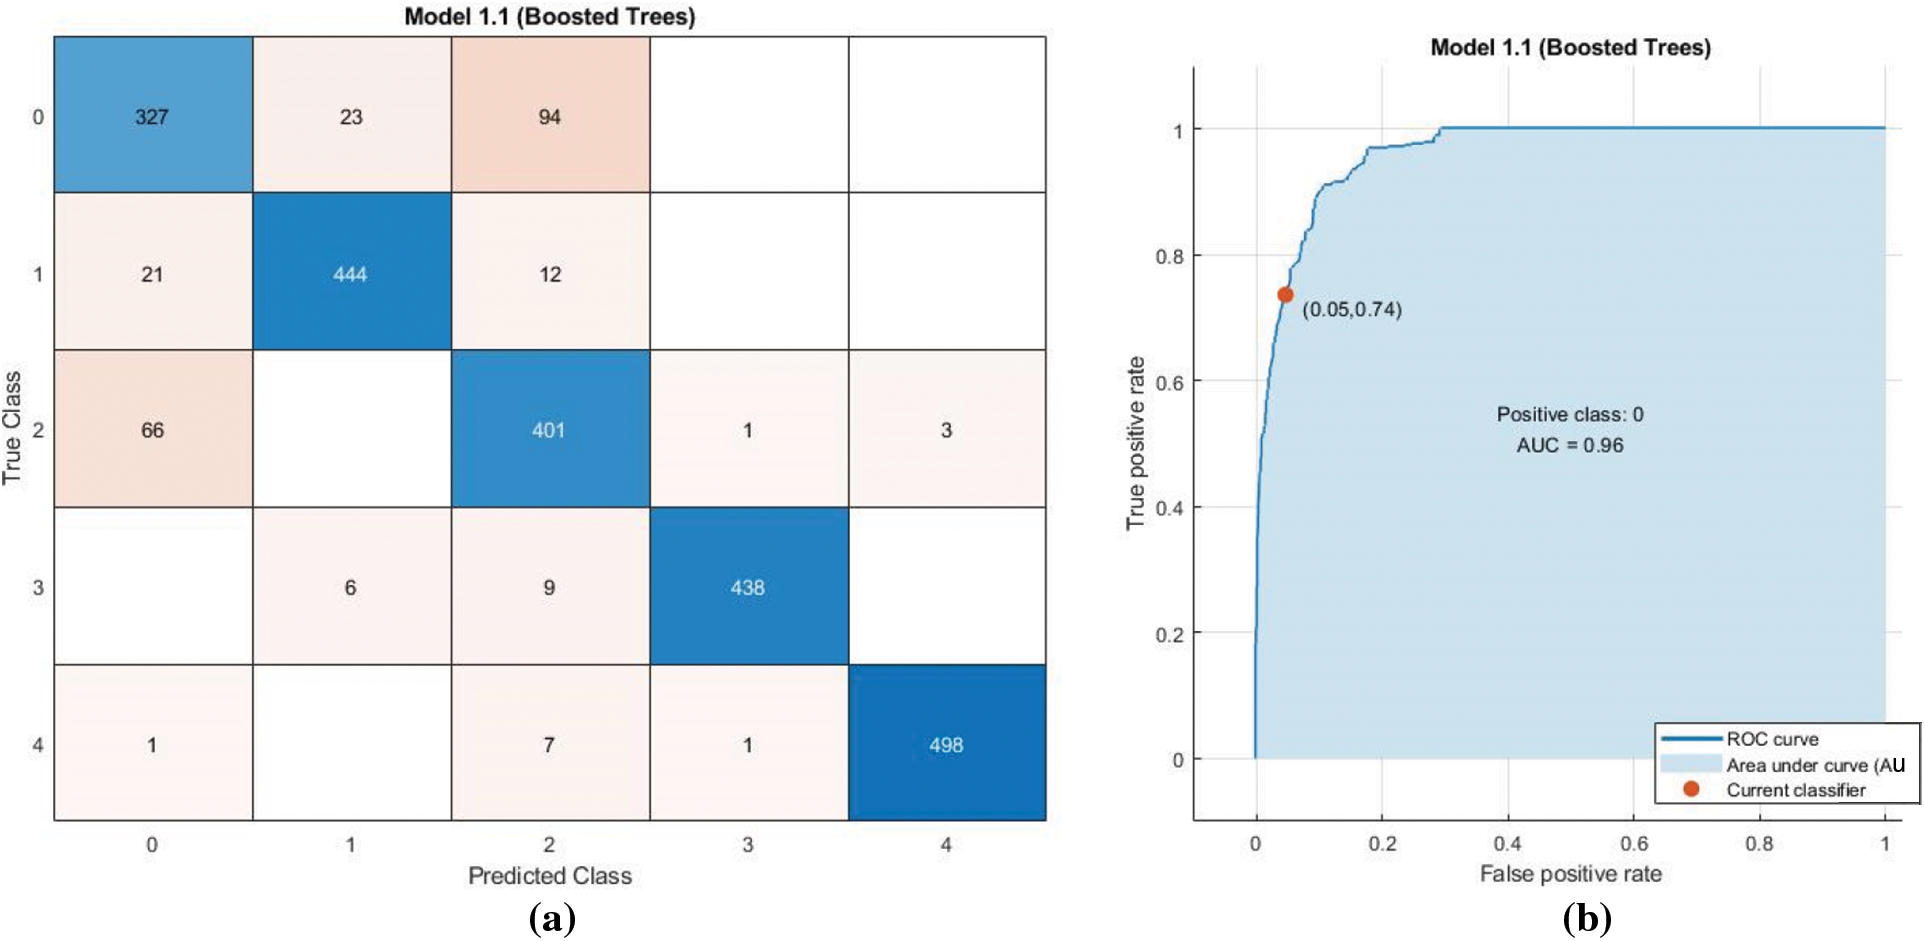
Figure 9: Ensemble boosted trees model confusion matrix (a) and ROC curve (b)
The ensemble-bagged tree model obtained an accuracy of 99.3%. The confusion matrix of the model is shown below in Fig. 10a. The true class values for class 0 are 435, whereas the false class values are 9. The true class values for class 1 are 471, whereas the false values are 6. The true class values for class 2 are 471, whereas the false values are 0. The true class values for class 3 are 451, whereas the false values are 2. The true class values for class 4 are 507, whereas the false values are 0. The ROC curve, with an AUC of 1.00, is shown in Fig. 10b.
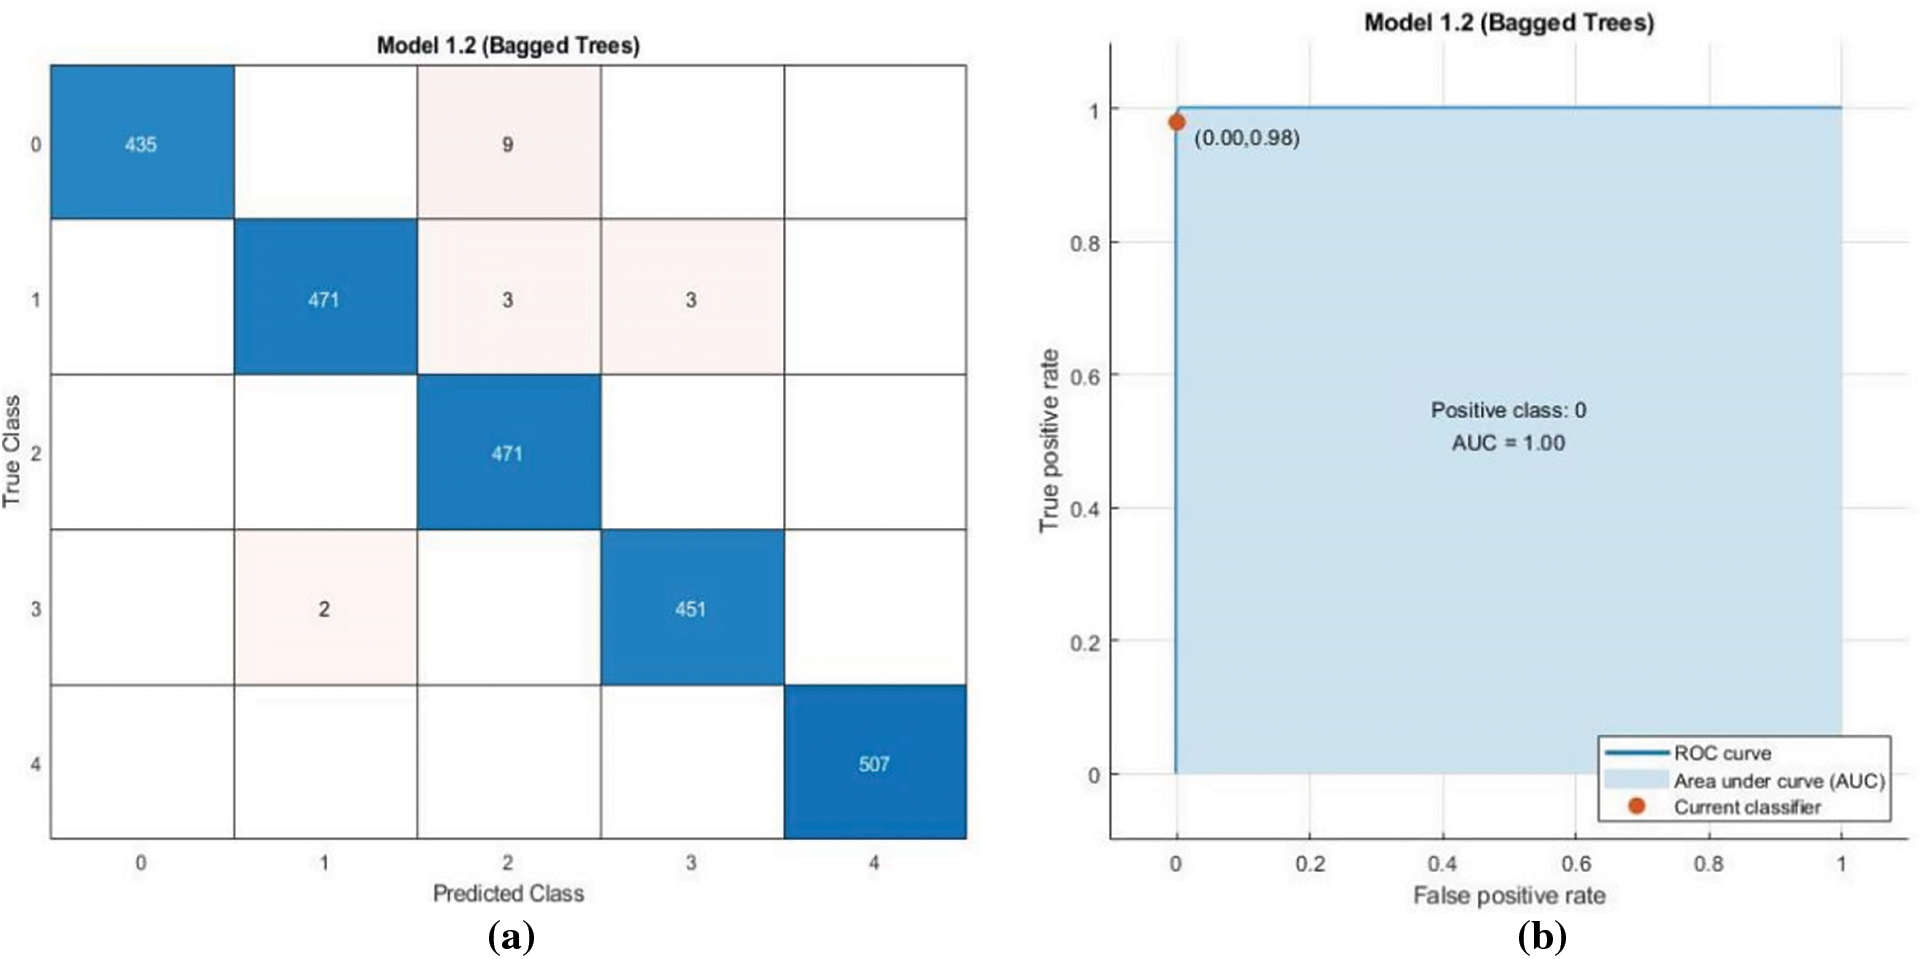
Figure 10: Ensemble bagged trees model confusion matrix (a) and ROC curve (b)
In the case of the ensemble subspace discriminant, the model obtained an accuracy of 80.6%. The confusion matrix of the model is shown below in Fig. 11a. The true class values for class 0 are 230, whereas the false class values are 214. The true class values for class 1 are 395, whereas the false values are 82. The true class values for class 2 are 344, whereas the false values are 127. The true class values for class 3 are 443, whereas the false values are 10. The true class values for class 4 are 483, whereas the false values are 24. The ROC curve, with an AUC of 0.87, is shown in Fig. 11b.
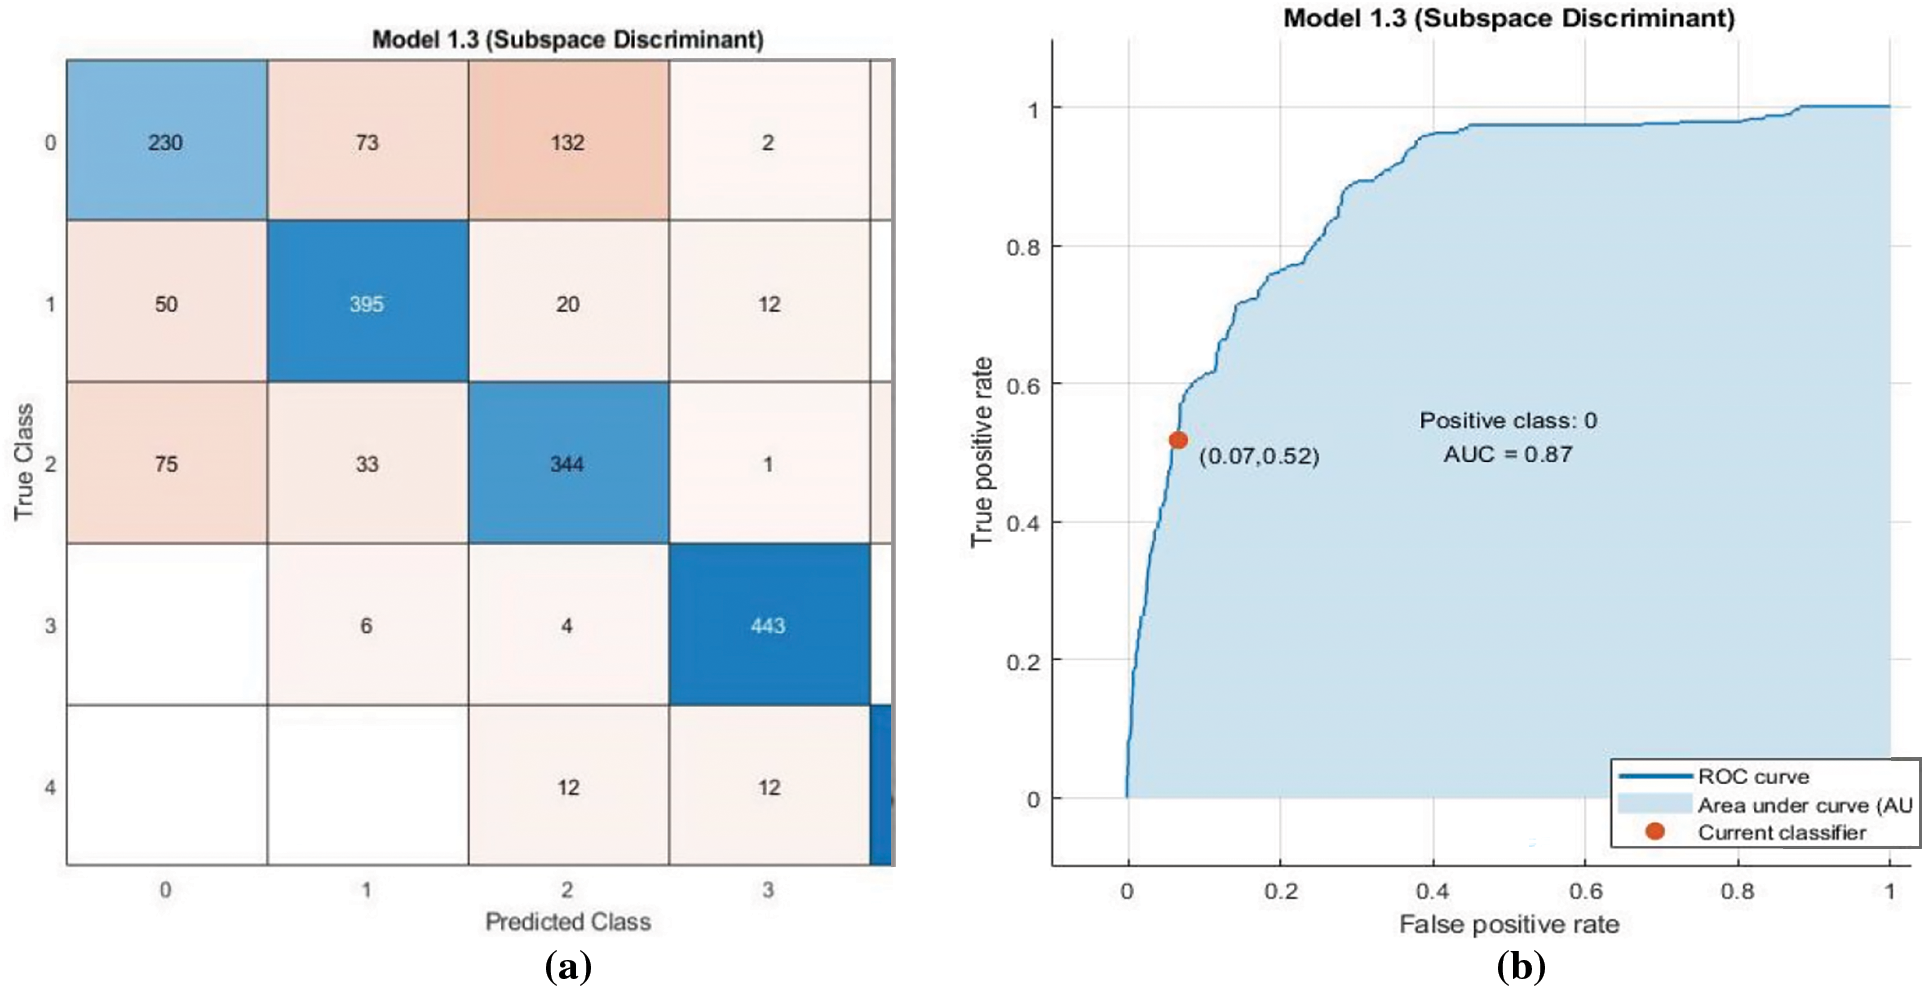
Figure 11: Ensemble subspace discriminant model confusion matrix (a) and ROC curve (b)
The ensemble RUSBoosted Trees model obtained an accuracy of 86.0%. The confusion matrix of the model is shown below in Fig. 12a. The true class values for class 0 are 343, whereas the false class values are 101. The true class values for class 1 are 415, whereas the false values are 62. The true class values for class 2 are 356, whereas the false values are 115. The true class values for class 3 are 440, whereas the false values are 13. The true class values for class 4 are 468, whereas the false values are 14. The ROC curve, with an AUC of 0.94, is shown in Fig. 12b.
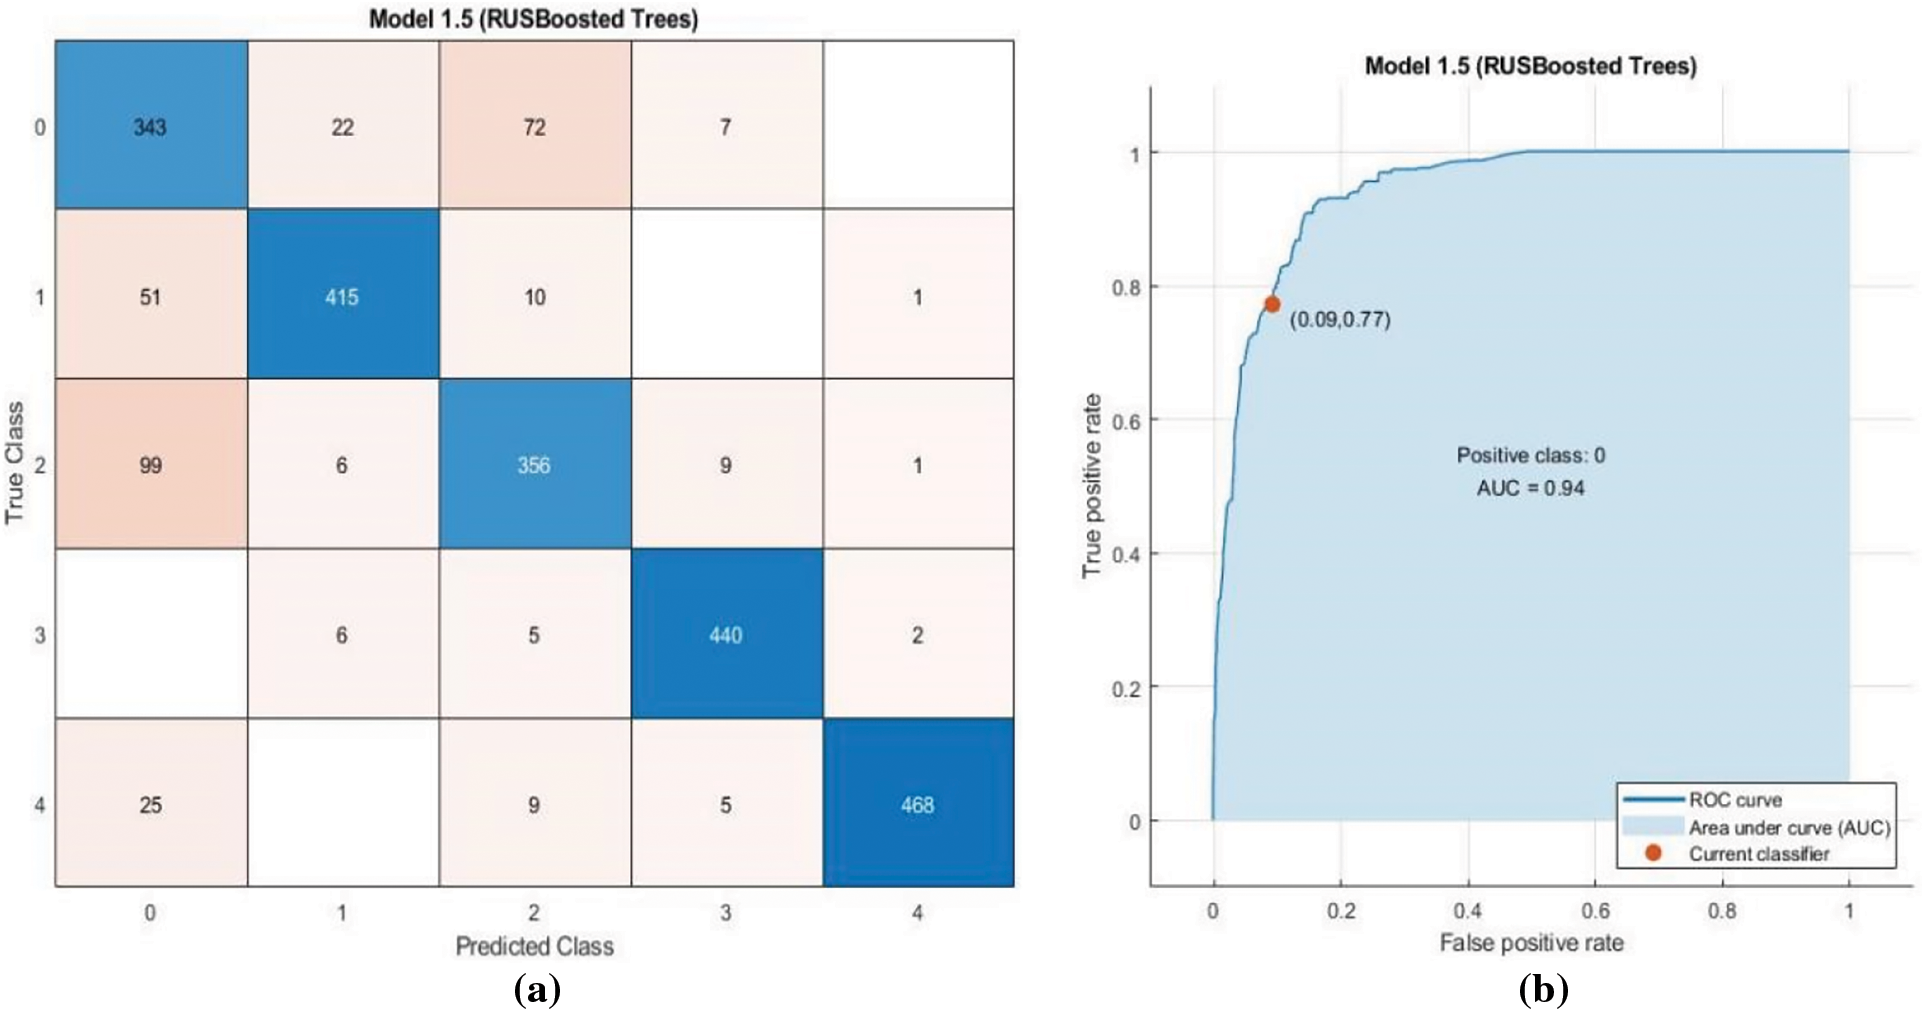
Figure 12: Ensemble RUSBoosted trees model confusion matrix (a) and ROC curve (b)
Among all the algorithms, ensemble subspace KNN generates an accuracy of 99.9% and the most precise result in classifying distinct sitting positions. The dataset was split into 70% (2350 samples) for training and 30% (1007 samples) for testing. Using the K1-fold cross-validation, the evaluation of the system gained a broader perspective, thereby improving the credibility of the results. The adoption of this procedure contributes to the resulting stability, highlighting the reliability and robustness of the ensemble subspace KNN in classifying the distinct sitting postures. Cross-validation results have been shown in Fig. 13, and the comparison of all algorithms is given in Table 3.
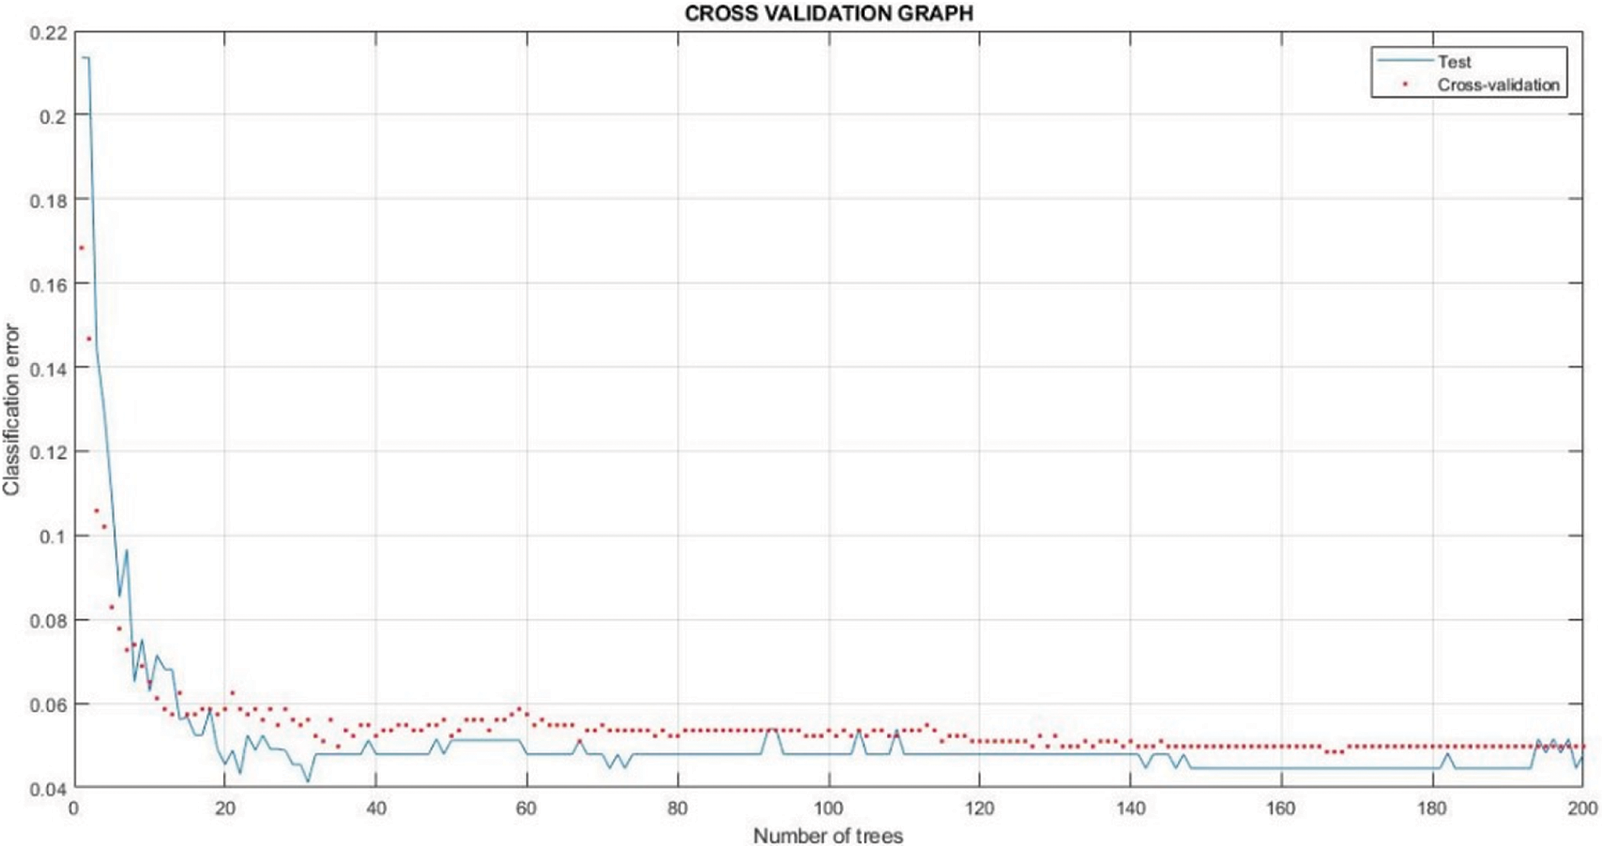
Figure 13: Ensemble subspace KNN cross-validation

An existing study [8] has also investigated a grid of 3 × 3 FSR using different algorithms for posture detection systems, which showed some promise in detecting poor postures. The high accuracy rate of the research approach demonstrates its effectiveness in real-time posture detection. The comparison of this study with the previous work is shown in Table 4.

This study utilizes FSR sensors and advanced machine learning algorithms of ensemble boosted trees, ensemble bagged trees, ensemble subspace KNN, ensemble subspace discriminant, and ensemble RUSBoosted trees outperforming the previous work with an accuracy of 99.9%, which is much higher than the accuracy of 95.41% achieved in the previous study. So, the study represents a significant advancement in the field of posture detection systems and offers a promising solution for improving the health and well-being of office workers and wheelchair users.
The proposed posture detection system utilizes machine learning classification to identify sitting postures accurately. The study addresses the critical issues related to the 3rd SDG of ensuring healthy lives and promoting well-being for all ages and underscores the importance of maintaining proper postures to prevent potential health risks. The proposed system provides practical solutions for various settings, including workplaces, individual households, and wheelchair users, seamlessly integrating into furniture and the environment, making it accessible and beneficial to a wide range of users. Implementing five machine learning algorithms shows a remarkable accuracy of 99.9% in posture identification. This outcome highlights the reliability and precision of the system. Real-time output generation and their storage on the cloud for later use, empowering the users to continuously monitor and improve their posture. This feedback mechanism helps individuals maintain correct postures. The integration of this system has the potential to promote overall well-being and productivity. This posture detection system offers practical and accurate applications that have the potential to transform alarming sitting habits into harmless sitting positions, thereby promoting overall well-being and productivity among individuals. Furthermore, the new results harmonize well with domain knowledge, confirming expected user tendencies.
Acknowledgement: None.
Funding Statement: The authors received no specific funding for this study.
Author Contributions: Study conception and design: Arsal Javaid, Areeb Abbas; data collection: Areeb Abbas, Jehangir Arshad, Sohaib Tahir Chauhdary, Mujtaba Hussain Jaffery; analysis and interpretation of results: Jehangir Arshad, Mohammad Khalid Imam Rahmani, Abdulbasid S. Banga; draft manuscript preparation: Jehangir Arshad, Mohammad Khalid Imam Rahmani, Sohaib Tahir Chauhdary, Mujtaba Hussain Jaffery, Abdulbasid S. Banga. All authors reviewed the results and approved the final version.
Availability of Data and Materials: The data used in the research work is available within the manuscript.
Conflicts of Interest: The authors declare that they have no conflicts of interest to report regarding the present study.
References
1. F. Carini, M. Mazzola, C. Fici, S. Palmeri, M. Messina et al., “Posture and posturology, anatomical and physiological profiles: Overview and current state of art,” Acta Bio Medica, vol. 88, no. 1, pp. 11–16, 2017. [Google Scholar] [PubMed]
2. W. R. Tinker, An Exploratory Study of Ergonomics in College Students. Murray, UT, USA: Murray State Theses and Dissertations, 2023. https://digitalcommons.murraystate.edu/etd/293/ (accessed on 15/05/2023). [Google Scholar]
3. D. Curone, G. M. Bertolotti, A. Cristiani, E. L. Secco and G. Magenes, “A real-time and self-calibrating algorithm based on triaxial accelerometer signals for the detection of human posture and activity,” IEEE Transactions on Information Technology in Biomedicine, vol. 14, no. 4, pp. 1098–1105, 2010. [Google Scholar] [PubMed]
4. T. D. Kounter, “The prevalence and consequences of poor posture in children and adolescents,” Senior Honors Theses, Liberty University, USA, 2019. [Google Scholar]
5. N. Quka, D. Stratoberdha and R. Selenica, “Risk factors of poor posture in children and its prevalence,” Academic Journal of Interdisciplinary Studies, vol. 4, no. 3, pp. 97–102, 2015. [Google Scholar]
6. K. S. Jung, J. H. Jung, T. S. In and H. Y. Cho, “Effects of prolonged sitting with slumped posture on trunk muscular fatigue in adolescents with and without chronic lower back pain,” Medicina, vol. 57, no. 1, pp. 3–5, 2020. [Google Scholar] [PubMed]
7. B. Minghelli, “Musculoskeletal spine pain in adolescents: Epidemiology of non-specific neck and low back pain and risk factors,” Journal of Orthopaedic Science, vol. 25, no. 5, pp. 776–780, 2020. [Google Scholar] [PubMed]
8. M. H. Jaffery, M. A. Ashraf, A. Almogren, H. M. Asim, J. Arshad et al., “FSR-based smart system for detection of wheelchair sitting postures using machine learning algorithms and techniques,” Journal of Sensors, vol. 2022, pp. 1–10, 2022. [Google Scholar]
9. A. B. Haag, “Ergonomic standards, guidelines, and strategies for prevention of back injury,” Occupational Medicine, vol. 7, no. 1, pp. 155–165, 1992. [Google Scholar] [PubMed]
10. F. Bell, “Ergonomic aspects of equipment,” International Journal of Nursing Studies, vol. 24, no. 4, pp. 331–337, 1987. [Google Scholar] [PubMed]
11. O. O. Aje, B. Smith-Campbell and C. Bett, “Preventing musculoskeletal disorders in factory workers: Evaluating a new eight minute stretching program,” Workplace Health & Safety, vol. 66, no. 7, pp. 343–347, 2018. [Google Scholar]
12. M. Alaqeel and M. Tanzer, “Improving ergonomics in the operating room for orthopaedic surgeons in order to reduce work-related musculoskeletal injuries,” Annals of Medicine and Surgery, vol. 56, pp. 133–138, 2020. [Google Scholar] [PubMed]
13. S. M. Reitz, M. E. Scaffa and J. Dorsey, “Occupational therapy in the promotion of health and well-being,” American Journal of Occupational Therapy, vol. 74, no. 3, pp. 1–14, 2020. [Google Scholar]
14. V. K. Sinha, K. K. Patro, P. Pławiak and A. J. Prakash, “Smartphone-based human sitting behaviors recognition using inertial sensor,” Sensors, vol. 21, no. 19, pp. 6652, 2021. [Google Scholar] [PubMed]
15. J. Roh, H. J. Park, K. J. Lee, J. Hyeong, S. Kim et al., “Sitting posture monitoring system based on a low-cost load cell using machine learning,” Sensors, vol. 18, no. 1, pp. 208, 2018. [Google Scholar] [PubMed]
16. Q. Hu, X. Tang and W. Tang, “A smart chair sitting posture recognition system using flex sensors and FPGA implemented artificial neural network,” IEEE Sensors Journal, vol. 20, no. 14, pp. 8007–8016, 2020. [Google Scholar]
17. M. Li, Z. Jiang, Y. Liu, S. Chen, M. Wozniak et al., “Sitsen: Passive sitting posture sensing based on wireless devices,” International Journal of Distributed Sensor Networks, vol. 17, no. 7, 2021. https://doi.org/10.1177/15501477211024846 [Google Scholar] [CrossRef]
18. X. Zhang, J. Fan, T. Peng, P. Zheng, C. Lee et al., “A privacy-preserving and unobtrusive sitting posture recognition system via pressure array sensor and infrared array sensor for office workers,” Advanced Engineering Informatics, vol. 53, pp. 101690, 2022. [Google Scholar]
19. J. Ahmad, J. Sidén and H. Andersson, “A proposal of implementation of sitting posture monitoring system for wheelchair utilizing machine learning methods,” Sensors, vol. 21, no. 19, pp. 6349, 2021. [Google Scholar] [PubMed]
20. J. E. Estrada and L. A. Vea, “Real-time human sitting posture detection using mobile devices,” in IEEE Region 10 Symp. (TENSYMP), Bali, Indonesia, pp. 140–144, 2016. [Google Scholar]
21. J. Meyer, B. Arnrich, J. Schumm and G. Troster, “Design and modeling of a textile pressure sensor for sitting posture classification,” IEEE Sensors Journal, vol. 10, no. 8, pp. 1391–1398, 2010. [Google Scholar]
22. L. Yuan and J. Li, “Smart cushion based on pressure sensor array for human sitting posture recognition,” in IEEE Sensors, Sydney, Australia, pp. 1–4, 2021. [Google Scholar]
23. G. Liang, J. Cao and X. Liu, “Smart cushion: A practical system for fine-grained sitting posture recognition,” in IEEE Int. Conf. on Pervasive Computing and Communications Workshops (PerCom Workshops), Kona, HI, USA, pp. 419–424, 2017. [Google Scholar]
24. W. Cun, R. Mo, J. Chu, S. Yu, H. Zhang et al., “Sitting posture detection and recognition of aircraft passengers using machine learning,” Artificial Intelligence for Engineering Design, Analysis and Manufacturing, vol. 35, no. 3, pp. 284–294, 2021. [Google Scholar]
25. S. Liaqat, K. Dashtipour, K. Arshad, K. Assaleh and N. Ramzan, “A hybrid posture detection framework: Integrating machine learning and deep neural networks,” IEEE Sensors Journal, vol. 21, no. 7, pp. 9515–9522, 2021. [Google Scholar]
26. B. Ribeiro, L. Martins, H. Pereira, R. Almeida, C. Quaresma et al., “Sitting posture detection using fuzzy logic development of a neuro-fuzzy algorithm to classify postural transitions in a sitting posture,” in Proc. of Int. Conf. on Health Informatics (HEALTHINF-2015), Setúbal, Portugal, pp. 191–199, 2015. [Google Scholar]
27. L. C. K. Chin, K. S. Eu, T. T. Tay, C. Y. Teoh and K. M. Yap, “A posture recognition model dedicated for differentiating between proper and improper sitting posture with kinect sensor,” in IEEE Int. Symp. on Haptic, Audio and Visual Environments and Games (HAVE), Subang Jaya, Malaysia, pp. 1–5, 2019. [Google Scholar]
28. R. Gupta, D. Saini and S. Mishra, “Posture detection using deep learning for time series data,” in Third Int. Conf. on Smart Systems and Inventive Technology (ICSSIT), Tirunelveli, India, IEEE, pp. 740–744, 2020. [Google Scholar]
29. R. O. Ogundokun, R. Maskeliūnas, S. Misra and R. Damasevicius, “A novel deep transfer learning approach based on depth-wise separable CNN for human posture detection,” Information, vol. 13, no. 11, pp. 520, 2022. [Google Scholar]
30. J. Arshad, H. M. Asim, M. A. Ashraf, M. H. Jaffery, K. S. Zaidi et al., “An intelligent cost-efficient system to prevent the improper posture hazards in offices using machine learning algorithms,” Computational Intelligence and Neuroscience, vol. 2022, pp. 1–9, 2022. [Google Scholar]
31. T. Windeatt and G. Ardeshir, “Boosted tree ensembles for solving multiclass problems,” in Multiple Classifier Systems: Third Int. Workshop, Cagliari, Italy, pp. 42–51, 2002. [Google Scholar]
32. Y. Freund and R. E. Schapire, “Experiments with a new boosting algorithm,” in Int. Conf. on Machine Learning, New Jersey, USA, vol. 96, pp. 148–156, 1996. [Google Scholar]
33. L. Breiman, “Bagging predictors,” Machine Learning, vol. 24, no. 2, pp. 123–140, 1996. [Google Scholar]
34. P. Bühlmann, “Bagging, boosting and ensemble methods,” In: J. E. Gentle, W. K. Härdle and Y. Mori (Eds.Handbook of Computational Statistics: Concepts and Methods, pp. 985–1022, Berlin, Heidelberg: Springer Berlin Heidelberg, 2012. [Google Scholar]
35. R. Caruana, A. Niculescu-Mizil, G. Crew and A. Ksikes, “Ensemble selection from libraries of models,” in Proc. of the Twenty-First Int. Conf. on Machine Learning, Banff, Canada, pp. 18–26, 2004. [Google Scholar]
36. C. Drummond and R. C. Holte, “C4.5, Class imbalance, and cost sensitivity: Why under-sampling beats over-sampling,” in Workshop on Learning from Imbalanced Datasets II, vol. 11, pp. 1–8, 2003. [Google Scholar]
37. M. Naser and A. H. Alavi, “Error metrics and performance fitness indicators for artificial intelligence and machine learning in engineering and sciences,” Architecture, Structures and Construction, vol. 14, pp. 1–19, 2021. [Google Scholar]
Cite This Article
 Copyright © 2023 The Author(s). Published by Tech Science Press.
This work is licensed under a Creative Commons Attribution 4.0 International License , which permits unrestricted use, distribution, and reproduction in any medium, provided the original work is properly cited.
 Downloads
 Citation Tools