
 Submit a Paper
 Propose a Special lssue
 Open Access
ARTICLE

Multiple-Object Tracking Using Histogram Stamp Extraction in CCTV Environments
1 Division of AI Computer Science and Engineering, Kyonggi University, Suwon, 16227, Korea
2 Contents Convergence Software Research Institute, Kyonggi University, Suwon, 16227, Korea
* Corresponding Author: Kyungyong Chung. Email:
Computers, Materials & Continua 2023, 77(3), 3619-3635. https://doi.org/10.32604/cmc.2023.043566
Received 06 July 2023; Accepted 14 November 2023; Issue published 26 December 2023
 View Full Text
 Download PDF
Abstract
Object tracking, an important technology in the field of image processing and computer vision, is used to continuously track a specific object or person in an image. This technology may be effective in identifying the same person within one image, but it has limitations in handling multiple images owing to the difficulty in identifying whether the object appearing in other images is the same. When tracking the same object using two or more images, there must be a way to determine that objects existing in different images are the same object. Therefore, this paper attempts to determine the same object present in different images using color information among the unique information of the object. Thus, this study proposes a multiple-object-tracking method using histogram stamp extraction in closed-circuit television applications. The proposed method determines the presence or absence of a target object in an image by comparing the similarity between the image containing the target object and other images. To this end, a unique color value of the target object is extracted based on its color distribution in the image using three methods: mean, mode, and interquartile range. The Top-N accuracy method is used to analyze the accuracy of each method, and the results show that the mean method had an accuracy of 93.5% (Top-2). Furthermore, the positive prediction value experimental results show that the accuracy of the mean method was 65.7%. As a result of the analysis, it is possible to detect and track the same object present in different images using the unique color of the object. Through the results, it is possible to track the same object that can minimize manpower without using personal information when detecting objects in different images. In the last response speed experiment, it was shown that when the mean was used, the color extraction of the object was possible in real time with 0.016954 s. Through this, it is possible to detect and track the same object in real time when using the proposed method.Keywords
Closed-circuit television (CCTV) systems analyze collected images and are used for traffic monitoring, crime prevention, suspect tracking, and industrial observations. CCTV plays a crucial role in global crime prevention and its use is rapidly increasing. What was once a fast adoption rate limited to developed countries in the past is now experiencing significant growth in both industrialized and developing nations [1]. Recently, the number of CCTV installations has rapidly increased. For example, in Korea, the number of CCTV installations was 1,458,465 in 2022, a 400% increase from that in 2011 [2]. As most CCTVs are installed in a specific location and record only a specific place, they have blind spots that cannot be recorded; thus, additional CCTVs must be installed to eliminate these blind spots. In most cases, images captured using two or more devices must be compared and analyzed to use these images effectively. The comparison and analysis of captured images are labor-intensive tasks when used for real-time monitoring. However, there is a lack of labor force compared to the rapid increase in CCTV installations, which has resulted in management and control difficulties.
CCTV is installed in public places and is used for security, crime, fire prevention, and safety management in facilities. In addition, CCTV is used not only for criminal investigations and public order maintenance but also for searching for missing persons. In these cases, two or more CCTV systems are used to identify the same object. A model that determines whether the objects are the same is required when the same objects are present in two or more images. Therefore, in recent years, studies have focused on identifying the same object using different images. Face-detection technology is the most widely used method for detecting the same object in multiple images. However, recent developments in big data technology have raised serious concerns related to privacy infringement and personal information protection. Therefore, it is necessary to find unique characteristics without using a person’s personal information, such as their face. Therefore, this study proposes a method for detecting the same object in multiple CCTV environments. The proposed method determines the same object using the color of the object present in the image. When using the color of an object, the color characteristics of the object existing throughout the image are used. To this end, a histogram stamp, which is object-specific color information, is generated using an abbreviation method of repeated colors in a certain number or more frames. The same object is determined by comparing the generated histogram stamp. The contributions of the proposed method are as follows:
• The proposed method extracts and tracks multiple objects within a single image and compares their unique color information with objects in other images. In this case, the external background color of the object may be removed by adding an internal margin when detecting the object, which can enable more accurate object detection.
• For video analysis using CCTV, it is common to use two or more videos to detect the same object. This often necessitates a significant allocation of human resources. However, this study automates the analysis by reducing labor costs, while enabling real-time object detection.
• A histogram stamp, which is a unique color of an object, is extracted using a red, green, and blue (RGB) histogram. The histogram stamp compresses the information about an object present in an image when determining the object. This process reduces the time required to compare the different objects. Furthermore, although it does not use personal information such as face recognition, it achieves a similar performance, which makes it relatively secure.
• The generated histogram stamp was compared in real-time with an object present in another image. This enables multilateral and wide-area exploration, unlike simple monitoring, and therefore enables efficient use of CCTV.
The remainder of this paper is organized as follows: In Section 2, an object-detection model using deep learning and object-tracking algorithms is described. In Section 3, multiple-object tracking using the proposed histogram stamp extraction from multiple CCTV is described. In Section 4, the results and performance evaluation are described. Finally, conclusions are presented in Section 5.
2.1 Object Detection Model Using Deep Learning
Object detection is a crucial computer-vision technology for identifying and locating objects within images [3]. There are two main approaches to object detection: one-stage and two-stage detection [4]. The two-stage detector first estimates the positions of the objects and subsequently determines their classes [5]. Although this approach is complex, it offers high accuracy owing to its multi-stage processing [6]. In contrast, the one-stage detector simplifies the process by simultaneously performing positional estimation and classification using a convolutional neural network [7]. It processes the entire image simultaneously, resulting in faster detection but lower accuracy. The You Only Look Once (YOLO) model is a pioneering one-stage detector known for its real-time processing capabilities [8].
In the YOLO model, an image is divided into a grid, and position estimation and classification are performed within the grid cells [9]. Bounding boxes are generated in grid cells where object positions are predicted. Each box is associated with a confidence score that indicates the likelihood of containing an object [10]. The object’s class is determined using the intersection over union (IoU), which is a metric for measuring detection accuracy [11]. A higher IoU value indicates a more accurate bounding box prediction in the proximity of the object [12]. YOLO has various hyperparameters such as learning rate, batch size, and network depth. Therefore, performance can be improved by adjusting various parameter settings and hyperparameters.
Detection methods using deep learning are mainly used for human detection in the computer vision field. Detectors based on convolutional neural networks are mainly used for human detection during complex vision tasks. In particular, high accuracy and fast speed are essential to quickly detect people in a real-time environment. To this end, research is being conducted on learning optimized deep learning models and using hardware accelerators. These methodologies are being studied with various datasets and are mainly used in fields such as security surveillance, smart cities, etc.
Historically, image processing has relied on feature-generation methods to determine object position and shape. Notable methods include the histogram of oriented gradients (HOG) [13], which uses object contour information to calculate gradients. This feature renders it suitable for objects with distinctive contours, but less effective for rotated or substantially altered objects [14]. In contrast, scale-invariant feature transform (SIFT) is a versatile method that can identify objects regardless of the changes in shape, size, and rotation [15]. SIFT extracts feature vectors from identifiable feature points in an image and local patches around these points, thereby providing robustness against changes [16].
Algorithms such as simple online and real-time tracking (SORT) have been used for real-time—multiple-object tracking [17]. SORT uses bounding box information, Kalman filtering, and IoU matching to connect detected and predicted results [18]. However, IoU-based matching can lead to identity switching when occlusions occur, thereby introducing tracking errors [19]. To address this, DeepSORT was introduced, which enhances SORT using deep-learning techniques [20]. DeepSORT incorporates a track-checking process and achieves lower identity switching and higher tracking accuracy compared to SORT [21]. TrackFormer, which tracks objects using transformer architecture, was recently proposed in the field of object tracking using deep learning [22]. When the TrackFormer tracks an object, it splits the input sequence into object units and predicts the position, velocity, and acceleration of each object. Unlike other object-tracking models, this model uses an input sequence with time. Accordingly, the input sequence information is divided and the object information in the previous frame is used to predict the tracking in the next frame. Using the self-attention mechanism of the transformer model offers the advantages of better connectivity and feature information between objects. However, this model is very large and incurs high computational costs because it uses transformer architecture. This increases the learning and inference times and makes it difficult to implement an efficient model. Further, in long-term tracking, previous information has an excessive influence, and therefore, errors accumulate, or tracking becomes difficult.
3 Multiple-Object Tracking Using Histogram Stamp Extraction in CCTV Environments
In this study, a case in which images recorded on several CCTV are used is defined as a multiple-CCTV environment. In a multiple-CCTV environment, real-time equal object detection and tracking comprise a four-stage process. Fig. 1 shows the proposed multiple-object-tracking method using histogram stamp extraction in CCTV environments. The first stage was the data configuration stage. At this stage, an image dataset is obtained by extracting a human object from an image and storing the extracted human object for each frame.
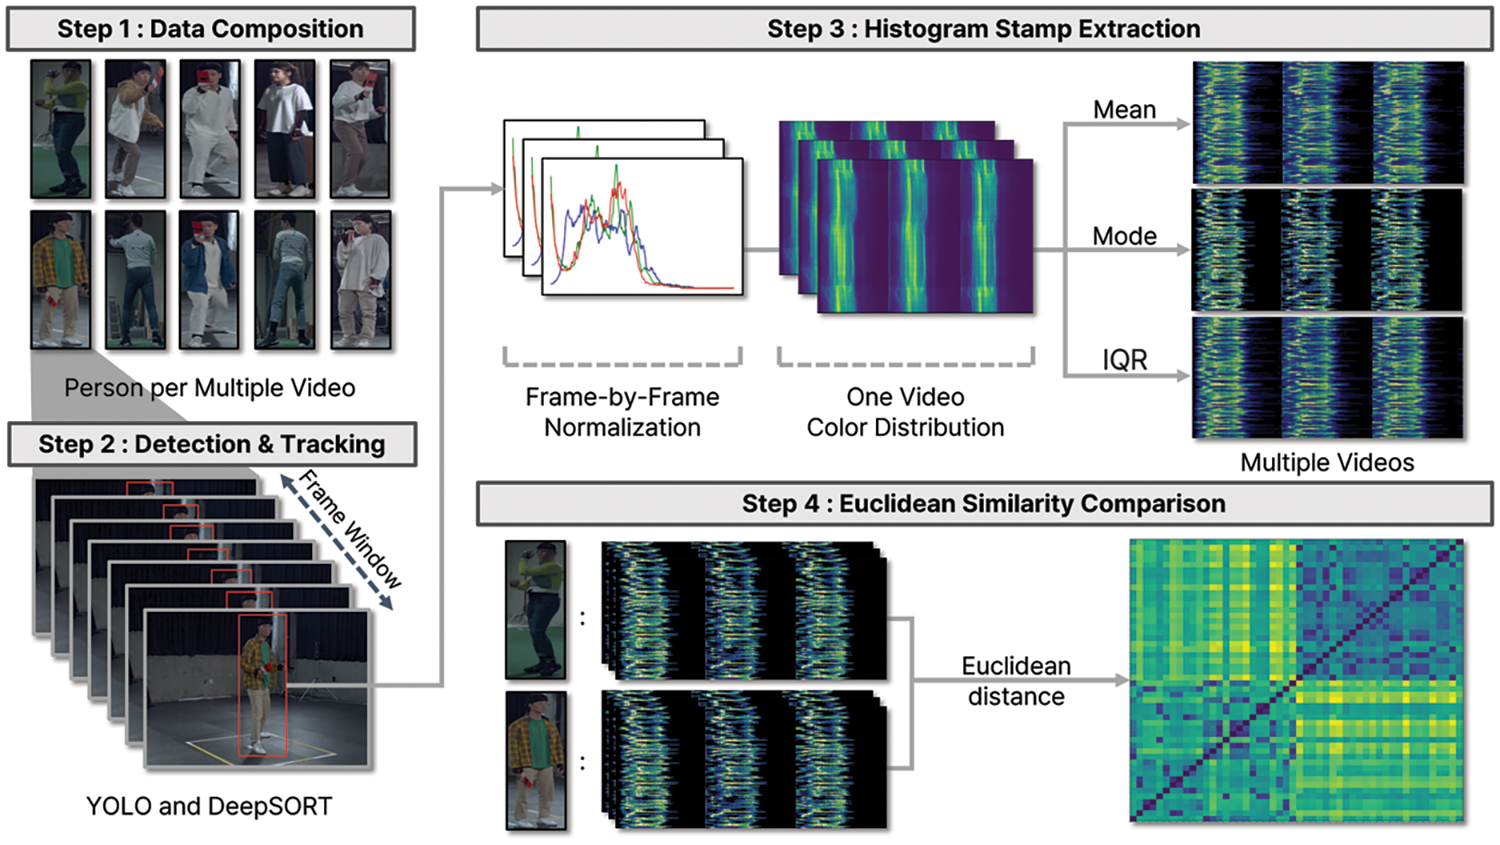
Figure 1: Multiple-object tracking using histogram stamp extraction in CCTV environments
The second stage is the object detection and tracking stage, wherein object detection is performed using YOLO, a deep-learning-based object-detection algorithm, and DeepSORT, which is used for object tracking. A frame window (FW) was used as the input for object detection and tracking. FW refers to a frame generated while tracking an object in an image. FW is used to perform tasks on continuous data, such as video streams or image sequences. Existing images include multiple objects and background information in addition to objects; however, FW is a newly created frame based on the size of the object to be tracked. Thus, if FW is used, information about an object can be collected without any adjustments.
The third step is the histogram extraction and conversion step, in which the color of the object detected using FW in the previous step is extracted using an RGB histogram [23]. A reduction algorithm is used to convert the values of the generated histogram into a single unique color value. In the third step in Fig. 1, the color of the object is extracted from all frames generated from one image. Afterward, normalization is performed to minimize the difference in distribution values depending on the size of objects present in the image. Multiple normalized color information generated from one image is reduced to one numerical value using mean, mode, and interquartile range (IQR) methods. This is called a histogram stamp. The final picture of the third step depicts histogram stamps of different images of the same person. If you check the RGB channels separately, they are all skewed to the left, meaning they show a similar distribution.
The final step detects the same object in different images using histogram stamps. At this time, Euclidean distance was used to compare the similarity of histogram stamps. In a heat map that visualizes similarity, the darker the color, the higher the similarity.
3.1 Object Detection and Tracking to Generate an Object Histogram Stamp
Human motion images of an AI Hub were used in this study [24]. Each image is a recording of 5- to 10-s motions of approximately 50 types of human actions, such as walking, sitting, playing basketball, fencing, and jumping rope. The image data consisted of images of a single person captured from multiple angles. Image data shot from different angles have the same function as the images recorded from different locations on CCTV. Therefore, different people wearing different clothes were selected, each person’s data was collected with 10 video clips per individual, and a dataset of 1,000 images was constructed. The constructed data were used to validate the object detection and tracking results.
First, it must be possible to detect and track objects in each image to identify the same object in multiple CCTV environments. The YOLO v5 model was used to detect objects in an image [25] because it uses PyTorch, unlike previous models, and it is convenient and fast. In this study, the objects and classes to be detected are humans; therefore, a confidence threshold, which indicates the probability of an object being present, is used to enable more accurate detection. The confidence threshold used in this study was selected at 0.6. Confidence scores above 0.6 are considered because these values can be used to perform nonmax suppression (NMS), which is a technique for enabling the YOLO model to generate an accurate bounding box [26]. In addition, the color of the object is used to determine whether the object is the same; therefore, the accuracy can decrease if a color exists in the background. To resolve this problem, an additional margin was added to the bounding box when YOLO was used for detection. This enables the collection of color-based information on clothes worn on the torso and legs of the object. This additional margin is referred to as the internal margin. Although semantic segmentation enables more accurate color extraction because it requires substantial computation time, real-time response performance cannot be expected. Therefore, this method was not an option.
YOLO generates a bounding box as the output when an object is present in the input image. The generated bounding box has object-centered coordinates, that is, the x- and y-axis coordinates, and four coordinate values, including the width and height values. The coordinates of the generated bounding box were received as OpenCV NumPy values, converted into tensor values for object tracking using a torch, and delivered to DeepSORT. Then, the object information delivered by YOLO was used along with DeepSORT for object tracking. DeepSORT exhibits a high detection rate and fast-tracking speed when the object being tracked is hidden from sight for a long time; therefore, it can be applied in real time [27]. All people are detected when the object is tracked using a single YOLO model, even when many people exist in one image. If DeepSORT is used in such cases, a unique ID is created for each detected object, and the object assigned to such an ID can be tracked. Even when an object appears in the next frame, this approach can assign a new ID and perform detection and tracking tasks. Therefore, it is possible to detect the same object and track continuous movements in a single image. Fig. 2 shows the object detection and tracking results obtained from one image.
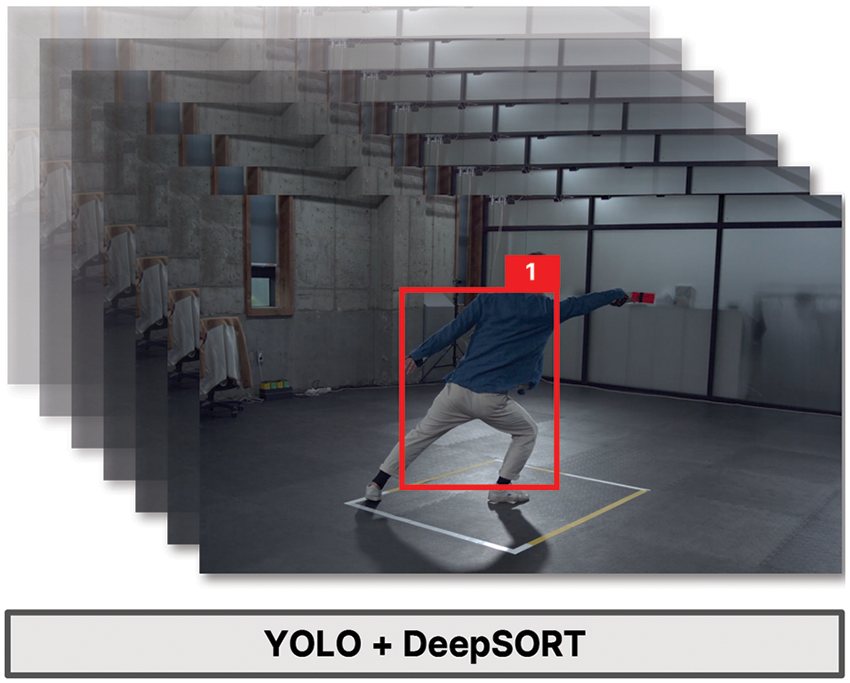
Figure 2: Object detection and tracking results obtained from one image
Fig. 2 shows a rectangular bounding box containing an internal margin smaller than the size of each object generated in the area where each object exists. Each object in the same class was assigned a unique number.
3.2 Object Histogram Stamp Extraction and Pre-Processing
An RGB histogram is used to identify the features of an object in an image, and an object-histogram stamp that extracts the unique color features of the object is then generated. The histogram extracts the color of the object in an image through the three RGB channels. The bounding box of the object generated by YOLO was used as the input for histogram extraction. At this point, the bounding box is variably generated, depending on the size of the object in an image. Even if the objects are the same, this induces a difference in the number of pixels, depending on the size identified in the image. When images of different sizes have different color distributions, the colors that are determined to be the same may be recognized differently. Therefore, normalization was performed to reduce the variability in the input data and obtain consistent results. During normalization, the number of dimensions can be reduced to two to decrease the computational complexity resulting from retrieval when using a histogram. However, in this study, all clothing color information was used to determine the status of the same object and enhance the precision and accuracy of object tracking. Therefore, no dimension reduction was used, and all channels were employed to determine the same object status. Normalization divides each pixel using the maximum frequency value of the pixels per RGB color channel. After normalization, the minimum frequency value of all the color channels was above 0, and the maximum value did not exceed 1. In addition, the post-normalization frequency is proportional to the frequency of the color value of a pre-existing pixel [28]. The normalized frequencies were combined into one array per frame and saved as an array of size 768.
An FW is used for this array in an image rather than a frame. An object color feature that integrates the bounding boxes generated per frame is required when using FW. To this end, an object-histogram stamp reflecting the color features of an object in an FW was generated. The histograms can be classified based on two features when using an FW to list histograms extracted per frame. The first feature indicates that the same color value continues to exist, implying that the object is likely to wear clothes of a given color. This is because the object remains fixed while tracking the movement of the object in one image. By contrast, the second feature indicates that it is likely that the background is included in the bounding box when a color value repeatedly exists and disappears. This is because the color of the central object is the same as the object moves in one image, but the background behind the object changes as it moves. One of the collected images was used in the experiment to confirm this. A heat map visualizing the RGB color distribution obtained from processing one image was extracted. Fig. 3 shows a heat map that visualizes the object color values obtained from a single image.
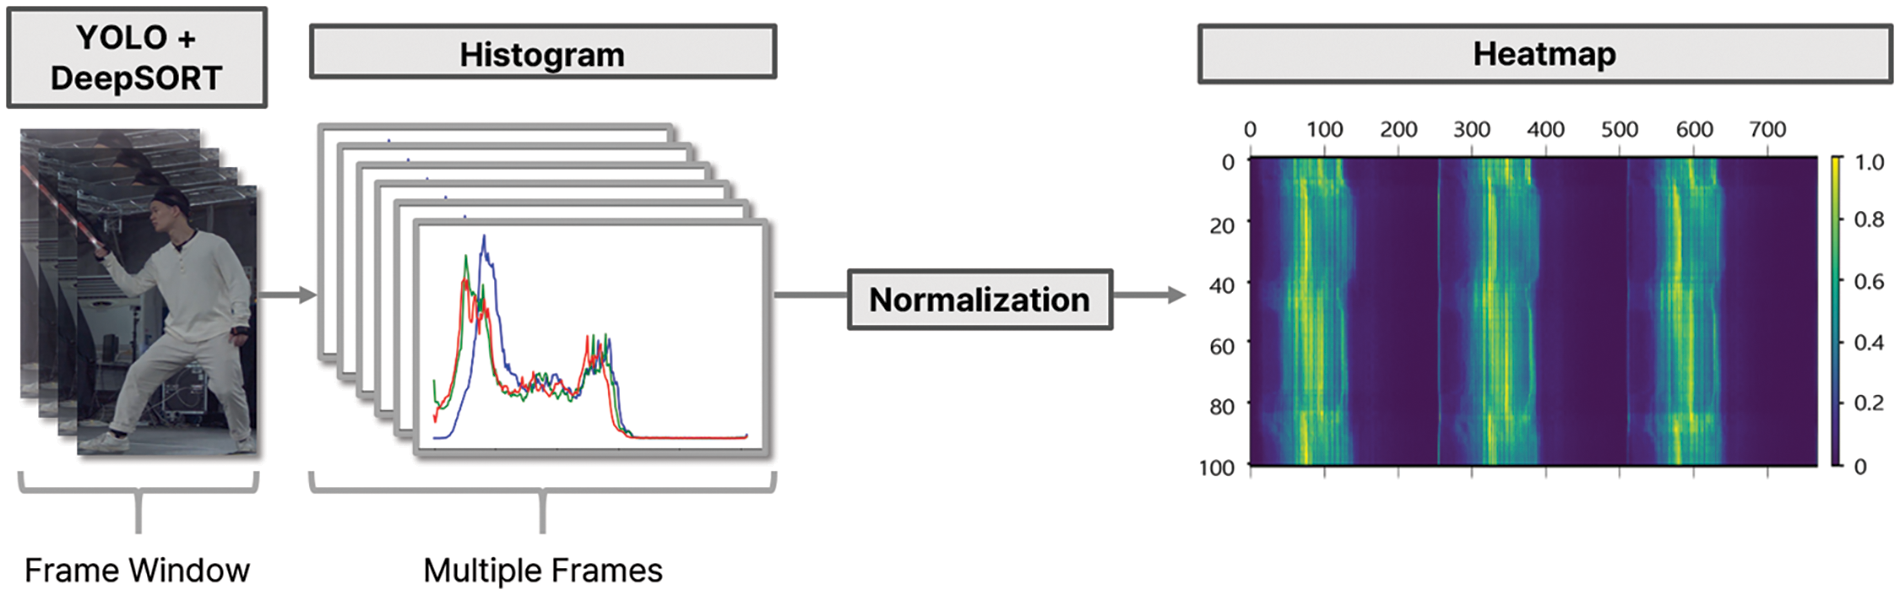
Figure 3: Heat map visualizing the object color values obtained from a single image
In Fig. 3, the horizontal axis represents the color values of the green, blue, and red channels, and the vertical axis represents the number of frames. Each part of the horizontal axis contained 256 color values; therefore, the total size was 768. The heat map shown in Fig. 3 is skewed to the left in each channel. If the graph is skewed to the left, this implies that the color values of the extracted objects are in the gray range. This is because the color of the clothes worn by the object in the input image is gray.
When an FW was used, it was confirmed that information other than the color of the object could also be included. To solve this problem, the color histogram generated in FW was quantified, and only the unique color value of the object was extracted. This is known as the object-histogram stamp. The mean, mode, and IQR methods were used to extract the object-histogram stamps. Using the mean is the most common method for summarizing data distributions. The mean is widely employed in statistical analysis and proves useful when compared with other datasets. Furthermore, it helps in understanding the central tendency of data. Therefore, the mean is used to generate a histogram stamp. Algorithm 1 describes the process of extracting a histogram stamp by using the mean.

Algorithm 1 uses the mean to generate the histogram stamp. The data used as input was a normalized array of object color information collected from the initial input image. The number of rows of data was stored because the data were entered. The number of rows was equal to the number of frames in the input video. Using the mean is advantageous as it reflects the overall trend of the entire image. However, it is susceptible to outliers when they exist.
When reflecting the characteristics of objects in an image where the color remains relatively consistent, the mode is more likely to best represent the central tendency. Additionally, color information in objects often consists of only a few distinct values, making it crucial to determine which value occurs most frequently. Therefore, the mode is employed to create a histogram stamp. When using the mode value, that is, the second method, the color value obtained by preprocessing the value of the RGB histogram generated in the FW is used. Each preprocessed color value has a minimum value of 0 and a maximum value of 1 for each RGB color. Algorithm 2 presents the process of extracting a histogram stamp using this mode.
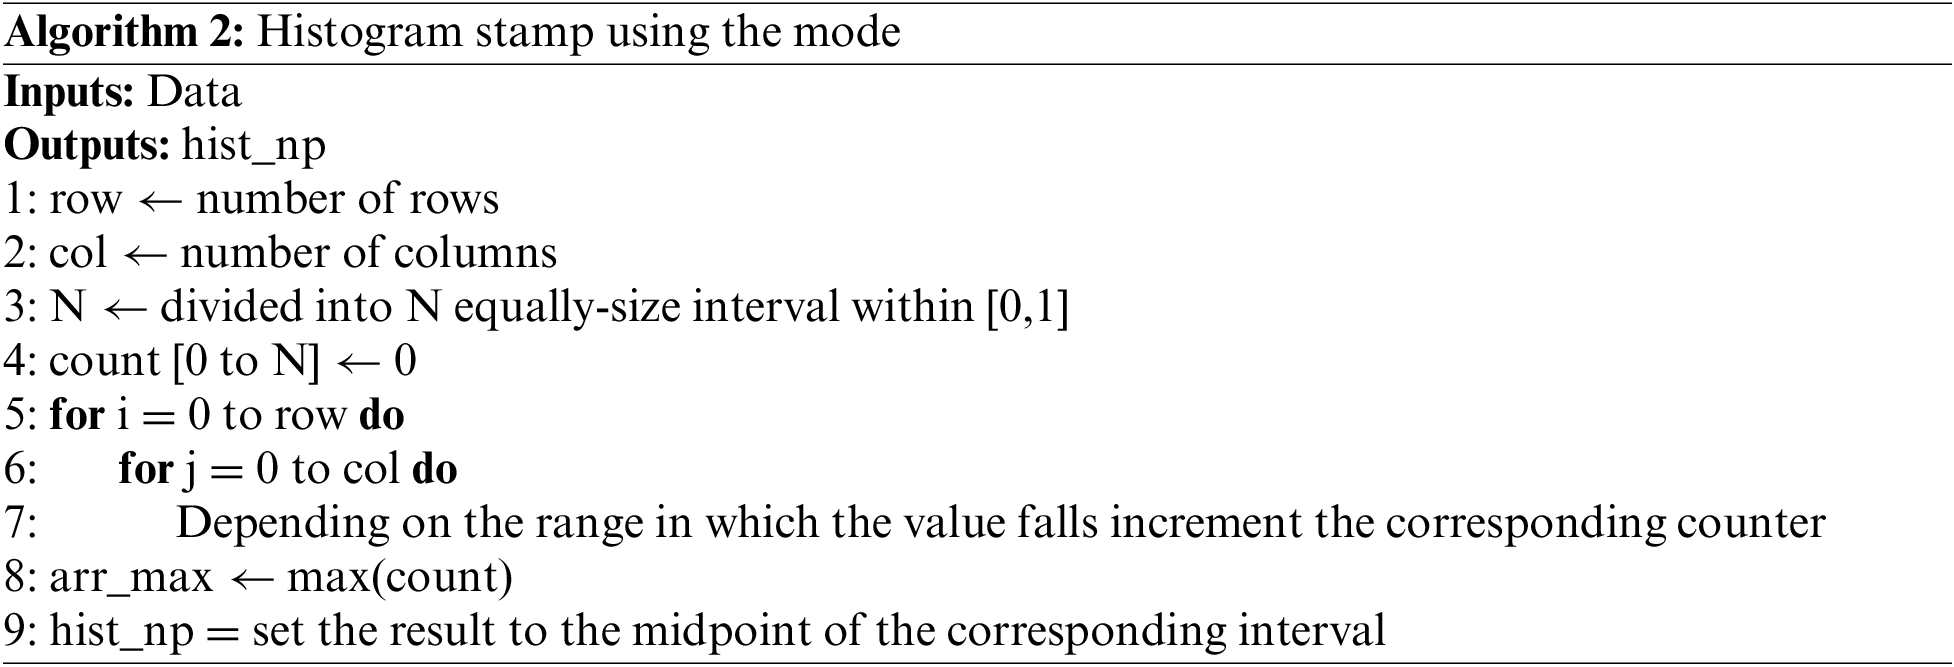
Algorithm 2 uses the least common denominator to generate the histogram stamp. The data used as input were the same as those in Algorithm 1. The number of rows and columns was counted once the data were entered. The number of rows represents the number of frames in the input video, and the number of columns is 768, which is the sum of the R, G, and B color-channel values. The third line, N, represents the number of subintervals into which the interval from 0 to 1 is divided. For example, if N = 2, the range can be divided between 0 to 0.6 and 0.6 to 1. In general, increasing the size of N to create more intervals improves accuracy; however, it has the disadvantage of being time-consuming. Next, we counted and stored the ranges in which the color values in each row fell. Subsequently, the median of the range of the most common colors in each column was selected from arr_max and stored as a representative value for the column.
In the third method, the IQR is used to generate an object-histogram stamp. IQR is relatively less sensitive to outliers in the data. IQR simultaneously provides information about the central tendency of the data, represented by the median, and the spread of the data, indicated by the range. This provides richer insights into the data distribution. Lastly, IQR is a non-parametric method, making it useful even when data does not follow a normal distribution. Unlike other metrics such as the mean and mode, which are often most effective when assuming a normal distribution, IQR does not rely on this assumption. Therefore, as a final approach, IQR is used to generate histogram stamp. Eq. (1) was used to calculate the IQR.
In Eq. (1), N represents the total number of datasets. When all data are aligned in ascending order, Q1 is the first quartile and is the data within the 25% range of all data. Q3 is the third quartile and is the data within the 75% range of the total data. IQR is the value obtained after subtracting the first quartile from the third quartile and is multiplied by a weight of 1.5 to come close to the standard normal distribution. This multiplication is performed to identify the observed values exceeding the range by a factor of 1.5 as outliers.
Finally, only 50% of the data was used, and the confidence interval used in the standard regularity table was 95%. All data outside the confidence interval range were processed as outliers to increase performance. Algorithm 3 shows the method for extracting a histogram stamp using the IQR.
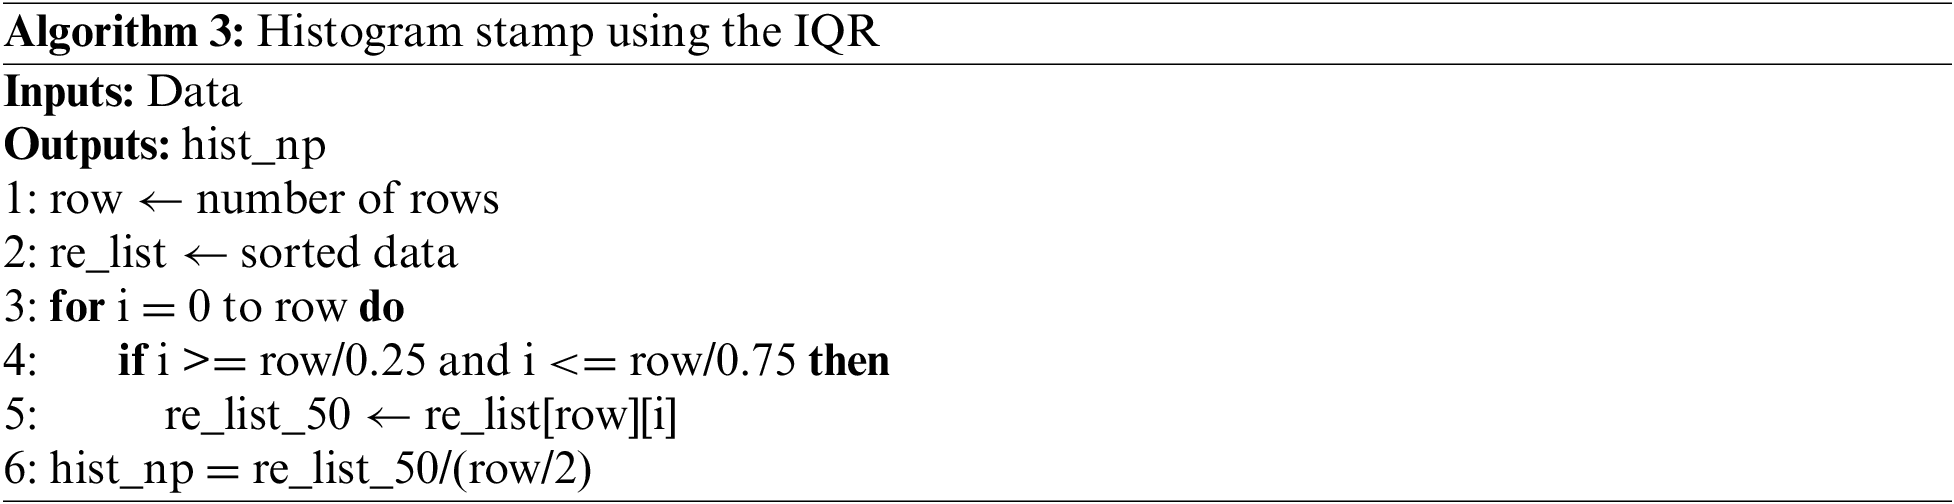
Algorithm 3 uses IQR to generate a histogram stamp. The data used for input is the same as Algorithm 1. IQR uses only the middle 50% of the data. Therefore, for each input, check whether it is the middle 50% and store it in re_list_50. Afterwards, normalization is additionally performed based on the median value of the data and stored in hist_np.
The performance of the three methods used to extract the unique histogram stamp of an object in an image was compared. Fig. 4 shows the visualized results of the object-histogram stamp extraction process. As shown in Fig. 3, data from a person wearing white clothing were used. Therefore, in Fig. 4, the same left-leaning graph is generated per color channel in all cases where the mean, mode, or IQR method is used. However, each method has its characteristics because the spacing and color of the graph are not constant depending on the method.
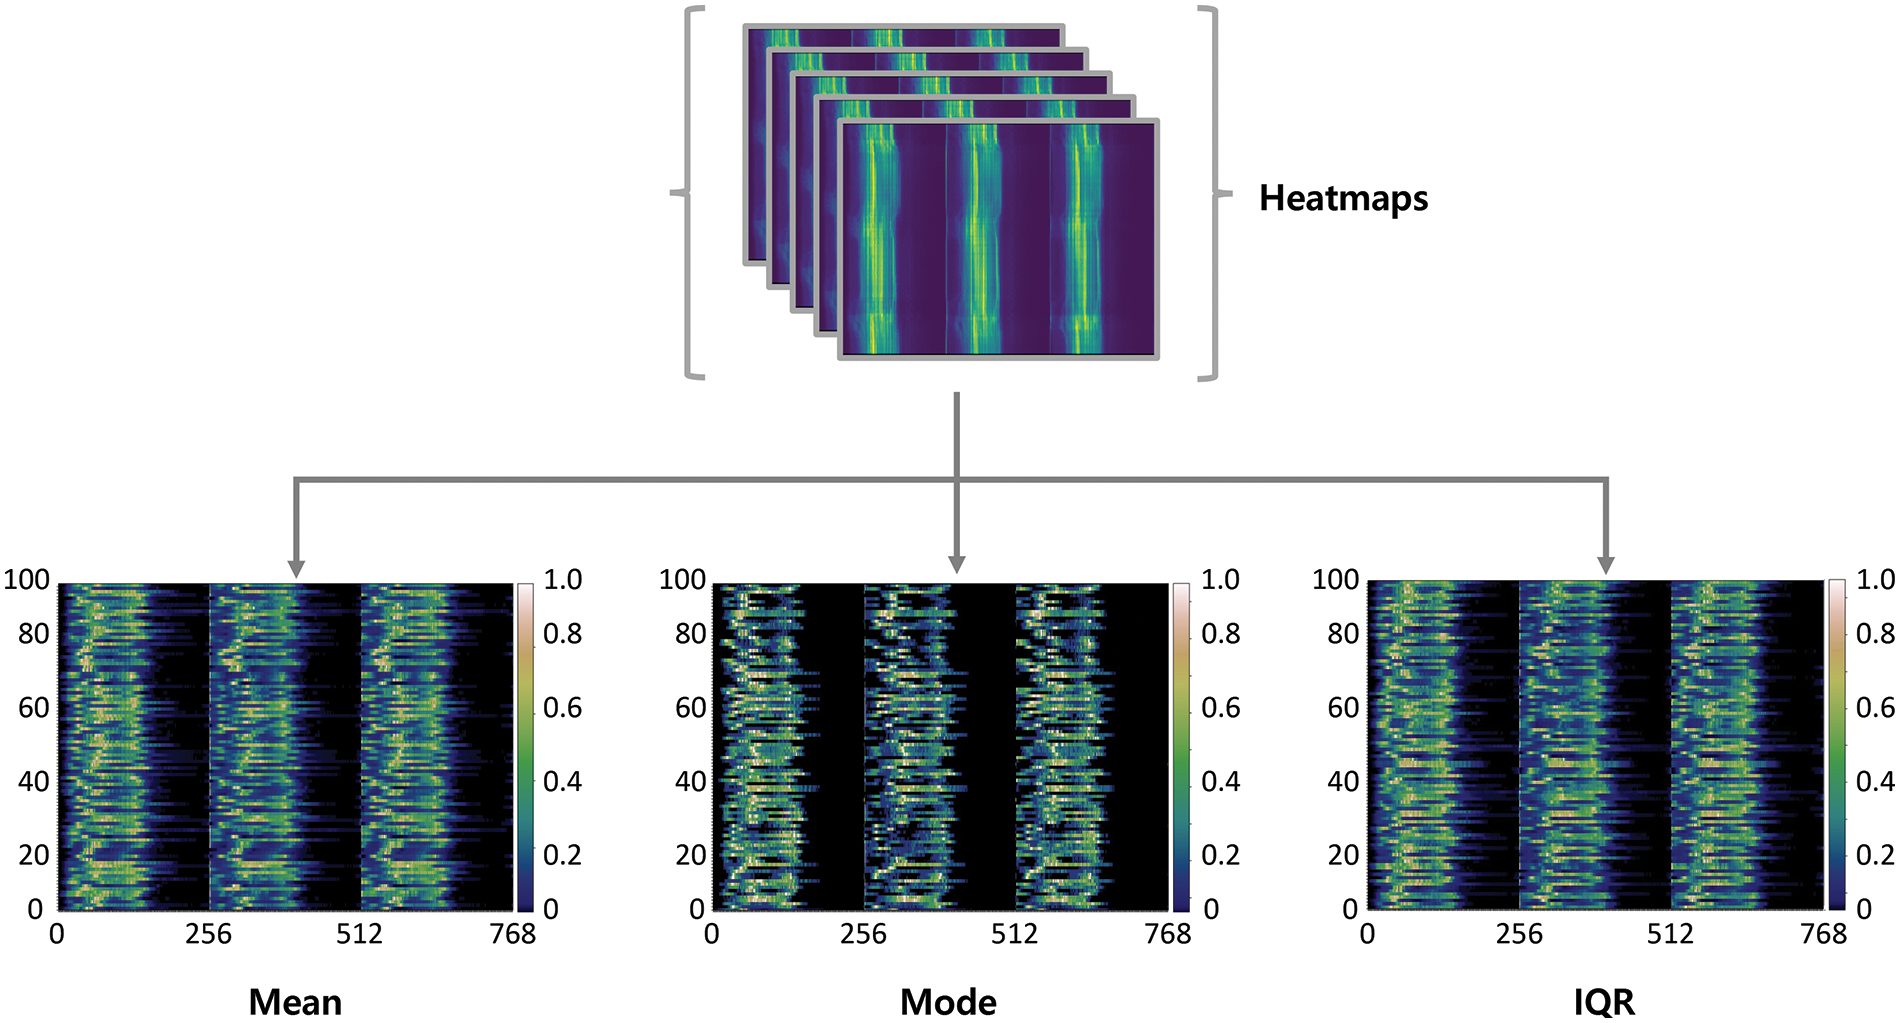
Figure 4: Object histogram stamp
3.3 Identical Object Determination Using Euclidean Distance
An object-histogram stamp that extracts only the unique color information of an object from an FW is used to compare two different objects in a multiple-CCTV environment. The Euclidean distance formula was used to achieve this [29]. The Euclidean distance formula calculates the distance between two points and measures the similarity between them based on their distance. Therefore, the Euclidean distance formula was used to measure the similarity between the two objects generated in multiple CCTV images. The Euclidean distance is given by
In Eq. (2), d represents the distance; p and q represent the feature values of the objects generated while passing through an FW in mutually different images; and n represents the number of images. The number of input images was the same as that of the comparison target image.
Two mutually different objects were compared in multiple CCTV images to use this formula to determine the similarities between objects according to the object-histogram stamp extraction methods using the mean, mode, and IQR. The two objects had 25 multiple-environment images each; one person wore white clothes on the top and bottom, and the other person wore a yellow top and black bottoms. The comparison results obtained from these images were visually expressed as a heat map to compare their similarities.
In Fig. 5, the horizontal and vertical axes represent the number of images; 50 images (25 images per person) were compared. The diagonal line indicates that the images are the same and that the Euclidean distance is zero and is consistently accurate. Based on the 25 images shown in Fig. 5, the similarity is high, and they are displayed in a dark color because the lower-left and upper-right figures show the same objects. Because the upper left and upper right show different objects, their similarity is low, and they are displayed in bright colors. Through this process, it is possible to classify different objects.
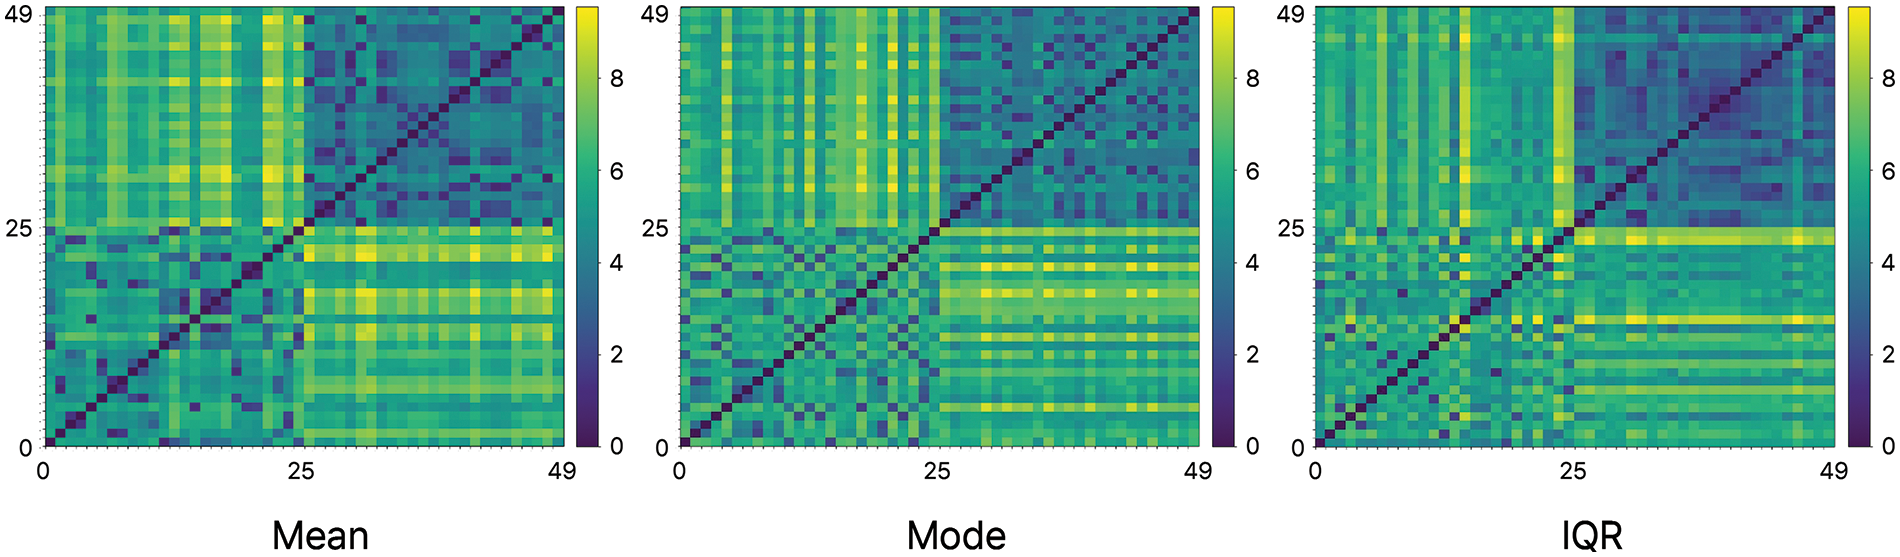
Figure 5: Heat map for comparing the similarity
4 Results and Performance Evaluation
In this study, human motion images from the AI Hub and edited images with durations of 5–10 s were used as data. These images depict diverse people wearing different clothes, captured from different angles. In addition, 32 frames were used for the histogram stamp extraction because using more frames would result in higher computational costs and longer processing times. In practice, it is possible to identify objects with fewer frames; however, choosing 32 frames allows us to obtain more information. This limitation can be adjusted based on the data storage capacity and computer specifications. Furthermore, an object in the CCTV image was detected, and an object-histogram stamp reflecting the color information of the clothes worn by the object was extracted. The mean, mode, and IQR methods were used to extract the object-histogram stamps. The generated histogram stamp was used to determine the same object status using the Euclidean distance formula. Therefore, the object-judgment accuracy and response performance of the object-histogram stamp extraction method were compared. In addition, the performances attributed to the additional margin added during object detection were compared. To measure performance, this study utilized a positive predictive value (PPV) and Top-N accuracy. The primary focus of this study was to identify the same individual captured from various angles. Multiple-object-tracking (MOT) metrics primarily emphasize multiple-object tracking, which differs somewhat from our research objectives. Consequently, we prioritized object identification over object tracking in our measurement methodology. Additionally, YOLO v5 was used for object detection, and DeepSORT was used for object tracking. Detection and tracking of objects may show different performance depending on the detector.
In the first performance evaluation, the accuracy of detecting the same object was compared to that of the object-histogram stamp extraction method. PPV, which refers to the proportion of true predictions that are true and enable the most intuitive judgment, was used for accuracy evaluation. Eq. (3) describes the PPV computation process [30].
where TP refers to the case where the same object is determined to be the same and FP refers to the case in which the same object is determined to be a different object. The accuracy of identifying the same object based on the histogram stamp extracted using Eq. (3), was measured. In addition, we measured the judgment of equivalent objects and accuracy using the Top-N accuracy, which is the ratio of the Top-N correct answers to the actual correct answers. In general, the performance of the model degrades as N increases and the classes exhibit similar characteristics. Therefore, we selected cases where N was 1 and 2 to measure accuracy. The Top-N accuracy is expressed as the ratio of the number of correct predictions to the number of trials of the premise. A hit is considered correct if it contains the correct answer from N predictions. Table 1 lists the accuracy results obtained using mean, mode, and IQR.
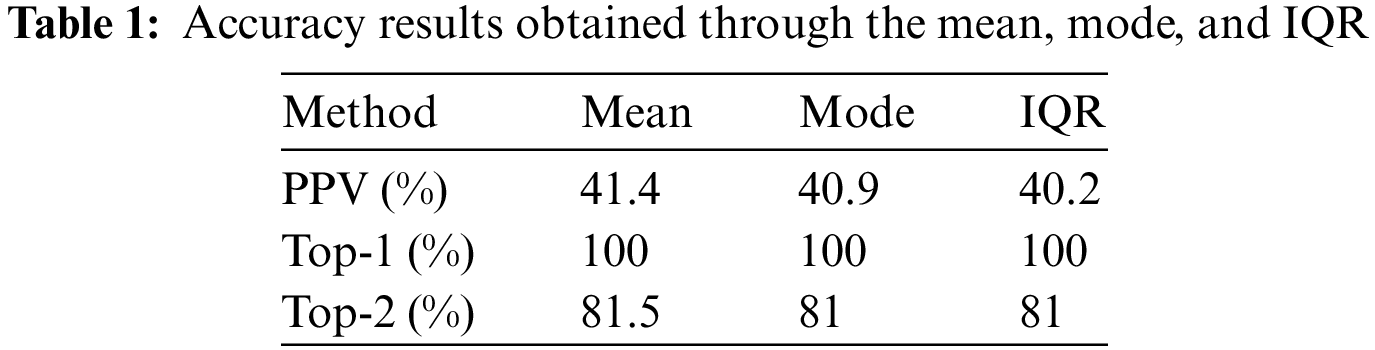
Table 1 indicates that the mean method performed best among the three methods. The mean method had an accuracy of 41.4% when using PPV and a high accuracy of 81.5% in terms of Top-2. This was 1.2% more accurate according to PPV and 0.5% more accurate according to Top-2 compared to IQR, which performed the worst. This indicates that using the mean method to generate an object-histogram stamp yields the best results. The overall low accuracy is attributed to the similar backgrounds used in the data images.
An internal margin was added to YOLO to collect the colors of humans in images without collecting background information, and an experiment was conducted to confirm the accuracy enhancement resulting from the use of an internal margin. The experimental procedures were identical to those used in the previous performance evaluation process. Table 2 lists the accuracy results obtained by using the internal margin.
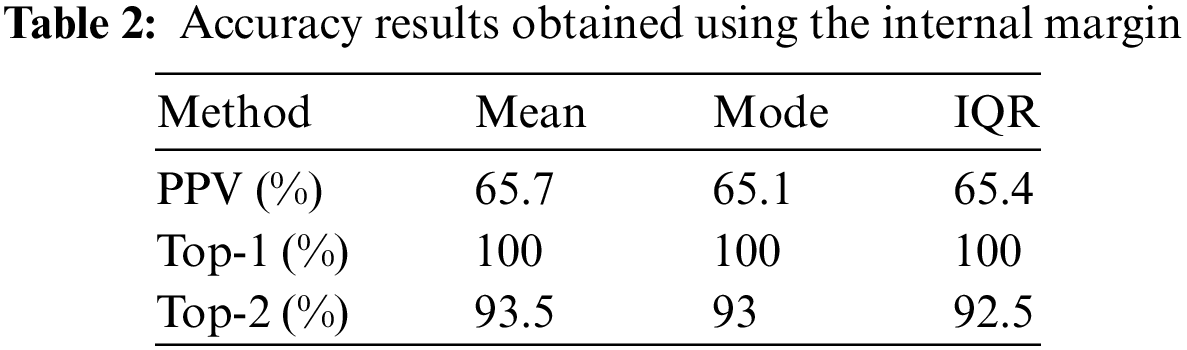
As indicated in Table 2, adding an internal margin improved the performance of all methods. The metric with the largest performance improvement was PPV, which showed a 25.2% improvement in accuracy for IQR. Furthermore, the Top-2 results showed a performance improvement of approximately 12% for all methods. By adding an internal margin through the experimental results, the background other than the object could be effectively removed, which significantly improved the accuracy of determining the same object. By introducing an internal margin, the distinction between objects and backgrounds became clear, making the proposed method more reliable.
Once the performance enhancement resulting from the addition of an internal margin was confirmed, an additional experiment was conducted to determine the adequate internal margin percentage. For the internal margin, the size of the initially generated bounding box was applied after it was reduced to a certain ratio. This reduction ratio begins with a reduction of 1/3. When the size of a bounding box is reduced by 1/3, the internal margin is 33.3%, and a new bounding box with a size 33.3% smaller than that of the initially generated bounding box is obtained. Further reduction ratios were applied by using the same procedure. The two methods that showed the highest accuracy after adding the margin were used to determine the accuracy resulting from the use of the internal margin reduction ratio. Therefore, the mean and IQR methods were used to measure the accuracy resulting from using the internal margin reduction ratio. Table 3 summarizes the accuracy results obtained using the different internal margin reduction ratios. We measured the accuracy using only the PPV to measure the accuracy of the experiment.
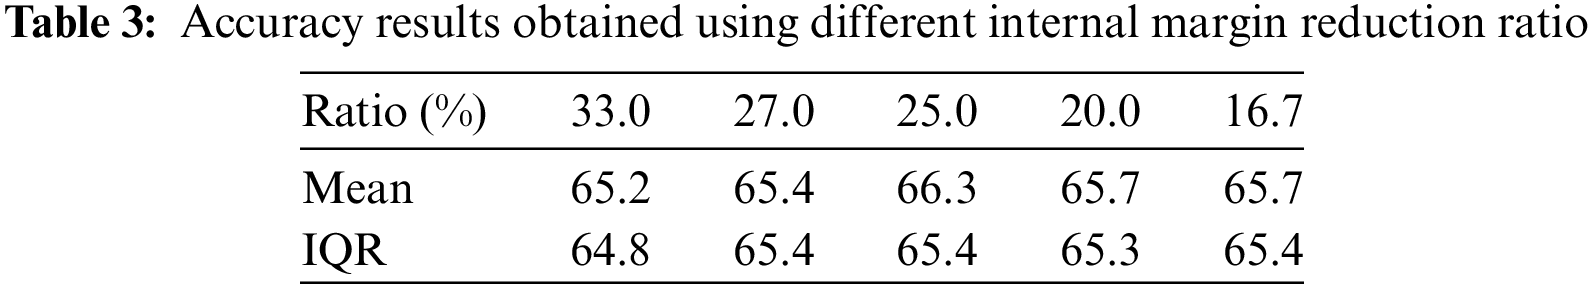
As shown in Table 3, both the mean and IQR methods exhibited the highest performance when the internal margin ratio was 25.5%. Based on the performance evaluation results, the highest performance is achieved when the margin ratio of the bounding box is 25.0%. Therefore, we can confirm that allowing an internal margin of 25% results in the highest detection performance.
In addition, the top 25% and bottom 25% were removed using the IQR method in the previous experiment, and only the middle 50% was applied. If a corrected ratio is used instead of 50%, higher performance may be obtained. Therefore, an experiment was conducted to test the case where only the top 25% was used instead of the pre-existing IQR method and to test the case where only the bottom 25% was used. Table 4 lists the accuracy results obtained by varying the IQR ratio.
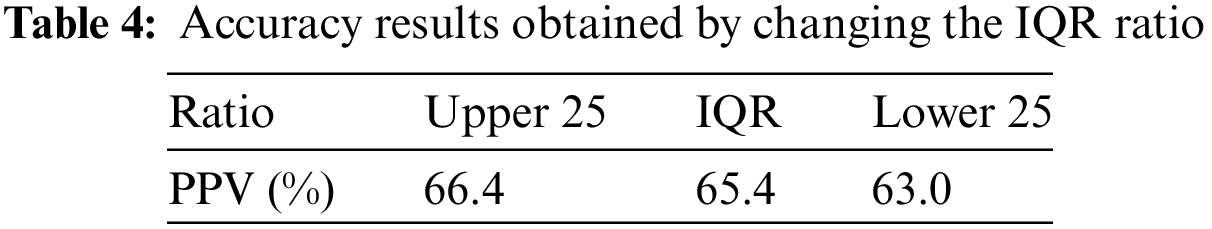
As indicated in Table 4, by adjusting the IQR ratio for the pre-existing method that used the top and bottom 25%, the former showed the best performance. Based on these results, we can confirm that using the top 25% achieves better performance in determining the same object status than using the pre-existing IQR method. This enabled tracking of the same object even in multiple-CCTV environments, which was proposed as a subject to be further examined in a previous study. The accuracies of the histogram stamp extraction methods were compared.
Fig. 6 shows a graph displaying the accuracy of each histogram stamp extraction method: mean, mode, IQR, top 25%, and bottom 25%. Among these, the top 25% showed the highest accuracy (66.4%). In contrast, the bottom 25% method exhibited the lowest accuracy (63.0%).
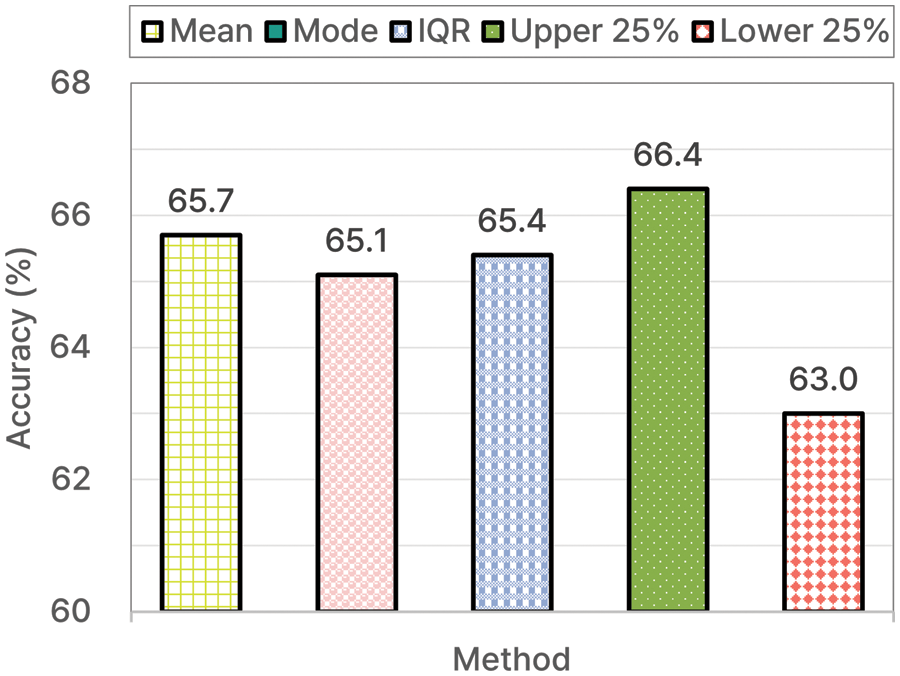
Figure 6: Accuracy of each histogram stamp extraction method
In the second evaluation, the response performance relevant to the process of determining the same object status was compared for the different histogram stamp extraction methods. One response time was compared during the response performance evaluation. The response speed was the same as the speed of each method’s color-value computation process. The response times for each object-histogram stamp extraction method were compared. Table 5 lists the response times obtained using the mean, mode, and IQR methods. In addition, Fig. 7 shows a graph of the response performance of each histogram stamp extraction method.
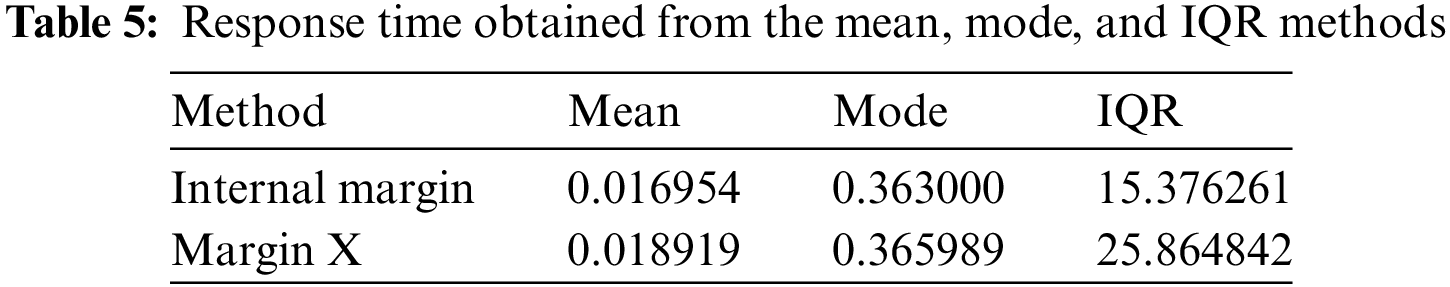
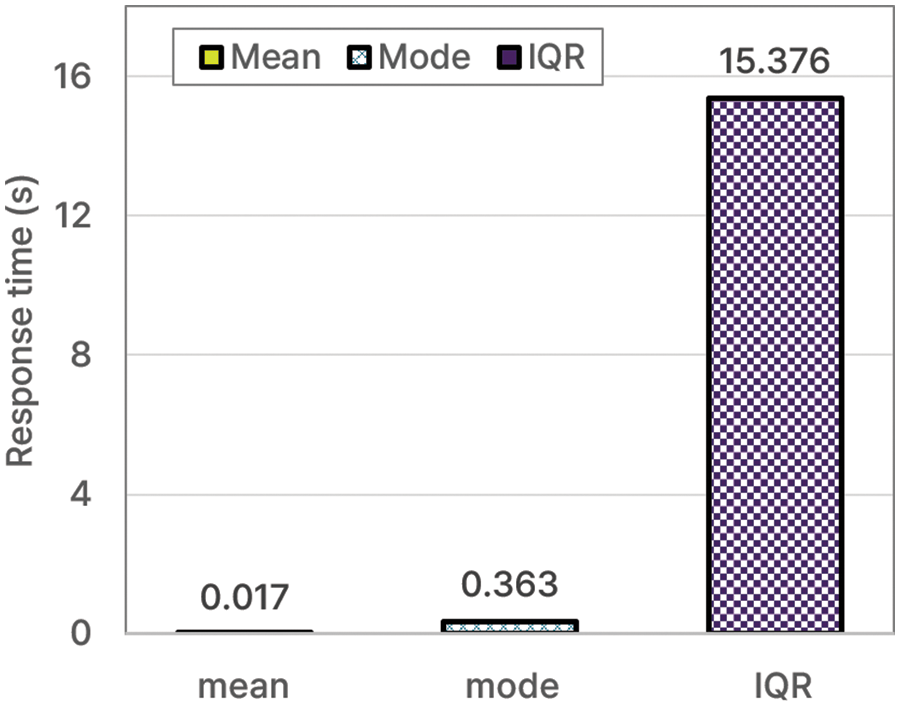
Figure 7: Response time performances of each extraction method
The results presented in Table 5 indicate that the mean method exhibited the best response performance, and the IQR method exhibited the lowest performance at 15.376 s. The reason for the low performance of the IQR method is its increased computational complexity compared to that of the mean and mode methods.
Fig. 7 shows the response times of the mean, mode, and IQR methods. The IQR method yielded the highest value of 15.376 s. Among the mean, mode, and IQR methods, the mean method is an adequate choice for performing accurate computations, and the IQR method is an adequate choice for achieving a fast response speed. Therefore, it is appropriate to use any one of the three methods based on the situation. Using the mean and mode methods enables the determination of the same object status in real time, which helps resolve problems in which detection takes a significant amount of time. As a result of implementing the internal margin, the information retrieval process has notably accelerated. This, in turn, has reduced processing time, enabling real-time object comparison and analysis during object detection. The introduction of the internal margin has streamlined data processing, leading to the establishment of a highly responsive system.
This study proposed multiple object tracking using histogram stamp extraction in CCTV environments to determine the same object present in several images. Using YOLO and DeepSORT, a person present in one image was detected and tracked to identify multiple identical individuals. When detecting and tracking an object, an internal margin is added to remove the background information in addition to the object. The addition of internal margins improved the accuracy by up to 15.2%. Furthermore, a histogram stamp, which is the unique color value of an object, was extracted to compare with several objects. Histogram stamps were generated and compared using the mean, mode, and IQR methods. There were three unique color channel values in the histogram stamp for each object, and through this, it was possible to indicate that the color value that appears consistently vertically was a unique object. In addition, it was found that each method had unique characteristics as the interval and color of the graph appeared differently. Afterward, the Euclidean distance formula compared the similarity between two objects. The smaller the result, the closer the value to 0 and the darker the graph appeared, indicating that the two objects were similar. When using the mean method, the Top-N accuracy was 93.5%, and an additional PPV experiment showed that the mean method had an accuracy of 65.7%. This confirms that it is possible to judge the same object in an image using only the color information of the target object. Additionally, an experiment analyzed the response time of different extraction methods. The results showed that the response time of the mean method was 0.01 s, indicating that it is possible to determine the same object in multiple images in real-time.
In this study, we proposed a method of determining the same object to track the same object in multiple images. This method is differentiated from traditional methods and uses the unique color information of the object to identify the same object. In addition, the proposed method reduced the impact of non-object background information by adding an internal margin to the bounding box area during the object detection process. It optimizes image processing time and improves the efficiency of the proposed method. The proposed abbreviation algorithm is flexible in application to various situations, and the accuracy of determining the same object in different images is also excellent. In addition, the proposed method demonstrated high response performance applicable in real-time in real-world applications.
However, when generating histogram stamps using RGB histograms, the variation in color owing to brightness and lighting changes is relatively small. This reduction in differences between various objects can lead to confusion when identifying the same object. Therefore, to enhance accuracy, it is advisable to combine additional information. For example, we can combine the motion of the subject along with the color information of the attire [31]. Furthermore, altering the shape of the bounding box is possible with an internal margin added. Therefore, we can achieve some improvements by introducing shape variations, such as elliptical forms that conform to human body shapes. Additionally, it is feasible to consider semantic segmentation techniques; however, these are known to have slower detection speeds than bounding boxes [32]. Consequently, further research is scheduled to develop a model offering high accuracy and real-time detection.
Acknowledgement: None.
Funding Statement: This work was supported by the National Research Foundation of Korea (NRF) grant funded by the Korea government (MSIT) (No. 2022R1F1A1068828).
Author Contributions: The authors confirm contribution to the paper as follows: study conception and design: Ye-Yeon Kang, Geon Park, Hyun Yoo; data collection: Ye-Yeon Kang, Geon Park; analysis and interpretation of results: Ye-Yeon Kang, Geon Park, Hyun Yoo, Kyungyong Chung; draft manuscript preparation: Ye-Yeon Kang, Geon Park. All authors reviewed the results and approved the final version of the manuscript.
Availability of Data and Materials: All data used in this study are freely available. The source of the data used in this study is explained in the text of the paper.
Conflicts of Interest: The authors declare that they have no conflicts of interest to report regarding the present study.
References
1. A. L. Thomas, E. L. Piza, B. C. Welsh and D. P. Farrington, “The internationalisation of CCTV surveillance: Effects on crime and implications for emerging technologies,” International Journal of Comparative and Applied Criminal Justice, vol. 46, no. 1, pp. 81–102, 2022. [Google Scholar]
2. Open Government Data Portal, [Online]. Available: https://www.data.go.kr/ (accessed on 11/11/2023) [Google Scholar]
3. H. Yoo, R. C. Park and K. Chung, “IoT-based health big-data process technologies: A survey,” KSII Transactions on Internet and Information Systems, vol. 15, no. 3, pp. 974–992, 2021. [Google Scholar]
4. P. Adarsh, P. Rathi and M. Kumar, “YOLO v3-tiny: Object detection and recognition using one stage improved model,” in Int. Conf. Adv. Commun. Control Comput (ICACCS), Tamil Nadu, India, pp. 687–694, 2020. [Google Scholar]
5. Y. Shi, N. Wang and X. Guo, “YOLOV: Making still image object detectors great at video object detection,” in Proc. of the AAAI Conf. on Artificial Intelligence, Washington, DC, USA, pp. 2254–2262, 2023. [Google Scholar]
6. F. Z. Zhang, D. Campbell and S. Gould, “Efficient two-stage detection of human-object interactions with a novel unary-pairwise transformer,” in Proc. of the IEEE/CVF Conf. on Computer Vision and Pattern Recognition, New Orleans, LA, USA, pp. 20104–20112, 2022. [Google Scholar]
7. A. Dhillon and G. K. Verma, “Convolutional neural network: A review of models, methodologies and applications to object detection,” Progress in Artificial Intelligence, vol. 9, no. 2, pp. 85–112, 2020. [Google Scholar]
8. Z. Zhou, J. Zhang and C. Gong, “Automatic detection method of tunnel lining multi-defects via an enhanced You Only Look Once network,” Computer-Aided Civil and Infrastructure Engineering, vol. 37, no. 6, pp. 762–780, 2022. [Google Scholar]
9. P. Hurtik, V. Molek, J. Hula, M. Vajgl, P. Vlasanek et al., “Poly-YOLO: Higher speed, more precise detection and instance segmentation for YOLOv3,” Neural Computing and Applications, vol. 34, no. 10, pp. 8275–8290, 2022. [Google Scholar]
10. X. Han, J. Chang and K. Wang, “Real-time object detection based on YOLO-v2 for tiny vehicle object,” Procedia Computer Science, vol. 183, pp. 61–72, 2021. [Google Scholar]
11. Y. Li, Z. Zhao, Y. Luo and Z. Qiu, “Real-time pattern-recognition of GPR images with YOLO v3 implemented by tensorflow,” Sensors, vol. 20, no. 22, pp. 6476, 2020. [Google Scholar] [PubMed]
12. Z. Zheng, P. Wang, W. Liu, J. Li, R. Ye et al., “Distance-IoU loss: Faster and better learning for bounding box regression,” in Proc. of the AAAI Conf. on Artificial Intelligence, New York, NY, USA, pp. 12993–13000, 2020. [Google Scholar]
13. W. Zhou, S. Gao, L. Zhang and X. Lou, “Histogram of oriented gradients feature extraction from raw bayer pattern images,” IEEE Transactions on Circuits and Systems II: Express Briefs, vol. 67, no. 5, pp. 946–950, 2020. [Google Scholar]
14. J. C. Kim and K. Chung, “Prediction model of user physical activity using data characteristics-based long short-term memory recurrent neural networks,” KSII Transactions on Internet and Information Systems, vol. 13, no. 4, pp. 2060–2077, 2019. [Google Scholar]
15. R. Maietta, P. Mihas, K. Swartout, J. Petruzzelli and A. B. Hamilton, “SORT and SIFT, think and shift: Let the data be your guide an applied approach to working with, learning from, and privileging qualitative data,” The Qualitative Report, vol. 26, no. 6, pp. 2045–2060, 2021. [Google Scholar]
16. F. Bellavia and C. Colombo, “Is there anything new to say about SIFT matching?” International Journal of Computer Vision, vol. 128, no. 7, pp. 1847–1866, 2020. [Google Scholar]
17. J. Cao, J. Pang, X. Weng, R. Khirodkar and K. Kitani, “Observation-centric SORT: Rethinking sort for robust multi-object tracking,” in Proc. of the IEEE/CVF Conf. on Computer Vision and Pattern Recognition, Vancouver, BC, Canada, pp. 9686–9696, 2023. [Google Scholar]
18. G. Revach, N. Shlezinger, X. Ni, A. L. Escoriza, R. J. van Sloun et al., “KalmanNet: Neural network aided kalman filtering for partially known dynamics,” IEEE Transactions on Signal Processing, vol. 70, pp. 1532–1547, 2022. [Google Scholar]
19. K. Oksuz, B. C. Cam, E. Akbas and S. Kalkan, “Rank & sort loss for object detection and instance segmentation,” in Proc. of the IEEE/CVF Int. Conf. on CVPR, Montreal, QC, Canada, pp. 3009–3018, 2021. [Google Scholar]
20. S. Kapania, D. Saini, S. Goyal, N. Thakur, R. Jain et al., “Multi object tracking with UAVs using deep SORT and YOLOv3 RetinaNet detection framework,” in AMIS, New York, NY, USA, pp. 1–6, 2020. [Google Scholar]
21. A. Pramanik, S. K. Pal, J. Maiti and P. Mitra, “Granulated RCNN and multi-class deep sort for multi-object detection and tracking,” IEEE Transactions on Emerging Topics in Computational Intelligence, vol. 6, no. 1, pp. 171–181, 2021. [Google Scholar]
22. T. Meinhardt, A. Kirillov, L. Leal-Taixe and C. Feichtenhofer, “Trackformer: Multi-object tracking with transformers,” in Proc. of the IEEE/CVF Conf. on Computer Vision and Pattern Recognition, New Orleans, LA, USA, pp. 8844–8854, 2022. [Google Scholar]
23. O. Guclu and A. B. Can, “Integrating global and local image features for enhanced loop closure detection in RGB-D SLAM systems,” The Visual Computer, vol. 36, no. 6, pp. 1271–1290, 2020. [Google Scholar]
24. A. I. Hub, [Online]. Available: https://aihub.or.kr/ (accessed on 11/11/2023) [Google Scholar]
25. M. Zhang and L. Yin, “Solar cell surface defect detection based on improved YOLO v5,” IEEE Access, vol. 10, pp. 80804–80815, 2022. [Google Scholar]
26. Y. Li, S. Li, H. Du, L. Chen, D. Zhang et al., “YOLO-ACN: Focusing on small target and occluded object detection,” IEEE Access, vol. 8, pp. 227288–227303, 2020. [Google Scholar]
27. A. I. B. Parico and T. Ahamed, “Real time pear fruit detection and counting using YOLOv4 models and deep SORT,” Sensors, vol. 21, no. 14, pp. 4803, 2021. [Google Scholar] [PubMed]
28. L. Chen, X. Lu, J. Zhang, X. Chu and C. Chen, “HINet: Half instance normalization network for image restoration,” in Proc. of the IEEE/CVF Conf. on Computer Vision and Pattern Recognition, Nashville, TN, USA, pp. 182–192, 2021. [Google Scholar]
29. H. Wu, Y. Cao, H. Wei and Z. Tian, “Face recognition based on haar like and euclidean distance,” in Journal of Physics: Conference Series, London, UK, pp. 012036, 2021. [Google Scholar]
30. T. Gandor and J. Nalepa, “First gradually, then suddenly: Understanding the impact of image compression on object detection using deep learning,” Sensors, vol. 22, no. 3, pp. 1104, 2022. [Google Scholar] [PubMed]
31. M. M. Islam and T. Iqbal, “Multi-GAT: A graphical attention-based hierarchical multimodal representation learning approach for human activity recognition,” IEEE Robotics and Automation Letters, vol. 6, no. 2, pp. 1729–1736, 2021. [Google Scholar]
32. X. Zhang, H. Li, F. Meng, Z. Song and L. Xu, “Segmenting beyond the bounding box for instance segmentation,” IEEE Transactions on Circuits and Systems for Video Technology, vol. 32, no. 2, pp. 704–714, 2021. [Google Scholar]
Cite This Article
 Copyright © 2023 The Author(s). Published by Tech Science Press.
This work is licensed under a Creative Commons Attribution 4.0 International License , which permits unrestricted use, distribution, and reproduction in any medium, provided the original work is properly cited.
 Downloads
 Citation Tools