
 Submit a Paper
 Propose a Special lssue
 Open Access
ARTICLE

From Social Media to Ballot Box: Leveraging Location-Aware Sentiment Analysis for Election Predictions
1 School of Computer Science and Technology, Beijing Institute of Technology, Beijing, 100081, China
2 The Faculty of New Information and Communication Technologies, University Abdel-Hamid Mehri Constantine 2, Constantine, 25000, Algeria
3 Department of IT and Computer Science, Pak-Austria Fachhochschule: Institute of Applied Sciences and Technology, Haripur, 22620, Pakistan
* Corresponding Author: Huaping Zhang. Email:
(This article belongs to the Special Issue: Advance Machine Learning for Sentiment Analysis over Various Domains and Applications)
Computers, Materials & Continua 2023, 77(3), 3037-3055. https://doi.org/10.32604/cmc.2023.044403
Received 29 July 2023; Accepted 24 October 2023; Issue published 26 December 2023
 View Full Text
 Download PDF
Abstract
Predicting election outcomes is a crucial undertaking, and various methods are employed for this purpose, such as traditional opinion polling, and social media analysis. However, traditional polling approaches often struggle to capture the intricate nuances of voter sentiment at local levels, resulting in a limited depth of analysis and understanding. In light of this challenge, this study focuses on predicting elections at the state/regional level along with the country level, intending to offer a comprehensive analysis and deeper insights into the electoral process. To achieve this, the study introduces the Location-Based Election Prediction Model (LEPM), which utilizes social media data, specifically Twitter, and integrates location-aware sentiment analysis techniques at both the state/region and country levels. LEPM predicts the support and opposing strength of each political party/candidate. To determine the location of users/voters who have not disclosed their location information in tweets, the model utilizes a Voter Location Detection (VotLocaDetect) approach, which leverages recent tweets/posts. The sentiment analysis techniques employed in this study include rule-based sentiment analysis, Valence Aware Dictionary and Sentiment Reasoner (VADER) as well as transformers-based sentiment analysis such as Bidirectional Encoder Representations from Transformers (BERT), BERTweet, and Election based BERT (ElecBERT). This study uses the 2020 United States (US) Presidential Election as a case study. By applying the LEPM model to the election, the study demonstrates its ability to accurately predict outcomes in forty-one states, achieving an 0.84 accuracy rate at the state level. Moreover, at the country level, the LEPM model outperforms traditional polling results. With a low Mean Absolute Error (MAE) of 0.87, the model exhibits more precise predictions and serves as a successful alternative to conventional polls and other methodologies. Leveraging the extensive social media data, the LEPM model provides nuanced insights into voter behavior, enabling policymakers to make informed decisions and facilitating in-depth analyses of elections. The study emphasizes the importance of using social media data for reliable election prediction and offers implications for enhancing prediction accuracy and understanding voter sentiment and behavior.Keywords
Supplementary Material
Supplementary Material FileWith the advent and utilization of various social media platforms (SMPs) such as Twitter, Facebook, and Weibo, the volume of data being shared has skyrocketed. These SMPs have become integral parts of users’ lives, offering an environment to express ideas, emotions, and opinions on a wide range of topics including software products, politics, culture, travel, and religion. Twitter is a popular microblogging SMP where users share their opinions using a short message. As of January 2023, the United States of America (USA) has the highest number of active Twitter users, with 95.4 million.
Politicians worldwide have increasingly recognized the immense significance of SMPs (such as Twitter) as powerful tools for communication and public engagement. These platforms attract a vast number of users who actively participate in political discussions and share their opinions on various political matters. As a result, SMPs have become invaluable repositories of data for researchers. Over the past decade, countless politicians and political parties have utilized SMPs for their campaigns, primarily due to their cost-effectiveness and the direct connection they facilitate between politicians and voters. By leveraging SMPs, politicians can establish rapid and direct lines of communication with their constituents, enabling them to gain insights into voter sentiments and make informed adjustments to their campaigns accordingly. Due to its vast and effective utilization by politicians, Twitter has attracted numerous researchers who aim to forecast political outcomes [1]. These researchers proposed various methods to predict elections, including volumetric approaches, social network analysis (SNA), and sentiment analysis. Most of the researchers employed sentiment analysis, as it provides a voter’s opinion about a political entity that leads to a better prediction [2].
Certainly, understanding and forecasting elections at a country level, in general, is always a significant task when it comes to predicting the succeeding head of the state—prime minister, or president. However, analyzing the same election at the regional/state level gives a deeper insight that leads us to understand not only the actual election but also the perspective of the voters in each state/region. Few studies investigated and predicted elections at state or regional levels: the Brazilian presidential election [3], Venezuela’s 2015 election [4], the Italian 2015 election [5], and the Nigerian 2019 election [6]. Besides, a small number of studies predicted USA elections at the state level such as the 2012 Republican Primaries Election in ten states [7]. The 2016 US Presidential Election, in three states only; Ohio, Florida, and North Carolina [8]. Heredia et al. [9] analyzed the 2016 US Presidential Election in twenty-one states using tweets from 1.5 months ahead of the election. All these studies focused only on a subgroup of a country. Whereas, this study analyzes tweets from all the states of a country and predicts election results in each state individually. Furthermore, we predict the election at the country level by considering all the tweets for each political party/candidate.
This study introduces LEPM, which utilizes social media data and location-aware sentiment analysis to predict elections ranging from state/region level to country level. The proposed approach involves collecting Twitter conversations and identifying the location of voters. This study employed rule-based sentiment analysis (VADER) as well as transformer-based sentiment analysis (BERTweet and ElecBERT) methods [10,11]. Additionally, potential voters were categorized into two classes: i) location available, and ii) location unavailable. For the former class, the approach detects the voters’ locations using metadata from their tweets, as well as by analyzing their profiles and recent tweets, even when explicit location data is not provided. In the latter class, the locations of the voters are unknown. The predictions based on the former class are used to forecast the elections at the state/regional level, while both classes are considered to predict the elections at the country level. Furthermore, the study compares the obtained results with different polls and actual election outcomes.
This research focuses on analyzing the 2020 US Presidential Election as a case study, aiming to predict the election outcomes at both the state and national levels in the USA by utilizing the proposed LEPM. The approach involves utilizing party hashtags to analyze the sentiment of tweets related to the Democratic and Republican parties. By conducting sentiment analysis, the study aims to assess public sentiment towards these parties and use it as a predictor of the election outcome. With a total of 538 electoral votes distributed across the states, these votes ultimately determine the success of a candidate. The ability to predict the winning party or candidate at both state and national levels can provide valuable insights for parties and candidates to adapt their campaign strategies accordingly. Additionally, this predictive analysis can benefit various stakeholders, including decision-makers involved in the electoral process.
This study makes several significant contributions, including the introduction of the LEPM for comprehensive election analysis at both country and state/regional levels. It also offers a comparative analysis of rule-based and transformer-based sentiment analysis techniques to identify the most effective method for sentiment analysis in the electoral domain. Additionally, by conducting a detailed analysis of the 2020 US Presidential Election results, this study provides insights into the election outcomes at different geographical scales.
The rest of the paper is organized as follows: Section 2 provides an overview of the related work, and Section 3 provides the methodology of this study followed by our case study in Section 4. Furthermore, Section 5 concludes this study.
SMPs, particularly Twitter, have emerged as a crucial medium for individuals worldwide to express their emotions and opinions on various subjects, including politics [2,12]. Policymakers have recognized the importance of investigating public sentiments, as it offers valuable insights into people’s views on critical matters such as political elections and COVID-19 [13]. Consequently, numerous studies have delved into leveraging the vast amount of Twitter data to predict election outcomes, utilizing data mining approaches like supervised learning, unsupervised learning, and weakly supervised techniques [1].
Researchers have conducted in-depth studies to explore the effectiveness of sentiment analysis in election prediction. For example, Yaqub et al. [14] analyzed Twitter location data from the 2016 US and 2017 UK elections, aiming to correlate Twitter sentiment with on-ground public opinion and election results. Their research revealed a strong alignment between Twitter location sentiment and actual election outcomes, indicating the potential of location-based sentiment analysis as a reliable tool for predicting public opinion.
Specific US Presidential Elections have been at the center of attention in several studies, assessing the effectiveness of sentiment analysis in predicting election outcomes at various levels. Heredia et al. [9] conducted a state-level analysis of the 2016 US Presidential Election, analyzing tweets from 21 states over 1.5 months. Their study, utilizing volumetric analysis and positive-sentiment analysis, categorized states into swing states and those favoring either Donald Trump or Hillary Clinton. The results from the Wilcoxon-Mann-Whitney test indicated that both positive-sentiment and volumetric methods are accurate predictors. Similarly, Kassraie et al. [15] employed Gaussian process regression to analyze the 2016 US Presidential Election using six months of tweet sentiments and Google trend data about candidates, comparing their outcomes with poll data from FiveThirtyEight.
In a similar vein, Wicaksono et al. [16] investigated the 2016 US Presidential Election using state level tweets related to political parties and candidates, proposing a sentiment analysis model combining the Binarized Multinomial Naïve Bayes Classifier, SentiWordNet, and AFINN-111. Their study shed light on the potential of sentiment analysis techniques to predict election outcomes at the state level, paving the way for further investigations.
Furthermore, researchers have explored the application of location and sentiment analysis on Twitter data to predict the 2020 US Presidential Election. Nugroho [17] conducted a study predicting the election in nearly 25 states using hashtags related to the candidates. Employing the VADER sentiment analysis tool, they determined sentiment percentages and correlated them with the BBC election results, showcasing the applicability of sentiment analysis for election prediction at the state level. Similarly, Chaudhry et al. [18] analyzed the same election, utilizing sentiment analysis (VADER) on a large dataset of 38,432,811 tweets collected over a period of fewer than two months. By comparing sentiment percentages with election results, the authors assessed the effectiveness of sentiment analysis for predicting election outcomes at the state level.
Apart from US elections, researchers have also applied sentiment analysis to predict election results in various other countries. For instance, Plummer et al. [19] analyzed the 2017 UK Elections using sentiment analysis and compared the results with BBC NEWS poll data. In another study, Budiharto et al. [20] used sentiment analysis to analyze the 2018–19 Indonesian Presidential Election. Additionally, a study [21] focused on predicting the election results of political parties in Pakistan using Twitter data. The authors addressed language issues, low accuracy, and limited internet access in less developed countries. Their proposed methodology involved aspect extraction, aspect refinement, and final prediction using the Bayesian theorem. Comparing their model with existing approaches such as built-in dictionaries, Naïve Bayes, K-Nearest Neighbors (KNN), Decision Tree, and Support Vector Machines (SVM) classifiers, their approach achieved an impressive 98% accuracy, outperforming previous techniques and efficiently overcoming limitations of earlier studies.
Moreover, location-based sentiment analysis has found applications in various domains beyond election prediction. Researchers explored sentiment classification for public opinion analysis, incorporating user attributes like age, location, and posting time to enhance accuracy. Utilizing parallel Convolutional Neural Networks (CNN) and Recurrent Neural Networks (RNN), the proposed sentiment classification algorithm achieved high accuracy under short-term and small-scale data, surpassing existing methods [22].
Furthermore, sentiment analysis has addressed challenges in point-of-interest (POI) suggestions in location-based social networks (LBSNs) using the Community-based Sentiment Extraction and Network Embedding for POI Recommendation (CENTER) framework. This approach effectively tackled data sparsity, cold start, and sentiment classification issues, enhancing the effectiveness of POI recommendations [23].
Researchers have also integrated geospatial information with sentiment analysis to gain insights into public reactions and spatial variations of sentiments [24]. By analyzing processed geo-tweets data, this study classified sentiments and investigated temporal variations of positive, neutral, and negative sentiments on monthly, daily, and hourly levels. Spatial cluster identification using the Local Indicators of Spatial Association (LISA) method and topic categorization based on the Latent Dirichlet Allocation (LDA) model further revealed associations between Twitter content and the characteristics of places and users.
Location-based sentiment analysis has also proven useful in disaster management and real-time content analysis on social media platforms. Utilizing machine learning algorithms such as Multinomial and Gaussian Naïve Bayes, Support Vector Machine (SVM), and others, this study achieved high accuracy in classifying sentiments from geo-tagged tweets related to earthquakes. The approach offered quick response strategies for disaster scenarios, highlighting the importance of location-specific information [25].
Despite the valuable insights from existing research, most studies have either focused on specific states or relied solely on sentiment percentages as final results. This study aims to address these limitations by introducing the LEPM, which predicts election outcomes at both the state/regional levels and the national level. Analyzing tweets from all states in a country, the LEPM offers a more comprehensive understanding of voter sentiments and enables more informed decision-making.
This section presents the methodology of this research. We proposed a model that predicts election at two levels: state-level and country-level. Fig. 1 shows the flow of election prediction on Twitter.

Figure 1: Method flow of election prediction on Twitter
3.1 Voter’s Location Detection (VotLocaDetect) Approach
Twitter provides two categories of geographical metadata: i) Account location—provided by the users in their public profile, and ii) Tweet location—shared by the users at the time of the tweet. Twitter can provide the exact location by accessing the level “coordinates (longitude (long), latitude (lat))” and “geo (lat, long)”. Account location provides numerous data fields, which aid us in getting and understanding the user’s location such as “profile geo metadata”—coordinates (long, lat). The users may not frequently change account locations. Furthermore, profile geo operators are available, for instance, “has:profile_geo, profile_country, profile_region, profile_locality, profile_subregion, and bio_location”. The tweets’ location operators are “place, place_country, has: geo, point_radius, and bounding_box”. This geographically enriched data can be utilized to predict a political event. Usually, studies consider and analyze tweets ignoring the location information of the users and predicting the events in general. We believe that analyzing the tweets along with the geolocation information gives us better insights.
One significant obstacle in conducting demographic studies, such as predicting election outcomes at the state or regional level, is the lack of location information shared by many users in their tweets or posts. To address this challenge, this study employed the VotLocaDetect approach, which analyzes the profiles of users who have not provided any location details in their tweets to infer their geographic location.
In this study, every user expressing opinions or discussing political parties or candidates was considered a potential voter.
The VotLocaDetect approach is defined as follows:
Let T be a set of tweets, and let V be a set of voters. For each tweet t ∈ T, there exists a unique voter v(t) ∈ V who tweeted it.
We partition V into two subsets: VL, containing voters with known locations, and VU, containing voters without known locations.
Let VL be further partitioned into two subsets: VG, containing voters with location information specified as geographic coordinates, and VN, containing voters with location information specified as named locations. For each voter v ∈ VU, we examine their profile, or their five most recent tweets to extract location information. Let S(v) be the set of locations extracted from their profile or these tweets. If S(v) is nonempty, let g(v) be the location in S(v) that appears on the voter’s profile, or appears most frequently, or the location mentioned in the latest tweet if there are ties. Otherwise, let g(v) be undefined.
We define a location function f: V → L, where L is the set of all possible locations, as follows:
• f(v) = (lat, long) if v ∈ VG and voter’s location is specified as geographic coordinates
• f(v) = ℓ if v ∈ VN and voter’s location is specified as named location ℓ
• f(v) = g(v) if v ∈ VU and g(v) is defined
• f(v) is undefined otherwise
Finally, we define a location-aware tweet set TL as follows:
• TL = {t ∈ T | f(v(t)) is defined}
where TL is the set of tweets with known voter locations, which includes tweets from both VG and VN as well as voters in VU with known or predicted locations.
Sentiment Analysis plays a vital role in Natural Language Processing (NLP). It is used to detect the polarity in a text, i.e., positive, negative, or neutral. Sentiment analysis is used widely to assess all kinds of businesses’ future directions because people’s attitudes toward the product define the rise or fall of the business. The same applies to election campaigns. People express their emotions for a political party/candidate openly on SMPs, which shows their support and opposition. This study employed a rulebased approach (VADER) as well as transformer-based sentiment analysis approaches (ElecBERT, and BERTweet).
In this study, we employed the VADER tool to assign sentiment polarity (positive, negative, and neutral) to each tweet. VADER is a rule-based model designed for general sentiment analysis of microblogging text. The model proved its high performance against 11 other methods including individual human annotation. It does not require any training data but is constructed from a generalizable, humancurated gold standard sentiment lexicon and, valence-based. It can be used online with streaming data.
BERTweet [26,27] is a BERT-based language model pre-trained for English tweets. The model was trained using Roberta’s training procedure and BERT base architecture. It was tested on three tweet NLP tasks (namely, POS tagging, NER, and text classification including Sentiment Analysis) where it outperformed the Roberta base and XLM-R base. In addition to the basic model with 850 M English Tweets (cased), BERTweet comes with two variants case and uncased of 23 M COVID-19-related tweets and BERTweet large with 873 M English Tweets (cased).
This study utilizes ElecBERT [28], an optimized BERT-based model tailored for sentiment analysis in election-related tweets. ElecBERT is fine-tuned on two extensive datasets: ElecSent-English, which includes 4.75 M labeled tweets in English, and ElecSent-Multi-Languages, comprising 5.31 M labeled tweets in multiple languages. Its superior performance compared to alternative machine learning models makes ElecBERT a valuable resource for analyzing sentiments in election-related tweets.
3.3 SLEP: State-Level Election Prediction
The geographically enriched data can be utilized to predict a political event. Usually, studies consider and analyze tweets ignoring the location information of the users and predicting the events in general. We believe that analyzing the tweets along with the geolocation information gives us better insights. To analyze and forecast an election at a regional/state level, geo-enabled tweets are categorized into different regions/states as per the location provided by the voters. Twitter provides the location in different formats: “place_type (place_type: city)”, “name (name: Manhattan)”, “full_name (full_name: Manhattan, NY)”, country_code (“country_code: US), “country (country: United States)”, and bonding_box (bounding_box: coordinates)”. To understand and categorize the tweets at the regional/state level, a dictionary needs to be employed to map the locations with each region/state. For instance, considering US-based tweets, the user’s location is matched to a US states-dictionary that assigns each state accordingly (mapping). For example, user A has a location “NY, USA”, and user B has a location, “New York,” after employing the state dictionary, “New York” will be assigned to users A and B.
In this approach, we only consider tweets that have user locations. We define our methodology for predicting elections at the state level as follows:
Tweets are preprocessed and assigned a sentiment polarity score. Let P be the set of politicians/candidates, and let pos(t, p), neg(t, p), and neu(t, p) be the number of positive, negative, and neutral sentiment tweets for a politician p ∈ P in a state s ∈ S. In this study, we considered positive tweets as support for a candidate/party, whereas, negative tweets as opposition. We ignored neutral tweets, as they do not indicate any significant voter behavior such as support or opposition. We define the support score ss(p, s) and opposition score os(p, s) using Eqs. (1), and (2):
We consider positive tweets as support for a politician/party, whereas negative tweets as opposition. Let N(p, s) = ss(p, s) + os(q, s) be the total number of positive and negative tweets for politicians p and q in state s. We define the vote share “VS(p, s)” for a politician p in the state s using Eq. (3):
The politician with a higher vote share in a state s will have a higher chance of winning in that state. Afterward, we compare the vote shares with the actual results in each state to calculate the Mean Absolute Error (MAE) and Root Mean Square Error (RMSE). These metrics were chosen for their ability to quantify the accuracy of our vote share predictions. Specifically, let R(p, s) be the actual vote share for politician p in state s. The MAE and RMSE are calculated using Eqs. (4) and (5) to assess how closely our model’s predicted vote shares align with the ground truth. MAE's straightforward interpretation and robustness to outliers make it ideal for measuring the average absolute difference, while RMSE, used in conjunction with MAE, provides insight into sensitivity to larger errors and enables comparisons with established modeling practices. Together, these metrics provide a comprehensive evaluation of our model’s predictive performance [29].
Let R(p, s) be the actual vote share for politician p in state s. The MAE and RMSE are calculated using Eqs. (4), and (5):
Next, we calculate the vote share for each politician for the entire country by combining all the vote shares from all the states. The country-level vote share for politician p can be estimated using Eq. (6):
In this equation, |S| is the total number of states. The result is the simple average of the vote shares of politicians p across all the states.
Let R(p, s) be the actual vote share for politician p in state s. The MAE and RMSE for the country-level vote share are calculated using Eqs. (7), and (8):
In these equations, S is the total number of states. The MAE and RMSE quantify the difference between the predicted vote share and the actual vote share for each politician at the country level. Lower values of MAE and RMSE indicate better performance of the sentiment analysis model in predicting election results.
3.4 CLEP: Country-Level Election Prediction
For country-level election prediction, tweets are collected related to a candidate/party. The location information of users at this level is not considered. Since the election is the focus we assume that everyone tweeting about the election portrays the voters’ behavior. The explanation of our method is as follows.
Let T be the set of election-related tweets collected from SMP, and let C = {c1, c2,…, cn} be the set of candidates or political parties participating in the election.
We clean the tweets by removing URLs, mentions, and hashtags. Tokenize the tweets and remove stop words and punctuation marks. Apply lemmatization or stemming to normalize the words. Next, we use sentiment analysis models to classify the tweets into positive, negative, and neutral. In this study, we consider positive sentiment as the support for a politician or party, and negative as the opposition. Assign a score to each tweet based on the sentiment:
Furthermore, we predict the vote share for each politician/party. For each candidate or political party c ∈ C, calculate the number of support and oppose based on the sentiment scores using Eqs. (9), and (10):
The total number of support and oppose tweets for all candidates or parties are calculated using Eqs. (11), and (12):
Next, we calculate the final vote share for each candidate or party using Eq. (13):
Compare the predicted vote share with the actual vote share using online poll data or actual election results. We calculate the MAE and RMSE using Eqs. (14), and (15):
where V(c)i is the predicted vote share for candidate/party c in the ith election, A(c)i is the actual vote share for candidate/party c in the ith election, and n is the total number of elections.
4 Experimental Results and Discussion
The experiments were conducted in Google Colab (Python 3.7).
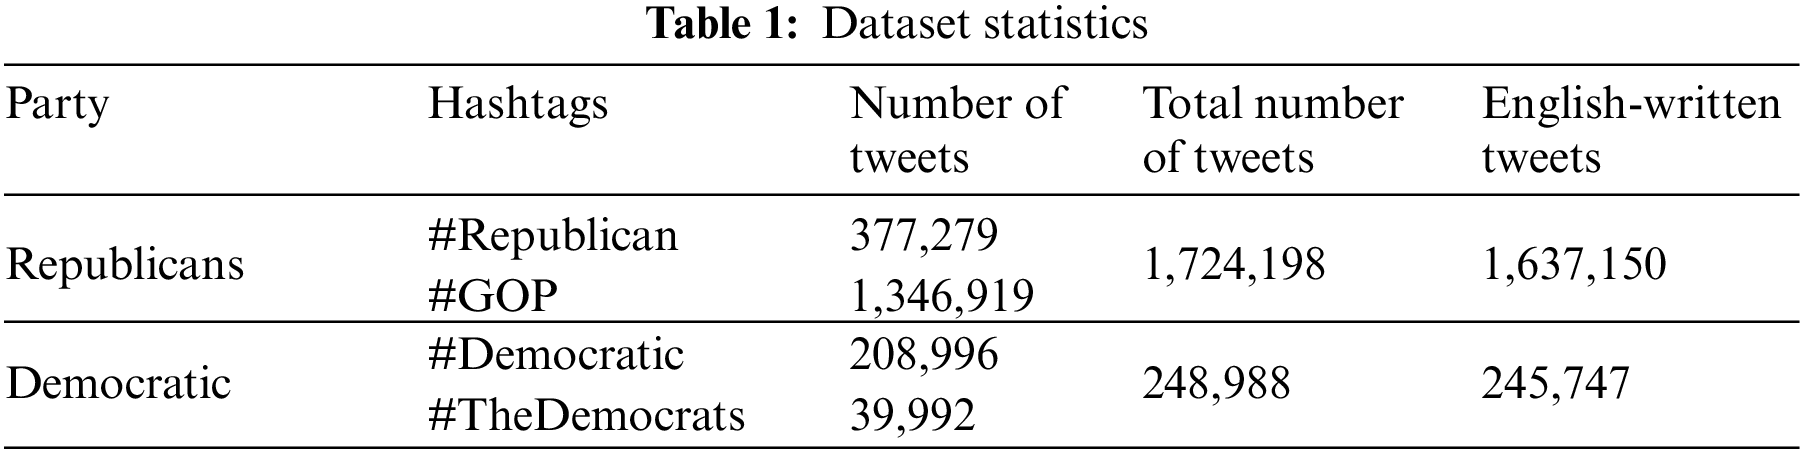
Tweets were gathered utilizing the Twitter Search API called “Tweepy,” an open-source Python library. The data collection spanned from December 05, 2019, to November 30, 2020, with a weekly collection frequency imposed due to limitations within the library. While this approach may result in occasional data loss due to variations in API operation times, it is important to note that the impact on the results is minimal. The analysis presents sentiment percentages, ensuring that the vote shares for the parties sum up to 100%. This design choice provides confidence that any minor data loss has negligible effects on the final results. The data collection process focused on tweets associated with specific party hashtags, namely #Republican and #GOP for the Republican Party, and #Democratic and #TheDemocrats for the Democratic Party. Table 1 provides an overview of the tweet counts collected for each party during the aforementioned period. Only tweets written in English were considered for inclusion in this study. It is noteworthy that 94.95% of Republican tweets and 98.69% of Democratic tweets were written in English.
To delve further into the election analysis, additional attributes were created by converting the “created_at” field into year, month, and month-year categories, and the “user_location” field into states using a predefined dictionary. Fig. 2 displays the distribution of tweets mentioning the Democratic and Republican parties from December 2019 to November 2020. It is interesting to note that throughout the entire year, the number of tweets related to Republicans consistently surpassed those related to Democrats. This could be attributed to various factors, including the extensive use of Twitter by Donald Trump and the public’s response to his tweets. Notably, the official Twitter account of the Republican Party had more followers and tweeted more frequently compared to the Democratic Party, indicating a higher level of engagement from the Republican side. Additionally, significant events such as the statements “Anybody that wants a test can get a test” and “The president tests positive for COVID-19” occurred during this period. Furthermore, a noticeable decline in the number of tweets from both parties was observed in October 2020, which was a month before the election. This decrease in tweet activity suggests that relying solely on onemonth data preceding an election may lead to imprecise predictions.

Figure 2: Tweets collection–Democratic and Republican parties
Before conducting sentiment analysis, the tweets underwent pre-processing steps, including the removal of hashtags, URLs, and other unnecessary elements. This preprocessing aimed to ensure that the tweets were ready for sentiment analysis. For rule-based sentiment analysis, the “vaderSentiment” library was imported. This library provided the necessary tools to extract sentiments from each tweet based on predefined rules. Furthermore, a transformer-based approach was employed using BERTweet from the “pysentimiento” library.
4.3 A Case Study on LEPM for United States Presidential Elections
The US 2020 Presidential Election was held on 3rd November 2020. It was the 59th quadrennial US Presidential Election. Several candidates were running for president. Joe Biden secured the Democratic presidential nomination, Donald Trump in the Republican primaries, Howie Hawkins the Green Party presidential nomination, Jo Jorgensen secured the Libertarian Party, Gloria La Riva secured the Socialism and Liberation Party, Rocky De L Fuente secured the Alliance Party, and Brian Carroll secured the American Solidarity Party presidential nomination. The Democratic and Republican Parties are the major and oldest parties in the US. The Democratic Party was founded in 1828 while Republican Party was founded in 1854. Generally, the presidential race is held between these two parties.
This study uses the case study of predicting the US 2020 Presidential Election using Twitter data. The tweets related to two major political parties (Democratic, and Republican) are analyzed as these parties received 98.2% of the total votes. Furthermore, we compared our predicted results with different polls’ prediction results and the US 2020 Presidential Election results.
4.3.1 SLEP: State-Level Election Prediction Model
For state-level election prediction, our proposed model takes data from Twitter in JSON format. Next, store the data with fewer attributes in a database (MySQL), such as “created_at”, “id”, “text”, “user_id”, “user_name”, “user_location”, etc. We categorized the tweets into two categories based on their locations: (a) US states (including the District of Columbia), and (b) location-unavailable (Location not mentioned, mentioned “USA” only, or location is not from the USA). We use a states-dictionary (see Supplementary Fig. S1) that maps the states’ names to each state in the US.
Fig. 3 illustrates the distribution of tweets based on location detection. Initially, the Democratic Party had 125,644 voters with known locations, while the Republican Party had 405,675. By utilizing the VotLocaDetect model to identify the location of voters who did not disclose it, the Democratic Party’s voter count increased to 143,852, and the Republican Party’s rose to 618,391. However, tweets without location information were excluded, potentially affecting the final predicted results. It is suspected that a significant portion of the “no-location” tweets originate from states within the USA. Supplementary Fig. S2 and Fig. S3 display choropleth maps of Democratic and Republican tweets, respectively, with darker colors representing higher tweet volumes in states like California, Florida, and Texas.

Figure 3: Tweets distribution based on locations (B: before location detection approach|A: after location detection approach)
In the United States, the fate of a presidential candidate is determined by 538 electoral votes from across the states. Each state receives electoral votes proportional to its population, with larger states having more votes (e.g., California: 55, Texas: 38, Florida: 29, New York: 29). A minimum of 270 electoral votes is needed to win the presidency. Fig. 4 presents the distribution of electoral votes, Republican tweets, and Democratic tweets as percentages across all states. While the tweets generally align with the distribution of electoral votes in most states, there are notable differences in states like New Mexico, where Republican tweets exceed the percentage of electoral votes and Democratic tweets.
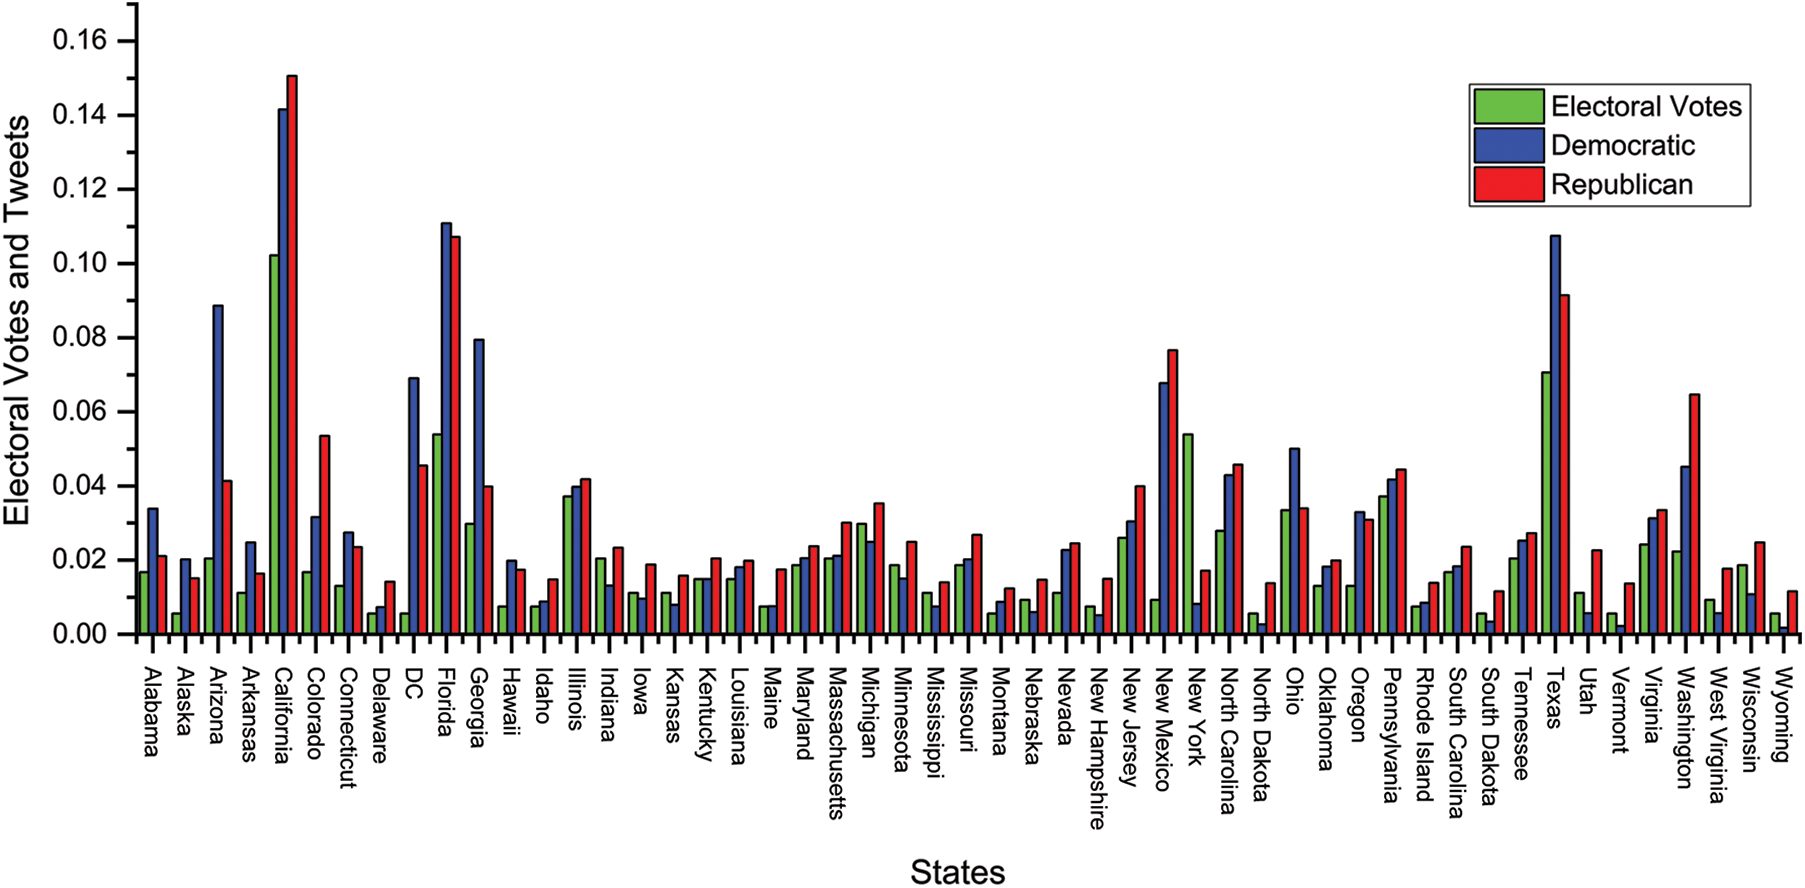
Figure 4: Distribution of electoral votes and tweets (Democratic and Republican) in US states
Sentiment analysis is employed to categorize each tweet into positive, negative, and neutral for all states. Supplementary Figs. S4 and S5 show the sentiment distributions of the two parties across all the states as well as “location-unconsidered” using VADER, BERTweet, and ElecBERT, respectively. It can be observed that in all states the Democratic Party is leading in terms of positive sentiment percentage using both approaches, i.e., transformer-based and rule-based SA. The Democratic Party has a higher positive ratio in “location unconsidered” tweets as well.
Previous studies [8,30,31] predicted the election results by considering the number of tweets (a party having a higher number of tweets is the winner), the number of positive tweets, or the percentage of positive tweets. Applying either technique to our data gives an erroneous output: The Democratic Party is the clear winner in all states by considering “positive percentages” only. The Republican Party becomes the clear winner in all states except New York if we consider “the number of tweets”. While considering “the number of positive tweets”, the Republican Party leads in all the states. To correct this error, we predicted a vote share for each party in all the states, respectively.
Furthermore, we predicted the vote share for both parties in each state. Supplementary Fig. S6 illustrates the predicted vote shares for Republican and Democratic Parties in each state, including “The District of Columbia (Washington DC)”. We named vote share using VADER as SLEP-VADER, BERTweet as SLEP-BERTWEET, and ElecBERT as SLEP-ELECBERT. Supplementary Table S1 (SLEP-VADER), Table S2 (SLEPBERTweet), and Table S3 (SLEP-ElecBERT) depict the predicted vote shares for both parties in each state together with the actual 2020 US Election’s final results and the RMSE. It can be observed that SLEPELECBERT and SLEP-BERTweet give us imprecise results, as in all states Democratic Party is the winner.
The RMSE for both parties using SLEP-BERTweet is so high as compared to SLEP-ElecBERT and SLEPVADER. Subsequently, in this study, we will consider the results using VADER (in Supplementary Table S1). The average RMSE for Democrats and Republicans are 8.90 and 8.82, respectively. The higher average (RMSE) is due to the outlier values of certain states, including the District of Columbia, Wyoming, Idaho, and Oklahoma. The accuracy for state-level election prediction is calculated. Table 2 shows the accuracy (using Eq. (16)) of state-level election prediction using four different approaches, i.e., a higher percentage of positive tweets, a higher number of positive tweets, a higher number of tweets, and our approaches SLEP-VADER, SLEP-BERTweet, and SLEP-ElecBERT.

Fig. 5 shows the final predicted election results using the SLEP-VADER approach. The results are categorized into four groups, DT (predicted Democratic: True), DF (predicted Democratic: False), RT (predicted Republican: True), and RF (predicted Republican: False).
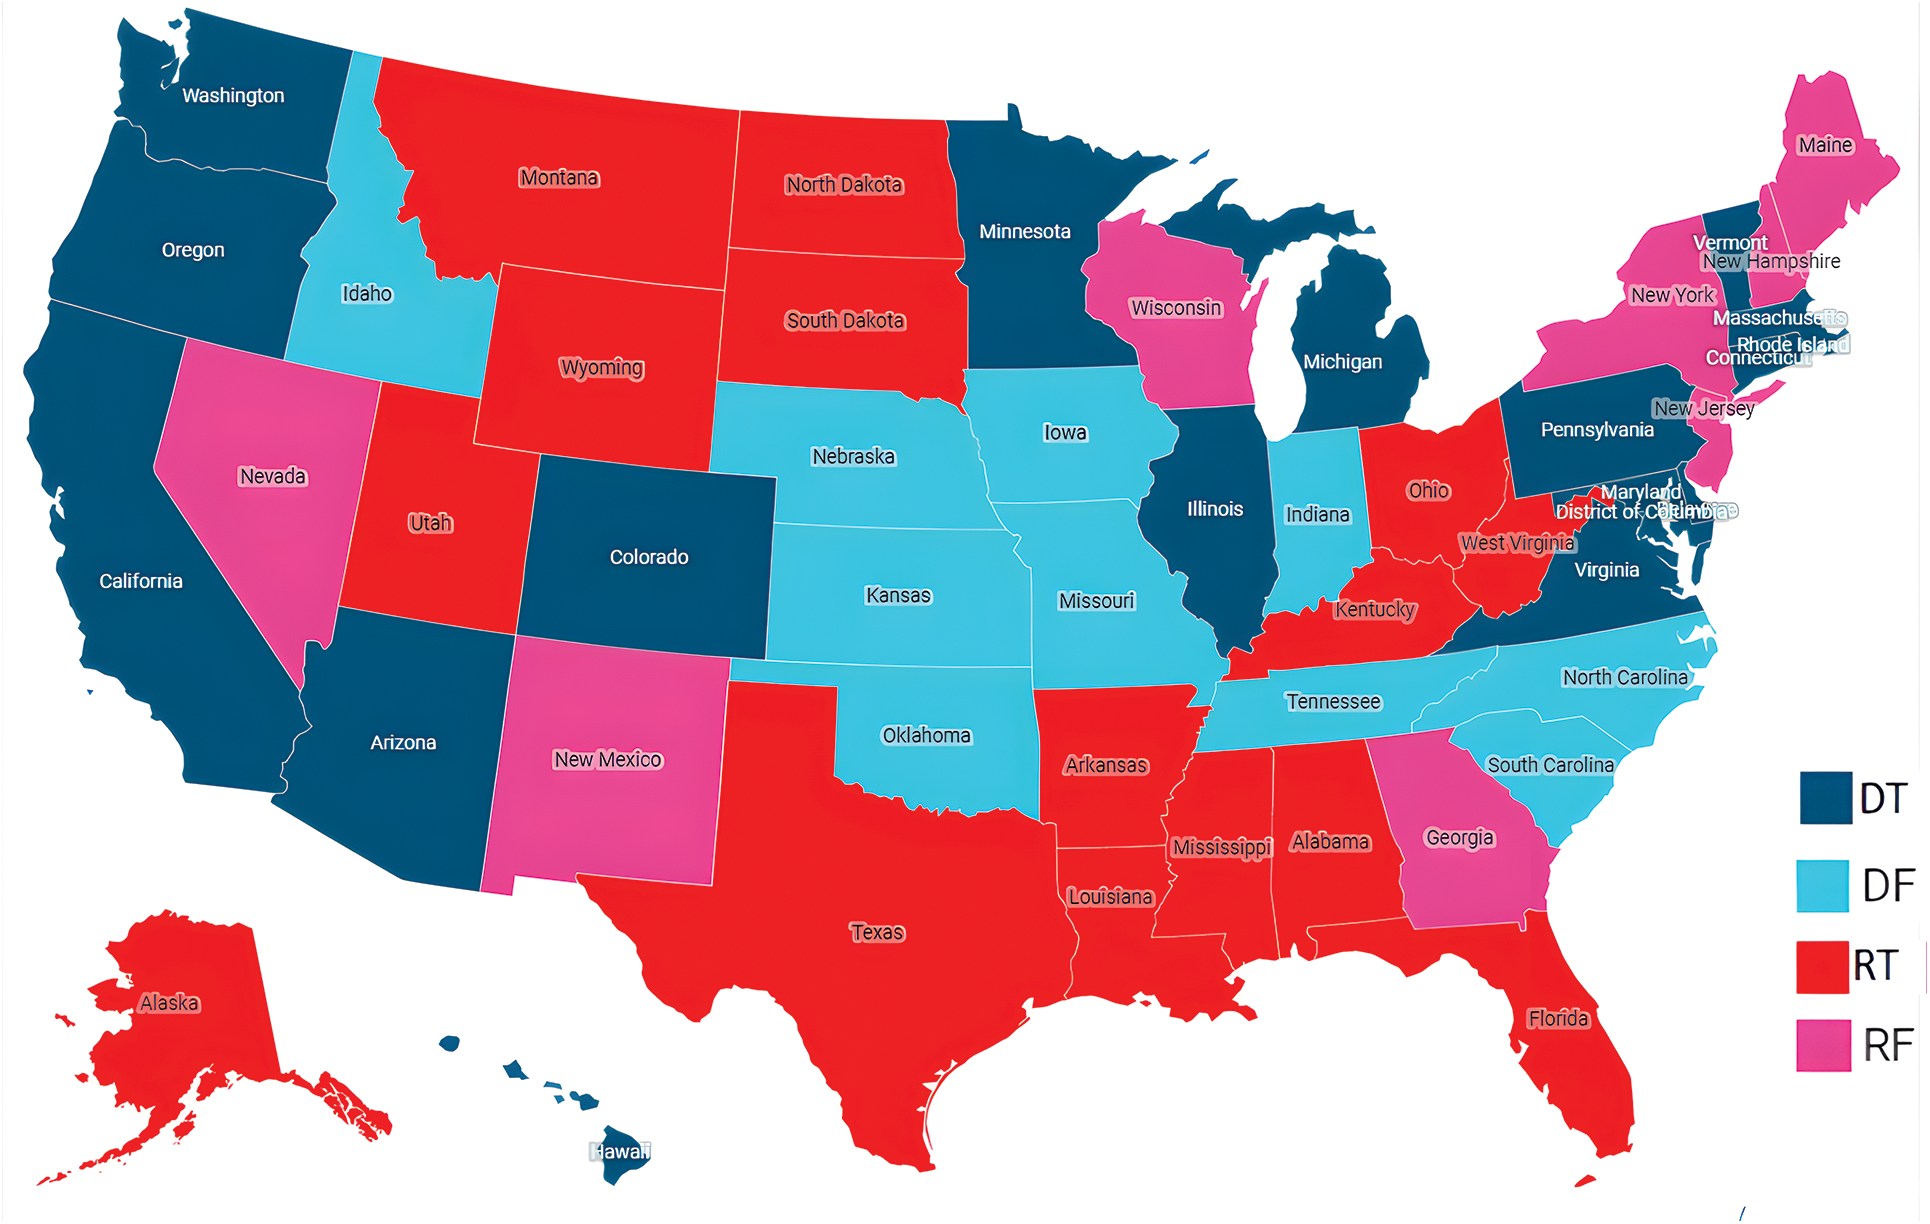
Figure 5: State-level election prediction
4.3.2 CLEP: Country-Level Election Prediction
We considered tweets for election prediction regardless of their location information. We predicted and assigned the sentiment label to each tweet for both parties. Supplementary Fig. S7 (rule-based) and Fig. S8 (transformer-based) show the monthly distribution of sentiments for the Republican and Democratic Parties from December 2019 to November 2020.
Fig. 6 shows overall sentiment labels for Republican and Democratic Parties using VADER, BERTweet, and ElecBERT. It can be seen that using the VADER approach, the Democratic Party has a higher positive sentiment percentage and lower negative and neutral sentiment percentages. Democratic is the clear winner if we consider positive sentiments only, but this will lead to a higher MAE = 4.565 (56.81% Democratic and 43.18% Republican).
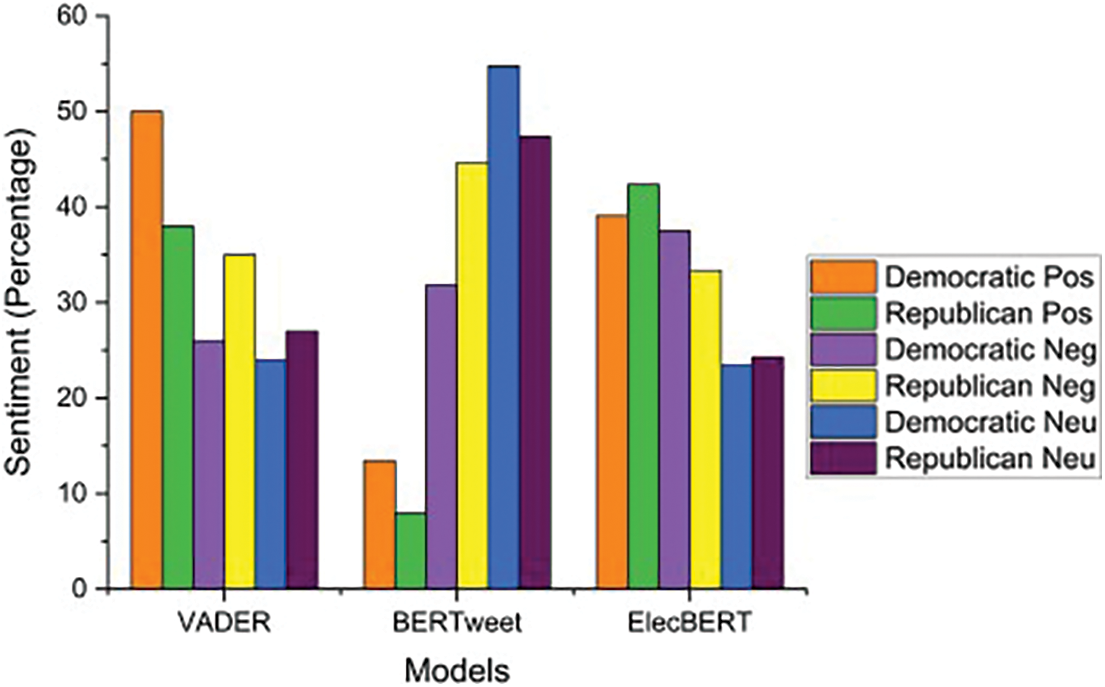
Figure 6: Sentiment analysis percentages for Democratic and Republican parties using VADER, BERTweet, and ElecBERT
The use of sentiment percentages alone does not accurately reflect election outcomes. This study employed the CLEP approach to predict monthly vote shares for the Democratic and Republican Parties from December 2019 to November 2020. Supplementary Table S4 (CLEP-VADER) and Table S5 (CLEP-BERTweet) present these monthly vote shares. According to the CLEP-VADER approach, the average vote share for the Democratic Party is 51.23%, while the Republican Party has 48.77%. On the other hand, the CLEPBERTweet approach yielded a vote share of 78.50% for the Democratic Party and 21.50% for the Republican Party. Furthermore, CLEP-ElecBERT provided better results compared to CLEP-BERTweet, with a vote share of 45.98% for the Democratic Party and 54.02% for the Republican Party. This study also included normalized vote shares, ensuring the sum of the two parties’ vote shares is 100. Although both CLEP-VADER and CLEP-BERTweet predicted the Democratic Party as the clear winner, the rule-based CLEP-VADER approach produced better results. These findings highlight the misleading nature of shortterm data (e.g., 2–4 months before the election), emphasizing the importance of considering long-term data for more accurate predictions.
The results from CLEP-VADER, CLEP-BERTweet, and CLEP-ElecBERT were compared with five poll data (RealClearPolitics, Economist/YouGov, CNBC, Fox News, and SurveyUSA), and real US 2020 election results (See Tables 3 and 4). Table 3 shows the predicted vote shares of the CLEP approach and polls, as well as the real election. The sum of the two parties in poll results, and real election results is not 100. This is because, these results include results related to “third parties” such as Libertarians, Green Party, Natural Law Party, and Constitution Party. Our main focus in this case study is the two parties–the Republican Party and the Democratic Party. To solve this issue, we normalized the values for each party. The Democratic Normalized and Republican Normalized columns show the percentage vote shares of each party, which were adjusted to 100% total vote share. The final elections were held on November 3rd, 2020. All the polls presented their predicted results between 29th October and 2nd November. We presented the average vote share results (From 5th December 2019 to 31st October 2020) and compared them with the polls and final election results. Sentiment percentages do not present correct outcomes of elections.


Table 4 shows the comparison between predicted (polls and ours) results and final results using MAE and RMSE. It shows the MAE for each party using unnormalized vote shares each party received using polls, our models, and real results. MAE and RMSE show the average error for both parties. The “MAE Normalized” shows the error for the normalized vote shares each party received. It can be seen from the table that our results using CLEP-VADER outperform other polls’ results, including transformer-based approaches such as CLEP-BERTweet and CLEP-ElecBERT. Our model achieved a low MAE of 0.87 and RMSE of 1.216, as well as a low MAE Normalized of 0.92. This means that our model provided the most accurate prediction of the US Presidential Election compared to other polls. Additionally, the MAE and RMSE for the Democratic Party were exceptionally low at 0.02, which shows the accuracy of our model in predicting the Democratic Party’s vote share. In conclusion, our CLEP-VADER model outperformed other polls in predicting the US Presidential Election, indicating the effectiveness of our approach in sentiment analysis.
The study introduces the LEPM that utilizes social media (Twitter) data and integrates locationaware sentiment analysis techniques at both the state/region and country levels. LEPM accurately predicts the support and opposition strength of political parties and candidates. The research findings demonstrate the effectiveness of LEPM in predicting election results at both the state and country levels. The study classified potential voters into two categories: those with available location data and those without. For the former category, the approach detects the location of voters from the metadata of their tweets. In cases where no explicit location is given, the VotLocaDetect approach investigates their profiles and recent tweets to determine their locations. For the latter category, where voter locations are unavailable, predictions are made at the state/regional level using the prior category. At the country level, both categories are considered for predicting elections.
The study employs rule-based sentiment analysis (VADER) as well as transformers-based sentiment analysis models (BERTweet, ElecBERT). These sentiment analysis approaches prove highly effective in predicting election outcomes, with the rule-based approach yielding the most accurate results. Predicting vote share provides insights into the expected vote share of each party.
LEPM successfully predicts the US 2020 Presidential Elections in forty-one states with an 80.40% accuracy at the state level. At the country level, the results of CLEP-VADER outperform other predicted polls, including CLEP-BERTweet and CLEP-ElecBERT. The overall mean absolute error (MAE) for CLEP-VADER is 0.87, with an error of 0.02 for the Democratic Party and 1.72 for the Republican Party. In contrast, CLEP-BERTweet and CLEP-ElecBERT show higher MAE (26 and 6.27, respectively) and RMSE (26.014 and 6.327, respectively), indicating that the Democratic Party is the winner. Overall, LEPM proves to be a successful alternative to traditional polls and other approaches, providing more accurate predictions with a low MAE of 0.84. These findings have implications for future election predictions and underscore the importance of leveraging social media data for accurate and timely results.
The study concludes that examining elections at both the country and state/regional levels is essential for predicting the head of a country, such as the President or Prime Minister. This approach helps to gain a deeper understanding of voters’ political opinions. Additionally, party hashtags are found to accurately predict US presidential elections when tweets are considered over a longer timeframe. However, predictions at the state level may be slightly less accurate due to the limited data available for each state. In contrast, predictions at the country level demonstrate high accuracy and correctly predict the final election outcomes. The study also highlights the superior performance of the rule-based approach compared to the transformer-based approach in predictions.
For future work, it is recommended to analyze and compare tweets related to party mentions and candidate mentions/hashtags with current results. The potential limitations of collecting tweets weekly, which may result in missing some tweets, should be considered. Furthermore, exploring the emotions of voters, such as anger, happiness, disgust, and surprise, can provide a better understanding of voters’ behavior toward political events. Future research should also consider investigating the impact of tweets generated from outside a country when analyzing country-level data. Analyzing languages other than English and incorporating them into the analysis can improve predictions at the state level. Additionally, exploring other sentiment analysis and location prediction models based on deep learning techniques is recommended. Developing a prototype of the system would be beneficial. Also, analyzing tweets related to “third parties” in future studies.
Acknowledgement: Not applicable.
Funding Statement: The research work was funded by the Beijing Municipal Natural Science Foundation (Grant No. 4212026), and the Foundation Enhancement Program (Grant No. 2021-JCJQ-JJ-0059).
Author Contributions: The authors confirm their contribution to the paper as follows: Conceptualization: A.K., and N.B.; methodology: A.K.; software: A.K., and N.B.; validation: A.K., and N.B.; formal analysis: H.Z., N.B., A.A., and M.K.; investigation: A.K., N.B., A.A., and M.K.; resources: A.K., and N.B.; data curation: A.K., and N.B..; writing—original draft preparation: A.K.; writing—review and editing: A.K., H.Z, N.B., A.A, and M.K.; visualization: A.K., and N.B.; supervision: H.Z.; project administration: H.Z.; funding acquisition: H.Z. All authors reviewed the results and approved the final version of the manuscript.
Availability of Data and Materials: The data used in this study is available at “https://doi.org/10.57967/hf/1242”.
Conflicts of Interest: The authors declare that they have no conflicts of interest to report regarding the present study.
Supplementary Materials: The supplementary material is available online at https://doi.org/10.32604/cmc.2023.044403.
References
1. K. D. S. Brito, R. L. C. S. Filho and P. J. L. Adeodato, “A systematic review of predicting elections based on social media data: Research challenges and future directions,” IEEE Transactions on Computational Social Systems, vol. 8, no. 4, pp. 819–843, 2021. [Google Scholar]
2. A. Khan, H. Zhang, N. Boudjellal, A. Ahmad, J. Shang et al., “Election prediction on Twitter: A systematic mapping study,” Complexity, vol. 2021, pp. 5565434, 2021. [Google Scholar]
3. B. J. G. Praciano, J. P. C. L. da Costa, J. P. A. Maranhao, F. L. L. de Mendonca, R. T. de Sousa Junior et al., “Spatio-temporal trend analysis of the Brazilian elections based on Twitter data,” in IEEE Int. Conf. on Data Mining Workshops (ICDMW), Beijing, China, pp. 1355–1360, 2019. [Google Scholar]
4. R. Castro, L. Kuffó and C. Vaca, “Back to #6D: Predicting Venezuelan states political election results through Twitter,” in 4th Int. Conf. on eDemocracy and eGovernment (ICEDEG), Quito, Ecuador, pp. 148–153, 2017. [Google Scholar]
5. M. Coletto, C. Lucchese, S. Orlando and R. Perego, “Electoral predictions with Twitter: A machine-learning approach,” in Proc. of the 6th Italian Information Retrieval Workshop, Cagliari, Italy, pp. 1–12, 2015. [Google Scholar]
6. B. S. Bello, I. Inuwa-Dutse and R. Heckel, “Social media campaign strategies: Analysis of the 2019 Nigerian elections,” in 6th Int. Conf. on Social Networks Analysis, Management and Security (SNAMS), Granada, Spain, pp. 142–149, 2019. [Google Scholar]
7. L. Chen, W. Wang and A. P. Sheth, “Are twitter users equal in predicting elections? A study of user groups in predicting 2012 U.S. republican presidential primaries,” in Int. Conf. on Social Informatics (SocInfo), Lausanne, Switzerland, pp. 379–392, 2012. [Google Scholar]
8. L. Oikonomou and C. Tjortjis, “A method for predicting the winner of the USA presidential elections using data extracted from Twitter,” in South-East Europe Design Automation, Computer Engineering, Computer Networks and Social Media Conf. (SEEDA_CECNSM), Kastoria, Greece, pp. 1–8, 2018. [Google Scholar]
9. B. Heredia, J. D. Prusa and T. M. Khoshgoftaar, “Location-based twitter sentiment analysis for predicting the U.S 2016 presidential election,” in Proc. of the 31st Int. Florida Artificial Intelligence Research Society Conf. (FLAIRS), Melbourne (FLUSA, pp. 265–270, 2018. [Google Scholar]
10. C. J. Hutto and E. Gilbert, “VADER: A parsimonious rule-based model for sentiment analysis of social media text,” in Int. Conf. on Weblogs and Social Media (ICWSM), Ann Arbor (MIUSA, pp. 216–225, 2014. [Google Scholar]
11. D. Q. Nguyen, T. Vu and A. T. Nguyen, “BERTweet: A pre-trained language model for English Tweets,” in Proc. of the 2020 Conf. on Empirical Methods in Natural Language Processing: System Demonstrations, pp. 9–14, 2020. [Google Scholar]
12. D. Antonakaki, P. Fragopoulou and S. Ioannidis, “A survey of Twitter research: Data model, graph structure, sentiment analysis and attacks,” Expert Systems with Applications, vol. 164, pp. 114006, 2021. [Google Scholar]
13. A. Motwakel, H. J. Alshahrani, A. Q. A. Hassan, K. Tarmissi, A. S. Mehanna et al., “Sine cosine optimization with deep learning-based applied linguistics for sentiment analysis on COVID-19 tweets,” Computers, Materials & Continua, vol. 75, no. 3, pp. 4767–4783, 2023. [Google Scholar]
14. U. Yaqub, N. Sharma, R. Pabreja, S. A. Chun, V. Atluri et al., “Location-based sentiment analyses and visualization of Twitter election data,” Digital Government: Research and Practice, vol. 1, no. 2, pp. 1–19, 2020. [Google Scholar]
15. P. Kassraie, A. Modirshanechi and H. K. Aghajan, “Election vote share prediction using a sentiment-based fusion of Twitter data with Google trends and online polls,” in 6th Int. Conf. on Data Science, Technology and Applications, Madrid, Spain, pp. 363–370, 2017. [Google Scholar]
16. A. J. Wicaksono, Suyoto and Pranowo, “A proposed method for predicting US presidential election by analyzing sentiment in social media,” in 2nd Int. Conf. on Science in Information Technology (ICSITech) Information Science for Green Society and Environment, Balikpapan, Indonesia, pp. 276–280, 2017. [Google Scholar]
17. D. K. Nugroho, “US presidential election 2020 prediction based on Twitter data using lexicon-based sentiment analysis,” in 11th Int. Conf. on Cloud Computing, Data Science and Engineering, Uttar Pradesh, India, pp. 136–141, 2021. [Google Scholar]
18. H. N. Chaudhry, Y. Javed, F. Kulsoom, Z. Mehmood, Z. I. Khan et al., “Sentiment analysis of before and after elections: Twitter data of U.S. election 2020,” Electronics, vol. 10, no. 17, pp. 2082, 2021. [Google Scholar]
19. M. Plummer, M. A. Palomino and G. L. Masala, “Analysing the sentiment expressed by political audiences on Twitter: The case of the 2017 UK general election,” in Int. Conf. on Computational Science and Computational Intelligence (CSCI), Las Vegas (NVUSA, pp. 1449–1454, 2018. [Google Scholar]
20. W. Budiharto and M. Meiliana, “Prediction and analysis of Indonesia presidential election from Twitter using sentiment analysis,” Journal of Big Data, vol. 5, no. 1, pp. 1–10, 2018. [Google Scholar]
21. A. Nawaz, T. Ali, Y. Hafeez, S. ur Rehman and M. R. Rashid, “Mining public opinion: A sentiment based forecasting for democratic elections of Pakistan,” Spatial Information Research, vol. 30, no. 1, pp. 169–181, 2022. [Google Scholar]
22. M. Xuanyuan, L. Xiao and M. Duan, “Sentiment classification algorithm based on multi-modal social media text information,” IEEE Access, vol. 9, pp. 33410–33418, 2021. [Google Scholar]
23. X. Xiong, S. Qiao, N. Han, Y. Li, F. Xiong et al., “Affective impression: Sentiment-awareness POI suggestion via embedding in heterogeneous LBSNs,” IEEE Transactions on Affective Computing, vol. 13, no. 1, pp. 272–284, 2022. [Google Scholar]
24. T. Hu, B. She, L. Duan, H. Yue and J. Clunis, “A systematic spatial and temporal sentiment analysis on Geo-Tweets,” IEEE Access, vol. 8, pp. 8658–8667, 2020. [Google Scholar]
25. N. Eligüzel, C. Çetinkaya and T. Dereli, “Comparison of different machine learning techniques on location extraction by utilizing geo-tagged tweets: A case study,” Advanced Engineering Informatics, vol. 46, pp. 101151, 2020. [Google Scholar]
26. Y. Guo, Y. Ge, Y. C. Yang, M. A. Al-Garadi and A. Sarker, “Comparison of pretraining models and strategies for health-related social media text classification,” Healthcare, vol. 10, no. 8, pp. 1478, 2022. [Google Scholar] [PubMed]
27. L. F. Simanjuntak, R. Mahendra and E. Yulianti, “We know you are living in Bali: Location prediction of Twitter users using BERT language model,” Big Data and Cognitive Computing, vol. 6, no. 3, pp. 77, 2022. [Google Scholar]
28. A. Khan, H. Zhang, N. Boudjellal, A. Ahmad and M. Khan, “Improving sentiment analysis in election-based conversations on Twitter with ElecBERT language model,” Computers, Materials & Continua, vol. 76, no. 3, pp. 3345–3361, 2023. [Google Scholar]
29. A. Botchkarev, “A new typology design of performance metrics to measure errors in machine learning regression algorithms,” Interdisciplinary Journal of Information, Knowledge, and Management, vol. 14, pp. 45–76, 2019. [Google Scholar]
30. R. Srivastava, M. P. S. Bhatia, H. Kumar and S. Jain, “Analyzing Delhi assembly election 2015 using textual content of social network,” in ACM Int. Conf. Proc. Series, New York, USA, pp. 78–85, 2015. [Google Scholar]
31. B. R. Naiknaware and S. S. Kawathekar, “Prediction of 2019 Indian election using sentiment analysis,” in Proc. of the Int. Conf. on I-SMAC (IoT in Social, Mobile, Analytics and Cloud), Palladam, India, pp. 660–665, 2019. [Google Scholar]
Cite This Article
 Copyright © 2023 The Author(s). Published by Tech Science Press.
This work is licensed under a Creative Commons Attribution 4.0 International License , which permits unrestricted use, distribution, and reproduction in any medium, provided the original work is properly cited.
 Downloads
 Citation Tools