
 Submit a Paper
 Propose a Special lssue
 Open Access
ARTICLE

Efficient Object Segmentation and Recognition Using Multi-Layer Perceptron Networks
1 Department of Computer Science, Air University, Islamabad, 44000, Pakistan
2 Department of Information Systems, College of Computer and Information Sciences, Princess Nourah bint Abdulrahman University, P.O. Box 84428, Riyadh, 11671, Saudi Arabia
3 Information System Department, Umm Al-Qura University, Makkah, Saudi Arabia
4 Department of Computer Science, College of Computer Science and Information System, Najran University, Najran, 55461, Saudi Arabia
5 Department of Computer Engineering, Tech University of Korea, Gyeonggi-do, 15073, South Korea
* Corresponding Author: Jeongmin Park. Email:
Computers, Materials & Continua 2024, 78(1), 1381-1398. https://doi.org/10.32604/cmc.2023.042963
Received 17 June 2023; Accepted 13 November 2023; Issue published 30 January 2024
 View Full Text
 Download PDF
Abstract
Object segmentation and recognition is an imperative area of computer vision and machine learning that identifies and separates individual objects within an image or video and determines classes or categories based on their features. The proposed system presents a distinctive approach to object segmentation and recognition using Artificial Neural Networks (ANNs). The system takes RGB images as input and uses a k-means clustering-based segmentation technique to fragment the intended parts of the images into different regions and label them based on their characteristics. Then, two distinct kinds of features are obtained from the segmented images to help identify the objects of interest. An Artificial Neural Network (ANN) is then used to recognize the objects based on their features. Experiments were carried out with three standard datasets, MSRC, MS COCO, and Caltech 101 which are extensively used in object recognition research, to measure the productivity of the suggested approach. The findings from the experiment support the suggested system’s validity, as it achieved class recognition accuracies of 89%, 83%, and 90.30% on the MSRC, MS COCO, and Caltech 101 datasets, respectively.Keywords
Segmenting and recognizing objects of interest in images and videos can be vital for various applications, including video and security surveillance [1,2] hyperspectral imaging [3], human detection [4], video streaming [5], emotion recognition [6], and traffic flow prediction [7], medical field [8], Self-driving cars [9], etc. This makes posture recognition [10] and scene understanding [11] sizzling issues in artificial intelligence (AI) and computer vision (CV). The purpose of the field is in the direction of teaching machines to understand (recognize) the content of images in the same way as humans. The extent of this research is constrained to object segmentation and recognition. While there has been significant progress in object detection and segmentation techniques, more can yet be done. Researchers are driven to create algorithms that are more precise, reliable, and scalable than those used today to overcome the drawbacks and difficulties of existing methods. To produce innovative findings and receive respect from the academic community, researchers in the fields of object detection and segmentation compete to surpass one another in benchmarks and challenges. The outcome of this research could influence a variety of areas and lead to better monitoring and security systems, safer autonomous vehicles, and increased industrial automation. To comprehend visual scenes, acquire data, and come to conclusions, segmentation sets object borders while object detection identifies specific objects in images or videos.
We outline a thorough approach to accurate object recognition in tropical settings. Through a series of carefully thought-out steps, our technique ensures accurate and successful object identification. To decrease noise while keeping important edge features, we first preprocess all RGB images using spatial domain filtering. Then, using our special “k-region fusion” method, which combines region-based segmentation and k-means clustering, we execute image segmentation to extract necessary objects from the background. By creating more meaningful and coherent object portions, this fusion technique raises the quality of segmentation. Then, we extract features utilizing two distinct descriptors: SIFT (Scale Invariant Feature Transform) and ORB (Oriented FAST and Rotated BRIEF). Finally, object classification is accomplished using an artificial neural network. Large, publically accessible datasets were used in the experiment, including MSRC-v2, MSCOCO 2017, and Caltech 101. This work aims to address the issue of the need for improved object identification under difficult tropical environments. Current solutions sometimes lack the precision and durability required for critical applications like privacy and vehicle autonomy. The motivations behind this include the industry’s competitiveness, its potential for widespread influence, and the need to enhance critical performance metrics. Over time, these elements will contribute to the development of safer and more efficient systems in several fields.
Our research’s primary insights can be summed up as follows:
• The incorporation of a spatial domain filter during pre-processing successfully reduces noise in the images while maintaining crucial edge information, producing improved segmentation results.
• The development of “k-region fusion” illustrates the potency of merging region-based segmentation with k-means clustering as a strategy for segmenting images.
• Our robust object recognition approach is demonstrated by our high-performance classification system, which is driven by an Artificial Neural Network and features that originate from ORB and SIFT descriptors.
• We have substantially elevated the precision, sensitivity, F1 score, and mean accuracy performance measures for object recognition when compared to prior approaches.
• In the experimental results, the suggested model’s impact has been confirmed across three publically accessible datasets, displaying exceptional performance.
The remaining part of this article is structured into several units that provide a comprehensive overview of the proposed system, its approach, and experimental results. In Section 2, we discuss and analyze relevant investigated work related to the presented system, providing a comprehensive review of the existing literature. Section 3 defends the whole methodology of our system, which includes a general pre-classification procedure. Section 4 examines the datasets used in our recommended approach and demonstrates the structure’s strength over various tests. Finally, in Section 5, we summarise our significant results and contributions to the research. Overall, this work presents a thorough description of our proposed approach and its potential consequences for the research field.
Object detection and recognition have been progressively developed by researchers for several years [12]. They have investigated the possibility of complex images for anomaly detection [13], videos in depth and RGB + D [14] (Red, Green, Blue, Depth) films to improve the effectiveness of their processes in addition to ordinary RGB images. The complete image is typically utilized as feedback, and characteristics are dug out from it, which is a modest and effective method of identifying multiple objects in a single image. Segmentation is an essential first step in many techniques, including mine. This involves dividing the image into distinctive, meaningful regions with identical characteristics based on image component incoherence or similarities. The performance of succeeding processes is strongly dependent on the accuracy of segmentation findings. Furthermore, tools for segmentation and classification for feature detection method [15]. In the proposed approach, objects are generated through an image segmentation process, wherein pixels with similar spectral characteristics are grouped to form a segment. Neural network implementation for object recognition then leads to more precise results. As a result, associated work can be classified into object recognition using Red, Green, Blue (RGB), and depth images.
2.1 Object Detection and Recognition over RGB Images
In the past, image-based approaches were frequently exploited. Chaturvedi et al. [16] used a combination of different classifiers with the Viola-Jones algorithm and the You Look Only Once version 3 (YOLOv3) algorithm for object recognition. The focus of their research was on selecting an algorithm that provides us with a good balance of accuracy and efficiency. Li et al. [17] introduced an object identification system centered around the best Bag of Words model and Area of Interest (AOI). They estimated the Region of Interest (ROI) using a saliency map and a Shi-Thomasi corner. To recognize and classify objects, they used Scale Invariant Feature Transform (SIFT) feature descriptors, a visual codebook, a Gaussian Mixture Model (GMM), and a Support Vector Machine (SVM). Deshmukh et al. [18] employed a novel processing strategy to find objects in original images by merging the object detection API, a mixture of identified edges, and an edge detection algorithm.
2.2 Object Detection and Recognition over Depth Images
Many researchers have engaged in identifying the objects of interest in an image over the last couple of years. As depth images are insensitive to lighting variations and intrinsically integrate 3D data, numerous intensity-based detection methods have been suggested. Lin et al. [19] presented a strong and reliable system for object identification in their research article. Their approach includes applying probabilistic image segmentation to remove the background from images. Cupec et al. [20] developed a method for recognizing fruits using depth image analysis. This strategy builds a group of triangles from depth images using Delaunay triangulation. Delaunay triangulation is a geometry technique aimed at generating a standard triangular grid from a given point collection. Then, using a region growth mechanism, convex surfaces were formed by joining triangles, each of which represented a possible fruit. Ahmed et al. [21] recommended a different approach by a using Histogram of Oriented Gradients (HOG) to excerpt features and detect an object by applying Nearest Neighbor search (NNS). Finally, they used the Hough voting algorithm to recognize the objects.
This section outlines the proposed object recognition context. The schematic architecture is portrayed in Fig. 1. Each RGB image was pre-processed. To smooth the images, the spatial domain filter is utilized. The images were then fragmented into foreground and background using the k-region fusion technique. The desired objects are present in the resulting foreground. For feature extraction, two kinds of features Oriented Fast and Robust Brief (ORB) and Scale Invariant Feature Transform (SIFT) were fused after extraction. Finally, the requested objects are classified using an artificial neural network. The subsections that follow describe each phase of the framework .
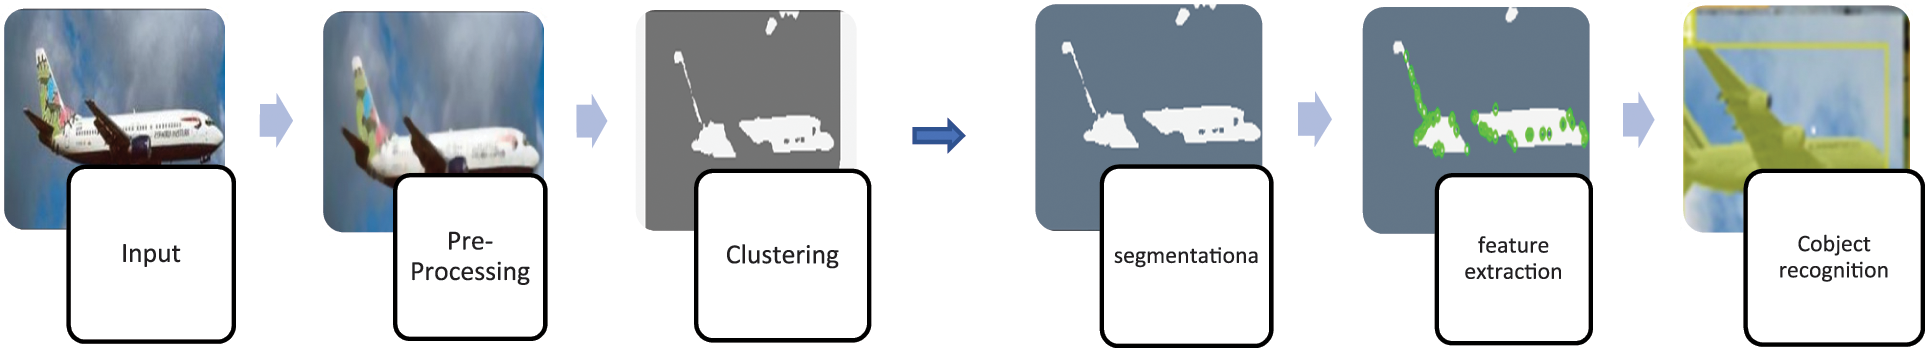
Figure 1: An overall description of the suggested system
3.1 Image Pre-Processing General
As part of the pre-processing, all RGB images in both datasets have undergone a filtering approach. Fig. 2 illustrates the outcome of the filtered images, demonstrating that pre-processing at this stage increases the entirety of the system’s efficiency. Furthermore, the image normalization and median filter employed in pre-processing are explored in further detail in the subsection that follows.
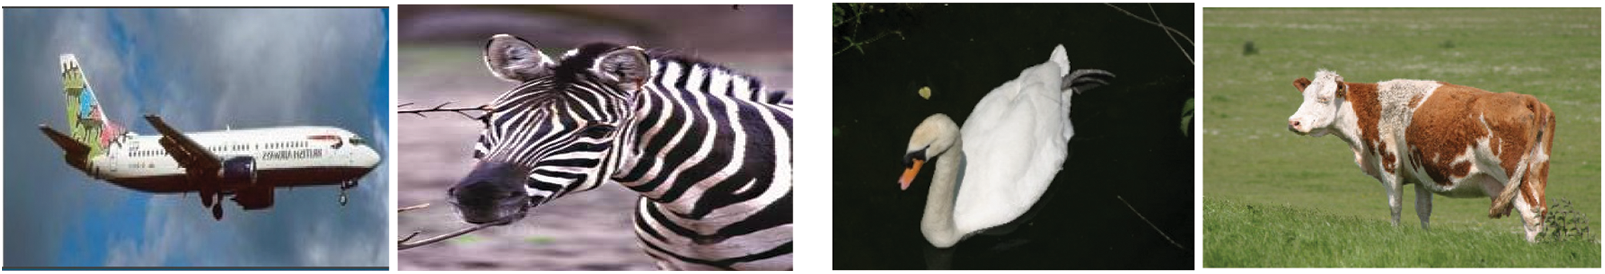
Figure 2: Original images (a) MS COCO (b) MSRC-v2
Normalization of an image is the process of altering the intensity values of pixels within an image to increase the image’s contrast. Datasets with the initial images are gathered underneath various conditions during pre-processing, such as radiance variations and dispersion of contrast [22], yielding more objects, greater intensity values, and different object scales in the images. To eliminate this unwanted information, we initially minimized the resolution to 213 × 213 by using fixed window resizing. Fig. 2 represents normalized images.
A median filter has been employed to enhance image quality as well as minimize noise. A median filter smoothed the images while keeping all of the objects’ edges [23]. The median filter is a nonlinear digital filter that is applied to eradicate distortion from an image or signal. This form of noise reduction is a popular pre-processing approach for improving the results of subsequent processing (such as edge identification on an image) [24]. This approach works by replacing every pixel value with the median value calculated from the adjacent pixels. Eqs. (1) and (2) can be used to define the smooth image obtained after applying the median filter. Fig. 3 is showing the pre-processed images of some classes from the mentioned datasets.
where
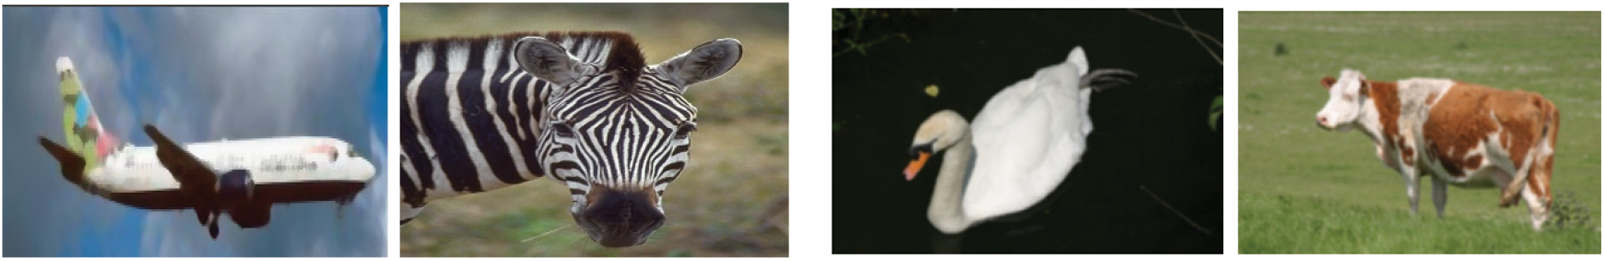
Figure 3: Outcomes after pre-processing (a) MS COCO (b) MSRC-v2
K-means clustering is a standard unsupervised machine learning technique for gathering information based on similarities. It can be used on a variety of data types, including images. K-means clustering can be used in image processing to group similar pixels together to simplify the image or extract useful information from it. K-means clustering can be used in image segmentation to group similar pixels together based on their color or texture, and thus separate regions of the image that have different color or texture characteristics [24]. To cluster homogeneous color regions, the k-mean algorithm is used, and it only requires the number of clusters k at the start, with no other prior knowledge required [25,26]. K-means clustering uses Euclidean distance as in Eq. (3) to find similarities between objects.
Assigning random centroids to clusters and updating them based on the mean of the objects in the cluster until convergence are the steps involved in K-means clustering [27,28]. Fig. 4 is showing a combined resultant flowchart after preprocessing and clustering on incorporated datasets.
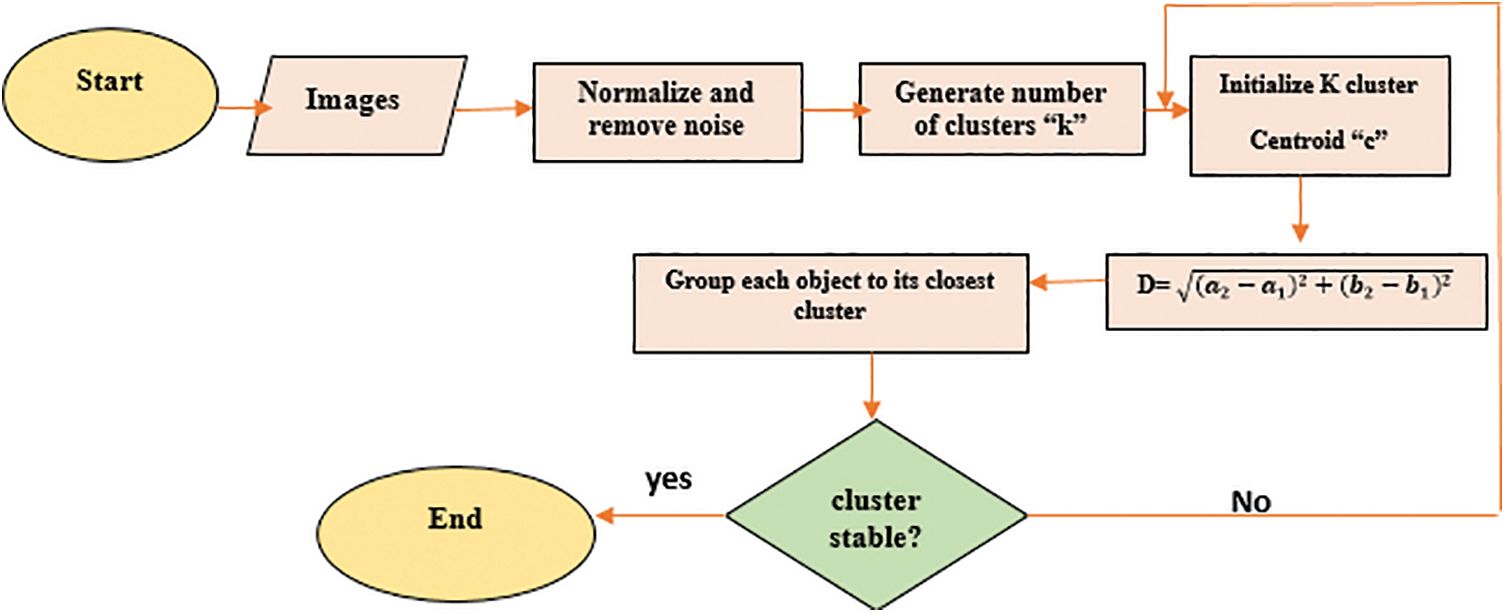
Figure 4: Combined flowchart for preprocessing and clustering
Image segmentation was carried out after pre-processing the images. The goal of region-based segmentation is to create a set of homogeneous regions based on these criteria [16]. In this article, in order to obtain better segmentation results, we initially apply k-region fusion (clustering using K-means to an image and then performing region-based segmentation on the generated clusters). Huda et al. suggested a method for region-merging segmentation [29]. K-means clustering can be used to cluster similar pixels together based on their color or texture reducing image complexity and improving the effectiveness of region-based segmentation [30]. We can identify regions with similar color or texture characteristics by grouping similar pixels into clusters, which can then be used as inputs for region-based segmentation (see Eq. (4)).
The similarities between neighboring pixels (i, j) are ascertained using region-based segmentation. Pixels that have similar properties will form a unique region [19,20]. Ahmed et al. also used regions to detect objects rather than the traditional sliding window method [21]. Adjacent pixels in an image are compared to the region’s reference intensity values at each pixel [22]. The adjacent pixel is chosen if the difference is less than or equal to the difference threshold. Fig. 5 displays the resultant clustered segmented images.

Figure 5: Resultant segmentation of k-region fusion
In this article, we incorporate the use of both Oriented Fast and Robust Brief (ORB) features and Scale Invariant Feature Transform (SIFT) features. The following subsections define the specifics and outcomes of the mentioned features. The process of identifying and extracting useful information, or features, from an image for further analysis or processing is known as feature extraction on an image. Feature extraction aims to reduce the number of features in a dataset by creating new features from the existing ones (and subsequently removing the original features). This new, more condensed collection of features should then serve as a representation of the vast majority of the details in the original set of features. The extracted features should capture important aspects of the image, such as texture, color, shape, or edges [31].
3.4.1 Oriented Fast and Robust Brief
The Oriented Fast and Robust Brief (ORB) [32] is a high-performance feature detector that combines the FAST (Features from Accelerated Segment Test) keypoint detector’s orientation and rotational resilience with the description of visual appearance BRIEF stands for “Binary Robust Independent Elementary Features” [33]. It detects key characteristics efficiently and provides a quick and reliable solution for feature extraction in computer vision applications. Location of key points determined by Eq. (5).
where i and j are the pixel intensity analyzed and determined at a and b, respectively. “u” and “v” is near the FAST feature point, a circle with a radius “r” of the vicinity u, v ɛ [−r, r]. Then figure out the center of mass, as presented in Eq. (6) which is also referred to as its “center of mass”.
We will calculate binary descriptors from BRIEF using Eqs. (7) and (8).
where I is an image and (a, b) are the pixel values. We can figure out the patch’s orientation and generate a vector from the center (Eq. (9)) of the corner to the centroid.
Fig. 6 depicts the retrieved characteristics using ORB.
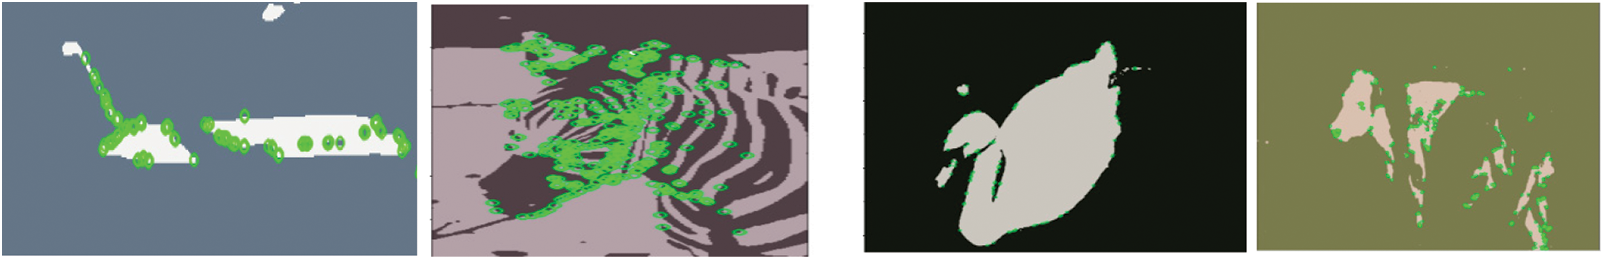
Figure 6: Features extracted using ORB on images from both datasets
3.4.2 Scale Invariant Feature Transform
To construct the set of image features, SIFT (see Algorithm 1) computed the following points, where H (a, b) is an input image, i and j are distances from points a and b [34], respectively, and is the Gaussian scale (see Eq. (10)). After fitting a model to determine scale and location (Eq. (11)), key points are chosen based on stability [35].
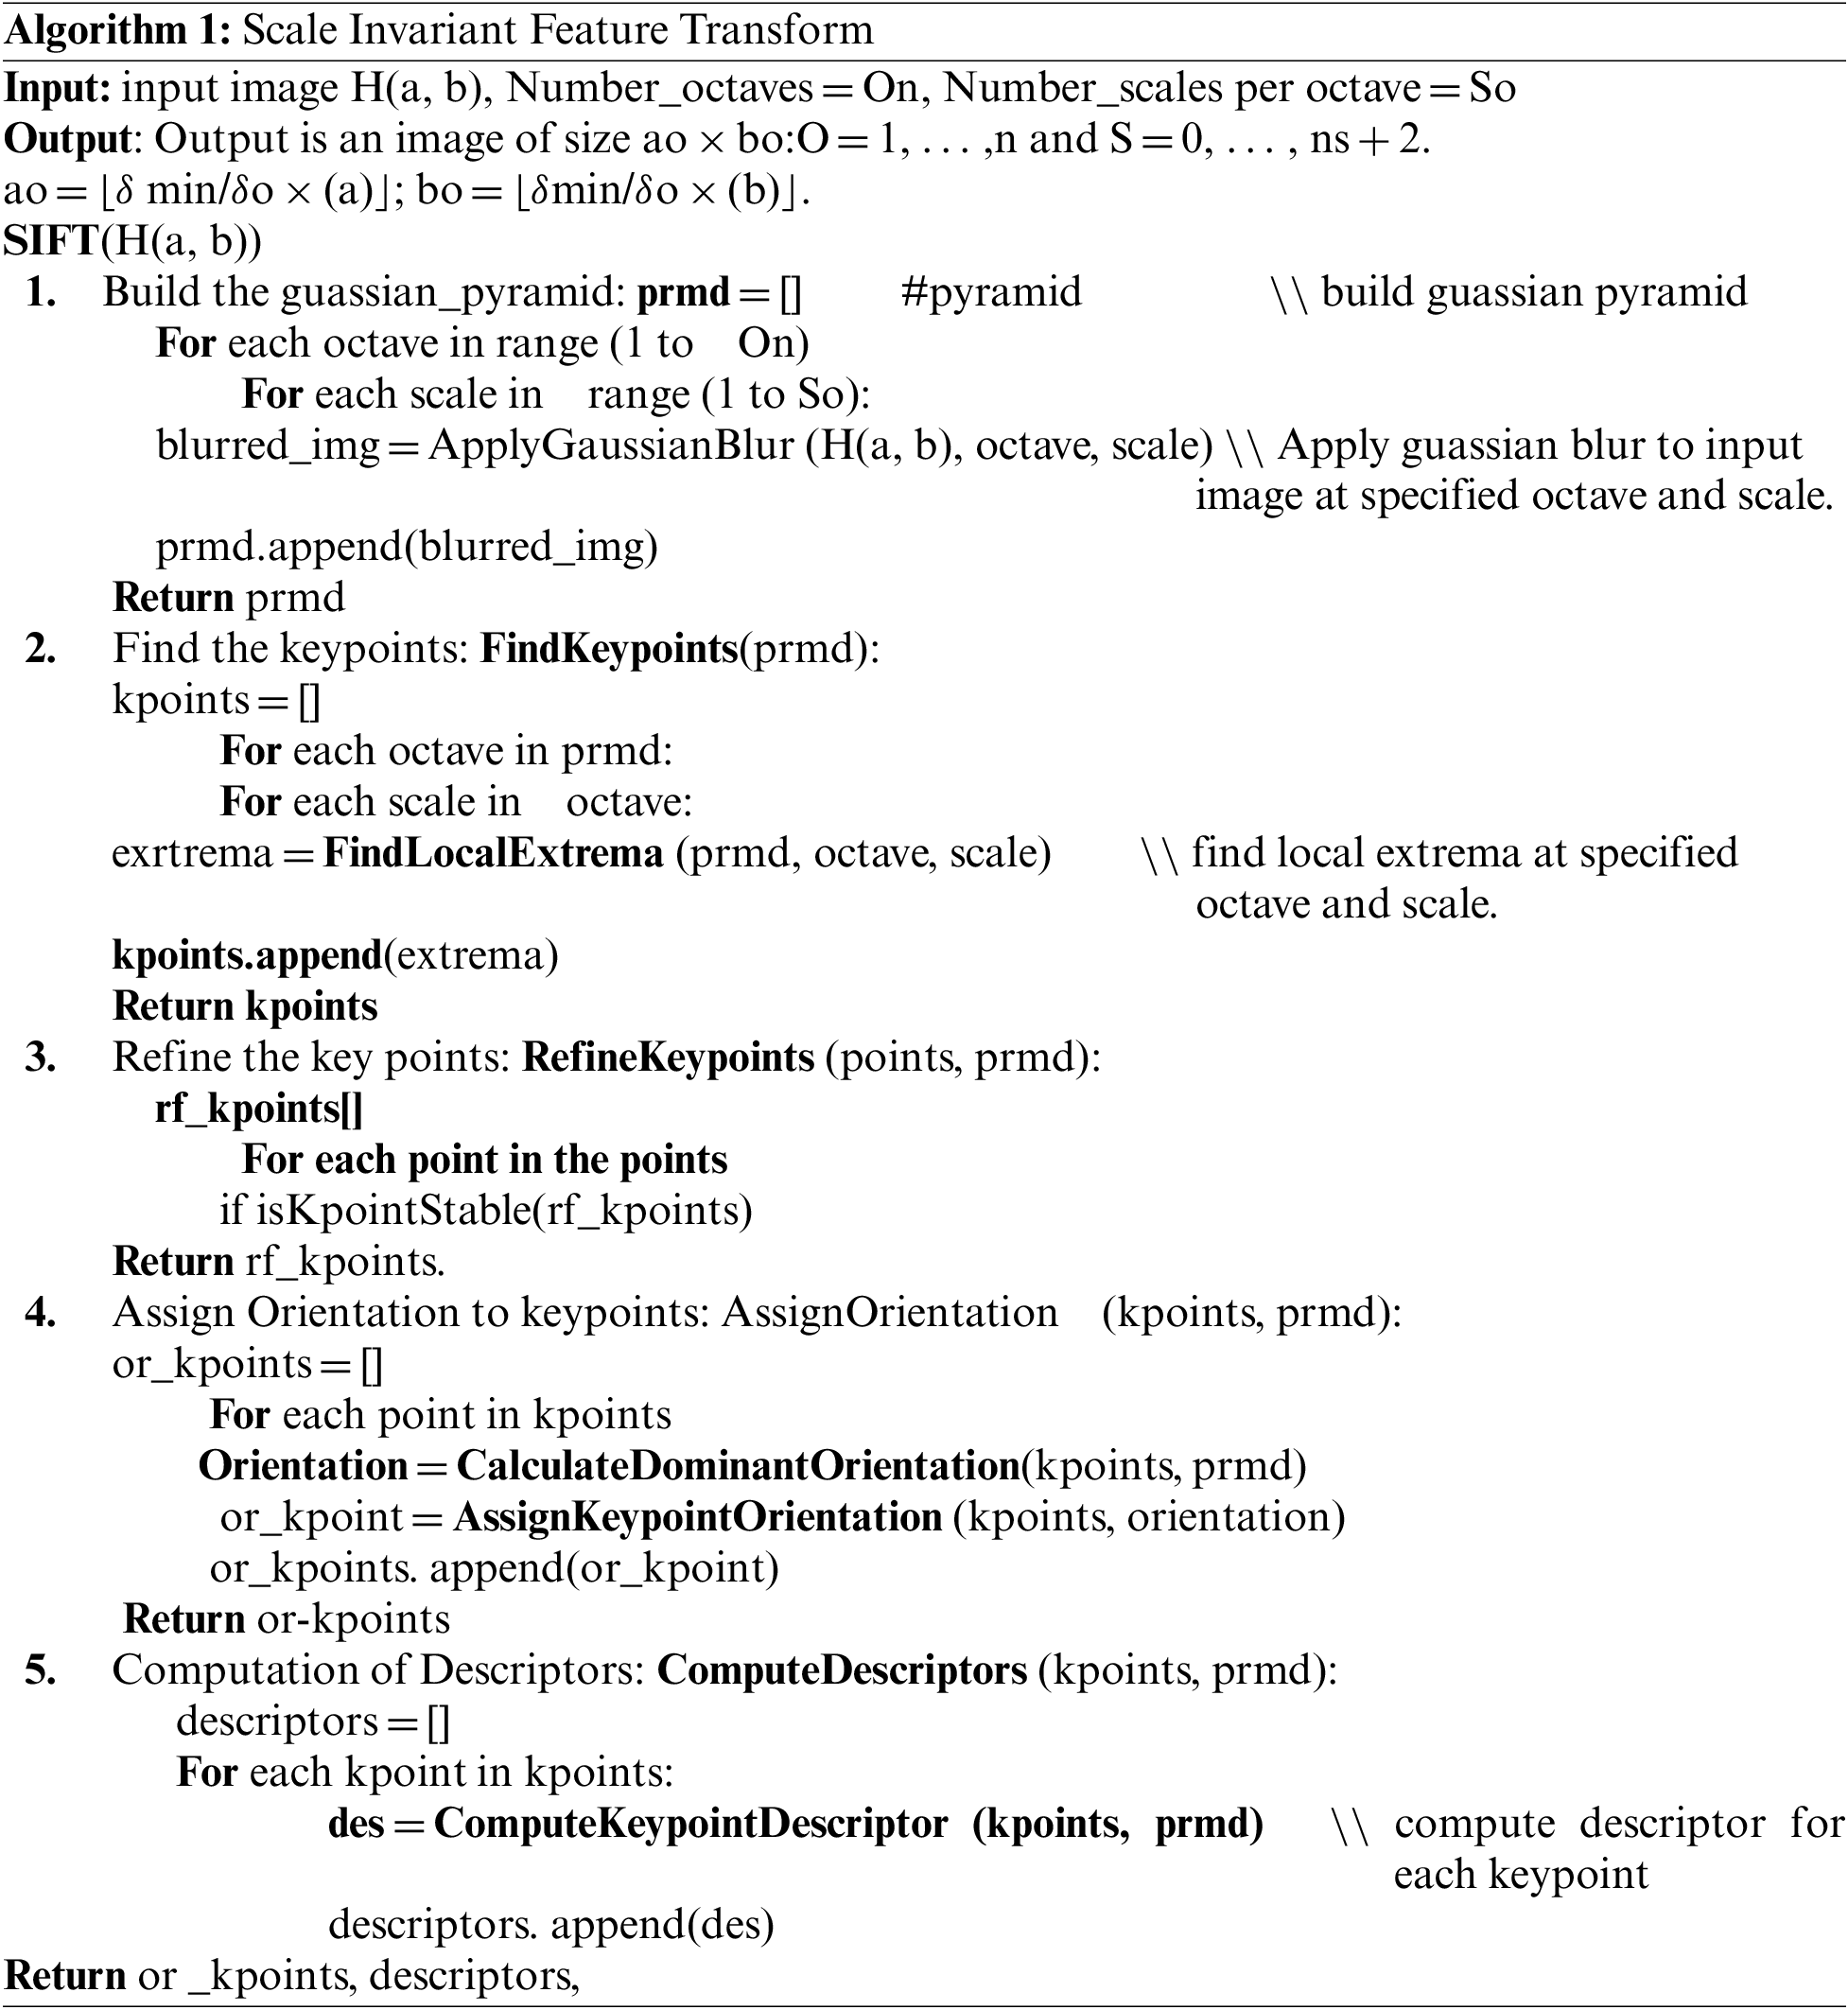
SIFT helps to regulate a direction for each key point to define a feature vector for each key [36].
where H (a, b) is an input image, i and j are the distances from point a, b and is the scale of Gaussian, respectively. The SIFT technique (Algorithm 1) is useful for 3D reconstruction and object detection. It can withstand variations in illumination, rotation, and image scale. Each key point’s direction is normalized by SIFT, creating a feature vector [37]. A key point has an orientation to maintain robustness against rotation variations and calculate gradient magnitude (Eq. (12)) G.M (a, b) and gradient rotation (Eq. (13)) G.R (a, b) [28] around collected key points.
Fig. 7 represents the extracted features by SIFT.
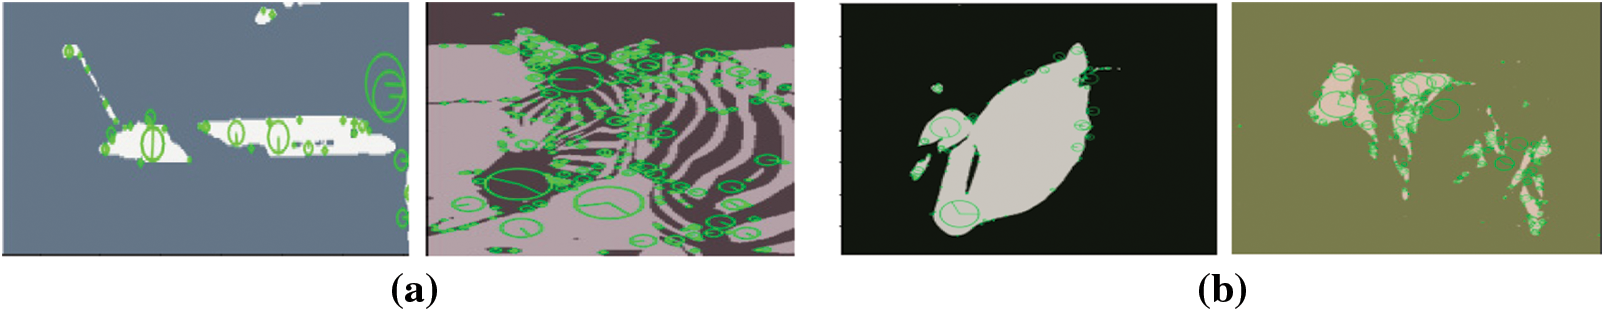
Figure 7: Features extracted using SIFT on images from both datasets
While SIFT is dependable and invariant, handling scale, rotation, and lighting changes using histograms of gradient magnitudes and orientations, ORB uses binary strings for effective and condensed keypoint encoding. The binary character of ORB and the stability of SIFT are combined in feature fusion to provide a potent keypoint representation that captures crucial visual information including texture, edges, and shape. Using these combined attributes, operations like object detection and image matching are greatly enhanced. The concatenated feature vector F_combined is given by Eq. (14).
where
Here, [F_SIFT, F_ORB] denotes the association of the SIFT feature vector F_SIFT with the ORB feature vector F_ORB to create a single feature vector with a combined dimensionality of D_combined in Eq. (15).
Neurons in the input (X), hidden, and output (Y) layers make up Artificial Neural Networks (ANNs). They can be divided into three groups: feedback networks, multi-layer feedforward networks [38], and single-layer feedforward networks. In this study, artificial neural networks are used to process data using artificial neurons. A neuron’s activation function, which is comparable to decision-making in the brain, is the result of inputs moving from one neuron to the next. Interconnected layers of nodes (neurons) make up ANNs, which receive inputs, process them, and then output the results [39]. Weights, which reflect neural connections and are modified throughout learning to improve task performance. In Algorithm 2, the functionality of ANN is described.
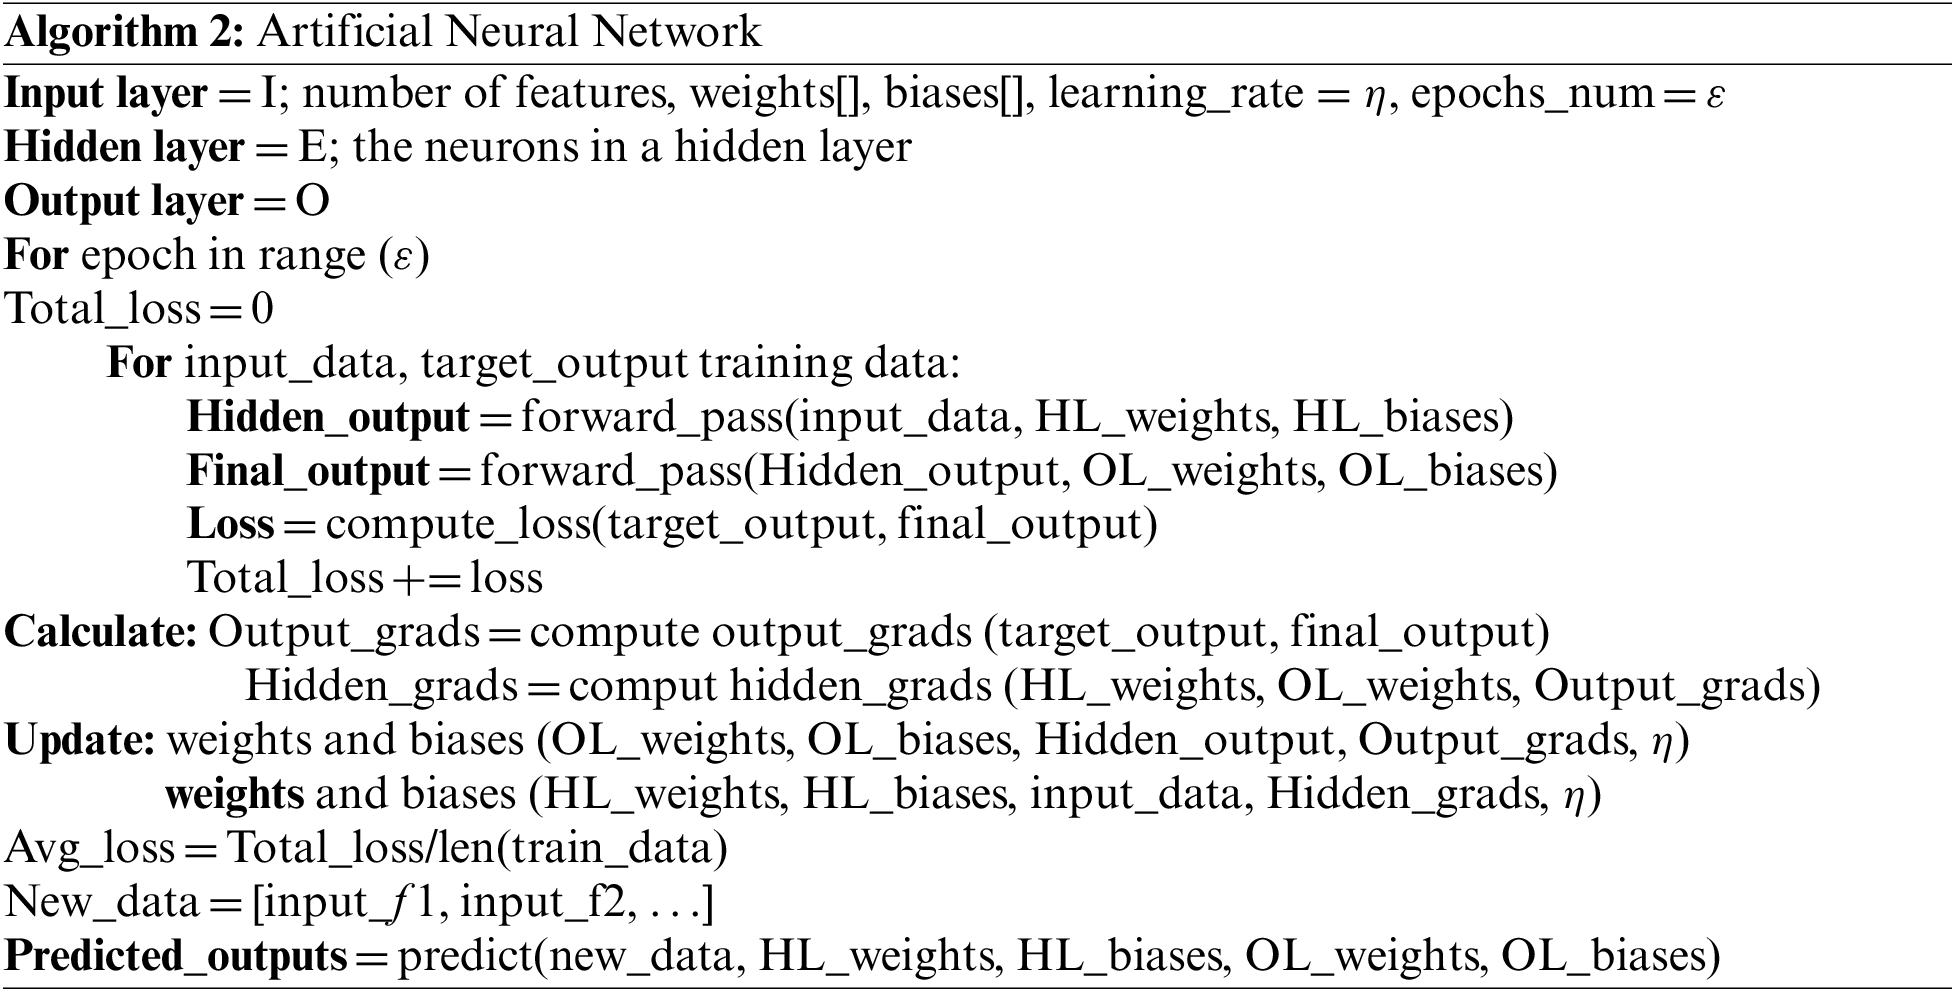
The principle of neurons can be presented as Eqs. (16) and (17).
where “
where “
The study assesses the performance of the suggested system using three datasets for object recognition. It contrasts the proposed system with current object recognition technologies.
4.1.1 Microsoft Common Objects in Context (MS COCO)
To segment and identify objects in images, Microsoft developed the MS COCO dataset [40]. In 330,000 images, there are 2.5 million object instances organized into 80 classes, including zebras, bears, and other typical objects. With significant occurrences of each of the categories, the dataset is utilized to evaluate the recognition tasks.
4.1.2 Microsoft Research in Cambridge (MSRC-v2)
The MSRC-v2 dataset entails 591 high-resolution images [41], 21 different object categories (cow, sheep, grass, tree, horse, car, bicycle, plane, face) as well as one backdrop category [42] and ten distinct classes. Each 213 × 320-pixel image has a different color scheme and context. Due to the complex backgrounds and illumination, the dataset is demanding.
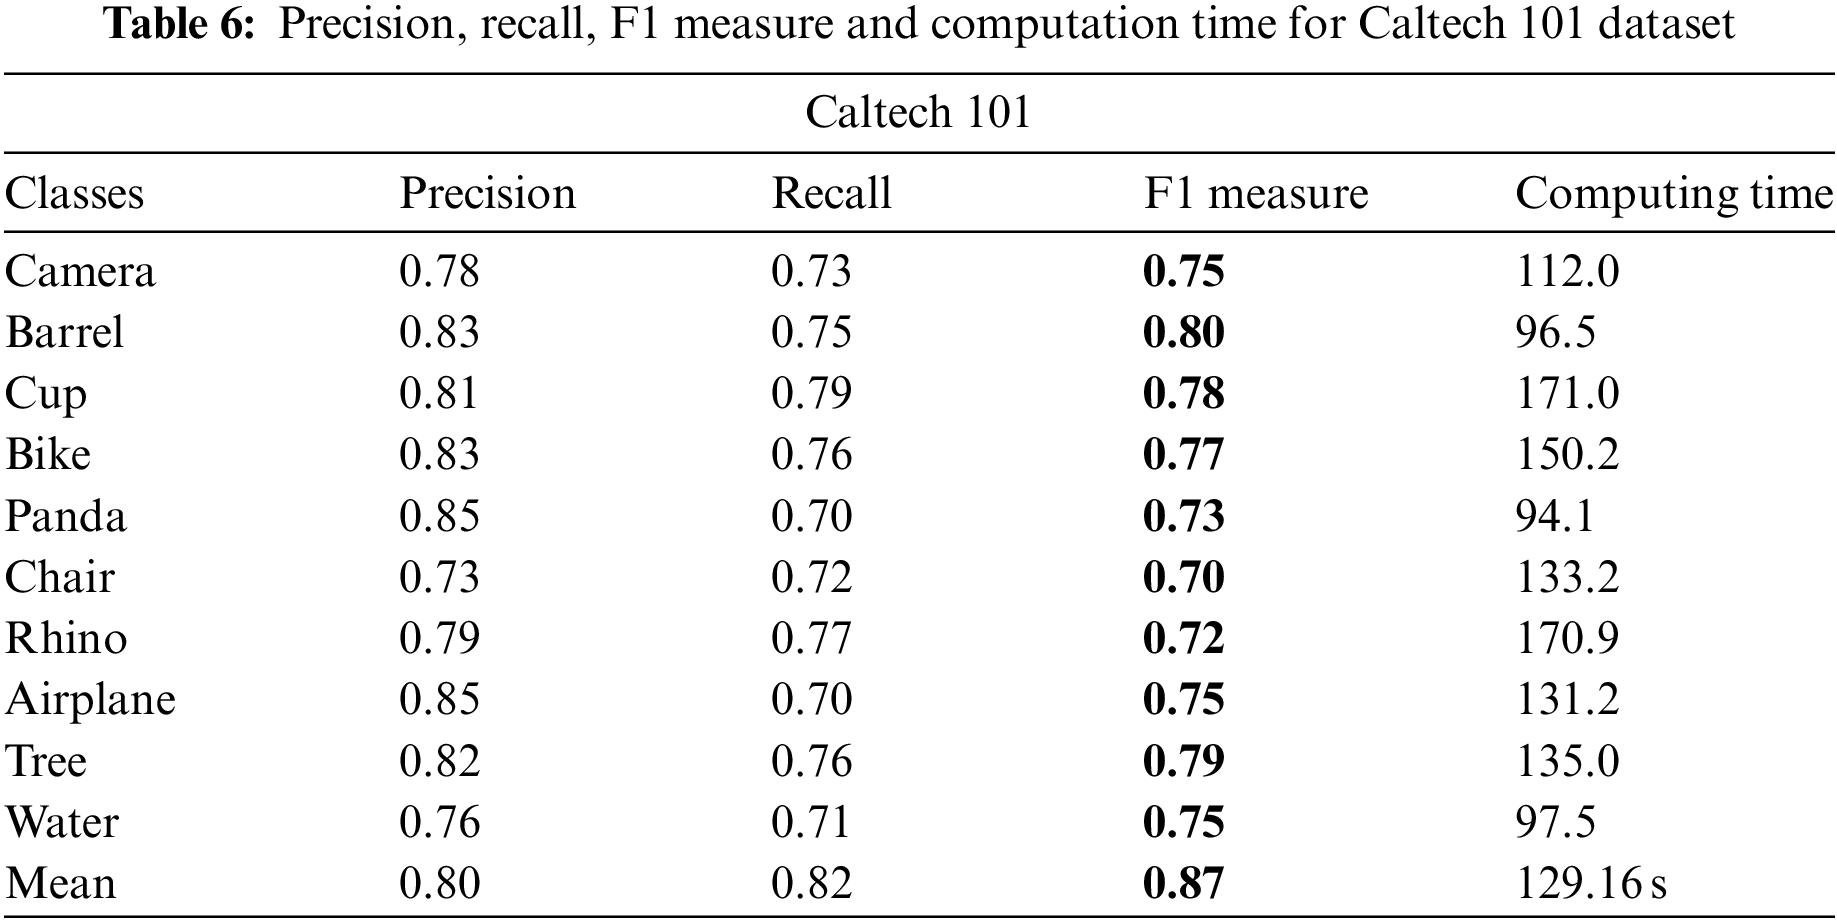
The images included in the Caltech 101 dataset have several categories and are divided into object and background categories. The resolution of individual image is roughly 300 × 200 pixels. Numerous object classes, such as the camera, barrel, cup, bike, panda, chair, rhino, airplane, tree, and water are included in the Caltech 101 dataset.
4.2 Experimentations and Results
Python (3.7) has been employed for training and evaluating the system on an Intel Core i7 PC running 64-bit Windows 10. The machine has 16 GB of RAM (random access memory) and a 5 (GHz) CPU.
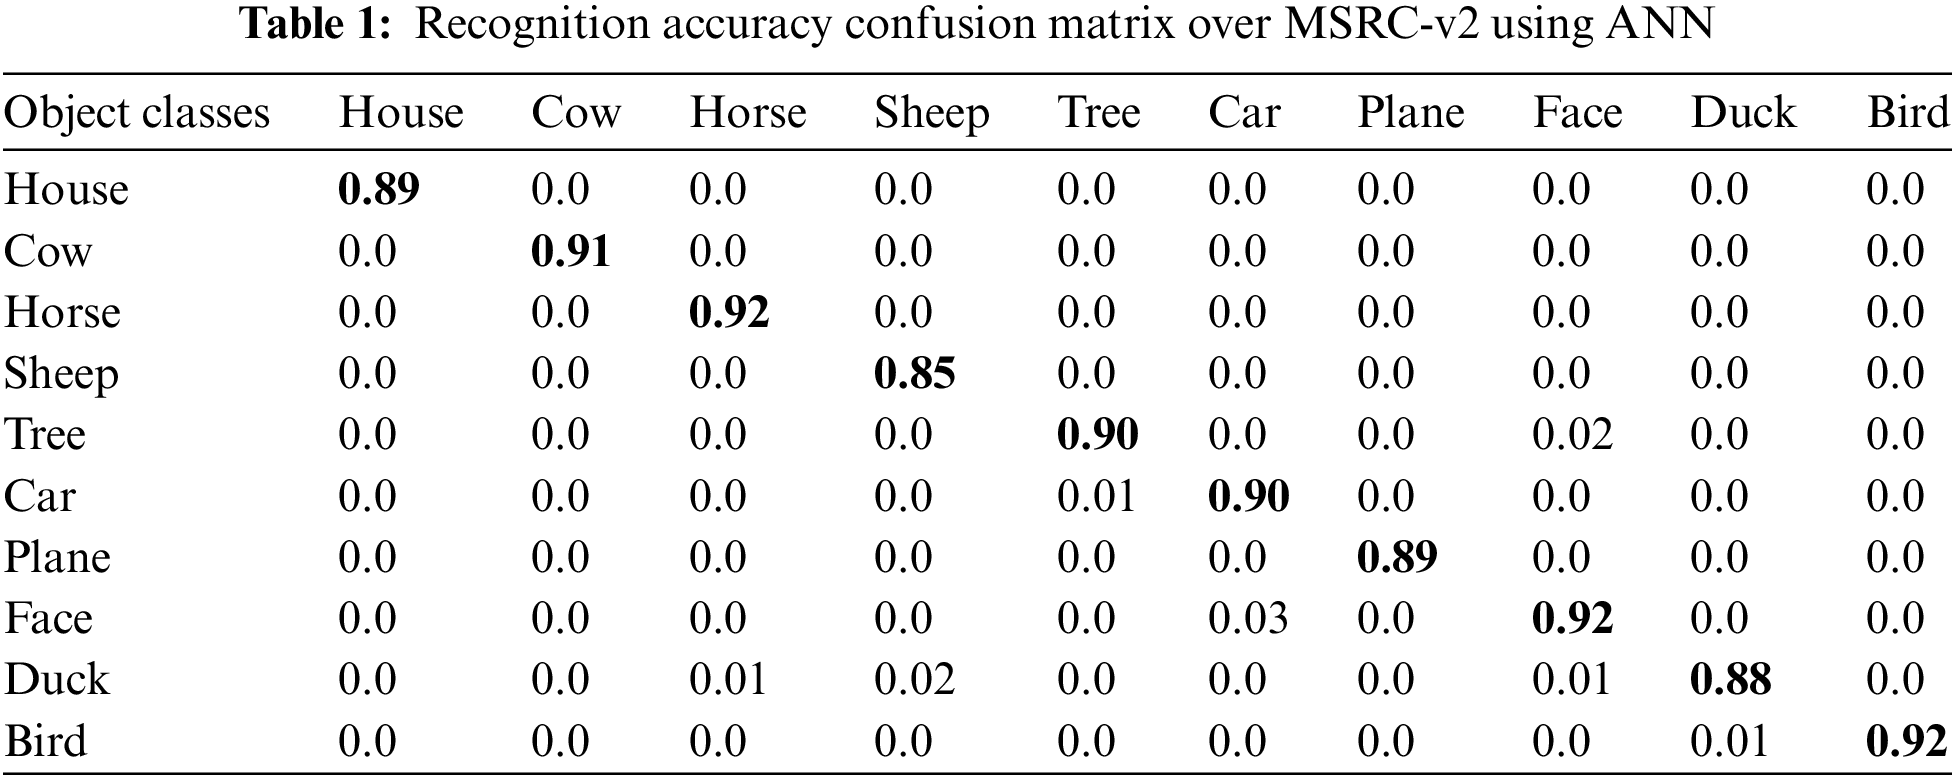
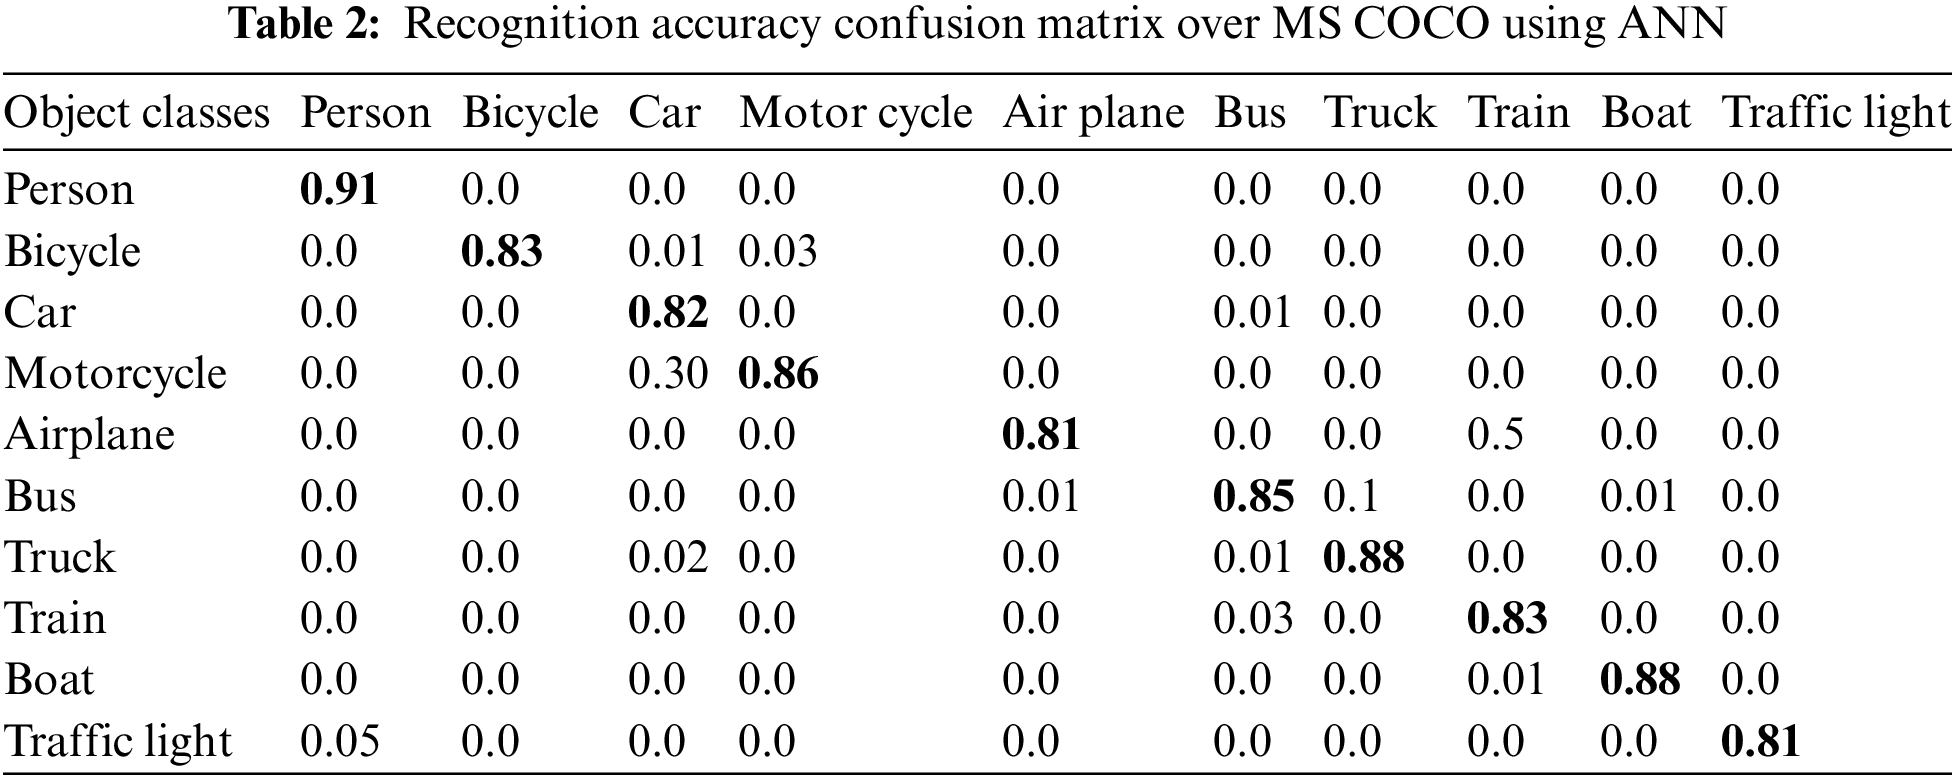
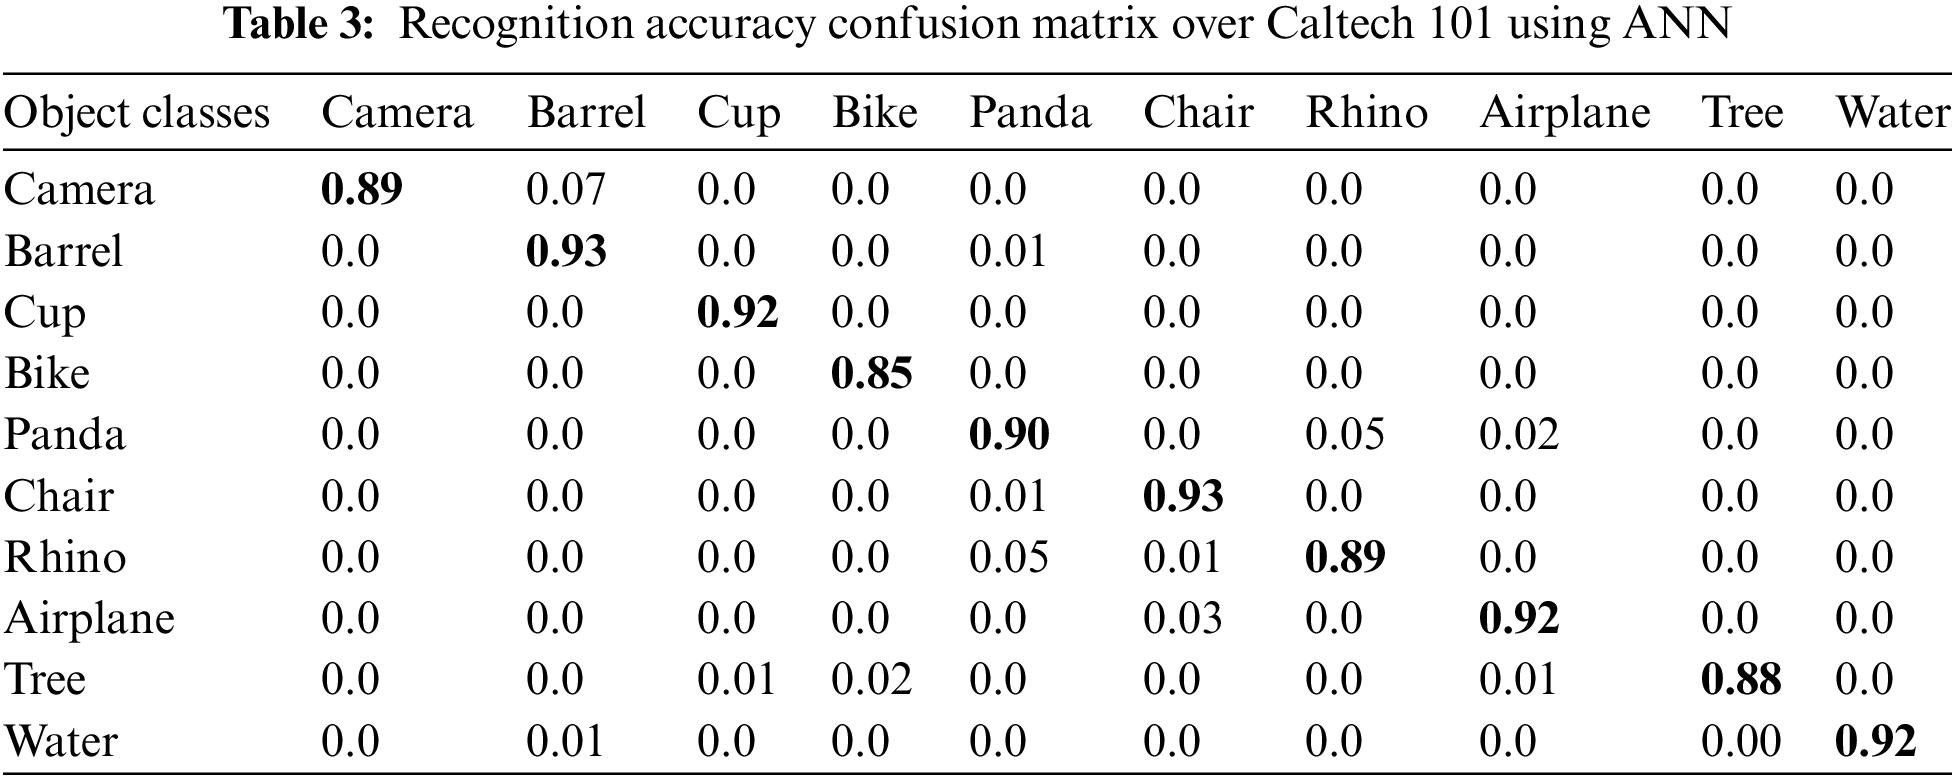
4.2.1 Experimental I: Class Recognition Accuracy
The classification accuracies of the employed datasets by ten arbitrarily selected classes are shown in Table 1 as a confusion matrix. for MSRC-v2, Table 2 as a confusion matrix for MS COCO, and Table 3 as a confusion matrix for Caltech 101.
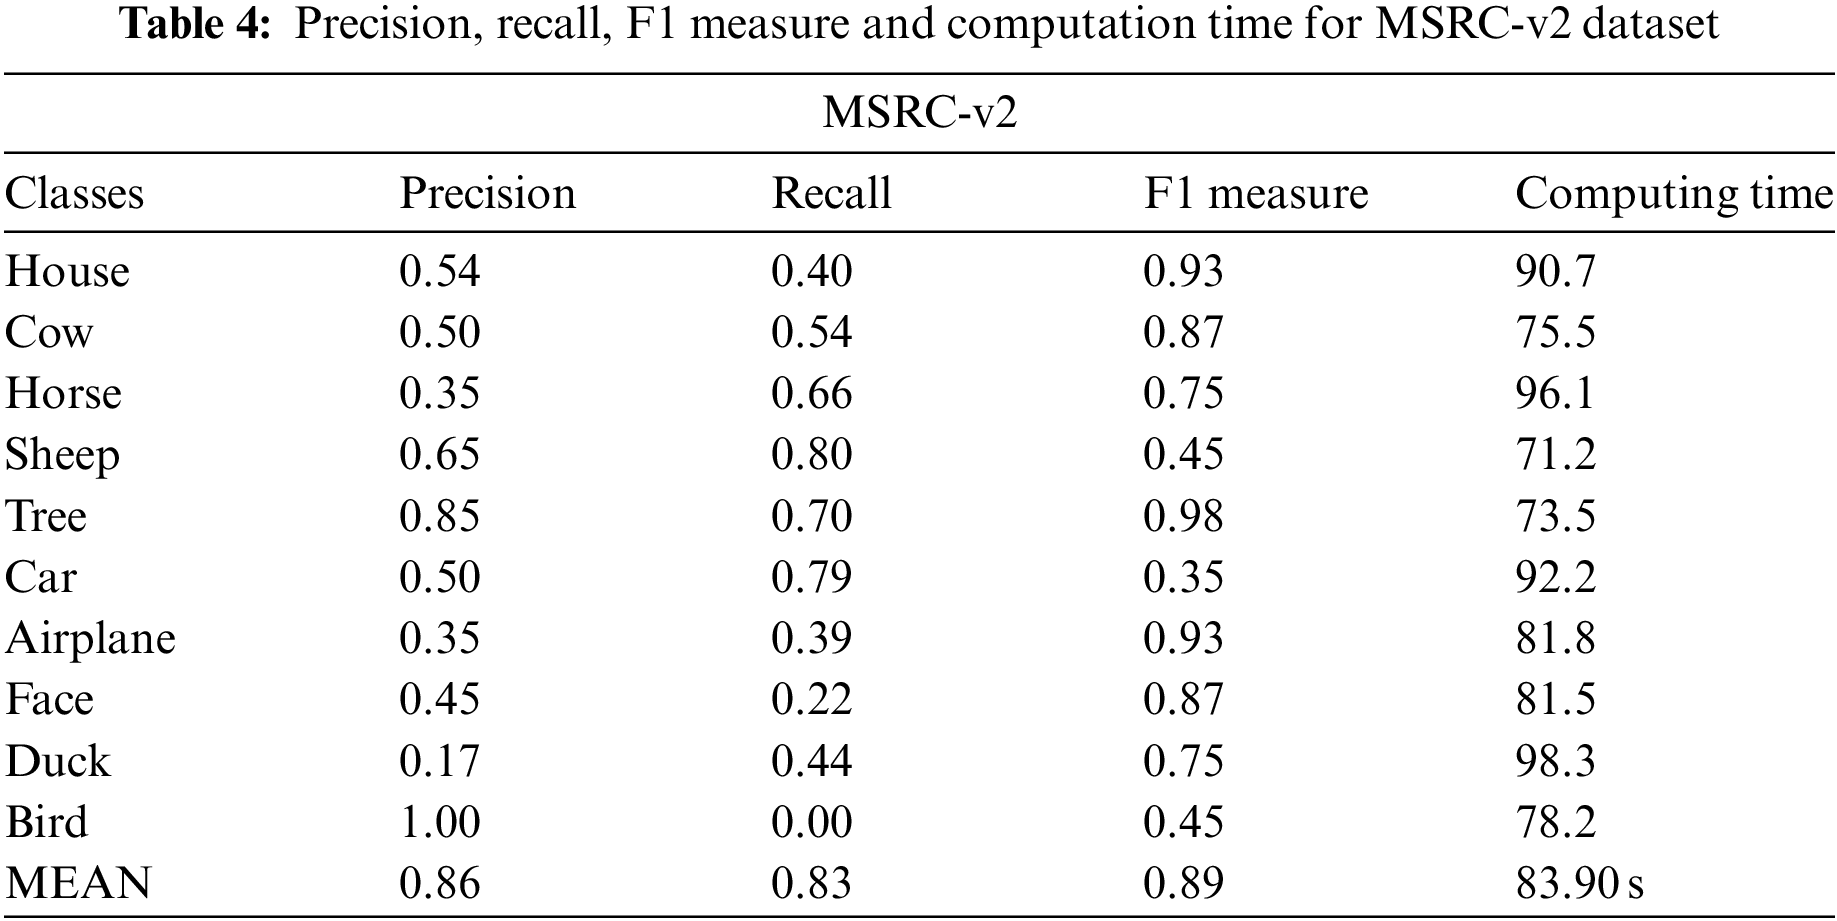
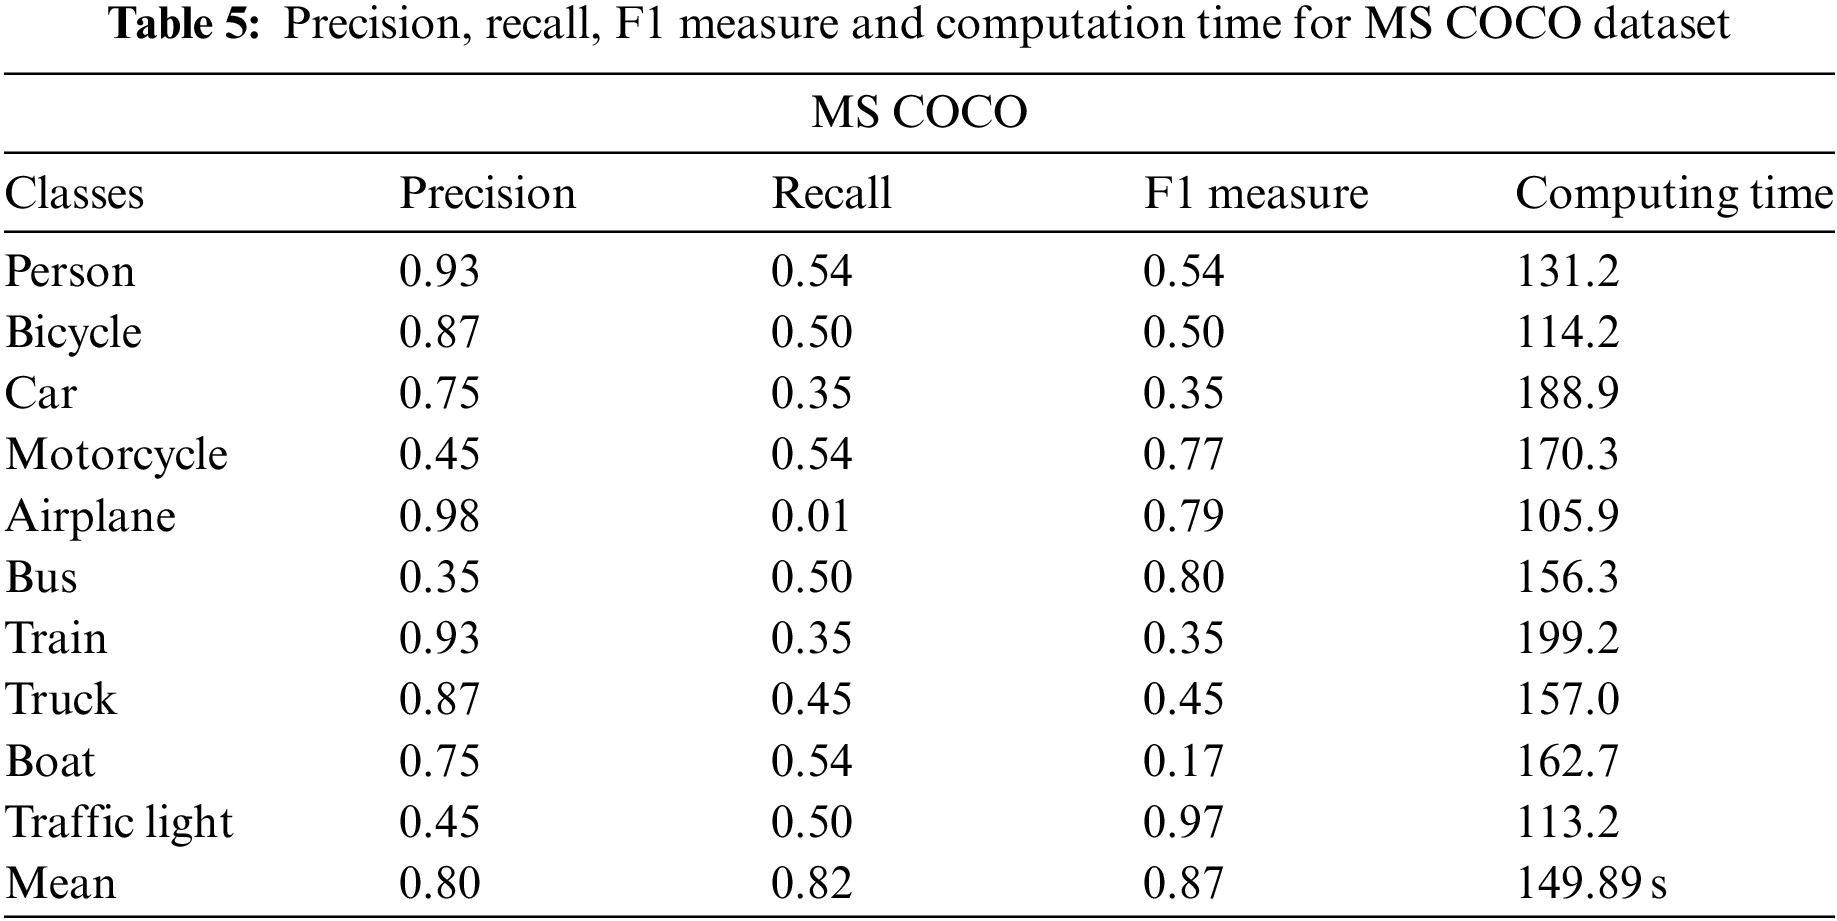
4.2.2 Experimental II: Precision, Sensitivity, and F1 Measure
We report the precision, recall, and F measures for ten randomly selected classes from the datasets in this section. The results demonstrate that the presented recognition system is highly precise at identifying a variety of complicated objects. Eqs. (19)–(21) were used to figure out the precision, recall, and F1 scores for each object class in the datasets.
Tables 4–6 indicate the precision, sensitivity, and F measure using ANN for all datasets, i.e., MSRC-v2, MS COCO, and Caltech 101, respectively, as TP stands for True positive, FP stands for False positive, and FN is for False negative.
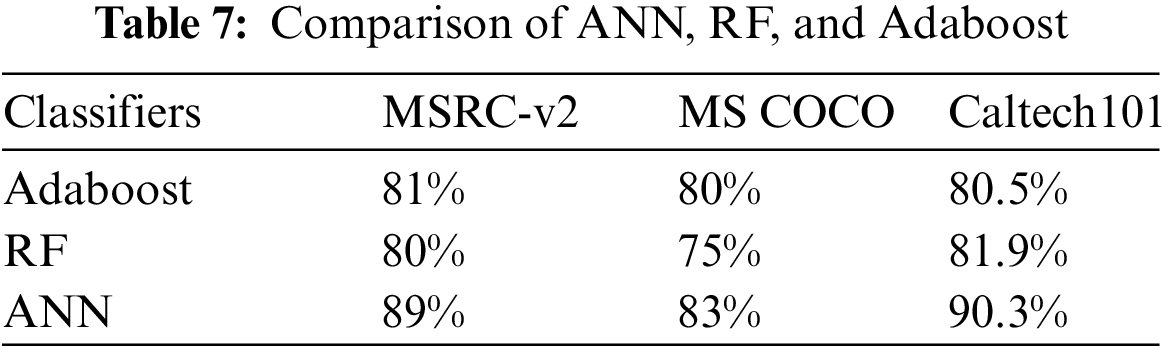
In this paper, the comparison has been made among different classifiers on three datasets, i.e., MS COCO, MSRC-v2, and Caltech 101. Artificial Neural Network gives us better results among all three. Results produced from all three classifiers have been shown below in Table 7.
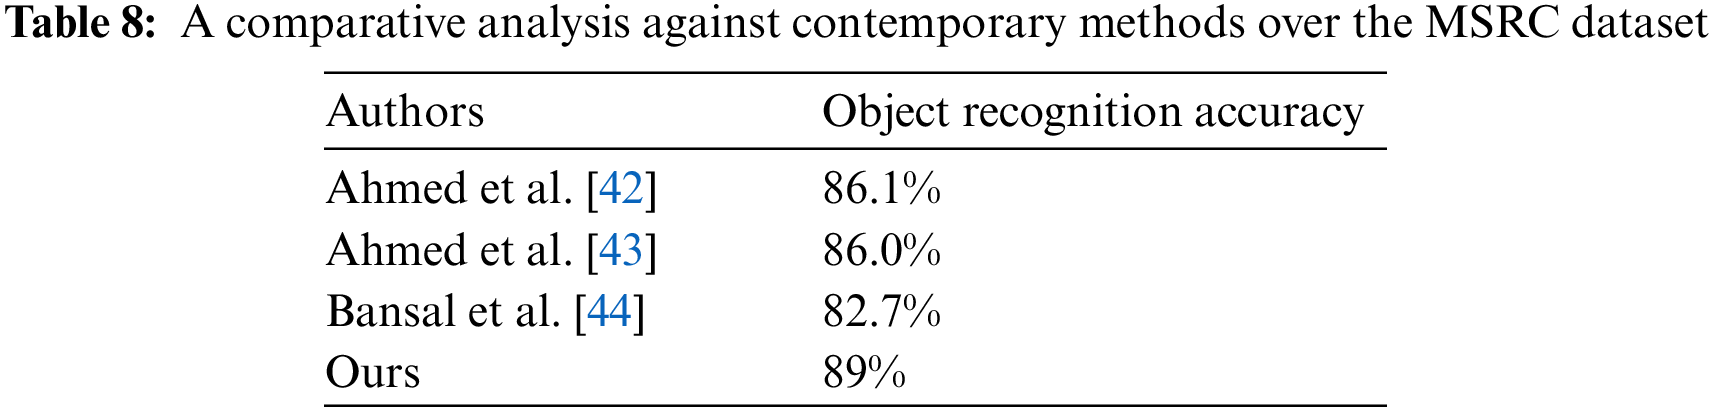
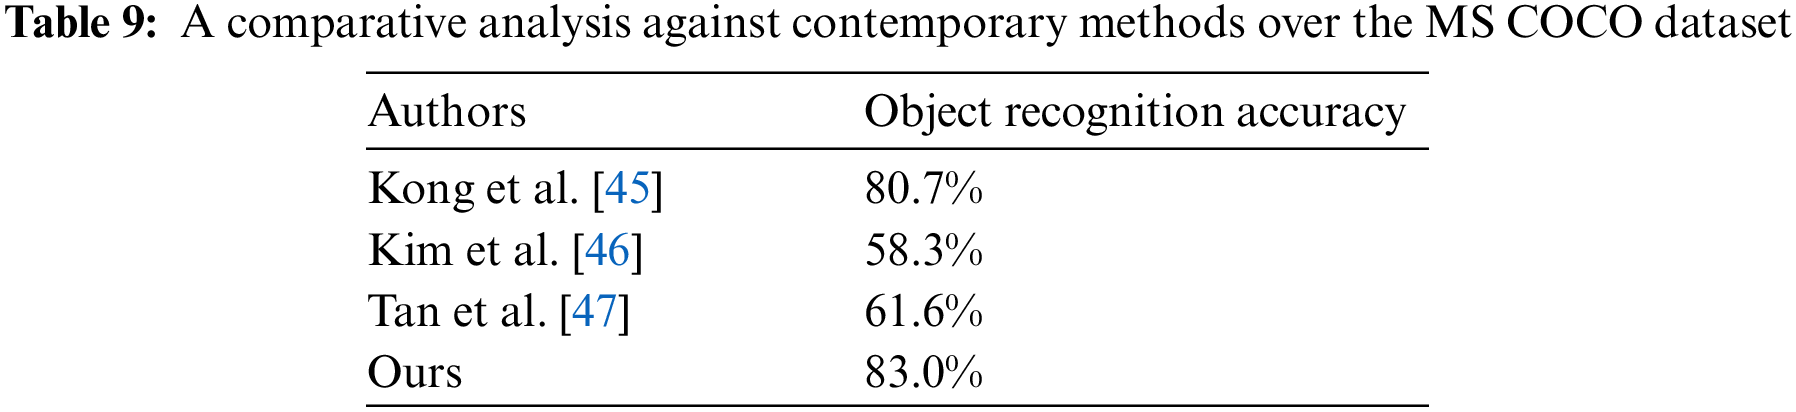
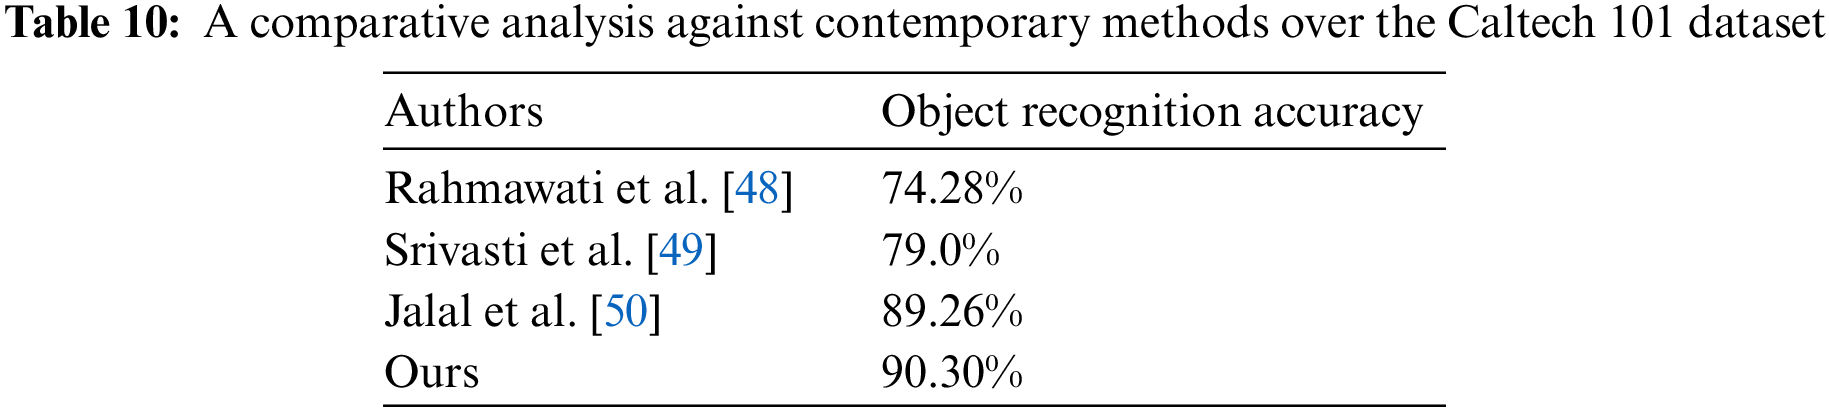
Finally, Tables 8–10 contrast the proposed system’s functionality for object recognition with other state-of-the-art methodologies over the mentioned RGB object datasets.
This study presents a useful technique for identifying intricate real-world objects. RGB images are first normalized and median filtered, and then the targeted objects are segmented using K-means clustering and segmentation jointly called k-region fusion. Then, to extract important details from the segmented objects, ORB and SIFT are fused to extract the key points. Finally, object labeling and recognition are accomplished using an Artificial Neural Network (ANN). Comparative analyses against cutting-edge systems illustrate how better our suggested approach is, highlighting its outstanding performance on object recognition tasks. The proposed solution is intended to work with a variety of real-world applications such as security systems, the medical field, self-driving cars, assisted living, and online learning. Including depth, information improves object segmentation and identification. Depth adds a new dimension, which enhances spatial comprehension. It aids in separating objects at various distances, managing occlusion situations, and lessening the effect on recognition. Segmentation is streamlined by localization in 3D space. To provide an accurate representation, depth-based features are added to RGB data. It improves scene comprehension and resistance to changes in lighting. Effective for dealing with objects without textures. In general, depth integration enhances accuracy in challenging situations.
Acknowledgement: The authors are thankful to Princess Nourah bint Abdulrahman University Researchers Supporting Project, Princess Nourah bint Abdulrahman University, Riyadh, Saudi Arabia.
Funding Statement: This research was supported by the MSIT (Ministry of Science and ICT), Korea, under the ITRC (Information Technology Research Center) Support Program (IITP-2023-2018-0-01426) supervised by the IITP (Institute for Information & Communications Technology Planning & Evaluation). The funding for this work was provided by Princess Nourah bint Abdulrahman University Researchers Supporting Project Number (PNURSP2023R410), Princess Nourah bint Abdulrahman University, Riyadh, Saudi Arabia. The authors are thankful to the Deanship of Scientific Research at Najran University for funding this work under the Research Group Funding Program Grant Code (NU/RG/SERC/12/6).
Author Contributions: Study conception and design: Aysha Naseer, Jeongmin Park, data collection: Nouf Abdullah Almujally; analysis and interpretation of results: Aysha Naseer, Saud S. Alotaidi and Abdulwahab Alazeb; draft manuscript preparation: Aysha Naseer. All authors reviewed the results and approved the final version of the manuscript.
Availability of Data and Materials: All publicly available datasets are used in the study.
Conflicts of Interest: The authors declare that they have no conflicts of interest to report regarding the present study.
References
1. W. Song, Y. Tang, W. Tan and S. Ren, “ISHD: Intelligent standing human detection of video surveillance for the smart examination environment,” Computer Modeling in Engineering & Sciences, vol. 137, no. 1, pp. 509–526, 2023. [Google Scholar]
2. S. Varma and M. Sreeraj, “Object detection and classification in surveillance system,” 2013 IEEE Recent Advances in Intelligent Computational Systems (RAICS), Trivandrum, India, vol. 2013, pp. 299–303, 2013. [Google Scholar]
3. Laghari, A. Ali and S. Yin, “How to collect and interpret medical pictures captured in highly challenging environments that range from nanoscale to hyperspectral imaging,” Current Medical Imaging, vol. 54, pp. 36582065, 2022. [Google Scholar]
4. X. Zhou and L. Zhang, “SA-FPN: An effective feature pyramid network for crowded human detection,” Applied Intelligence, vol. 52, no. 11, pp. 12556–12568, 2022. [Google Scholar]
5. Laghari, A. Ali, S. Shahid, R. Yadav, S. Karim et al., “The state of art and review on video streaming,” Journal of High Speed Networks, vol. 22, no. 3, pp. 1–26, 2023. [Google Scholar]
6. X. Zhang, D. Huang, H. Li, Y. Zhang, Y. Xia et al., “Self-training maximum classifier discrepancy for EEG emotion recognition,” CAAI Transactions on Intelligence Technology, vol. 38, pp. 12174, 2023. [Google Scholar]
7. X. Zhang, S. Wen, L. Yan, J. Feng and Y. Xia, “A hybrid-convolution spatial–temporal recurrent network for traffic flow prediction,” The Computer Journal, vol. 76, pp. 171, 2022. [Google Scholar]
8. M. L. Giger, “Machine learning in medical imaging,” Journal of the American College of Radiology, vol. 15, no. 15, pp. 512–520, 2018. [Google Scholar] [PubMed]
9. S. Park and J. Y. Choi, “Malware detection in self-driving vehicles using machine learning algorithms,” Journal of Advanced Transportation, vol. 2020, pp. 1–9, 2020. [Google Scholar]
10. X. Jiang, Z. Hu, S. Wang and Y. Zhang, “A survey on artificial intelligence in posture recognition,” Computer Modeling in Engineering & Sciences, vol. 137, no. 1, pp. 35–82, 2023. [Google Scholar]
11. R. P. de Lima and K. Marfurt, “Convolutional neural network for remote-sensing scene classification: Transfer learning analysis,” Remote Sensing, vol. 12, no. 1, pp. 86, 2019. [Google Scholar]
12. M. Elhoseny, “Multi-object detection and tracking (MODT) machine learning model for real-time video surveillance systems,” Circuits, Systems and Signal Processing, vol. 39, pp. 611–630, 2020. [Google Scholar]
13. S. Wang, X. Hu, J. Sun and J. Liu, “Hyperspectral anomaly detection using ensemble and robust collaborative representation,” Information Sciences, vol. 624, pp. 748–760, 2022. [Google Scholar]
14. L. Wen, L. Chen, D. Xu and L. V. Gool, “Visual recognition in RGB images and videos by learning from RGB-D data,” IEEE Transactions on Pattern Analysis and Machine Intelligence, vol. 40, no. 8, pp. 2030–2036, 2017. [Google Scholar]
15. G. Ross, J. Donahue, T. Darrell and J. Malik, “Region-based convolutional networks for accurate object detection and segmentation,” IEEE Transactions on Pattern Analysis and Machine Intelligence, vol. 38, pp. 142–158, 2015. [Google Scholar]
16. M. Chaturvedi, M. Kaur, N. Rakesh and P. Nand, “Object recognition using image segmentation,” in Proc of 6th Int. Conf. of Parallel, Distributed and Grid Computing, Solan, India, pp. 550–556, 2020. [Google Scholar]
17. W. Li and P. Dong, “Object recognition based on the region of interest and optimal bag of words model,” Neurocomputing, vol. 172, pp. 271–280, 2016. [Google Scholar]
18. S. Deshmukh and S. Moh, “Fine object detection in automated solar panel layout generation,” in Proc. of 17th IEEE Int. Conf. of Machine Learning and Applications, Florida, USA, pp. 1402–1407, 2019. [Google Scholar]
19. G. Lin, Y. Tang, X. Zou, J. Xiong, Y. Fang et al., “Color-, depth-, and shape-based 3D fruit detection,” Remote Sensing, vol. 21, pp. 1–17, 2020. [Google Scholar]
20. R. Cupec, D. Filko, I. Vidović, E. K. Nyarko, Ž. Hocenski et al., “Point cloud segmentation to approximately convex surfaces for fruit recognition,” in Proc. of the Croatian Computer Vision Workshop, Zargeb, Croatia, pp. 56–61, 2014. [Google Scholar]
21. A. Ahmed, A. Jalal and K. Kim, “RGB-D images for object segmentation, localization and recognition in indoor scenes using feature descriptor and hough voting,” in Proc. of IEEE17th Int. Bhurban Conf. on Applied Sciences and Technology, Bhurban, Pakistan, pp. 290–295, 2019. [Google Scholar]
22. D. Maheswari and V. Radha, “Noise removal in compound image using median filter,” Computer Science and Engineering, vol. 2, no. 4, pp. 1359–1362, 2010. [Google Scholar]
23. Y. K. Chen, S. H. Zu, Y. F. Wang and X. H. Chen, “Deblending of simultaneous source data using a structure-oriented space-varying median filter,” Geophysical Journal International, vol. 222, no. 3, pp. 1805–1823, 2020. [Google Scholar]
24. A. Castro, Ery and D. L. Donoho, “Does median filtering truly preserve edges better than linear filtering?” vol. 37, no. 3, pp. 1172–1206, 2009. [Google Scholar]
25. K. P. Sinaga and M. S. Yang, “Unsupervised K-means clustering algorithm,” IEEE Access, vol. 8, pp. 80716–80727, 2020. [Google Scholar]
26. Y. Yang and G. Sheng, “Research on Chinese synergies based on K-means clustering algorithm and correspondence analysis,” in Proc.of IEEE Conf. on Telecommunications, Optics and Computer Science (TOCS), Henan, China, pp. 387–390, 2022. [Google Scholar]
27. M. Niazi, K. Rahbar, M. Sheikhan and M. Khademi, “Entropy-based kernel graph cut with weighted K-means for textural image region segmentation,” Signal Processing and Renewable Energy, vol. 7, no. 3, pp. 13–29, 2023. [Google Scholar]
28. M. Patel, S. Patel and S. Patel, “Data analysis in shopping mall data using K-means clusterin,” in 2022 4th Int. Conf. on Advances in Computing, Communication Control and Networking (ICAC3N), Greater Noida, India, pp. 349–352, 2022. [Google Scholar]
29. Z. Huda, B. Peng, Y. Yang and A. Algburi, “Object scale selection of hierarchical image segmentation with deep seeds,” Image Processing, vol. 15, no. 1, pp. 191–205, 2021. [Google Scholar]
30. B. R. Chughtai and A. Jalal, “Object detection and segmentation for scene understanding via random forest,” in Proc. of 4th Int. Conf. on Advancements in Computational Sciences (ICACS), Lahore, Pakistan, pp. 1–6, 2023. [Google Scholar]
31. M. R. Satpute and S. M. Jagdale, “Color, size, volume, shape and texture feature extraction techniques for fruits: A review,” International Research Journal of Engineering and Technology, vol. 3, pp. 703–708, 2016. [Google Scholar]
32. J. C. Kavitha and A. Suruliandi, “Texture and color feature extraction for classification of melanoma using SVM,” in Int. Conf. on Computing Technologies and Intelligent Data Engineering, Kovilpatti, India, pp. 1–6, 2016. [Google Scholar]
33. F. Siddiqui, S. Zafar, S. Khan and N. Iftekhar, “Computer vision analysis of BRIEF and ORB feature detection algorithms,”in Proc.of Int. Conf. on Computing in Engineering & Technology, Singapore, Springer Nature Singapore, pp. 425–433, 2023. [Google Scholar]
34. M. Bansal, M. Kumar and M. Kumar, “2D object recognition: A comparative analysis of SIFT, SURF and ORB feature descriptors,” Multimedia Tools and Applications, vol. 80, pp. 18839–18857, 2021. [Google Scholar]
35. S. Gupta, M. Kumar and A. Garg, “Improved object recognition results using SIFT and ORB feature detector,” Multimedia Tools and Applications, vol. 78, pp. 34157–34171, 2019. [Google Scholar]
36. P. Chhabra, K. Garg and M. Kumar, “Content-based image retrieval system using ORB and SIFT features,” Neural Computing and Application, vol. 32, pp. 2725–2733, 2020. [Google Scholar]
37. M. Sharma, H. Singh, S. Singh, A. Gupta, S. Goyal et al., “A novel approach of object detection using point feature matching technique for colored images,” in Proc. of ICRIC Recent Innovations in Computing, Springer International Publishing, Jammu and Kashmir, India, pp. 561–576, 2019. [Google Scholar]
38. N. M. Trieu and N. T. Thinh, “A study of combining knn and ann for classifying dragon fruits automatically,” Journal of Image and Graphics, vol. 10, no. 1, pp. 28–35, 2022. [Google Scholar]
39. Y. Y. Ghadi, A. A. Rafique, T. Al Shloul, S. Alsuhibany, A. Jalal et al., “Robust object categorization and scene classification over remote sensing images via features fusion and fully convolutional network,” Remote Sensing, vol. 14, no. 7, pp. 1550, 2022. [Google Scholar]
40. T. Lin, M. Maire, S. Belongie, L. Bourdev, R. Girshick et al., “Microsoft common object in context,” Computer Vision, vol. 13, no. 5, pp. 740–755, 2014. [Google Scholar]
41. K. Zhang, Y. Wu, M. Dong, B. Liu, D. Liu et al., “Deep object co-segmentation and co-saliency detection via high-order spatial-semantic network modulation,” IEEE Transactions on Multimedia, vol. 25, pp. 5773–5746, 2022. [Google Scholar]
42. A. Ahmed and A. Jalal, “Salient segmentation based object detection and recognition using hybrid genetic transform,” in Proc of IEEE Int. Conf. on Applied and Engineering Mathematics, Taxila, Pakistan, pp. 203–208, 2019. [Google Scholar]
43. A. Ahmed, A. Jalal and K. Kim, “RGB-D images for object segmentation, localization and recognition in indoor scenes using feature descriptor and hough voting,” in Proc of 17th Int. Bhurban Conf. Application of Science and Technologies, Bhurban, Pakistan, pp. 290–295, 2020. [Google Scholar]
44. M. Bansal, M. Kumar, M. Kumar and K. Kumar, “An efficient technique for object recognition using Shi-Tomasi corner detection algorithm,” Soft Computing, vol. 25, pp. 4423–4432, 2021. [Google Scholar]
45. T. Kong, F. Sun, A. Yao, H. Liu, M. Lu et al., “RON: Reverse connection with objectness prior networks for object detection,” in Proc. of the IEEE Conf. on Computer Vision and Pattern Recognition, Honolulu, HI, USA, pp. 5936–5944, 2017. [Google Scholar]
46. J. U. Kim and Y. Man Ro, “Attentive layer separation for object classification and object localization in object detection,” in IEEE Int. Conf. on Image Processing, Taipei, Taiwan, pp. 3995–3999, 2019. [Google Scholar]
47. Z. Tan, X. Nie, Q. Qian, N. Li and H. Li, “Learning to rank proposals for object detection,” in Proc. of the IEEE/CVF Int. Conf. on Computer Vision, Seoul, South Korea, pp. 8273–8281, 2019. [Google Scholar]
48. S. Rahmawati, R. Devita, R. Zain, E. Rianti, N. Lubis et al., “Prewitt and canny methods on inversion image edge detection: An evaluation,” Journal of Physics: Conference Series, vol. 1933, pp. 012039, 2021. [Google Scholar]
49. D. Srivastava, R. Bakthula and S. Agarwal, “Image classification using SURF and a bag of LBP features constructed by clustering with fixed centers,” Multimedia Tools and Applications, vol. 78, no. 11, pp. 14129–14153, 2019. [Google Scholar]
50. A. Jalal, A. Ahmed, A. A. Rafique and K. Kim, “Scene semantic recognition based on modified fuzzy C-mean and maximum entropy using object-to-object relations,” IEEE Access, vol. 9, pp. 27758–27772, 2021. [Google Scholar]
Cite This Article
 Copyright © 2024 The Author(s). Published by Tech Science Press.
This work is licensed under a Creative Commons Attribution 4.0 International License , which permits unrestricted use, distribution, and reproduction in any medium, provided the original work is properly cited.
 Downloads
 Citation Tools